English
 Lietuvių
 Русский
 Қазақша
22.–28. detsember 2025: nädala majandusülevaade
Peamised turuülevaated

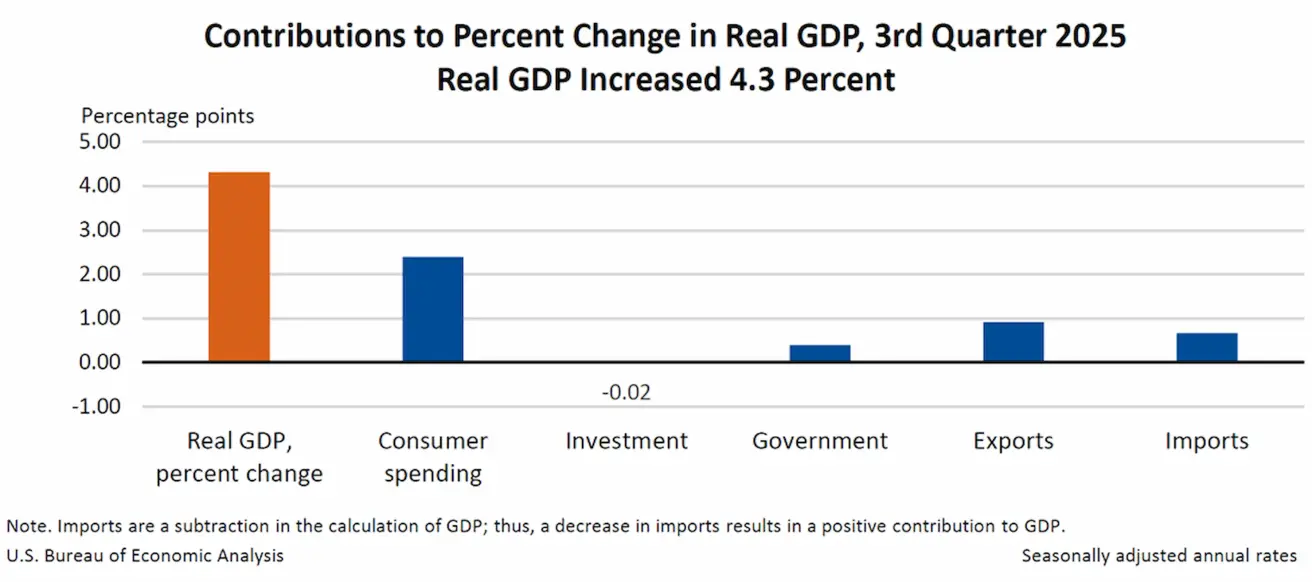
Möödunud nädalal püsis turu sentiment positiivne, mida toetasid makromajandusnäitajad. USA SKP kasv ületas ootusi ja jõudis kahe viimase aasta kõrgeima tasemeni, +4,3%ni, mis omakorda vähendas 25 baaspunkti suuruse jaanuarikuu intressimäära langetamise tõenäosust 19,4%ni.
Reaalse SKP kasv kolmandas kvartalis peegeldas suuremaid tarbimiskulusid, eksporti ja valitsussektori kulutusi, mida osaliselt tasakaalustas investeeringute vähenemine. Kasvu toetasid ka kaubanduspoliitiliste pingete leevenemine ja tariifide vähendamine.
Andmed näitasid ka tööturu paranemist. Erasektori hõive kasvab juba kolmandat nädalat järjest, keskmiselt 11 500 töökohta nädalas. Esmaste töötu abiraha taotluste arv Ameerika Ühendriikides vähenes 10 000 võrra.
Makromajandusstatistika
INFLATSIOON: TARBIJAHINNAINDEKS (SEPTEMBER):
- Põhiinflatsioon (Core CPI): (k/k) 0,2% (varem: 0,3%); (a/a) 2,6% (varem: 3,0%).
- CPI: (k/k) 0,3% (varem: 0,4%); (a/a) 2,7% (varem: 3,0%).
TOOTJAHINNAINDEKS (SEPTEMBER):
- PPI (k/k): 0,3%, varem: -0,1%.
- Põhi-PPI (k/k): 0,1%, varem: -0,1%.
INFLATSIOONIOOTUSED (MICHIGAN) (DETSEMBER):
- 12 kuu inflatsiooniootus: 4,1%, varem: 4,5%;
- 5 aasta inflatsiooniootus: 3,2%, varem: 3,4%.
Põhitarbimiskulutuste hinnaindeks (Core Personal Consumption Expenditures Price Index, september) (Föderaalreservi eelistatud inflatsioonimõõdik):
- (k/k): 0,2%, varem: 0,2%; (a/a): 2,8%, varem: 2,9%. SKP (U.S. Bureau of Economic Analysis, BEA) (III kv 2025, annualiseeritud, esialgne hinnang): +4,3% (II kv 2025: +3,8%).

Atlanta Föderaalreservi panga GDPNow näitaja (IV kv): 3,9% (varem: 3,5%).
(GDPNow prognoosimudel annab ametlikule näitajale enne avaldamist “jooksvat” hinnangut, kasutades SKP kasvu hindamiseks metoodikat, mis on sarnane USA Majandusanalüüsi Büroo kasutatavaga.)
Äritegevuse indeks (PMI) (detsember):
(Üle 50 viitab laienemisele, alla 50 kahanemisele)
- Teenindussektor: 52,9 (varem: 54,1);
- Tööstussektor: 51,8 (varem: 52,2);
- S&P Global Composite: 53,0 (varem: 54,2).
TÖÖTURG (BLS) (november)
Tööturu andmed ületasid ootusi mitme näitaja osas:
- Tööpuuduse määr: 4,6% (varem: 4,4%);
- Töötutoetust saavate isikute koguarv USA-s: 1 923K (varem: 1 885K, täpsustatud);
- Esmased töötu abiraha taotlused: 214K (varem: 224K);
- Põllumajandusväliste töökohtade muutus: 64K (varem: -105K);
- Erasektori põllumajandusväliste töökohtade muutus: 69K (varem: -52K);
- Tunnipalkade keskmine kasv (a/a): 3,5% (varem: 3,7%);
- Vabade töökohtade arv (JOLTS): — (varem: 7,227M).
RAHAPOLIITIKA
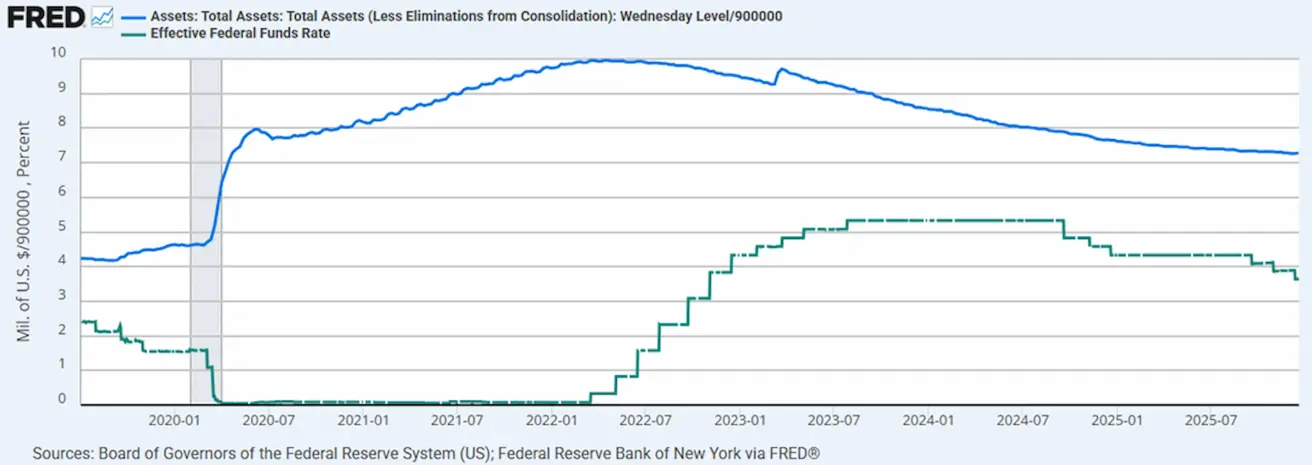
- Föderaalfondide efektiivne intressimäär (EFFR): 3,50%–3,75%;
- Föderaalreservi bilanss: 6,5568 triljonit dollarit, +0,33% alates QT peatamisest (6,535 triljonit dollarit).
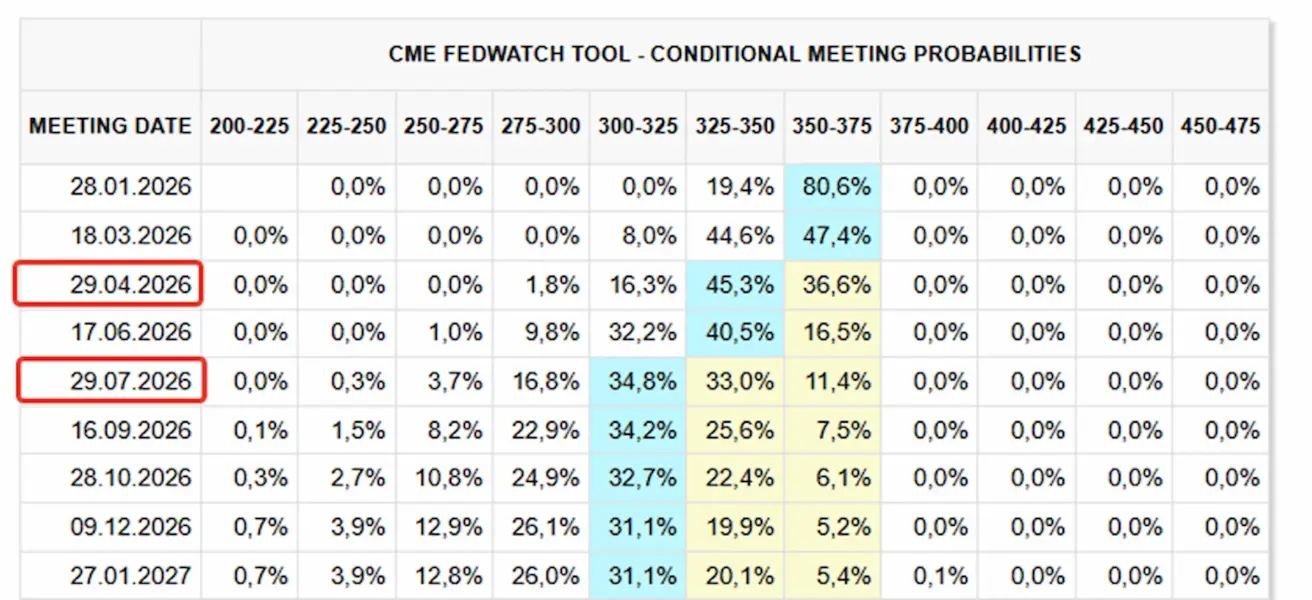
TURU OOTUSED INTRESSIMÄÄRALE (FEDWATCH)
Järgmise kohtumise (28. jaanuar) puhul on 0,25% intressimäära kärpe implitsiitne tõenäosus 19,4%.
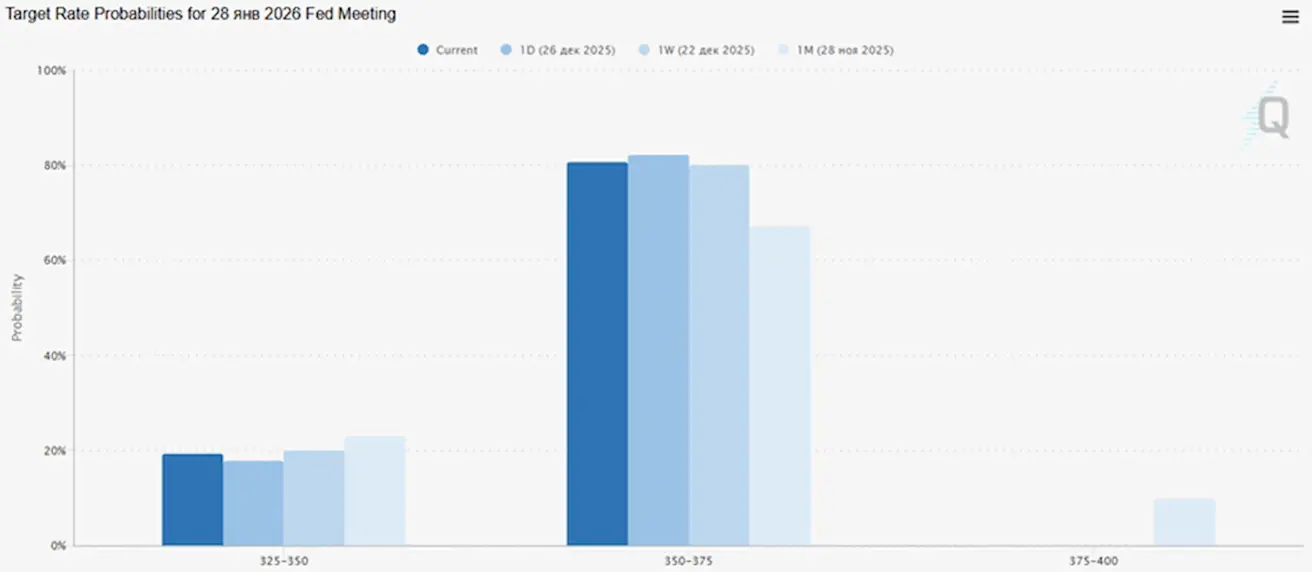
Järgmise 12 kuu jooksul: kaks 0,25% intressimäära kärbet, millega sihtvahemik langeks tasemele 3,00%–3,25%.
Täna:
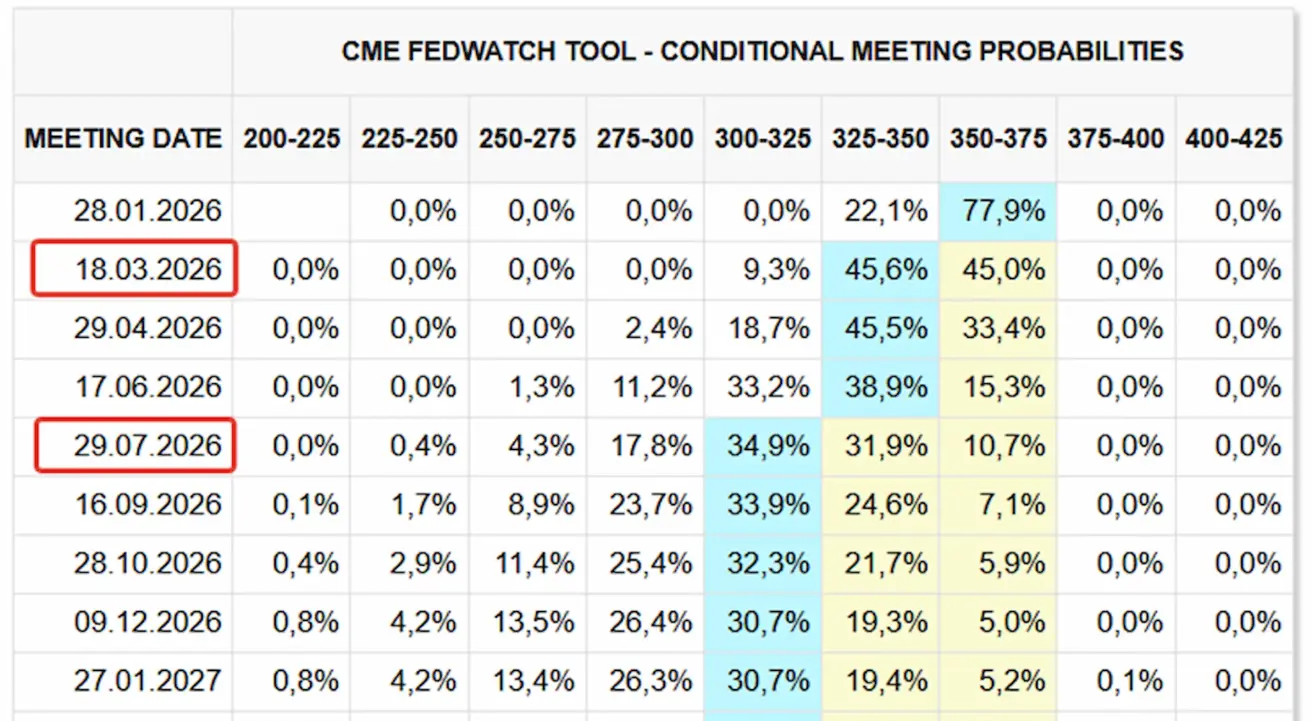
Nädal varem:
Turg
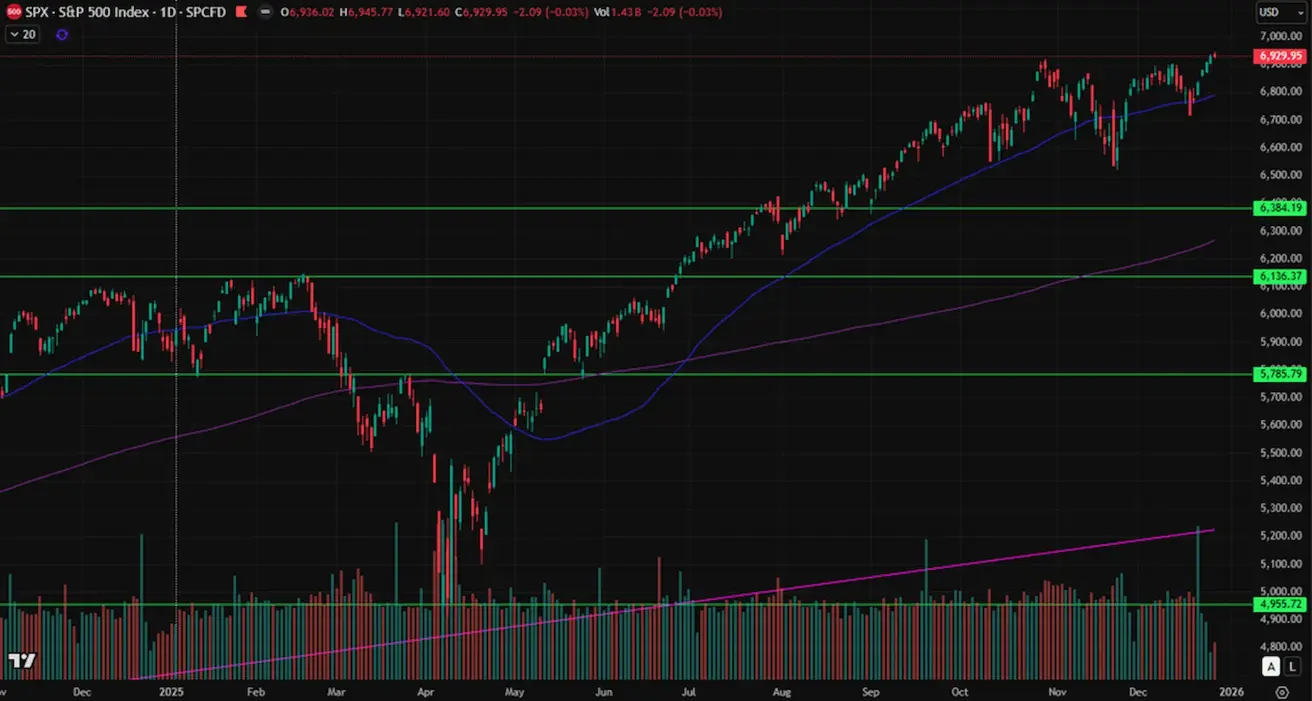
SP500
Nädala tootlus: +1,35% (nädala sulgemistase: 6 929,95) ja +17,34% alates 2025. aasta algusest. Reedel jõudis indeks uue kõigi aegade tipuni, 6 945 punktini.
NASDAQ100
Nädala tootlus: +1,18% (nädala sulgemistase: 25 644,39). Aasta algusest tootlus: +21,42%.

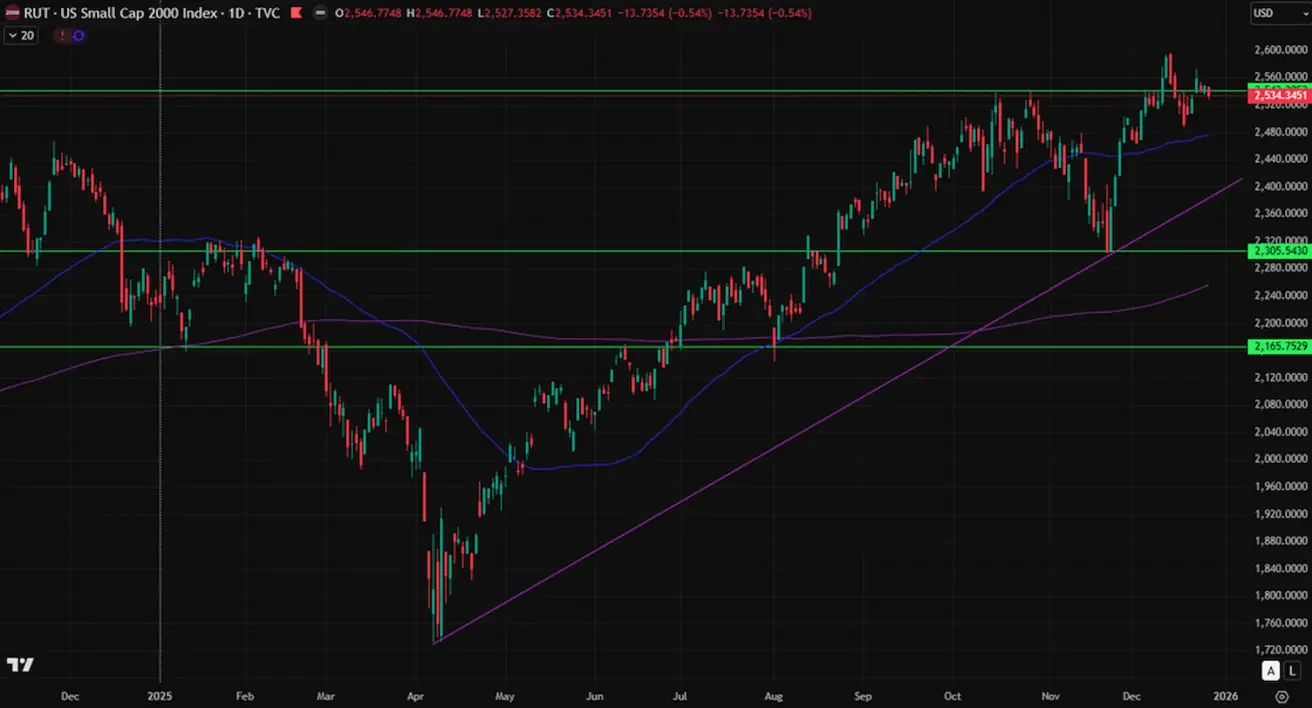
RUSSEL 2000 (RUT)
Nädala tootlus: +0,19% (nädala sulgemistase: 2 534,34). Aasta algusest: +13,08%.
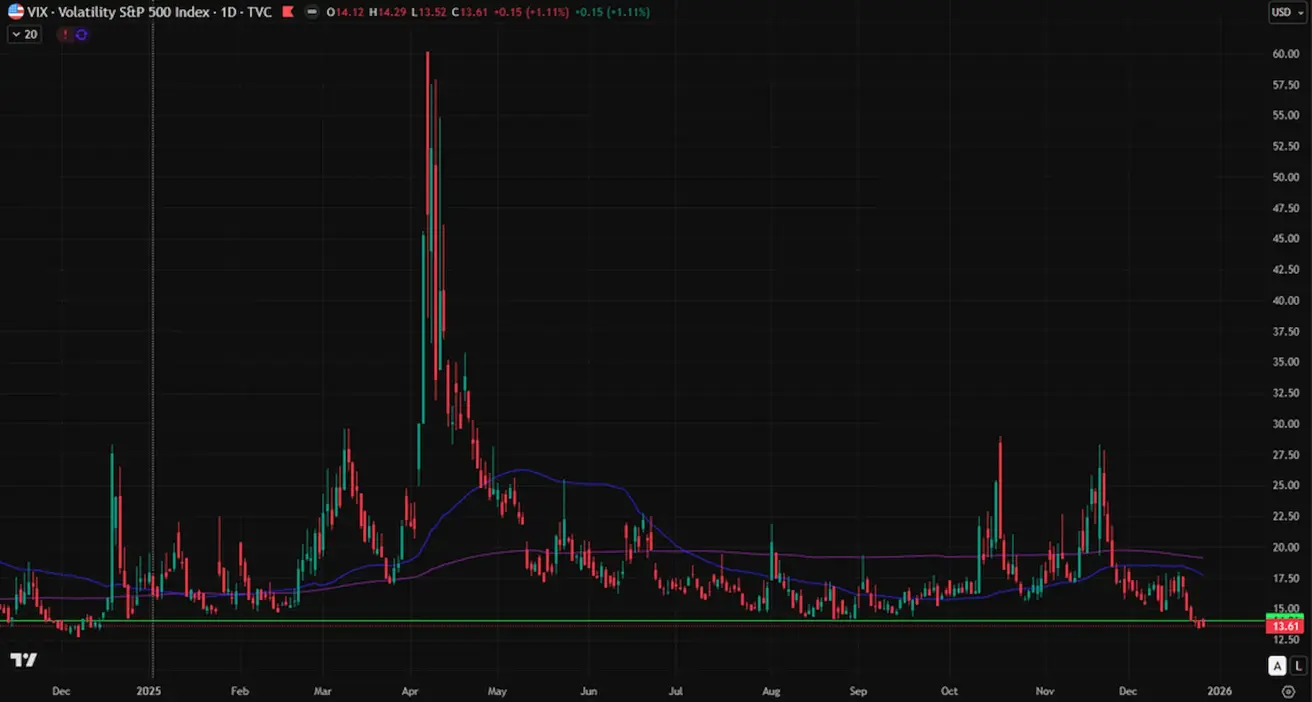
VIX
VIX (volatiilsusindeks) langes aasta madalaimale tasemele, lõpetades nädala 13,61 punkti juures. Turul täna hirmu ei ole.
Euroala
Intressimäärad:
- Hoiustamisfaciliteedi intressimäär: 2,0% (varem: 2,0%);
- Laenufaciliteedi marginaalintressimäär: 2,4% (varem: 2,4%) (määr, millega pangad saavad üleöö keskpangast laenata);
- Lühiajaline (põhi) rahapoliitiline intressimäär: 2,15% (varem: 2,15%).
Inflatsioon: tarbijahinnaindeks (CPI) (november):
- Põhiinflatsioon (Core CPI, a/a): 2,4% (varem: 2,4%);
- CPI: (k/k) -0,3% (varem: 0,2%); (a/a) 2,1% (varem: 2,2%).
SKP (III kv, lõplik):
- k/k: 0,3% (varem: 0,1%);
- a/a: 1,4% (varem: 1,5%).
Tööpuuduse määr (oktoober): 6,4% (varem: 6,3%).
Ostujuhtide indeks (PMI) (detsember):
- Teenindussektor: 52,6 (varem: 53,6);
- Tööstussektor: 49,2 (varem: 49,6);
- S&P Global Composite: 51,9 (varem: 52,8).
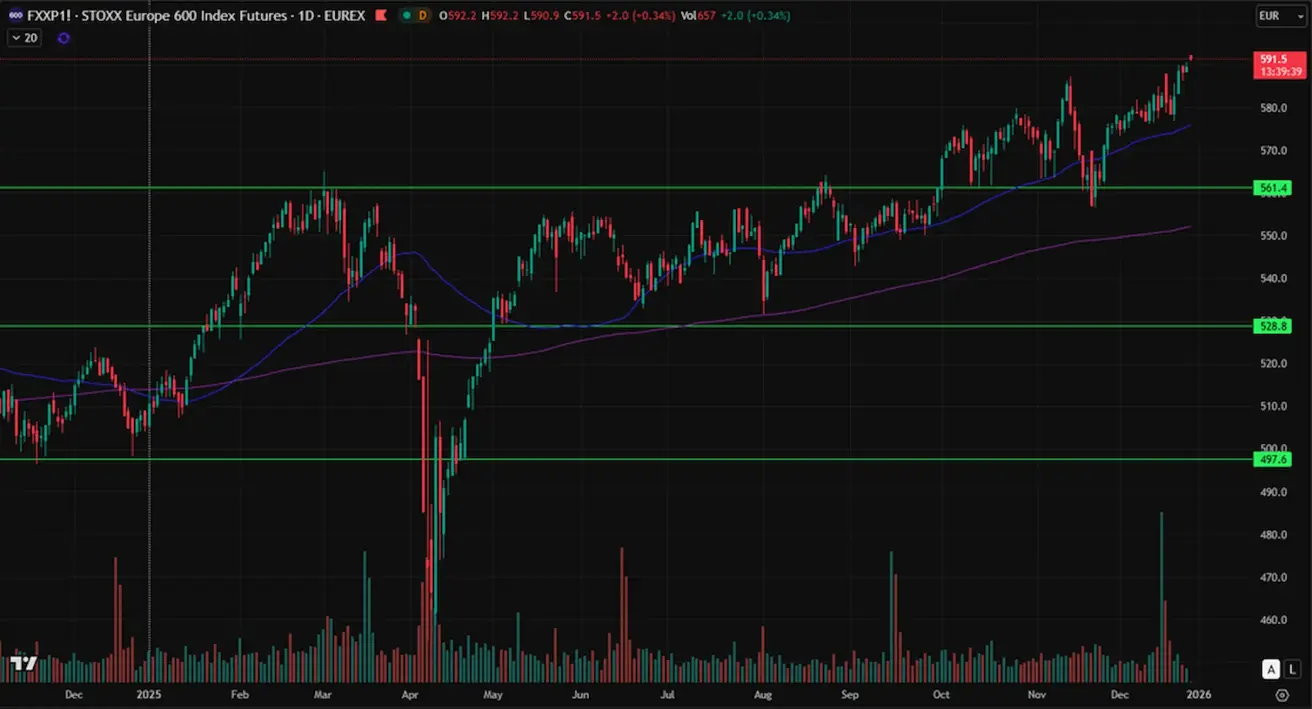
EURO STOXX 600
Pärast pühi avanes Euro Stoxx 600 kõigi aegade kõrgeimal tasemel, 592 punktil. Nädala tootlus: +1,06% (nädala sulgemistase: 589,5). Aasta algusest tootlus: +16,59%.
Hiina
Intressimäärad:
- 1Y Loan Prime Rate (keskmise tähtajaga laenude määr): 3,50%;
- 5Y Rate (viieaastane määr, mõjutab eluasemelaene): 3,50%.
Inflatsiooninäitajad (oktoober):
- Tarbijahinnaindeks (CPI): (k/k) -0,1% *(varem: 0,2%); (a/a) 0,7% (varem: 0,2%);
- Tootjahinnaindeks (PPI, a/a): -2,2% (varem: -2,1%).
- Tööpuuduse määr (november): 5,1% (varem: 5,1%).
- Tööstustoodang (november, a/a): 4,8% (varem: 4,9%).
- Põhivarainvesteeringud (november, a/a): -2,6% (varem: -1,7%).
- Jaemüük (november, a/a): 1,3% (varem: 2,9%).
Kaubandus:
- Import (detsember, a/a): 1,9% (varem: 1,0%);
- Eksport (detsember, a/a): 5,9% (varem: -1,1%).
- Kaubandusbilanss (USD, detsember): 111,68 miljardit USD (varem: 90,7 miljardit USD).
Ostujuhtide indeksid (PMI) (november):
- Tööstussektor: 49,2 (varem: 49,0);
- Väljaspool tööstussektorit: 49,0 (varem: 49,0);
- Koondindeks: 49,5 (varem: 50,1).
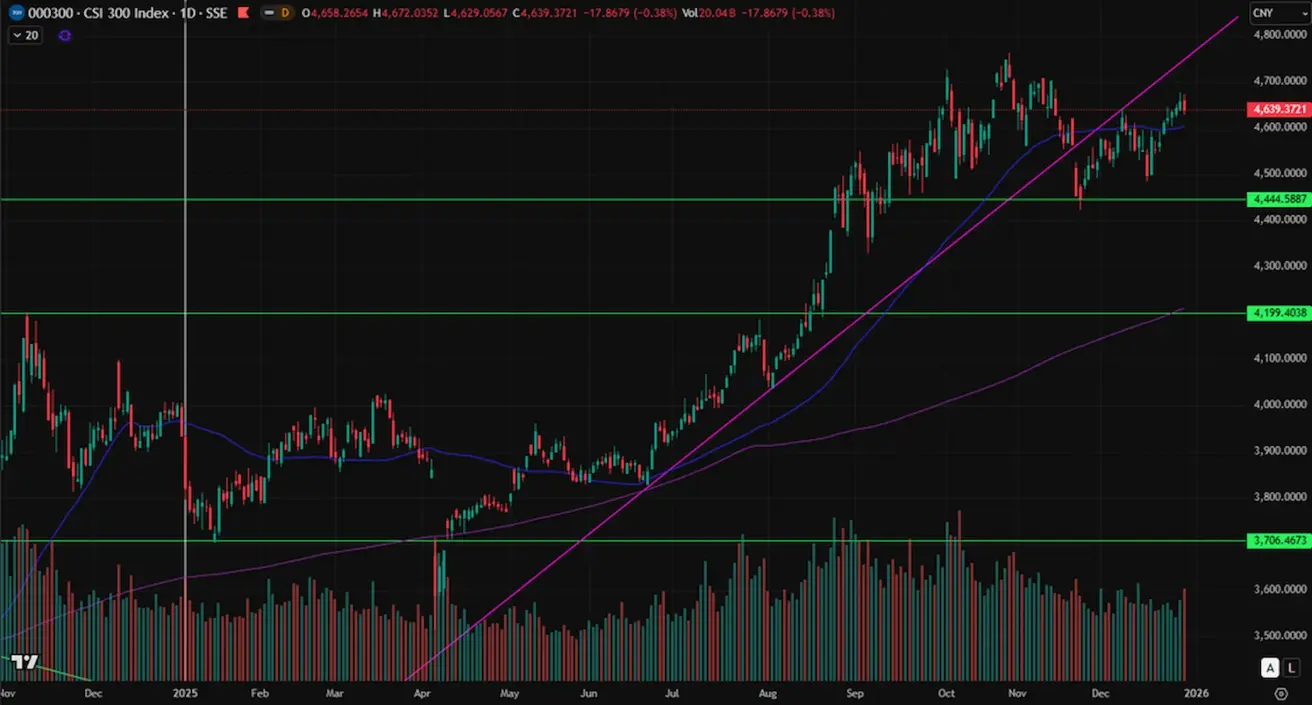
CSI 300 INDEKS
Nädala tootlus: +1,95% (nädala sulgemistase: 4 657,24). Aasta algusest kasv: +18,47%.
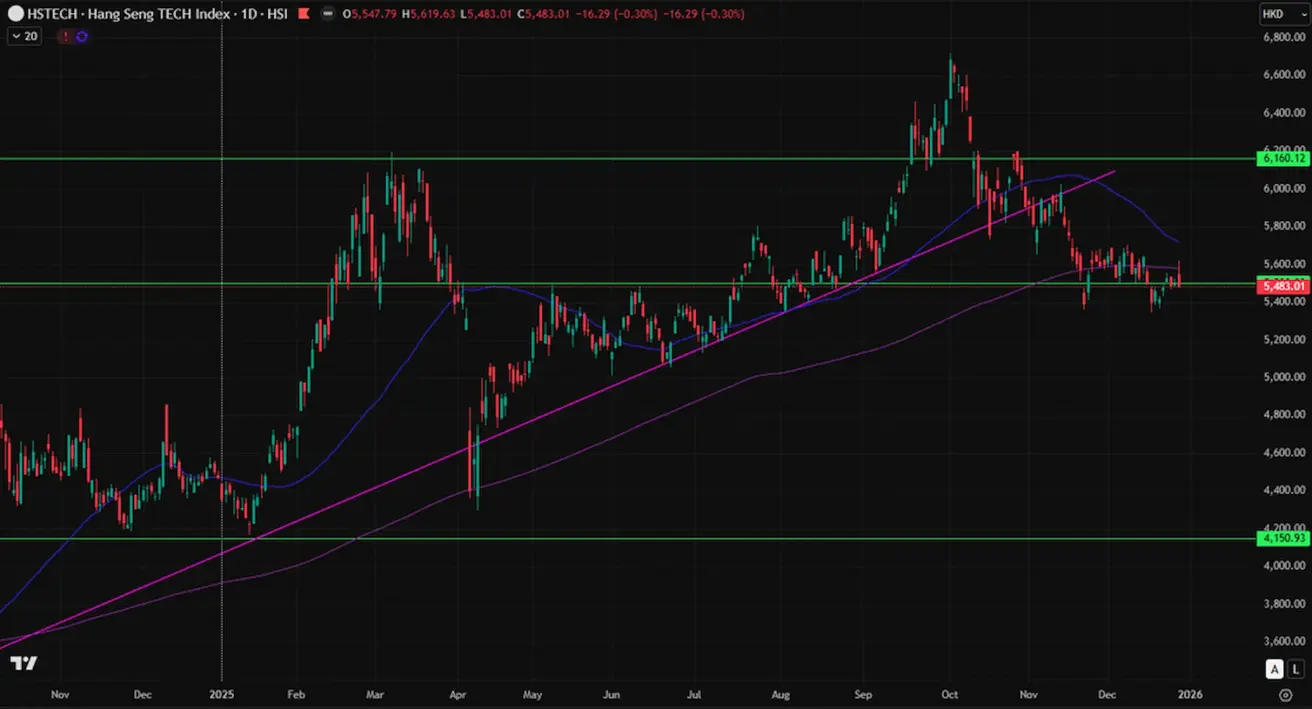
###HANG SENG TECH INDEX (HSTECH.HK) Nädala tootlus: +1,95% (nädala sulgemistase: 4 657,24). Aasta algusest kasv: +18,47%.
VÕLAKIRJATURG – konsolideerumine vahemikus
USA 20+ aasta riigivõlakirjad (ETF TLT): +0,22% nädala jooksul (nädala sulgemistase: 87,74). 2025. aasta tootlus: -0,07%.
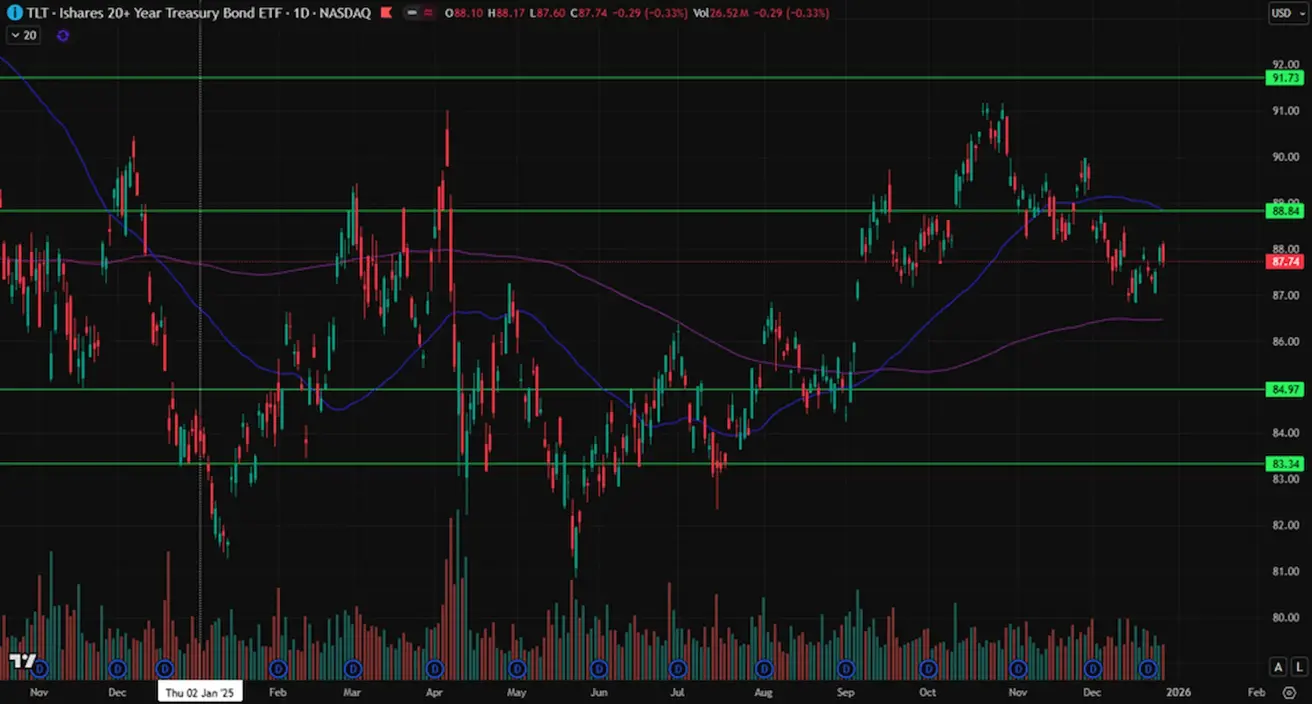
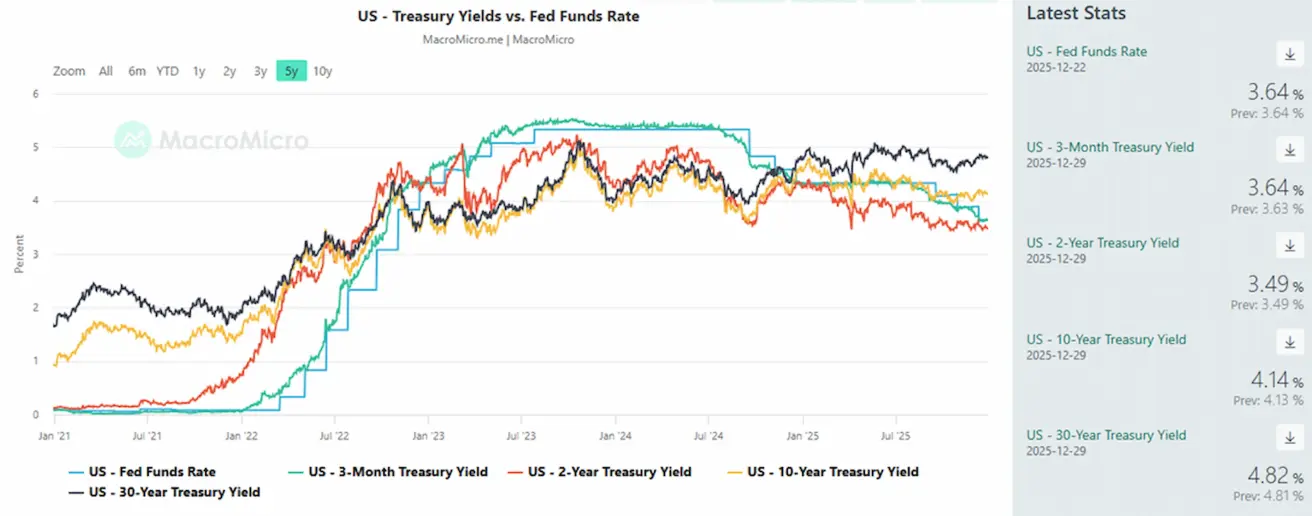
TOOTLUSED JA SPREADID
- USA 10-aastaste riigivõlakirjade turgutootlus püsiva 10-aastase tähtaja juures: 4,14% (varem: 4,17%); 2-aastaste USA riigivõlakirjade tootlus: 3,49% (varem: 3,63%);
- ICE BofA BBB USA ettevõtete indeks, efektiivne tootlus: 5,01% (varem: 5,00%);
- 10- ja 2-aastaste USA riigivõlakirjade tootlusvahe: 65 baaspunkti (varem: 68 bp);
- 10-aastaste ja 3-kuuliste USA riigivõlakirjade tootlusvahe: 50 baaspunkti (varem: 54 bp).
USA 5-aastase krediidivahetuslepingu (CDS, maksejõuetuskindlustus) hind: 26,99 bp (vs. 26,99 bp eelmisel nädalal).
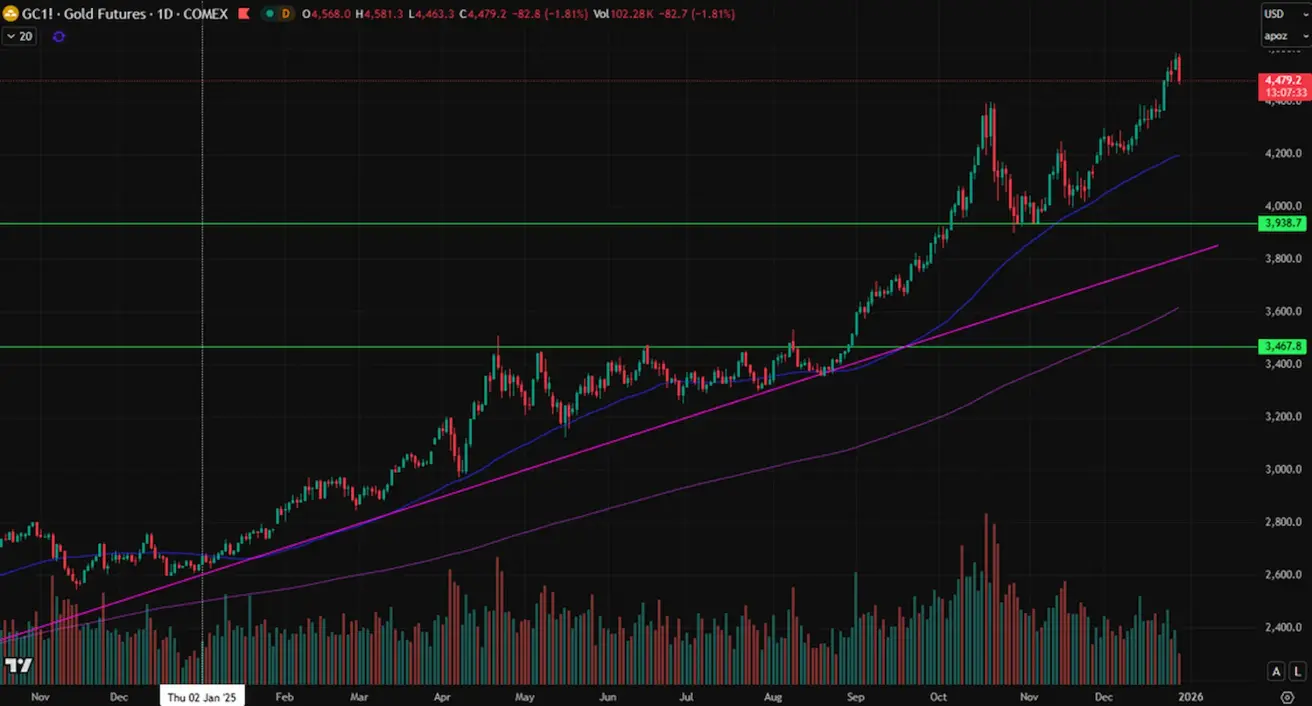
KULLAFUTUURID (GC)
Nädala tootlus: +4,42% (nädala sulgemistase: 4 562,0 dollarit troiuntsi kohta). Aasta algusest tootlus: +72,74%.
DOLLARIINDEKSI FUTUURID (DX)
Nädala tootlus: -0,66%; nädala sulgemistase: 97,735. 2025. aasta tootlus: -9,78%.

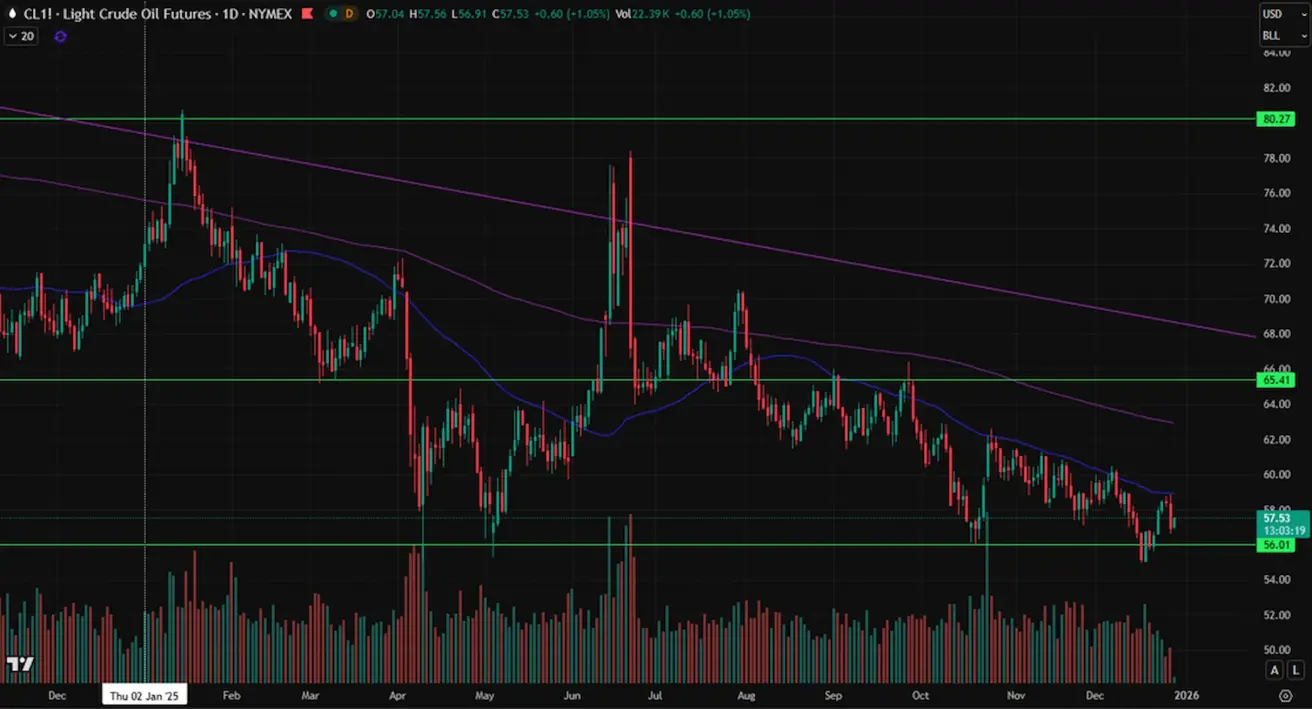
NAFTAFUTUURID
Nädala tootlus: +0,69%, nädala sulgemistase: 56,93 dollarit barreli kohta. Aasta algusest tootlus: -20,77%.
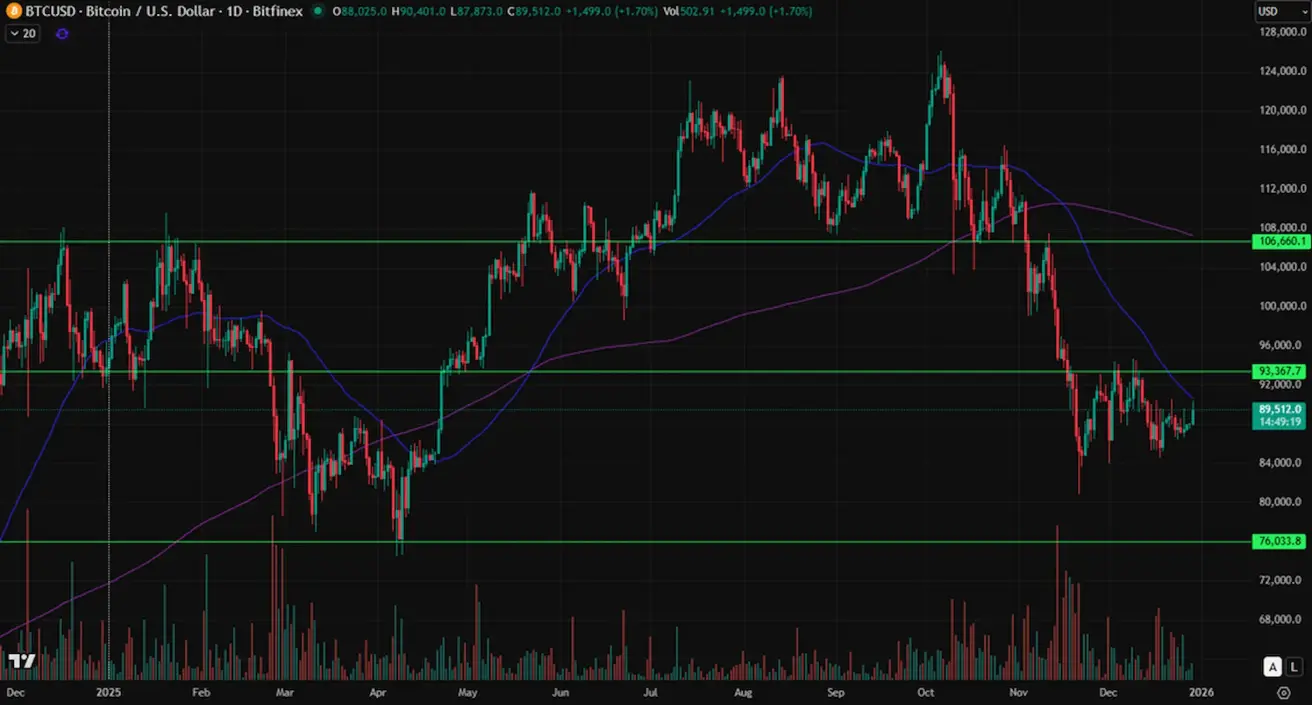
BTC-FUTUURID
Nädala tootlus: -0,80%, nädala sulgemistase: 88 031,00 dollarit. Aasta algusest tootlus: -6,13%.
ETH-FUTUURID
Nädala tootlus: -1,71% (nädala sulgemistase: 2 953,3 dollarit). Aasta algusest tootlus: -11,69%.

Krüptoturu kogukapitalisatsioon: 2,98 triljonit dollarit (vs. 3,02 triljonit dollarit nädal varem) (coinmarketcap.com).
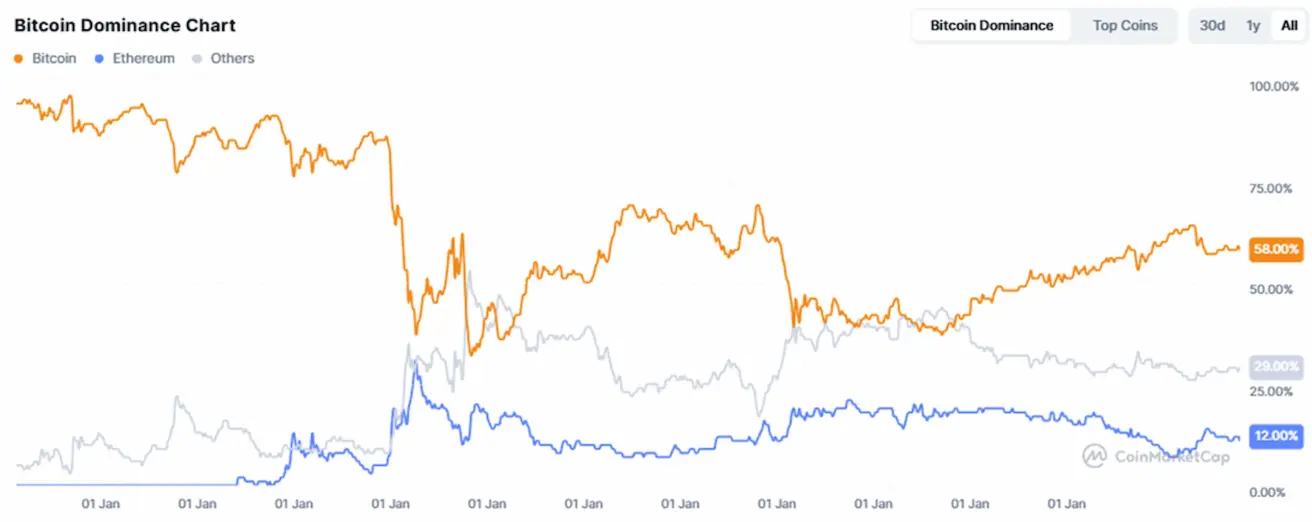
Krüptoturu osakaalud:
- Bitcoin: 58,9% (59,1%);
- Ethereum: 12,0% (12,1%);
- muud: 29,0% (28,8%).
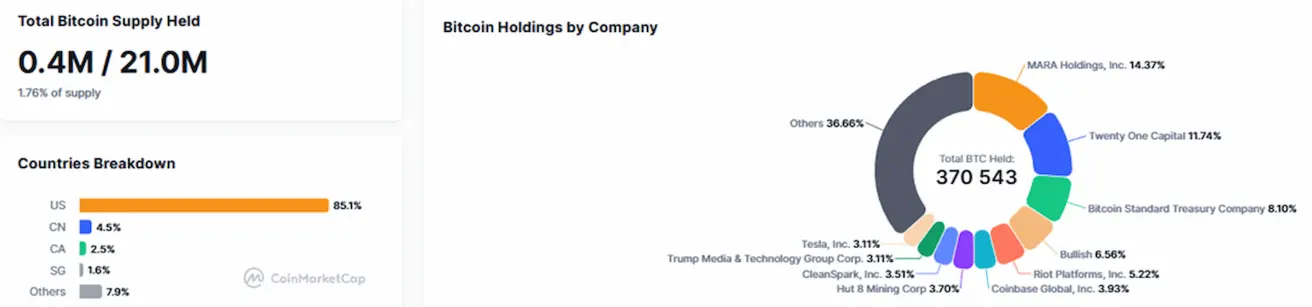
Avalikud ettevõtted, kellel on Bitcoin strateegilisel bilansil. Ettevõtete bilanssides hoitavate bitcoinide osakaal bitcoini kogupakkumisest on 1,76%, sama mis eelmisel nädalal.
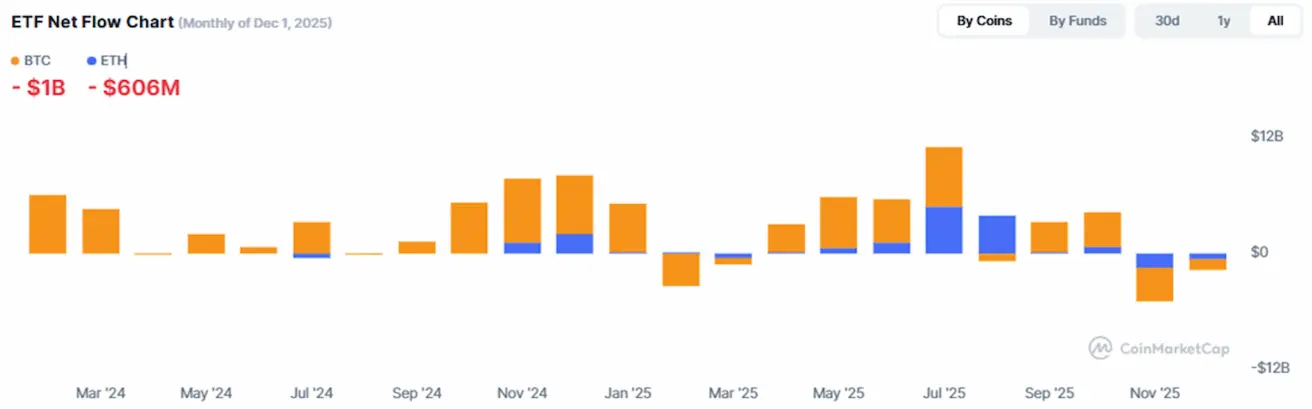
ETF Net Flows Chart: