English
 Русский
 Қазақша
 Eesti
Eesti2025 m. gruodžio 22–28 d.: savaitinė ekonomikos apžvalga
Pagrindinės rinkos naujienos

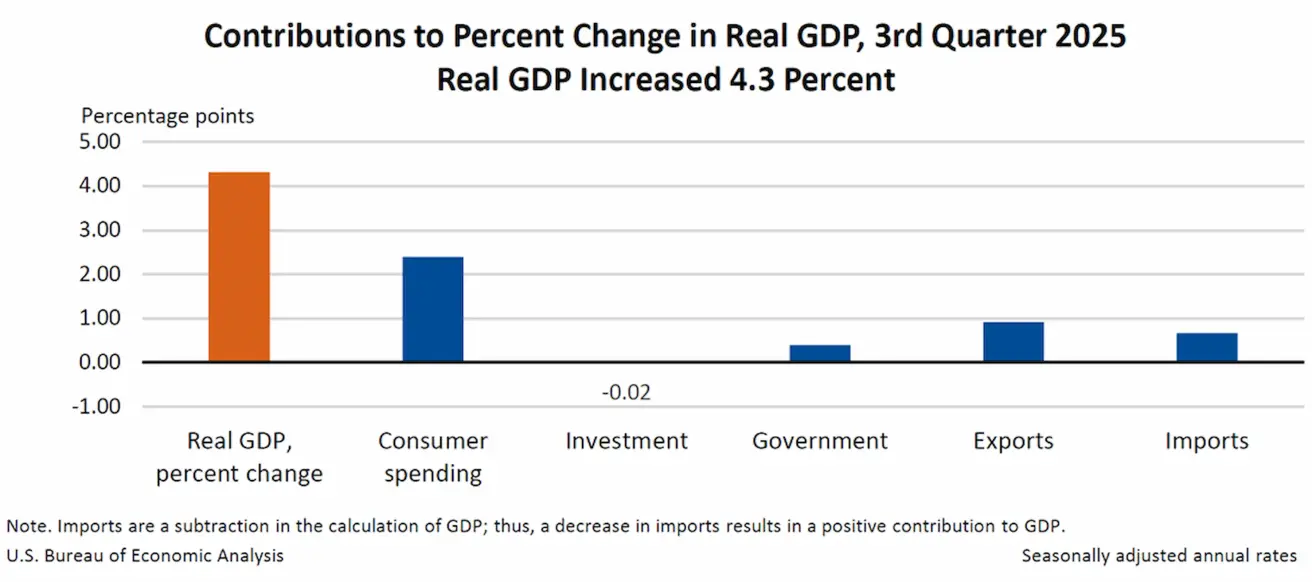
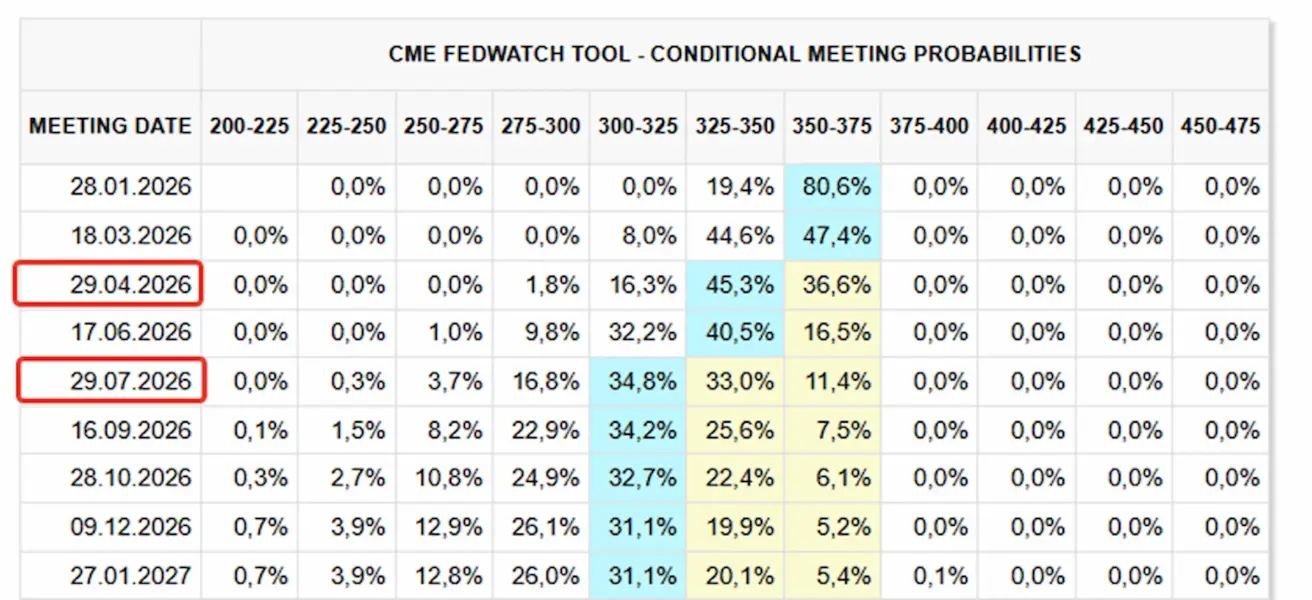
Per praėjusią savaitę rinkos nuotaikos išliko teigiamos, jas palaikė makroekonominiai duomenys. JAV BVP augimas viršijo lūkesčius ir pasiekė aukščiausią lygį per dvejus metus – +4,3 %, o tai savo ruožtu sumažino 25 bazinių punktų palūkanų normos sumažinimo sausį tikimybę iki 19,4 %.
Realiojo BVP augimą trečiąjį ketvirtį lėmė didesnės vartojimo išlaidos, eksportas ir valdžios sektoriaus išlaidos, kurias iš dalies kompensavo investicijų sumažėjimas. Augimą taip pat palaikė sušvelnėję prekybos politikos įtampos ir tarifų sumažėjimas.
Duomenys taip pat parodė darbo rinkos pagerėjimą. Privačiojo sektoriaus užimtumas auga trečią savaitę iš eilės, vidutiniškai po 11 500 darbo vietų per savaitę. Pradinių bedarbio pašalpų paraiškų skaičius JAV sumažėjo 10 000.
Makroekonominė statistika
INFLIACIJA: VARTOTOJŲ KAINŲ INDEKSAS (RUGSĖJIS):
- Pagrindinis VKI: (mėn./mėn.) 0,2 % (ankst.: 0,3 %); (m./m.) 2,6 % (ankst.: 3,0 %).
- VKI: (mėn./mėn.) 0,3 % (ankst.: 0,4 %); (m./m.) 2,7 % (ankst.: 3,0 %).
GAMINTOJŲ KAINŲ INDEKSAS (RUGSĖJIS):
- GKI (mėn./mėn.): 0,3 %, ankst.: -0,1 %.
- Pagrindinis GKI (mėn./mėn.): 0,1 %, ankst.: -0,1 %.
INFLIACIJOS LŪKESČIAI (MICHIGAN) (GRUODIS):
- 12 mėn. infliacijos lūkesčiai: 4,1 %, ankst.: 4,5 %;
- 5 metų infliacijos lūkesčiai: 3,2 %, ankst.: 3,4 %.
Pagrindinis asmeninio vartojimo išlaidų kainų indeksas (rugsėjis) (Federalinio rezervo pirmenybę teikiamas infliacijos rodiklis):
- (mėn./mėn.): 0,2 %, ankst.: 0,2 %; (m./m.): 2,8 %, ankst.: 2,9 %. BVP (JAV Ekonominės analizės biuras, BEA) (2025 m. III ketv., anualizuotas, preliminarus įvertis): +4,3 % (2025 m. II ketv.: +3,8 %).

Federalinio Atlantos rezervų banko GDPNow rodiklis (IV ketv.): 3,9 % (ankst.: 3,5 %).
(GDPNow prognozavimo modelis pateikia „dabartinį“ oficialaus rodiklio įvertį iki jo paskelbimo, vertindamas BVP augimą pagal metodiką, panašią į JAV Ekonominės analizės biuro taikomą metodiką.)
Verslo aktyvumo indeksas (PMI) (gruodis):
(Virš 50 reiškia plėtrą; žemiau 50 – susitraukimą)
- Paslaugų sektorius: 52,9 (ankst.: 54,1);
- Gamybos sektorius: 51,8 (ankst.: 52,2);
- „S&P Global Composite“: 53,0 (ankst.: 54,2).
DARBO RINKA (BLS) (lapkritis)
Darbo rinkos duomenys viršijo lūkesčius pagal kelis rodiklius:
- Nedarbo lygis: 4,6 % (ankst.: 4,4 %);
- Bendras JAV bedarbio pašalpas gaunančių asmenų skaičius: 1 923 tūkst. (ankst.: 1 885 tūkst., pakoreguota);
- Pradinių bedarbio pašalpų paraiškų skaičius: 214 tūkst. (ankst.: 224 tūkst.);
- Ne žemės ūkio sektoriaus darbo vietų pokytis: 64 tūkst. (ankst.: -105 tūkst.);
- Privačiojo ne žemės ūkio sektoriaus darbo vietų pokytis: 69 tūkst. (ankst.: -52 tūkst.);
- Vidutinis valandinis uždarbis (m./m.): 3,5 % (ankst.: 3,7 %);
- Laisvų darbo vietų skaičius (JOLTS): — (ankst.: 7,227 mln.).
PINIGŲ POLITIKA
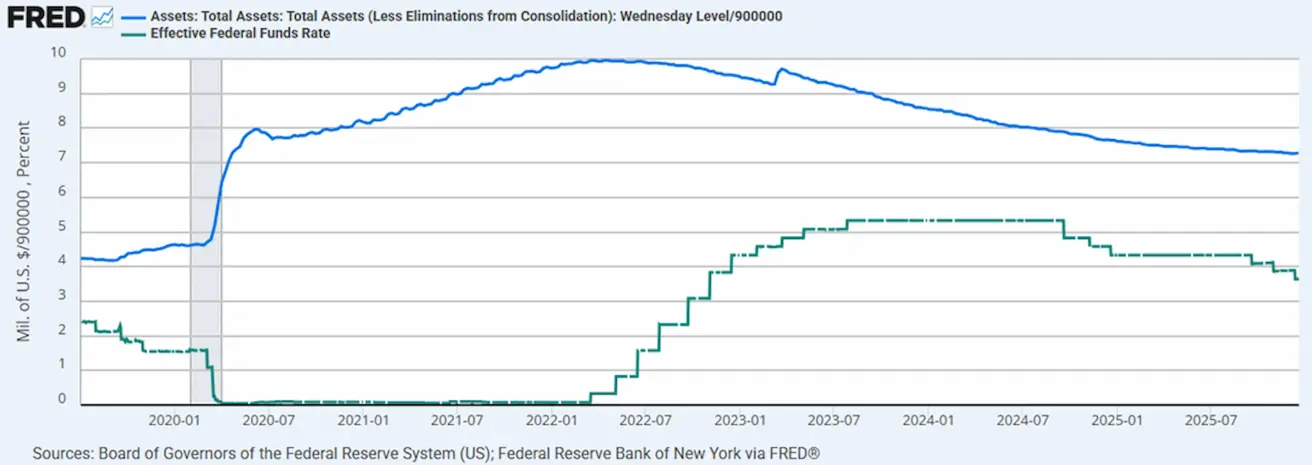
- Efektyvioji federalinių fondų norma (EFFR): 3,50–3,75 %;
- Federalinio rezervo balansas: 6,5568 trln. USD, +0,33 % nuo QT sustabdymo (6,535 trln. USD).
RINKOS PALŪKANŲ NORMOS PROGNOZĖ (FEDWATCH)
Kitam posėdžiui (sausio 28 d.): implikuota 0,25 % palūkanų normos sumažinimo tikimybė yra 19,4 %.
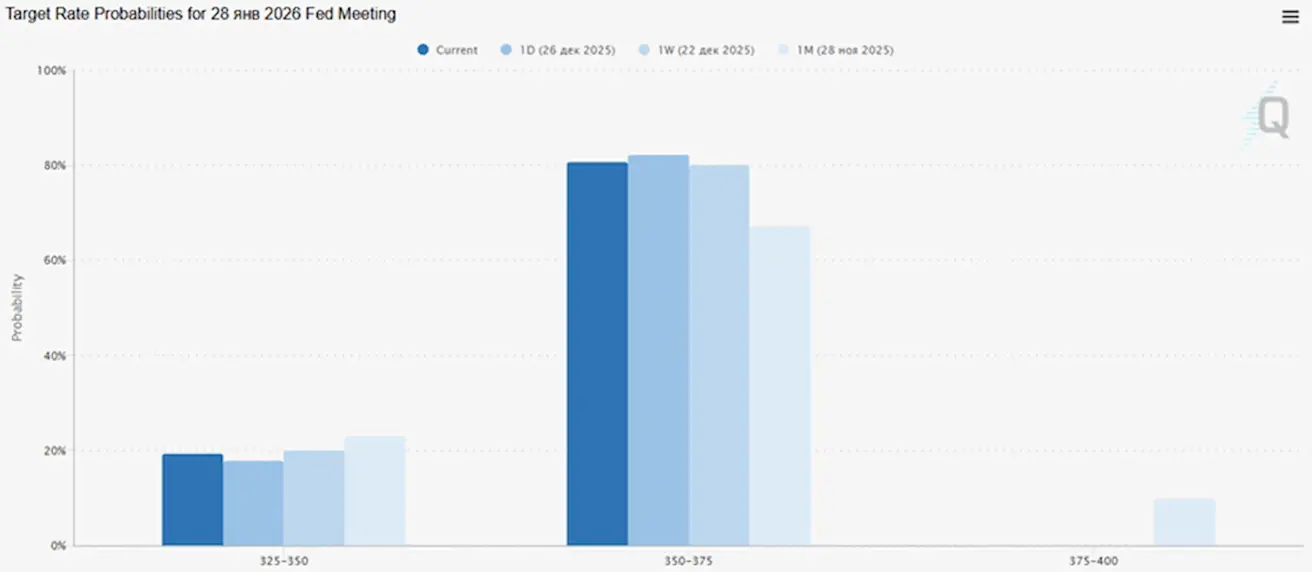
Per ateinančius 12 mėnesių: du 0,25 % palūkanų normos sumažinimai, dėl kurių tikslinis intervalas sumažėtų iki 3,00–3,25 %.
Šiandien:
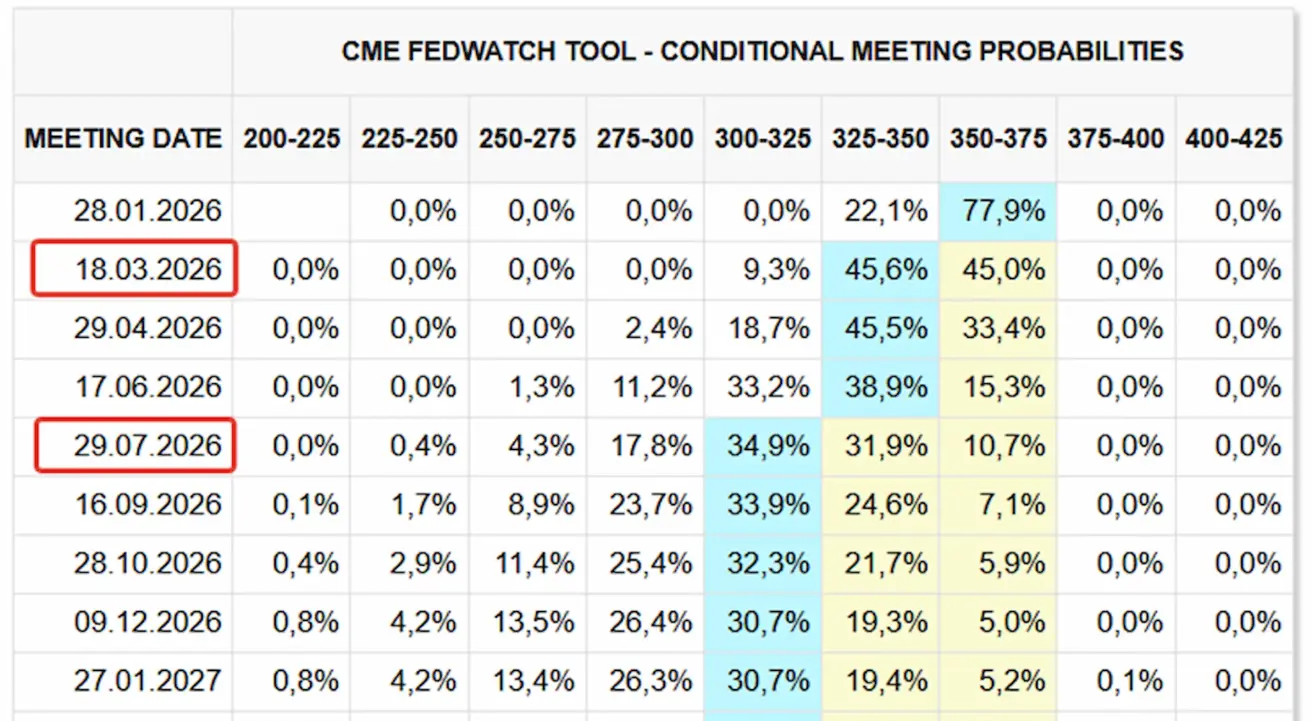
Prieš savaitę:
Rinka
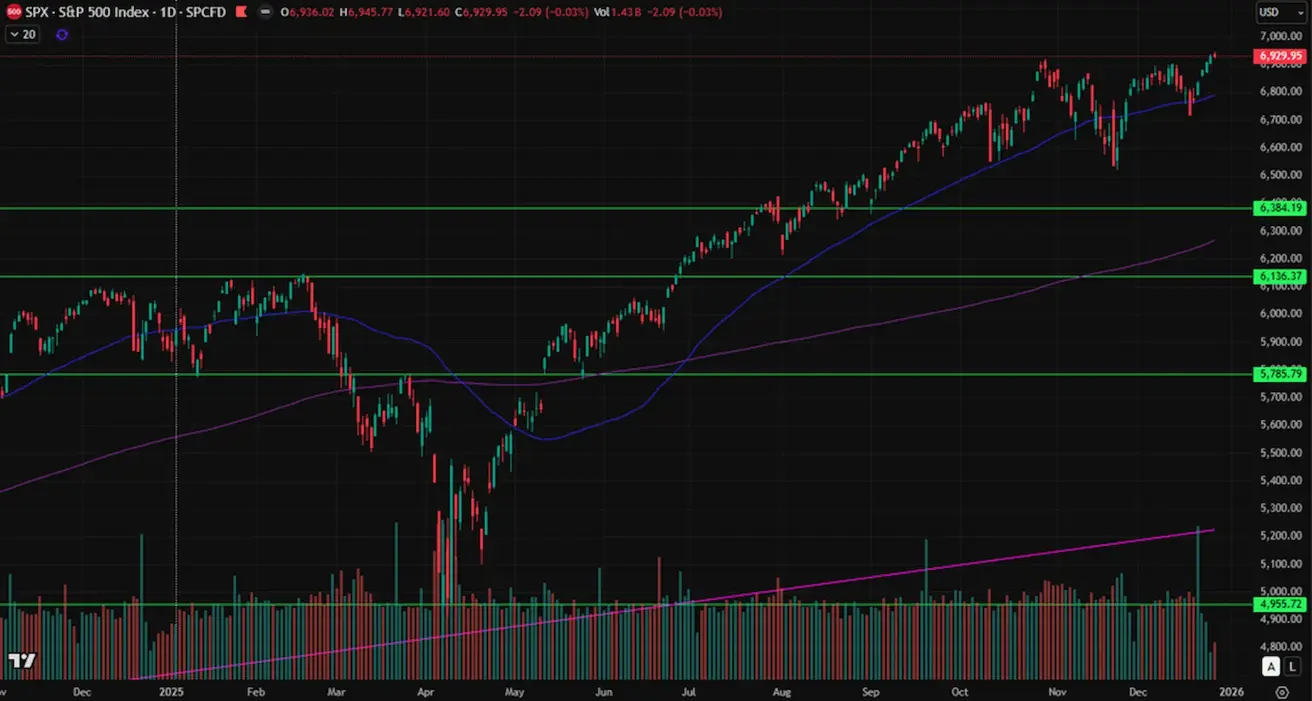
SP500
Savaitinis rezultatas: +1,35 % per savaitę (savaitės pabaigos uždarymas: 6 929,95) ir +17,34 % nuo metų pradžios 2025 m. Penktadienį indeksas pasiekė naują istorinį maksimumą – 6 945 punktus.
NASDAQ100
Savaitinis rezultatas: +1,18 % (savaitės pabaigos uždarymas: 25 644,39). Rezultatas nuo metų pradžios: +21,42 %.

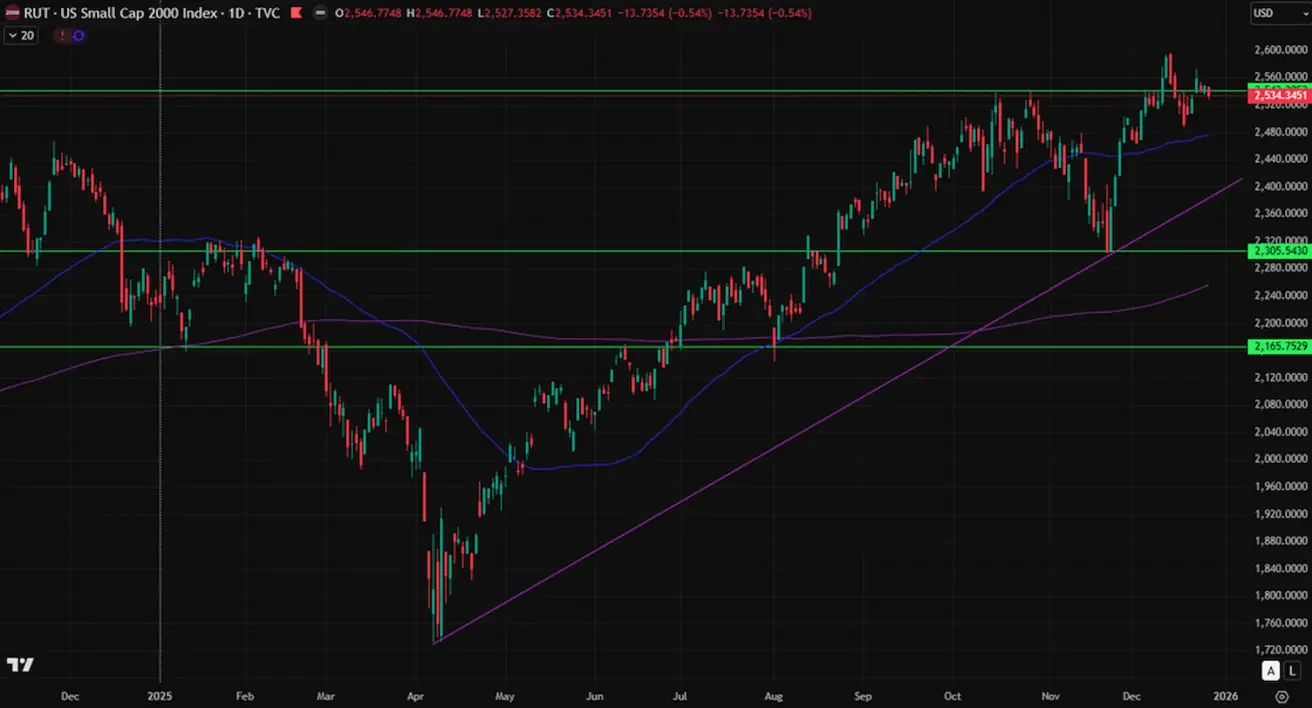
RUSSEL 2000 (RUT)
Savaitinis rezultatas: +0,19 % (savaitės pabaigos uždarymas: 2 534,34). Nuo metų pradžios: +13,08 %.
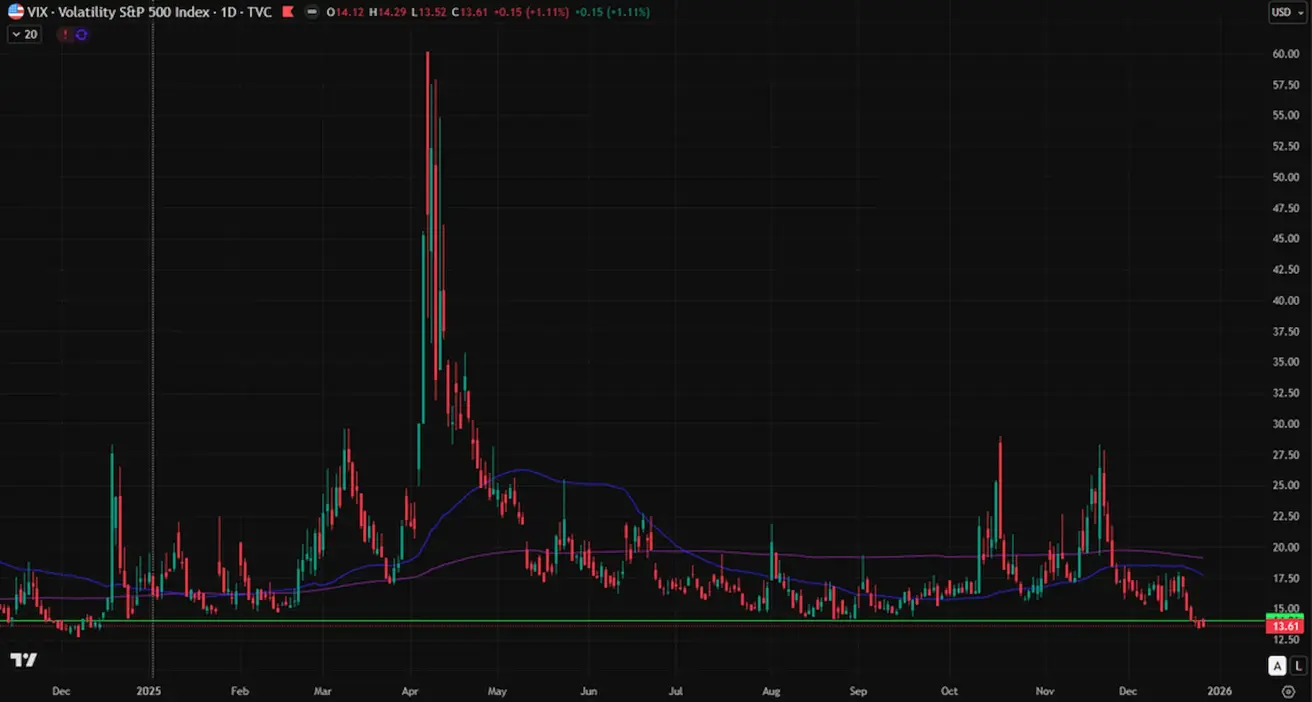
VIX
VIX (volatility index) nukrito iki žemiausio lygio šiais metais, savaitę užbaigdamas ties 13,61 punkto. Šiuo metu rinkoje baimės nėra.
Eurozona
Palūkanų normos:
- Indėlių galimybės palūkanų norma: 2,0 % (ankst.: 2,0 %);
- Ribinio skolinimosi galimybės palūkanų norma: 2,4 % (ankst.: 2,4 %) (palūkanų norma, už kurią bankai gali skolintis per naktį iš centrinio banko);
- Trumpalaikė (pagrindinė) pinigų politikos norma: 2,15 % (ankst.: 2,15 %).
Infliacija: vartotojų kainų indeksas (VKI) (lapkritis):
- Pagrindinis VKI (m./m.): 2,4 % (ankst.: 2,4 %);
- VKI: (mėn./mėn.) -0,3 % (ankst.: 0,2 %); (m./m.) 2,1 % (ankst.: 2,2 %).
BVP (III ketv., galutinis):
- ketv./ketv.: 0,3 % (ankst.: 0,1 %);
- m./m.: 1,4 % (ankst.: 1,5 %).
Nedarbo lygis (spalis): 6,4 % (ankst.: 6,3 %).
Pirkimo vadybininkų indeksas (PMI) (gruodis):
- Paslaugų sektorius: 52,6 (ankst.: 53,6);
- Gamybos sektorius: 49,2 (ankst.: 49,6);
- „S&P Global Composite“: 51,9 (ankst.: 52,8).
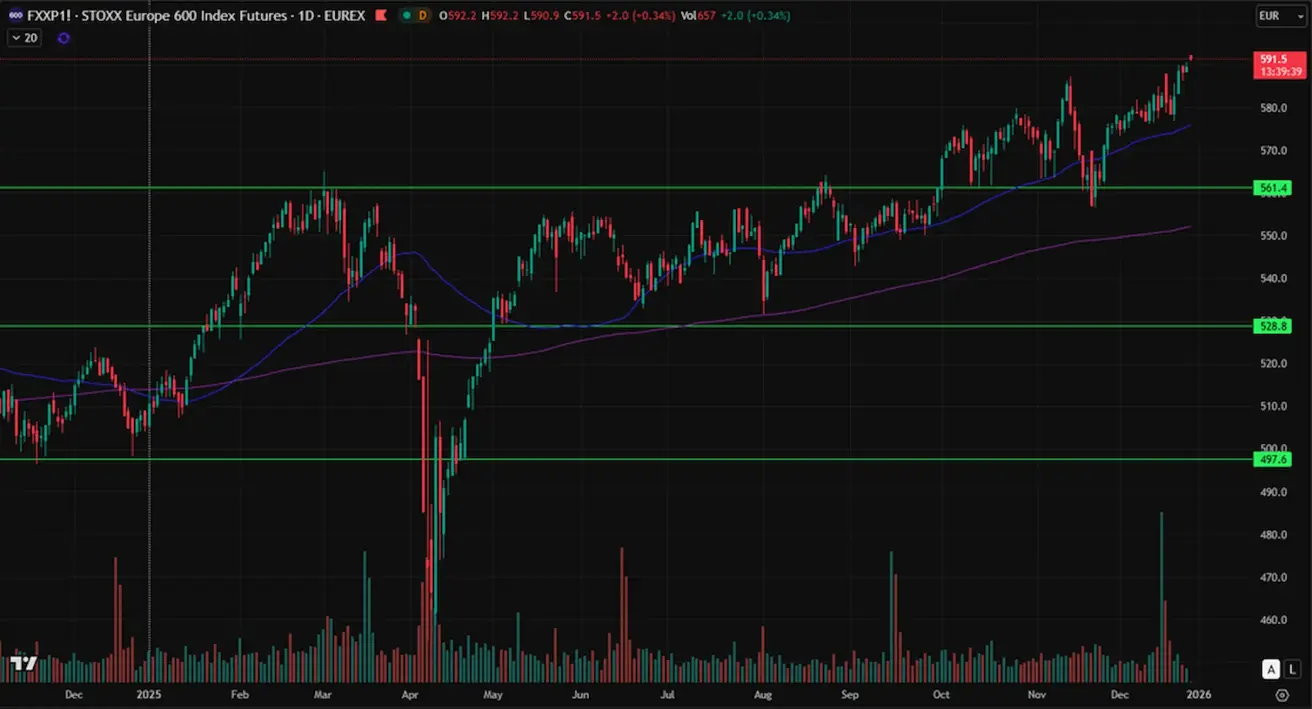
EURO STOXX 600
Po švenčių „Euro Stoxx 600“ atsidarė ties istoriniu maksimumu – 592 punktų. Savaitinis rezultatas: +1,06 % (savaitės pabaigos uždarymas: 589,5). Rezultatas nuo metų pradžios: +16,59 %.
Kinija
Palūkanų normos:
- 1 m. paskolų pagrindinė norma (vidutinės trukmės skolinimas): 3,50 %;
- 5 m. norma (penkerių metų norma, daranti įtaką būsto paskoloms): 3,50 %.
Infliacijos rodikliai (spalis):
- Vartotojų kainų indeksas (VKI): (mėn./mėn.) -0,1 % *(ankst.: 0,2 %); (m./m.) 0,7 % (ankst.: 0,2 %);
- Gamytojų kainų indeksas (GKI) (m./m.): -2,2 % (ankst.: -2,1 %).
- Nedarbo lygis (lapkritis): 5,1 % (ankst.: 5,1 %).
- Pramonės gamyba (lapkritis) (m./m.): 4,8 % (ankst.: 4,9 %).
- Fiksuoto kapitalo investicijos (lapkritis) (m./m.): -2,6 % (ankst.: -1,7 %).
- Mažmeninė prekyba (lapkritis) (m./m.): 1,3 % (ankst.: 2,9 %).
Prekyba:
- Importas (gruodis) (m./m.): 1,9 % (ankst.: 1,0 %);
- Eksportas (gruodis) (m./m.): 5,9 % (ankst.: -1,1 %).
- Prekybos balansas (USD) (gruodis): 111,68 mlrd. USD (ankst.: 90,7 mlrd. USD).
Pirkimo vadybininkų indeksai (PMI) (lapkritis):
- Gamybos sektorius: 49,2 (ankst.: 49,0);
- Negamybinis sektorius: 49,0 (ankst.: 49,0);
- Sudėtinis indeksas: 49,5 (ankst.: 50,1).
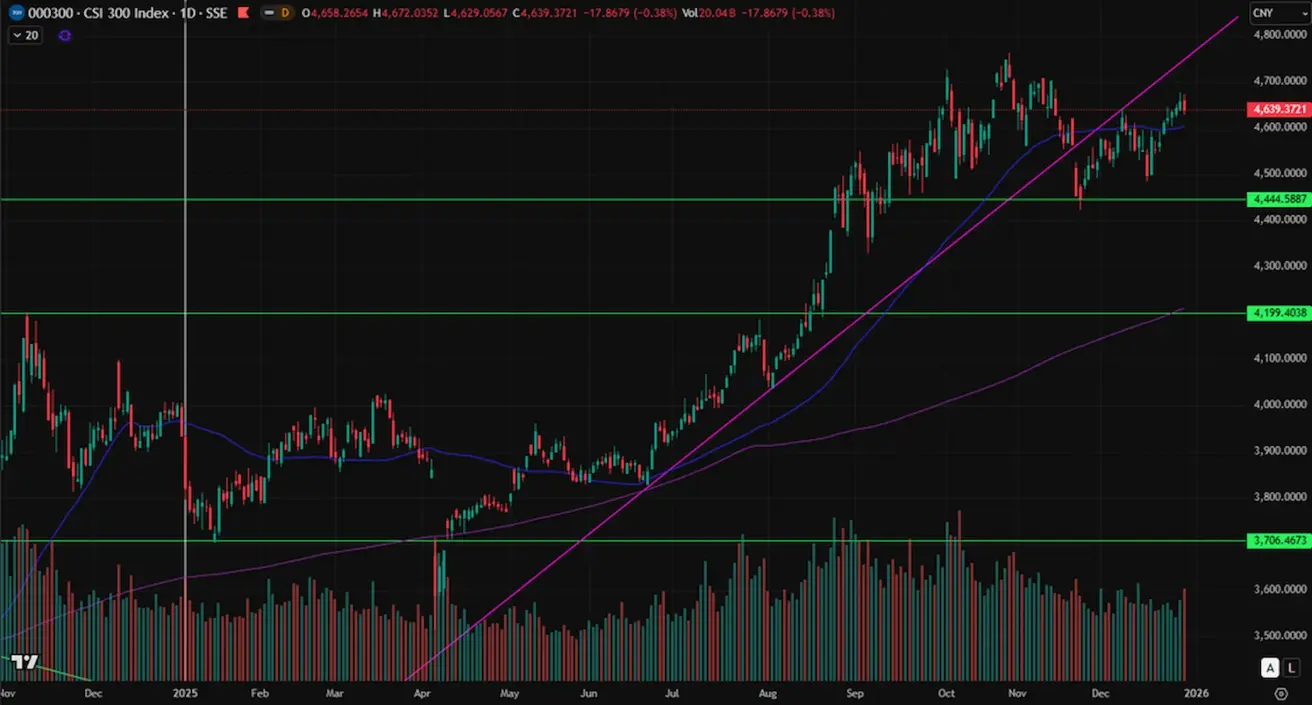
CSI 300 INDEKSAS
Savaitinis rezultatas: +1,95 % (savaitės pabaigos uždarymas: 4 657,24). augimas nuo metų pradžios: +18,47 %.
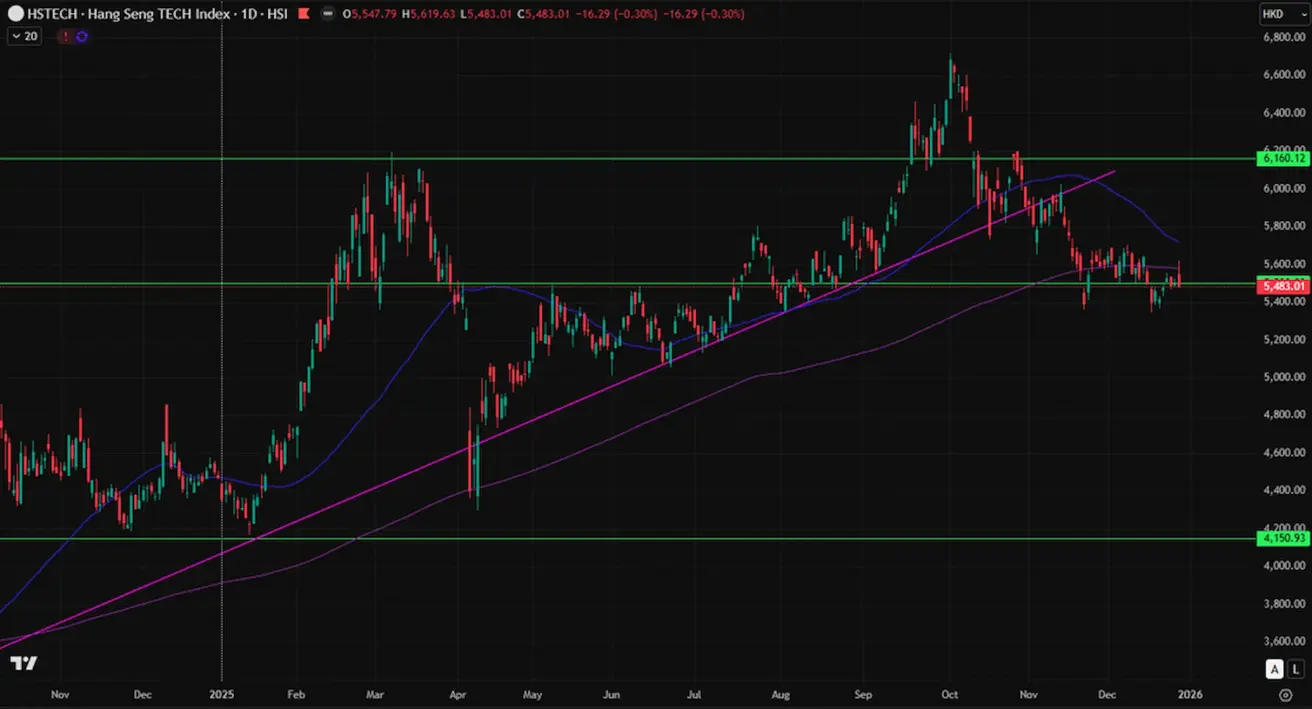
###HANG SENG TECH INDEX (HSTECH.HK) Savaitinis rezultatas: +1,95 % (savaitės pabaigos uždarymas: 4 657,24). Augimas nuo metų pradžios: +18,47 %.
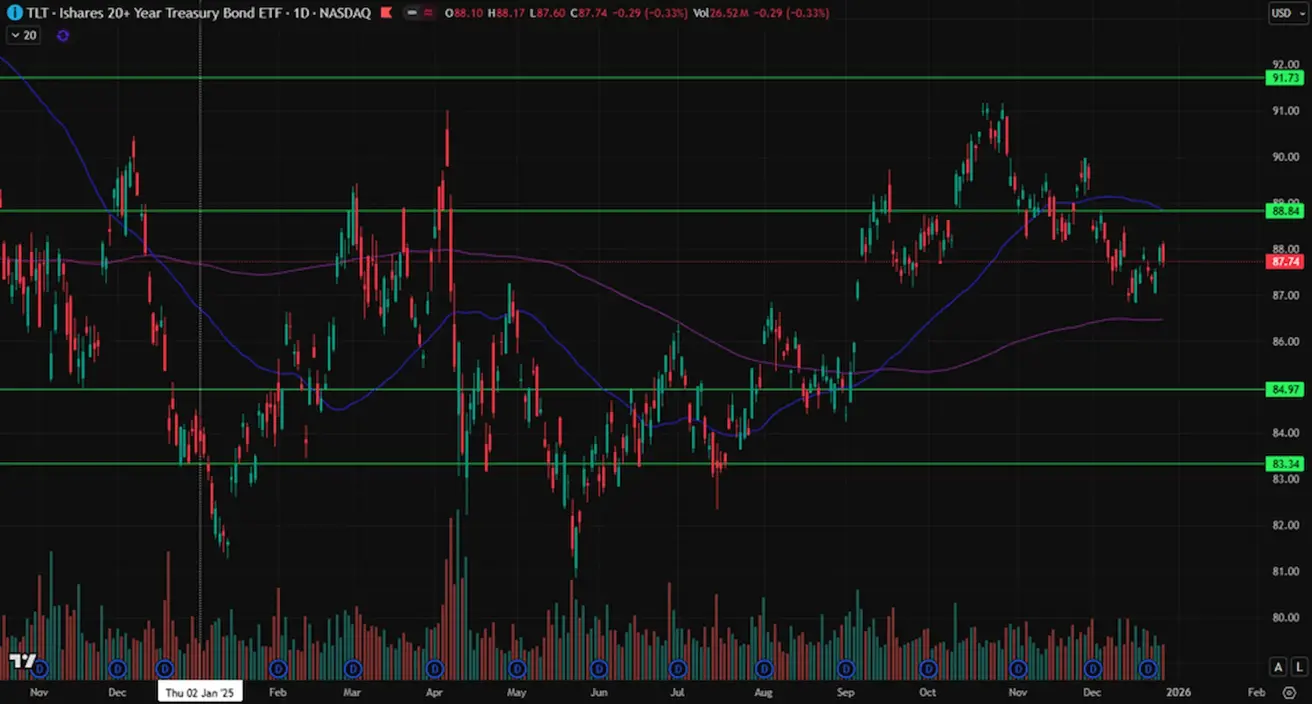
OBLIGACIJŲ RINKA – konsolidacija intervale
20+ m. JAV iždo obligacijos (ETF TLT): +0,22 % per savaitę (savaitės pabaigos uždarymas: 87,74). 2025 m. rezultatas: -0,07 %.
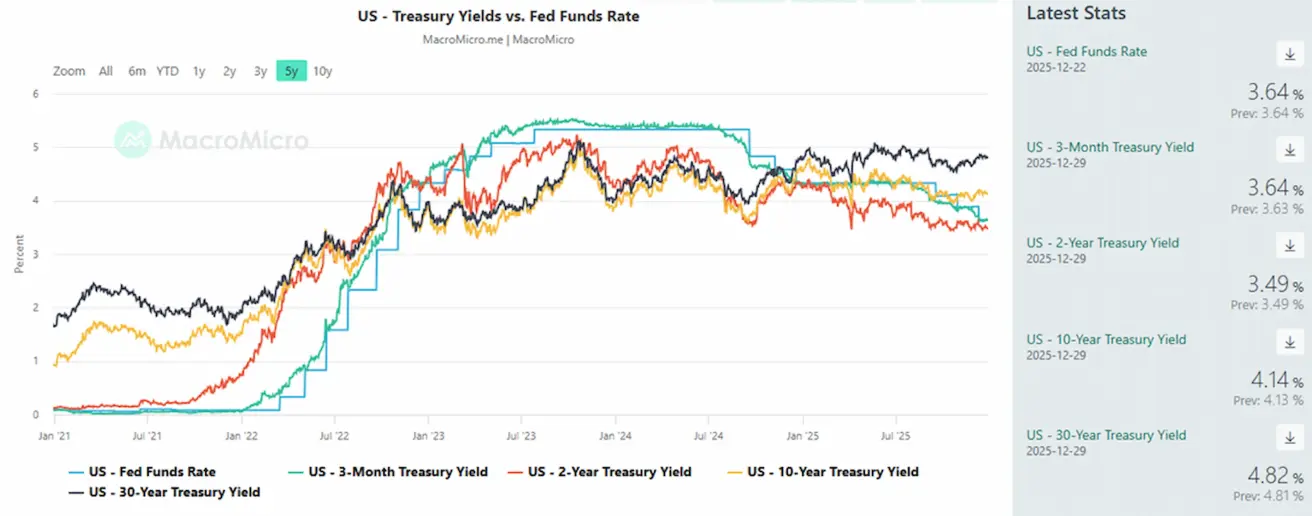
PAJAMINGUMAI IR SPREADAI
- JAV 10 metų trukmės nuolatės trukmės iždo vertybinių popierių rinkos pajamingumas: 4,14 % (ankst.: 4,17 %); 2 metų iždo pajamingumas: 3,49 % (ankst.: 3,63 %);
- ICE BofA BBB JAV įmonių obligacijų indekso efektyvusis pajamingumas: 5,01 % (ankst.: 5,00 %);
- Pajamingumo spreadas tarp 10 metų ir 2 metų JAV iždo vertybinių popierių: 65 baziniai punktai (ankst.: 68 baziniai punktai);
- Pajamingumo spreadas tarp 10 metų ir 3 mėn. JAV iždo vertybinių popierių: 50 bazinių punktų (ankst.: 54 baziniai punktai).
5 metų JAV kredito įsipareigojimų neįvykdymo apsikeitimo sandorio (CDS) (nemokumo draudimas) kaina: 26,99 bazinio punkto (palyginti su 26,99 bazinio punkto praėjusią savaitę).
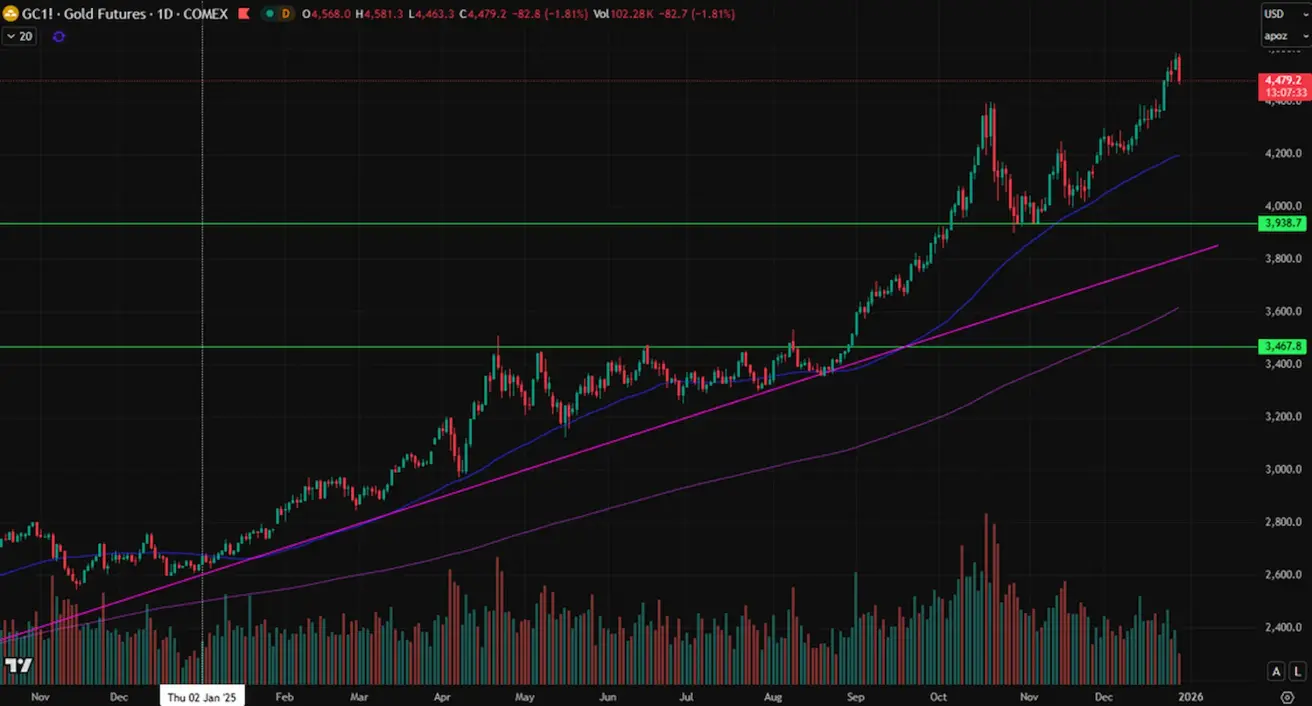
AUKSO ATEITIES SANDORIAI (GC)
Savaitinis rezultatas: +4,42 % (savaitės pabaigos uždarymas: 4 562,0 USD už Trojos unciją). Prieaugis nuo metų pradžios: +72,74 %.
DOLERIO INDEKSO ATEITIES SANDORIAI (DX)
Savaitinis rezultatas: -0,66 %; savaitės pabaigos uždarymas: 97,735. 2025 m. rezultatas: -9,78 %.

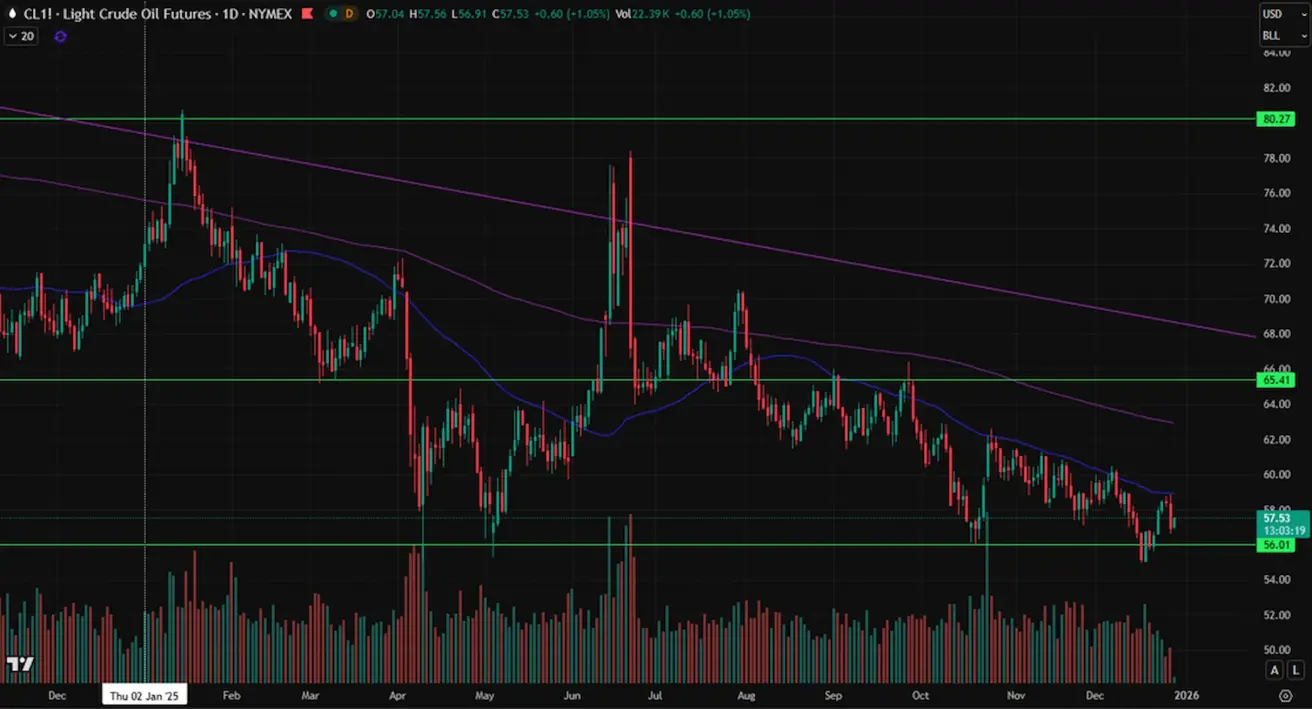
NAFTOS ATEITIES SANDORIAI
Savaitinis rezultatas: +0,69 %, savaitės pabaigos uždarymas: 56,93 USD už barelį.. Rezultatas nuo metų pradžios: -20,77 %.
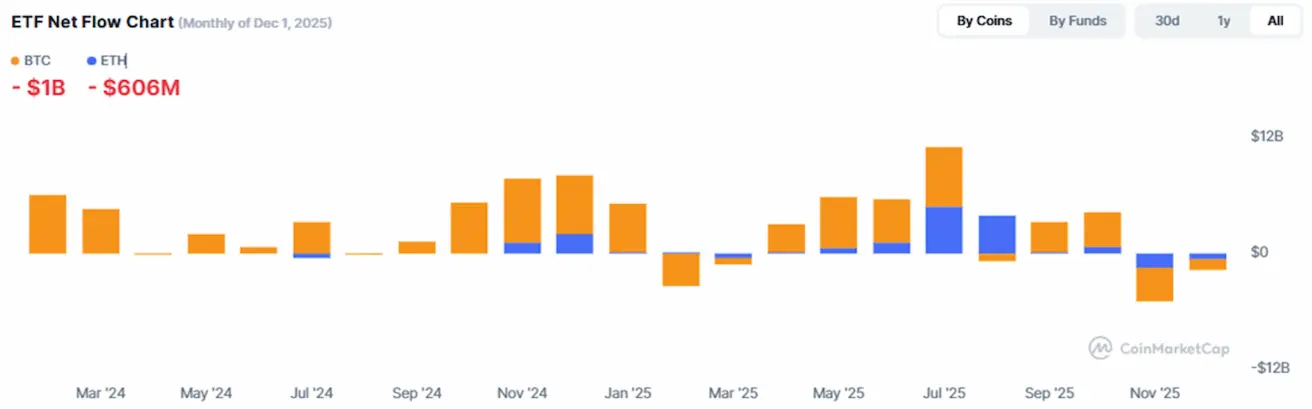
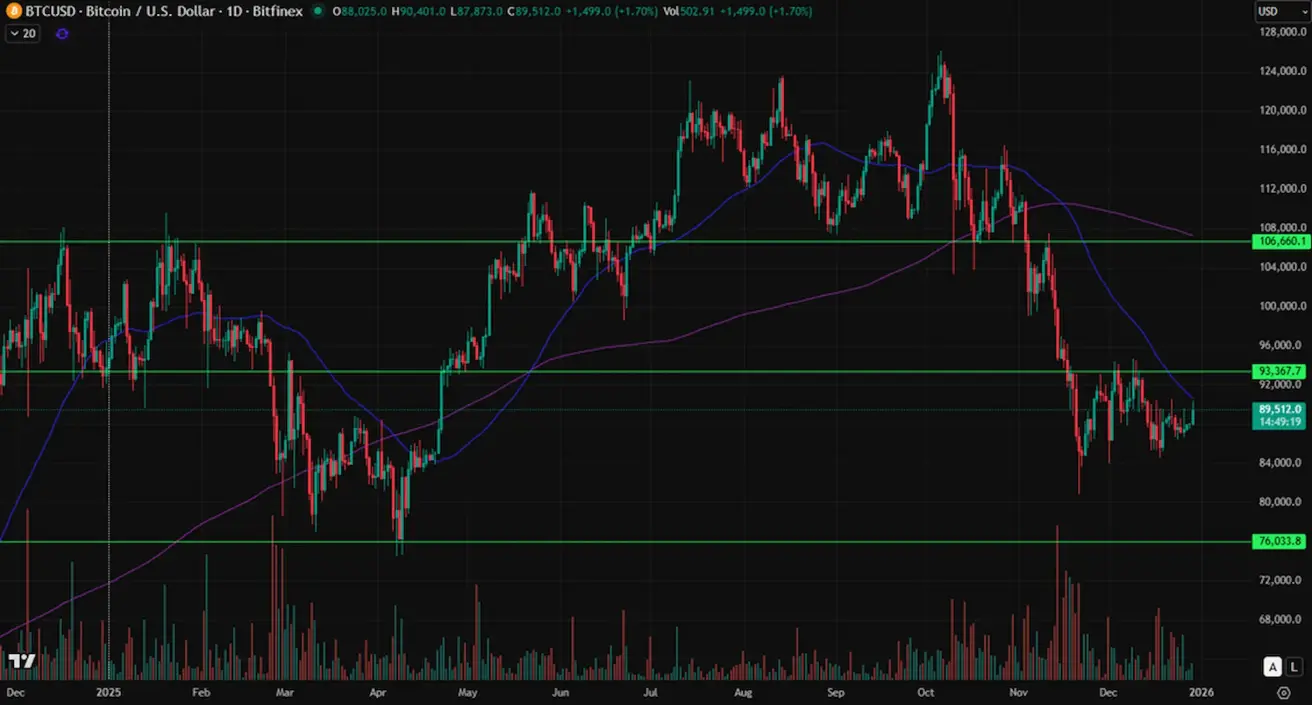
BTC ATEITIES SANDORIAI
Savaitinis rezultatas: -0,80 %, savaitės pabaigos uždarymas: 88 031,00 USD. Rezultatas nuo metų pradžios: -6,13 %.
ETH ATEITIES SANDORIAI
Savaitinis rezultatas: -1,71 % (savaitės uždarymas: 2 953,3 USD). Rezultatas nuo metų pradžios: -11,69 %.

Bendra kriptovaliutų rinkos kapitalizacija: 2,98 trln. USD (prieš 3,02 trln. USD prieš savaitę) (coinmarketcap.com).
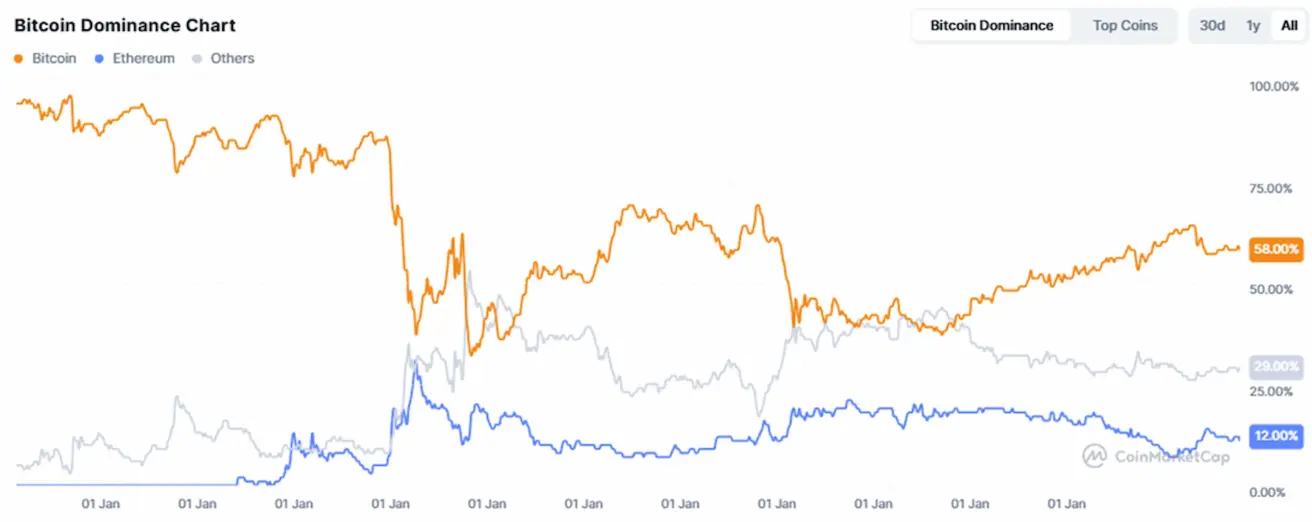
Kriptovaliutų rinkos dalys:
- Bitcoin: 58,9 % (59,1 %);
- Ethereum: 12,0 % (12,1 %);
- kitos: 29,0 % (28,8 %).
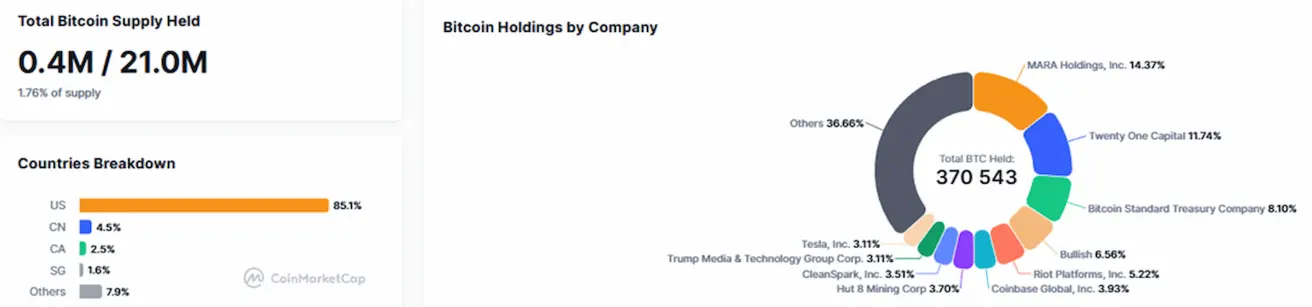
Viešosios įmonės, taikančios Bitcoin iždo strategijas. Bitkoinų, laikomų įmonių balansuose, dalis, palyginti su bendra Bitcoin pasiūla, yra 1,76 %, palyginti su praėjusia savaite.
ETF grynųjų srautų diagrama: