English
 Lietuvių
 Русский
 Қазақша
3.–7. november 2025: Nädalane majandusülevaade
Peamised turu arengud
Makromajanduslik statistika
INFLATION
- Core Consumer Price Index (CPI) (m/m) (september): 0,2% (eelmine: 0,3%)
- Consumer Price Index (CPI) (m/m) (september): 0,3% (eelmine: 0,4%)
- Core Consumer Price Index (CPI) (y/y) (september): 3,0% (eelmine: 3,1%)
- Consumer Price Index (CPI) (y/y) (september): 3,0% (eelmine: 2,9%)
INFLATION EXPECTATIONS (MICHIGAN)
- 12-month expected inflation (august): 4,7% (eelnev: 4,6%)
- 5-year expected inflation (august): 3,6% (eelnev: 3,9%)
PRODUCER PRICE INDEX (PPI):
- PPI (m/m) (august): -0,1%, eelnev: 0,7%
- Core PPI (m/m) (august): -0,1%, eelnev: 0,7%
SKP (U.S. Bureau of Economic Analysis, BEA) (Q2 2025, annualiseeritud, kolmas hinnang): +3,8% (esialgne hinnang: 3,30%; Q1 2024: – 0,5%)
Äritegevuse indeks (PMI):
(Üle 50 näitab laienemist; alla 50 näitab kokkutõmbumist)
- Teenindussektor (oktoober): 54,8 (eelmine: 54,2)
- Töötleva tööstuse sektor (oktoober): 52,5 (eelmine: 52,2)
- S&P Global Composite (oktoober): 54,6 (eelmine: 53,9)
TÖÖTURG (OKTOOBER): ajutise valitsuse tööseisaku tõttu andmed puuduvad.
- Tööpuuduse määr: - (eelnev 4,3%)
- Töötushüvitist saavate isikute koguarv USA-s: - (vs 1 920 K).
- Muutus mittetööstuslike töökohtade arvus (ADP), oktoober: 42 K (eelmine: -29 K, korrigeeritud)
- Muutus USA erasektori mittetööstuslikes töökohtades: —
- Keskmine tunnipalk (y/y): — (eelmine: 3,7%)
- Vabade töökohtade arv (JOLTS): — (vs 7,227 M)
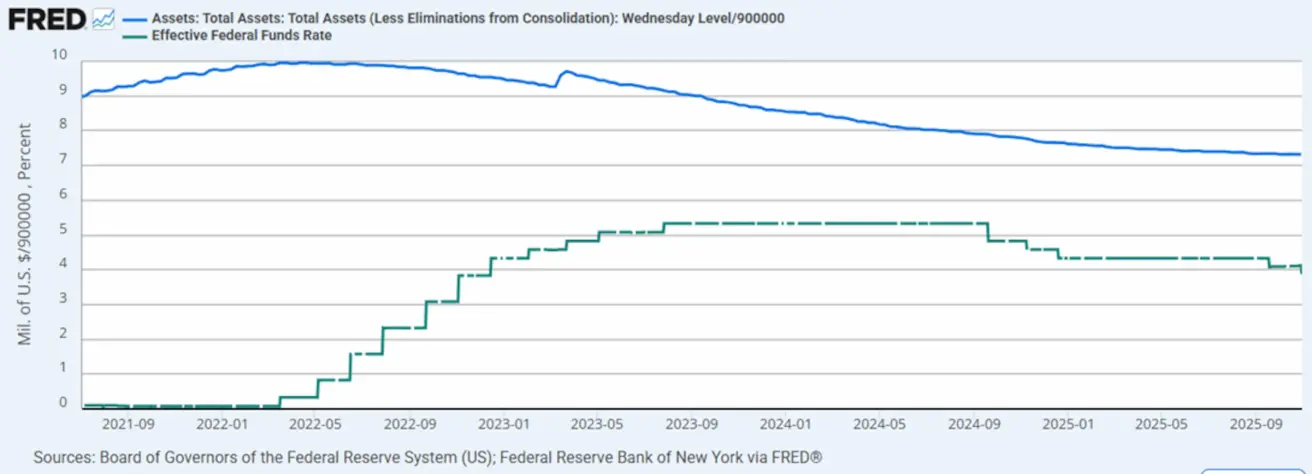
RAHAPOLIITIKA
- Fed Funds Effective Rate (EFFR): 3,75%–4,0%
- Föderaalreservi bilanss suurenes: 6 572 triljonit USA dollarit (vs eelmine nädal: 6 587 triljonit USA dollarit)
TURU OOTUSED INTRESSIMÄÄRA SUHTES (FEDWATCH)
Ootused eelseisvaks FOMC kohtumiseks 29. oktoobril:
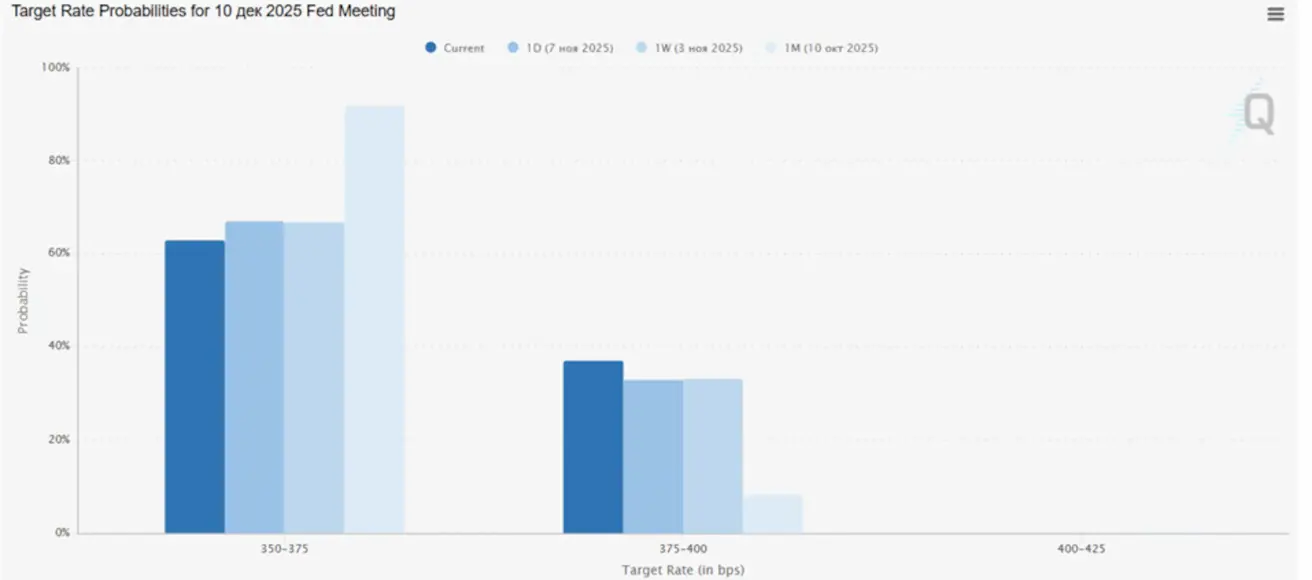
Täna:

Nädal varem:
Kommentaar
Föderaalreserv alandas intressimäära vahemikku 3,75–4,0% ja teatas bilansi vähendamise lõpetamisest.
Esimees Jerome Powell kordas, et riskid on endiselt kaldu tööjõuturu poole, ehkki väiksema muretasemega kui eelmistel kohtumistel, ning regulaator andis märku võimalikust pausist intressikärbetes detsembrikuu kohtumisel.
See Föderaalreservi otsus on tõenäoliselt õige samm, et saavutada parem kontroll inflatsiooni ja äritegevuse vahelist riskide tasakaalu üle.
Oluline järeldus on, et Fed kinnitas oma rahapoliitika jätkuvat nihkumist piiravast neutraalse suunas.
FedWatchis kajastuvad turuootused liiguvad endiselt Föderaalreservist eespool.
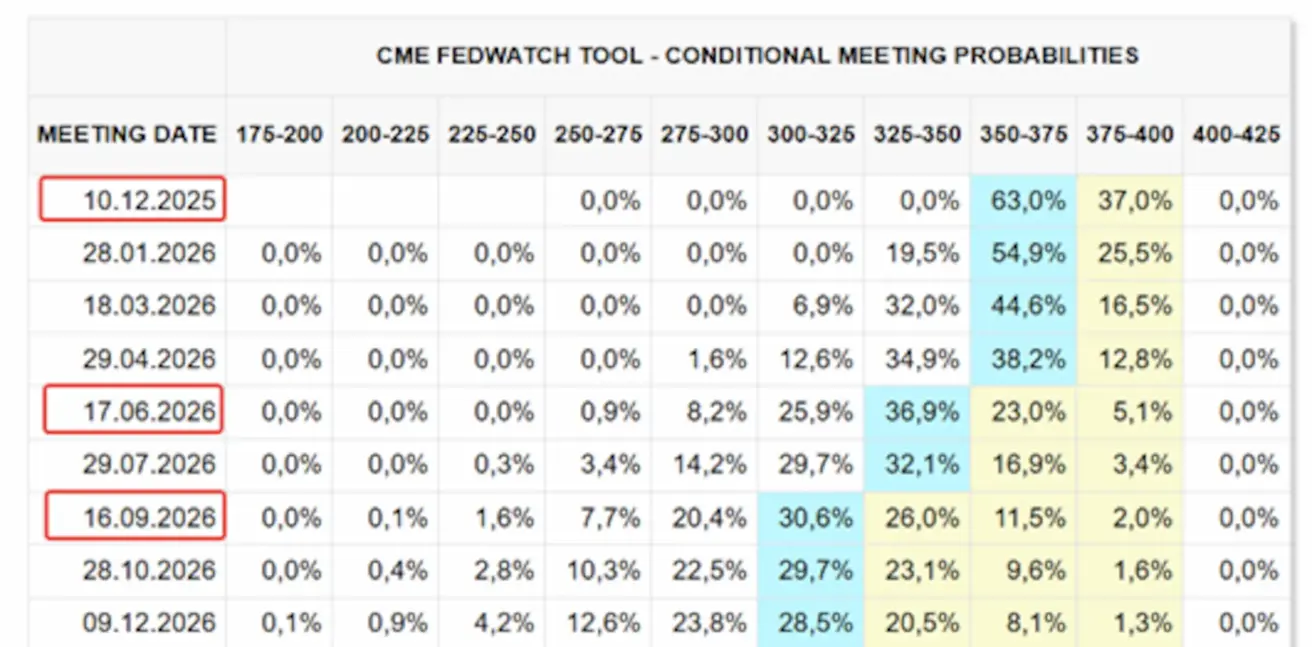
- Järgmise kohtumise (10. detsember) jaoks: 0,25% intressimäära kärpe hinnanguline tõenäosus on 64,9%.
- Järgmise 12 kuu jooksul: oodatakse kolme 0,25% kärbet, mis tooks sihtvahemiku tasemele 3,00–3,25%.
Turg
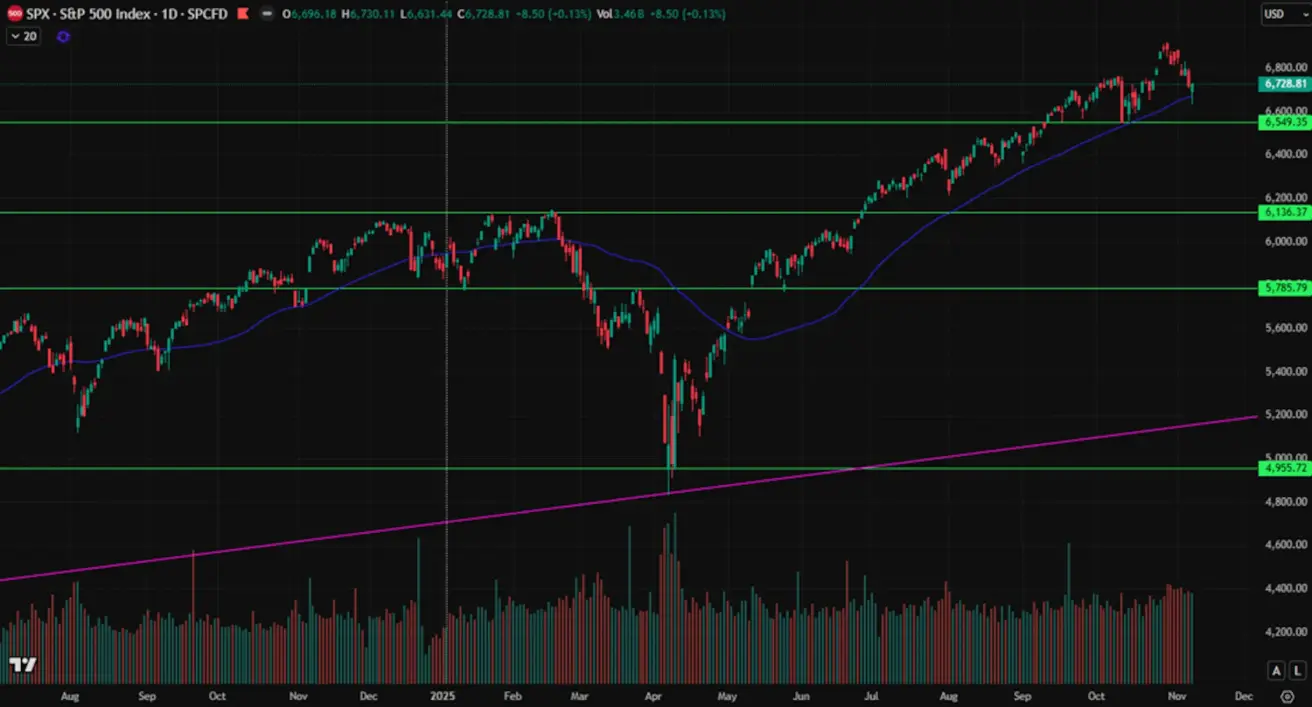
SP500
Nädala tootlus — -1,63% (nädal sulgus tasemel 6 728,81). 2025. aasta algusest kumulatiivne tootlus: +13,98%.
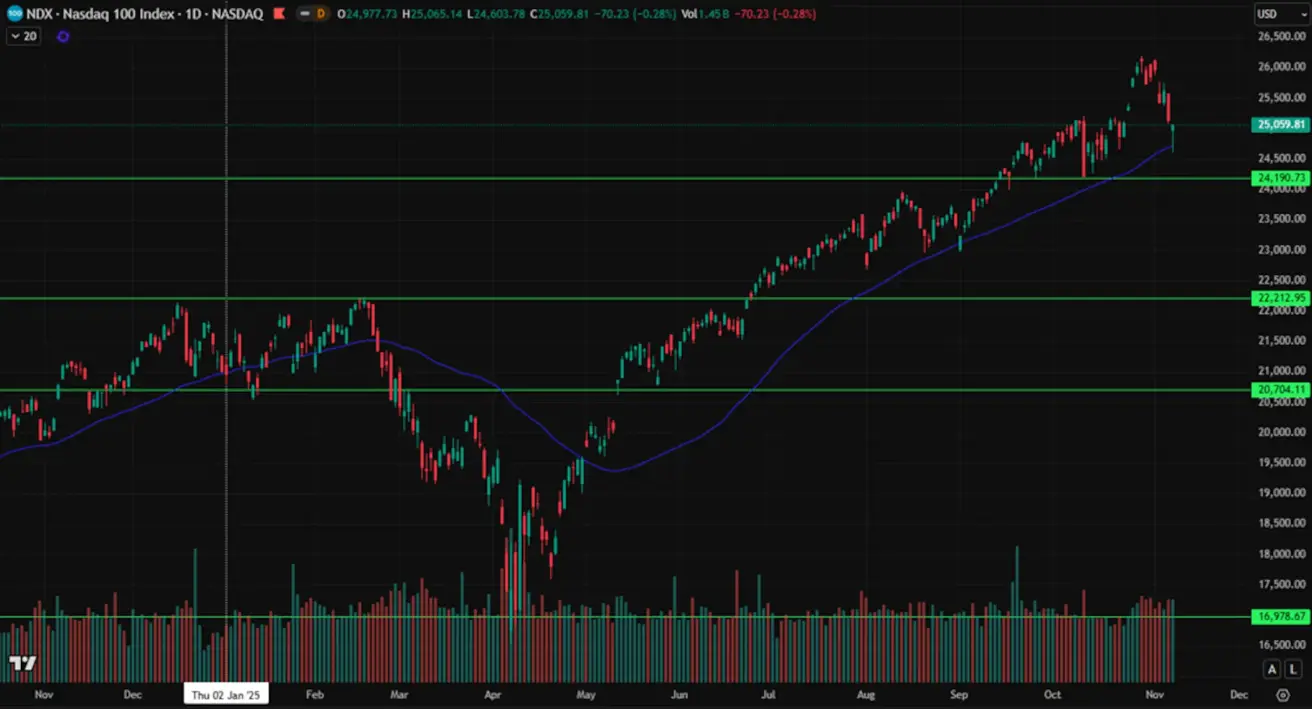
NASDAQ100
Nädala tootlus — -3,09% (nädal sulgus tasemel 25 059,81). Aasta algusest kumulatiivne tootlus: +18,65%.
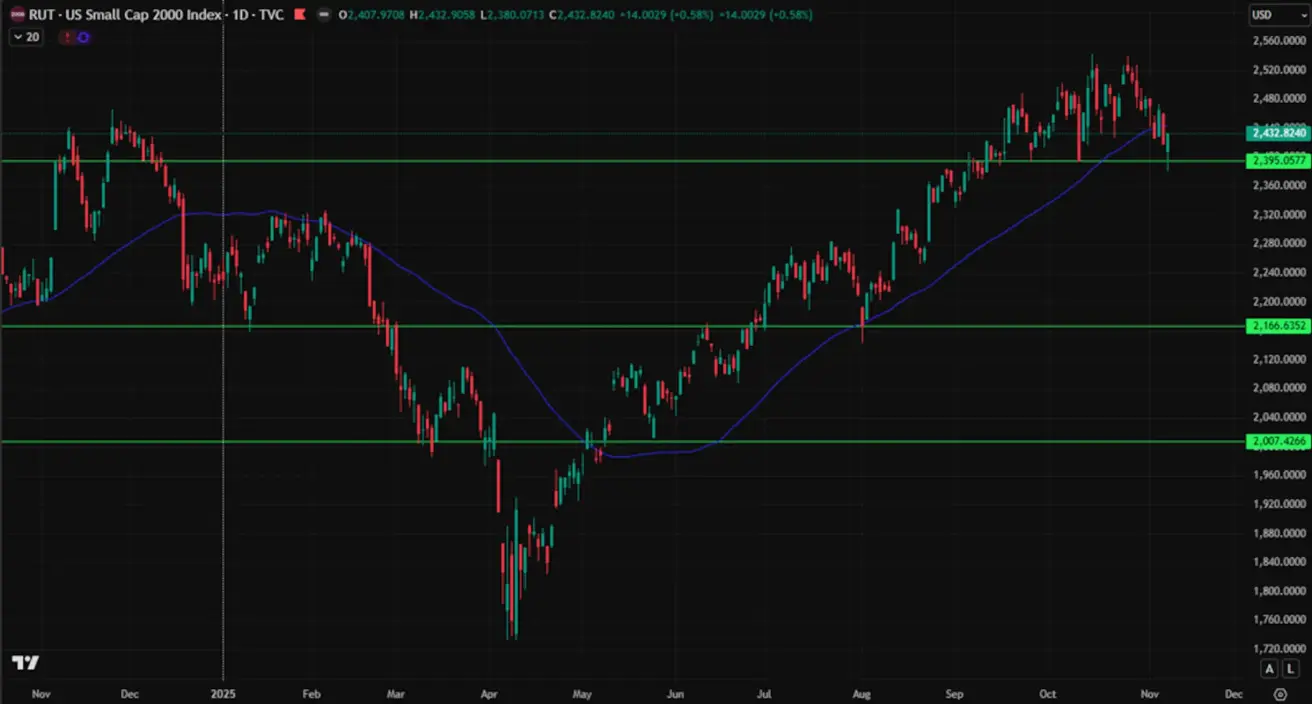
RUSSEL 2000
Nädala tootlus — -1,88% (nädal sulgus tasemel 2 432,824). Aasta algusest kumulatiivne tootlus: +8,55%.
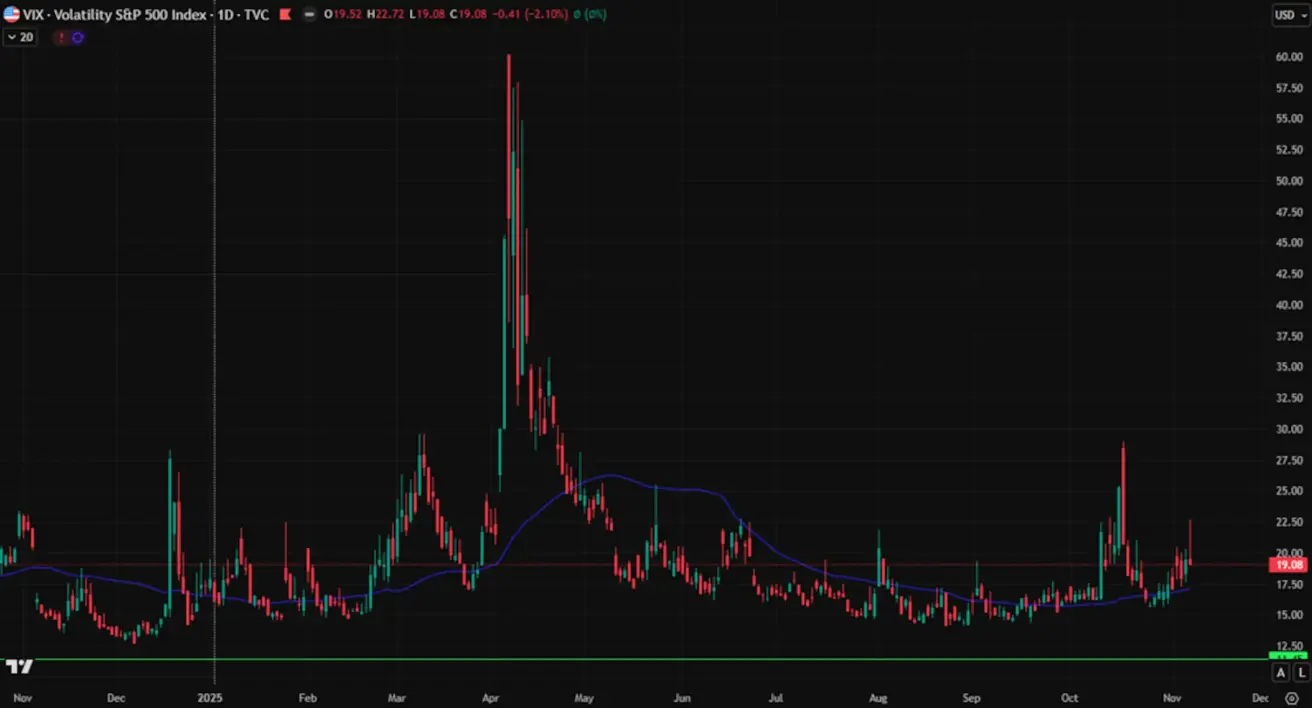
VIX
Nädal sulgus tasemel: 19,08
EL
Viimasel istungil jättis Euroopa Keskpank (ECB) intressimäärad muutmata ja säilitas ettevaatliku tooni, märkides, et kehtiv poliitika on piisav, et hoida hinnad sihttasemele lähedal. Pärast seda kommunikatsiooni hinnastavad turud nüüd pikemaajalist neutraalset rahapoliitikat.
Intressimäärad:
- Hoiusemäär: 2,0% (eelmine: 2,0%)
- Äärmine laenamise määr (marginal lending rate): 2,4% (eelmine: 2,4%)
- Lühiajaline (põhi)refinantseerimismäär: 2,15% (eelmine: 2,15%)
Inflatsioon:
- Consumer Price Index (CPI), y/y (oktoober): 2,2% (eelmine: 2,1%)
SKP (Q3):
- q/q: 0,2% (eelmine: 0,1%)
- y/y: 1,3% (eelmine: 1,5%)
Tööpuuduse määr (september): 6,3% (eelmine: 6,3%)
EURO STOXX 600
Nädala tootlus — -0,61% (nädal sulgus tasemel 569,6). Aasta algusest kumulatiivne tootlus: +12,66%.

Hiina
Purchasing Managers’ Index (PMI), oktoober:
- Teenindussektor: 50,1 (eelmine: 50,0)
- Töötleva tööstuse sektor: 49,0 (eelmine: 49,8)
- Koondindeks: 54,8 (eelmine: 53,9)
Inflatsioon (CPI), oktoober:
- Consumer Price Index (m/m): 0,2% (eelmine: -0,3%)
- Consumer Price Index (y/y): 0,2% (eelmine: 0,1%)
- Producer Price Index (PPI, y/y): -2,1% (eelmine: -2,3%)
CSI 300 indeks
Nädala tootlus — +0,82% (nädal sulgus tasemel 4 678,7944). Aasta algusest kumulatiivne tootlus: +19,02%.

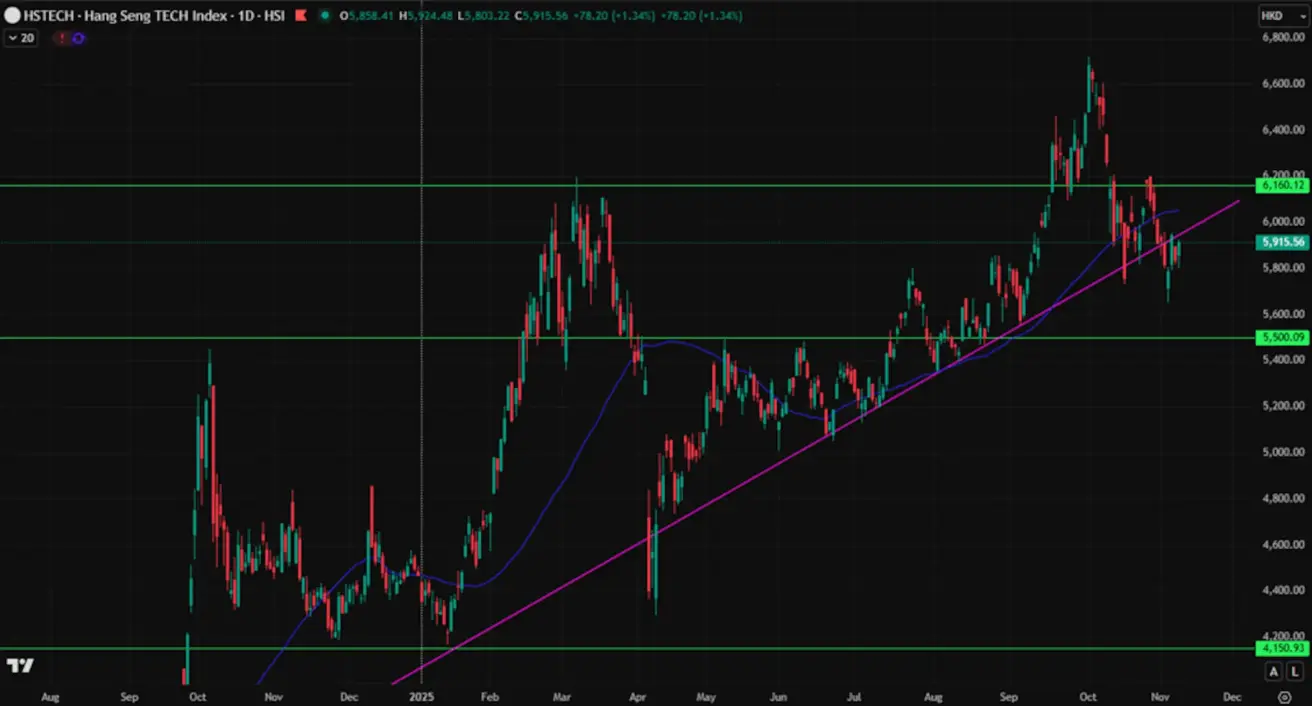
Hang Seng TECH Index (HSTECH.HK)
Nädala tootlus — -1,20% (nädal sulgus tasemel 5 837,36). Aasta algusest kumulatiivne tootlus: +31,57%.
VÕLAKIRJATURG
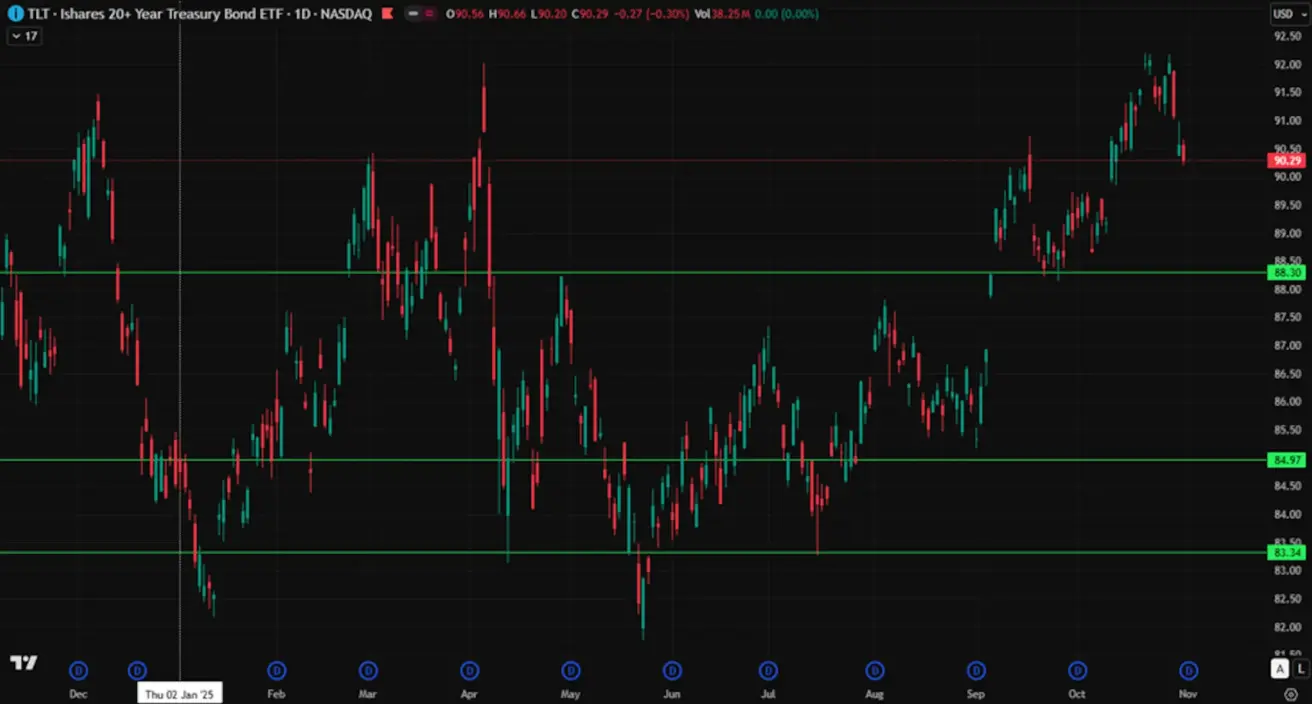
Võlakirjaturg — tulususte tõus pärast Fedi kohtumist
Treasury Bonds 20+ (ETF TLT): nädala tootlus — -0,8% (nädal sulgus tasemel 89,57). Aasta algusest kumulatiivne tootlus: +2,02%.
- Market Yield on U.S. Treasury Securities, 10-Year Constant Maturity: 4,13% (vs 4,10%)
- 2-Year Treasury Yield: 3,61% (vs 3,51%)
- ICE BofA BBB U.S. Corporate Index Effective Yield: 5,03% (vs 4,97%)
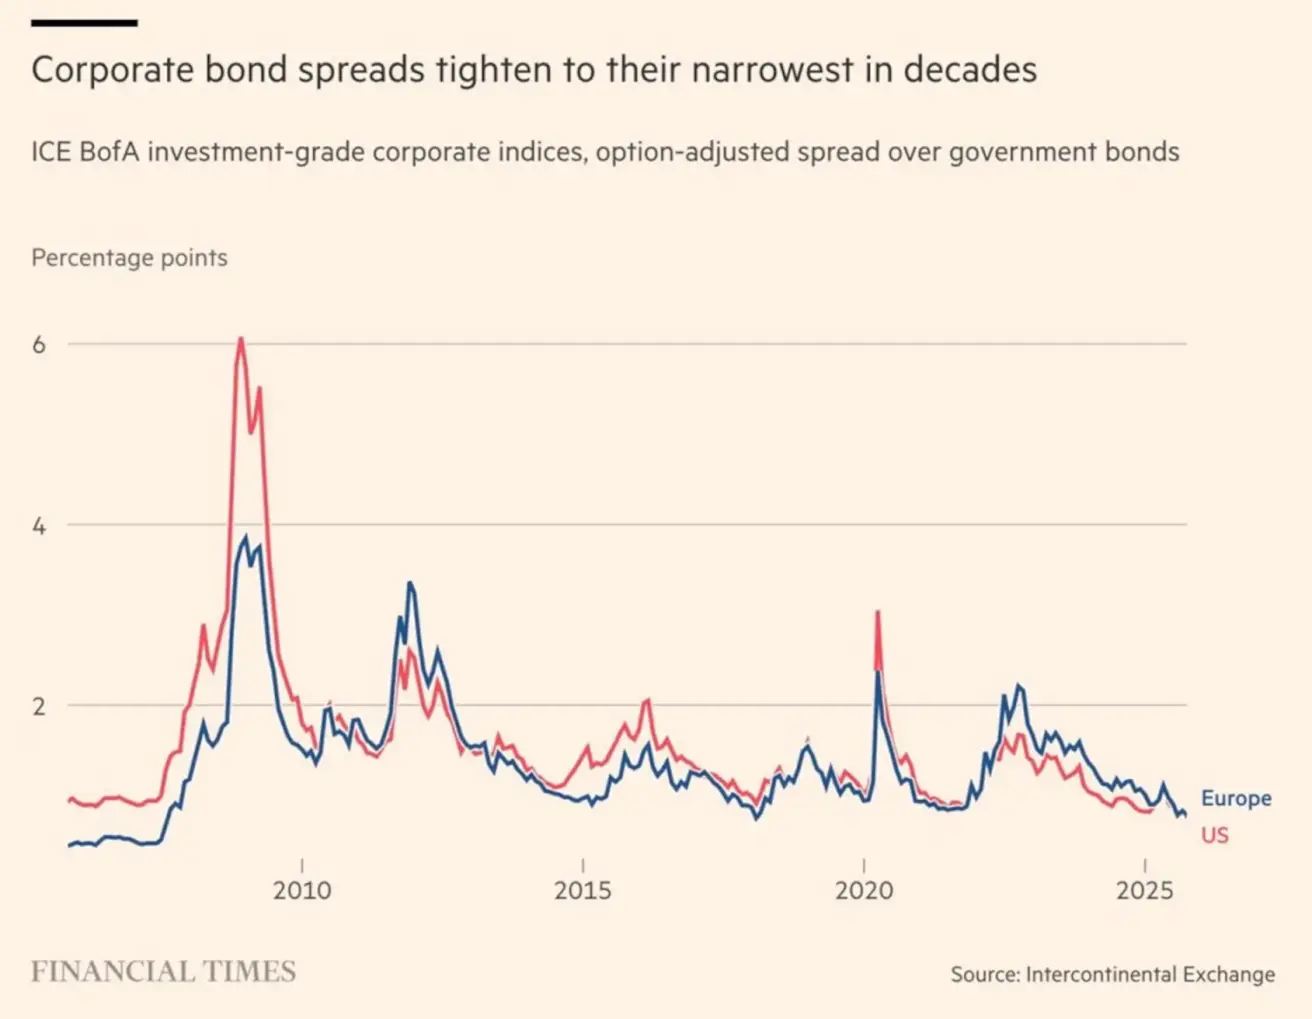
Krediidimarginaalid USA ja Euroopa ettevõtete võlakirjasektorites püsivad madalaimal tasemel alates 1998. aastast, mis viitab jätkuvale investorite optimismile. Turuosalised ei hinda sisse riskipreemiat ega eelda reaalmajanduses ettevõtete maksejõuetuste lainet.
Tulusused ja spread’id
- Market Yield on U.S. Treasury Securities, 10-Year Constant Maturity: 4,13% (vs 4,10%). 2-Year Treasury Yield: 3,61% (vs 3,51%)
- ICE BofA BBB U.S. Corporate Index Effective Yield: 5,03% (vs 4,97%)
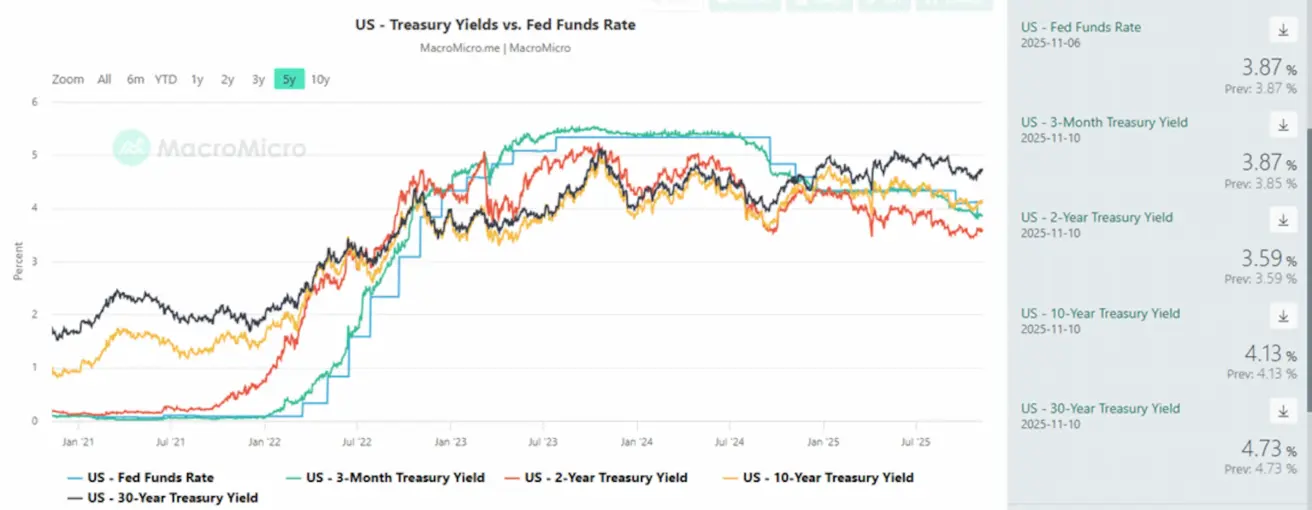
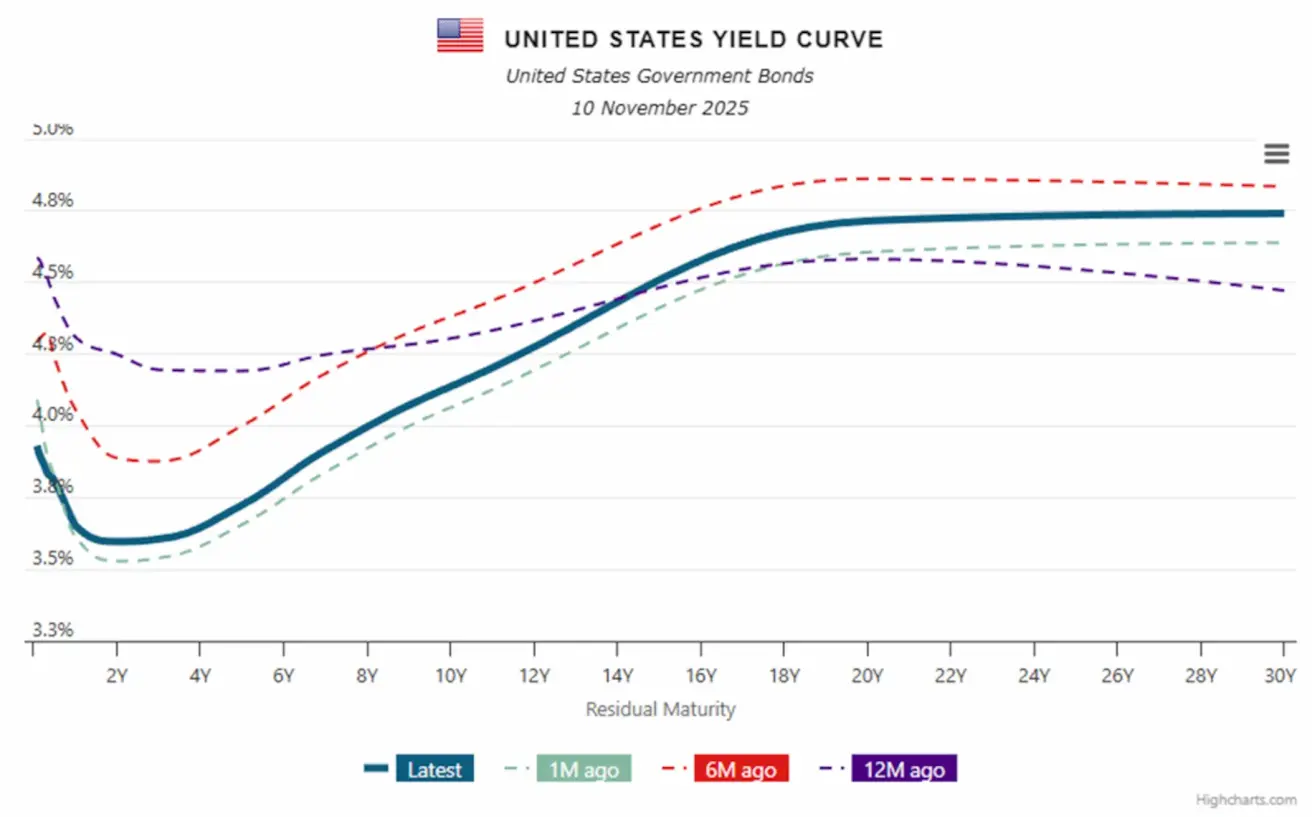
10-aastaste ja 2-aastaste USA riigivõlakirjade tulususte vahe on 54,0 baaspunkti (vs 52,0 bp).
- 10-aastaste ja 3-kuuliste USA riigivõlakirjade tulususte vahe on 26,0 baaspunkti (vs 15,0 bp).
- 5-aastase USA Credit Default Swap’i (CDS) — maksejõuetuskindlustuse — hind on 35,06 bp (vs 35,96 bp eelmisel nädalal).
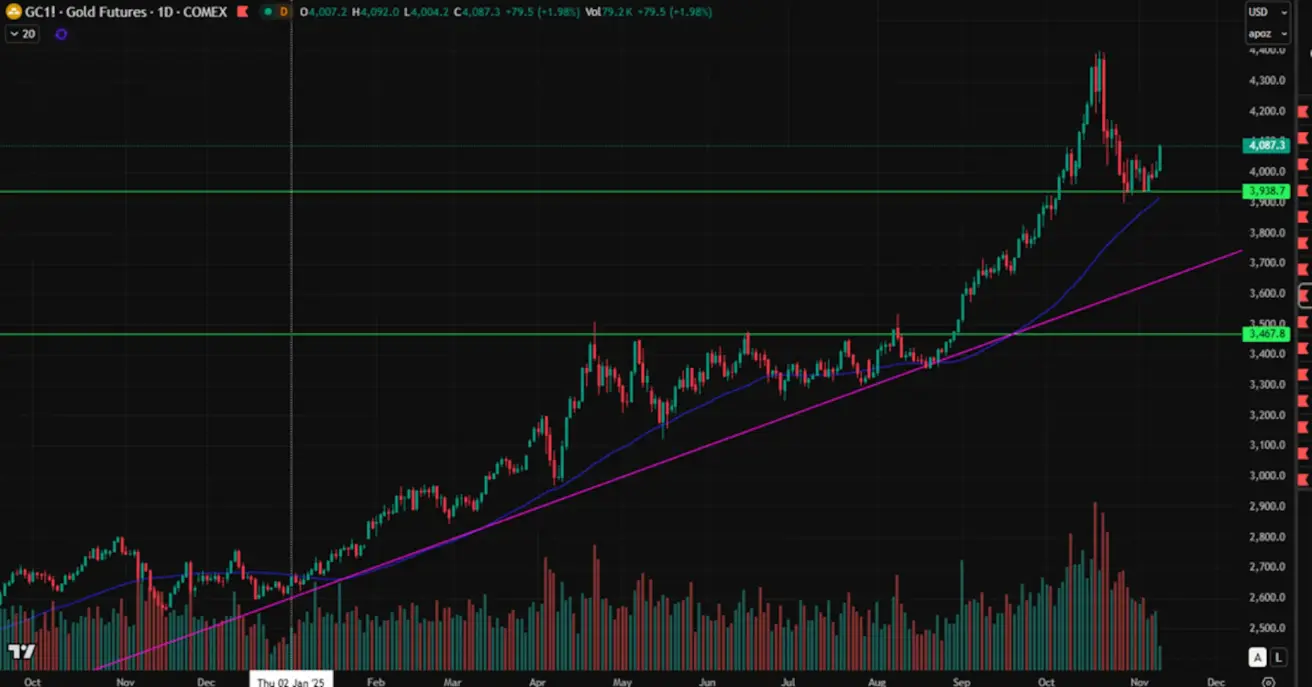
KULLAFUTUURID (GC)
Gold Futures (GC): nädala tootlus — -0,14% (nädal sulgus tasemel 4 007,8 USA dollarit troi untsi kohta). Aasta algusest kumulatiivne tootlus: +51,75%.
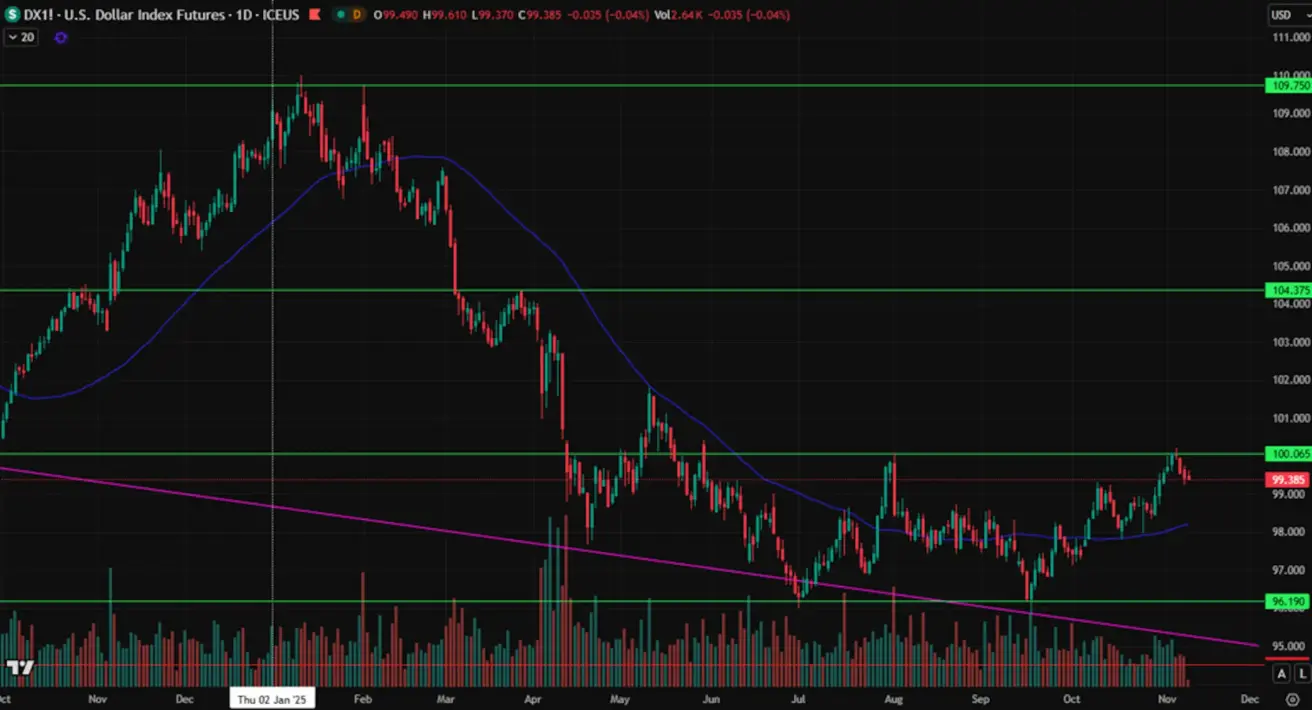
DOLLARIINDEKSI FUTUURID (DX)
Nädala tootlus — -0,13% (nädal sulgus tasemel 99,42). Aasta algusest kumulatiivne tootlus: -8,22%.
NAFTAFUTUURID
Nädala tootlus — -1,71% (nädal sulgus tasemel 69,84 USA dollarit barreli eest). Aasta algusest kumulatiivne tootlus: -16,72%.

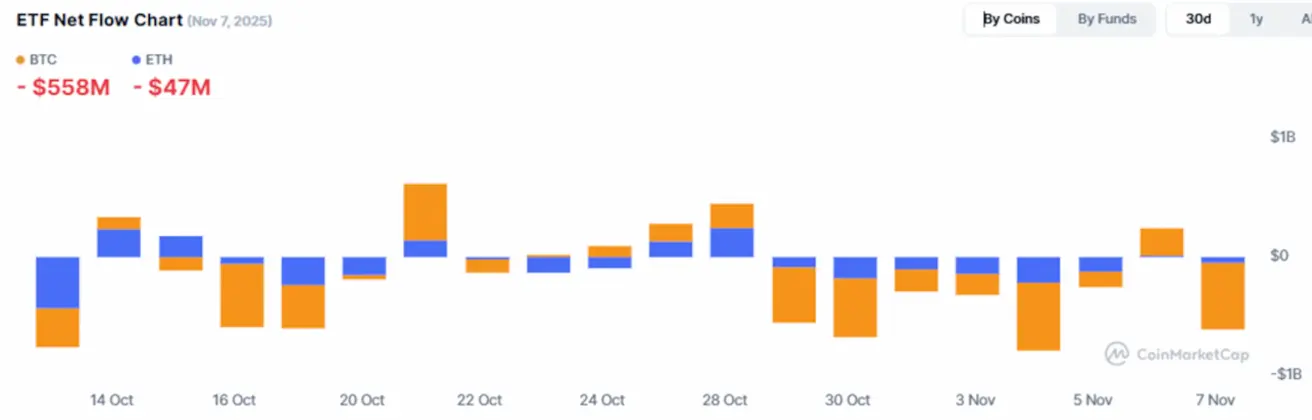
BTC FUTUURID
Nädala tootlus (seisuga reede) — -4,59% (nädal sulgus tasemel 104 780 USA dollarit). Aasta algusest kumulatiivne tootlus: +11,76%.

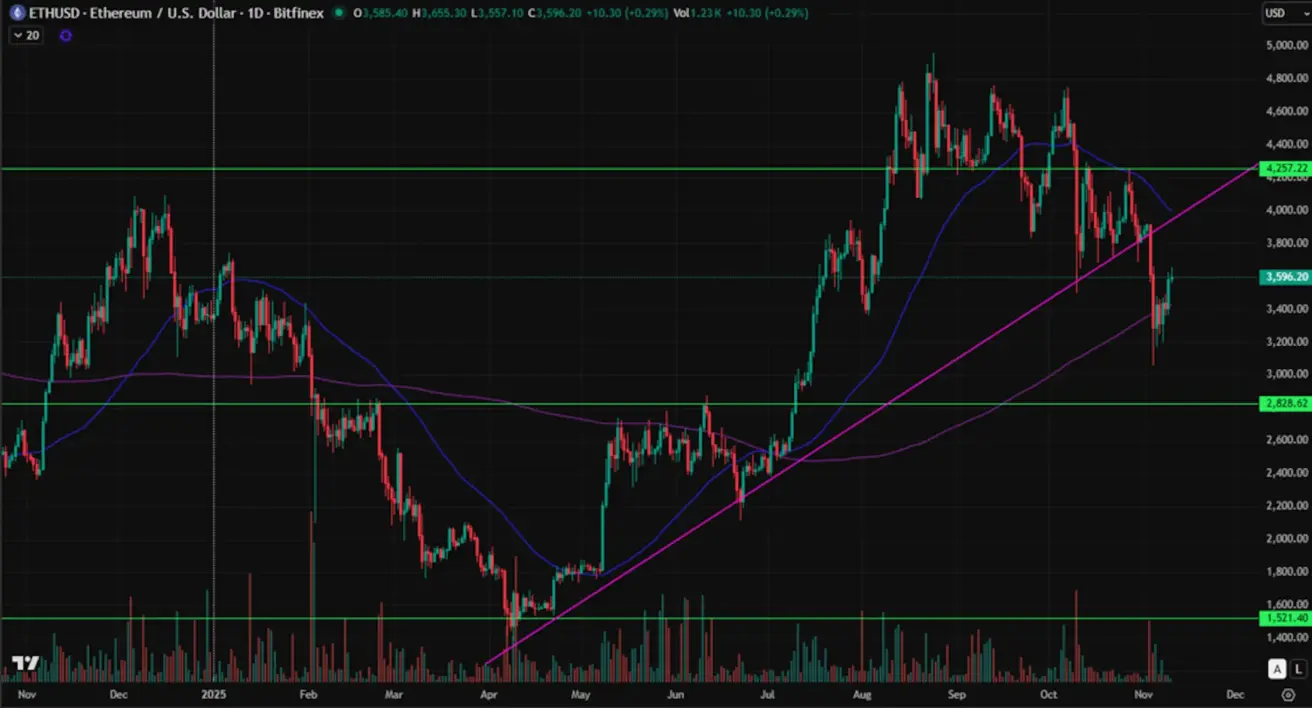
ETH FUTUURID
Nädala tootlus — -7,00% (nädal sulgus tasemel 3 585,9 USA dollarit). Aasta algusest kumulatiivne tootlus: +7,23%.
Krüptovaluutaturu kogukapitalisatsioon: 3,57 triljonit USA dollarit (vs 3,70 triljonit USA dollarit nädal varem, allikas coinmarketcap.com).
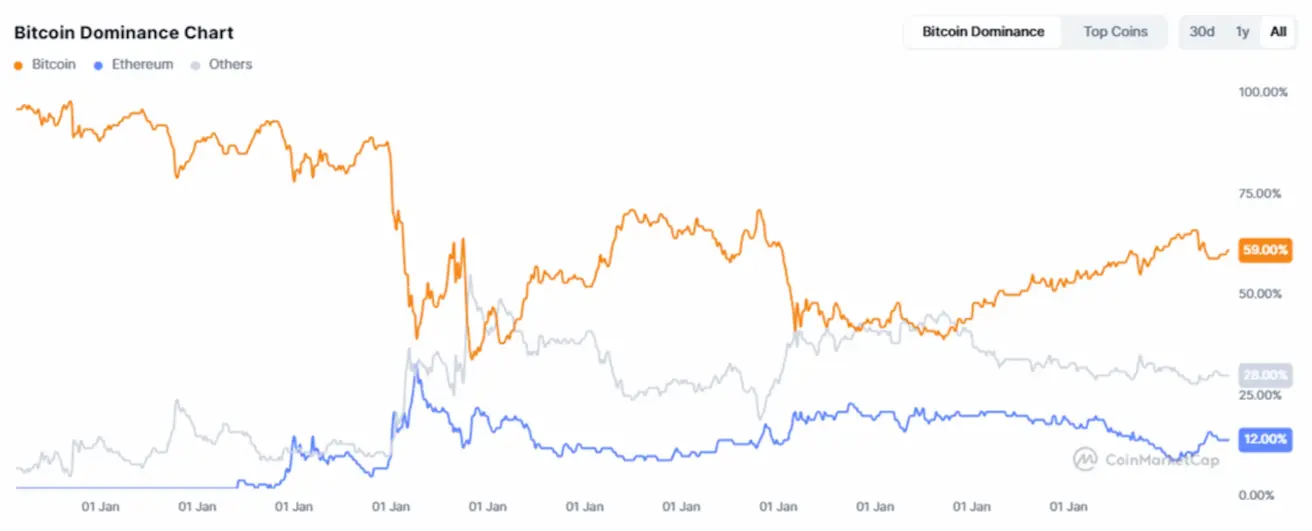
Turujagud:
- Bitcoin: 59,3% (eelmine: 59,2%)
- Ethereum: 12,2% (eelmine: 12,6%)
- Muud varad: 28,6% (eelmine: 28,2%)
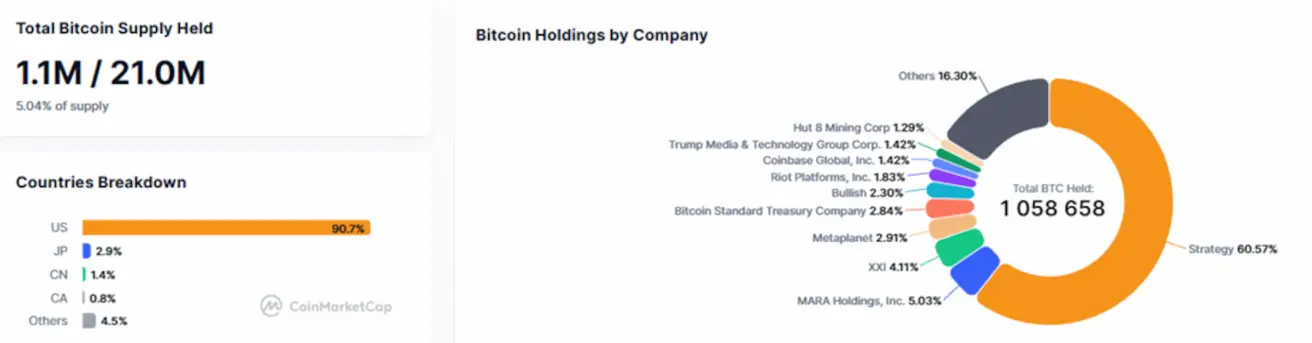
Avalikud ettevõtted, millel on Bitcoin’i reservistrateegiad:
Ettevõtete bilanssides hoitavate bitcoinide osakaal jääb muutumatuks 5,04% tasemele (vs 5,03% eelmisel nädalal) kogu ringluses olevast bitcoin’i pakkumisest.