 English
 Русский
 Қазақша
 Eesti
Eesti2026 m. balandžio 27 d. – gegužės 1 d.: Savaitinė ekonominė apžvalga
Svarbiausios rinkos naujienos

Praėjusią savaitę įvyko trečiasis FOMC posėdis, kurio metu, kaip tikėtasi, bazinė palūkanų norma buvo palikta nepakitusi 3,50–3,75 % intervale.
Jerome Powell retorika buvo vidutiniškai griežta; tačiau šiandien rinkos dėmesys sutelktas į lūkesčius dėl Kevin Warsh pinigų politikos pozicijos, kuris jau perėjo Senato balsavimą ir, tikėtina, taps kitu Federalinio rezervo pirmininku.
Šiuo etapu lieka neaišku, kokios politikos jis laikysis. Viena vertus, jis laikomas Trump globotiniu; kita vertus, ankstesnės kadencijos metu Federaliniame rezerve jis priešinosi kiekybinio skatinimo (QE) programoms ir žemoms palūkanų normoms. Būtent dėl nesutarimų dėl politikos jis pasitraukė iš Federalinio rezervo.
Makroekonominiai duomenys. JAV (pagrindinės įžvalgos):
- Palūkanų normos nepakitusios; retorika išlieka atsargi;
- Pinigų politikos pozicija išlieka vidutiniškai griežta;
- JAV makroekonominiai duomenys palaiko švelnaus nusileidimo scenarijų: infliacijos rizikos didėja, darbo rinka vėsta be recesijos požymių ir kol kas nesudaro pagrindo mažinti palūkanų normas.
Makroekonominė statistika
INFLIACIJA: VARTOTOJŲ KAINŲ INDEKSAS (KOVAS):
- Bazinis VKI: (mėn./mėn.) 0,2 % (ankst.: 0,2 %); (met./met.) 2,6 % (ankst.: 2,5 %).
- VKI: (mėn./mėn.) 0,9 % (ankst.: 0,3 %); (met./met.) 3,3 % (ankst.: 2,4 %).
GAMINTOJŲ KAINŲ INDEKSAS (KOVAS):
- GKI (mėn./mėn.): 0,5 %, ankst.: 0,7 %.
- Bazinis GKI (mėn./mėn.): 0,1 %, ankst.: 0,3 %:
INFLIACIJOS LŪKESČIAI (MICHIGANAS) (KOVAS):
- 12 mėn. infliacijos lūkesčiai: 4,7 % (ankst.: 3,8 %);
- 5 metų infliacijos lūkesčiai: 3,5 % (ankst.: 3,2 %).
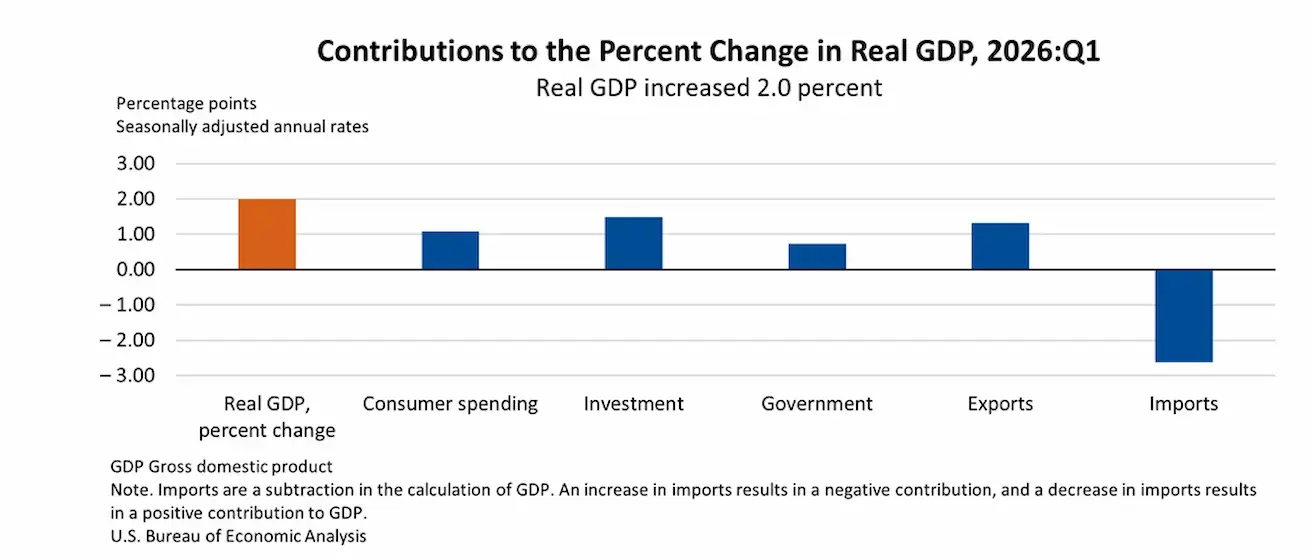
BVP (JAV Ekonominės analizės biuras, BEA) (I ketv. 2025 m., metinis, preliminarus įvertis): +2,0 % (IV ketv. 2025 m.: +0,5 %); prognozė: 2,2 %.
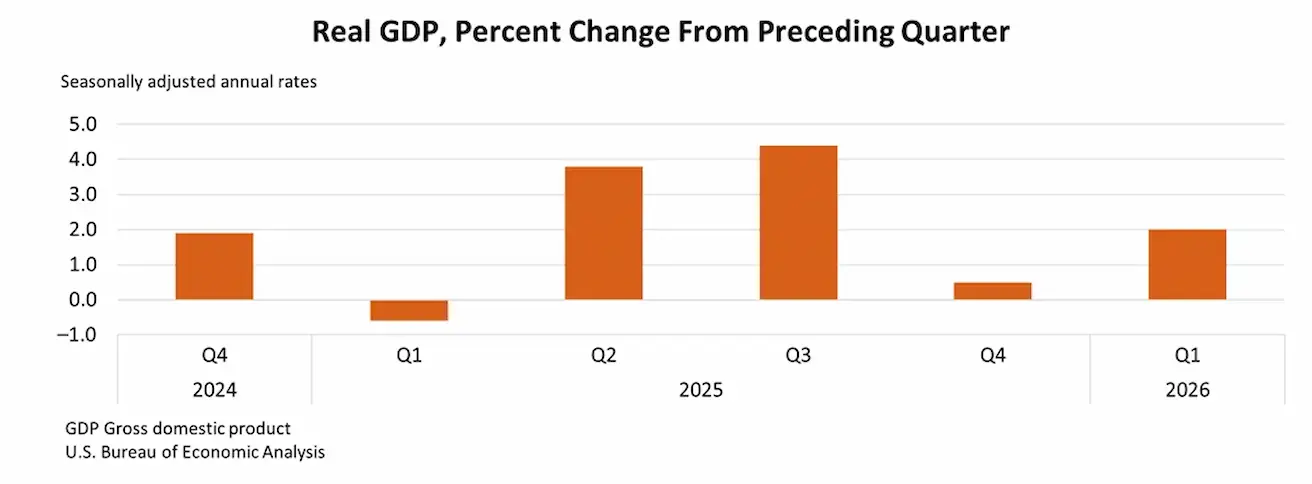
Pagrindiniai realaus BVP augimo pirmąjį ketvirtį veiksniai buvo investicijos, eksportas, vartojimo išlaidos ir vyriausybės išlaidos. Importas, kuris iš BVP yra atimamas, taip pat padidėjo.
Atlanta Fed GDPNow rodiklis („realaus laiko“ oficialaus BVP įvertis iki paskelbimo): 3,7 % (ankst.: 1,2 %).
JAV bazinis asmeninio vartojimo išlaidų (PCE) kainų indeksas (I ketv.): 4,3 % (ankst.: 2,7 %); metinis balandžio pokytis: 3,2 % (ankst.: 3,0 %).
JAV bendras asmeninio vartojimo išlaidų (PCE) kainų indeksas (I ketv., metinis pokytis): 3,5 % (ankst.: 2,8 %).
VERSLO AKTYVUMO INDEKSAS (PMI)(BALANDIS, PRELIMINARŪS DUOMENYS):
(Virš 50 rodo plėtrą; žemiau 50 – susitraukimą)
- Paslaugų sektorius: 51,3 (ankst.: 49,8);
- Gamybos sektorius: 54,0 (ankst.: 52,3);
- S&P Global Composite: 52,0 (ankst.: 50,3).
DARBO RINKA (BLS) (KOVAS)
- Nedarbo lygis: 4,3 % (ankst.: 4,4 %);
- Bendras tęstinių bedarbių paraiškų skaičius JAV: 1 785 tūkst. (ankst.: 1 818 tūkst.);
- Pradinių bedarbių paraiškų skaičius: 189 tūkst. (ankst.: 215 tūkst.);
- Ne žemės ūkio sektoriaus darbo vietų pokytis: 178 tūkst. (ankst.: -133 tūkst.);
- Privačių ne žemės ūkio sektoriaus darbo vietų pokytis: 186 tūkst. (ankst.: -129 tūkst.);
- Vidutinis valandinis darbo užmokestis (met./met.): 3,5 % (ankst.: 3,8 %);
- JOLTS laisvų darbo vietų skaičius: 6,542 mln. (ankst.: 6,928 mln.).
PINIGŲ POLITIKA
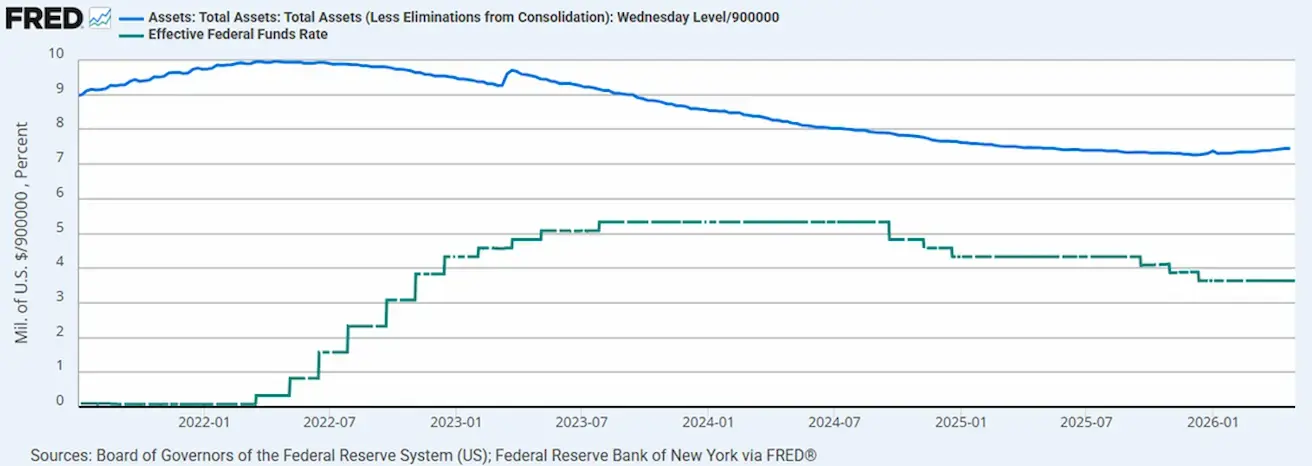
- Efektyvioji federalinių fondų palūkanų norma (EFFR): 3,50 %–3,75 %;
- Federalinio rezervo balansas siekia 6,699 trln. JAV dolerių, t. y. 2,51 % daugiau nuo kiekybinio griežtinimo (QT) sustabdymo (6,535 trln. JAV dolerių).
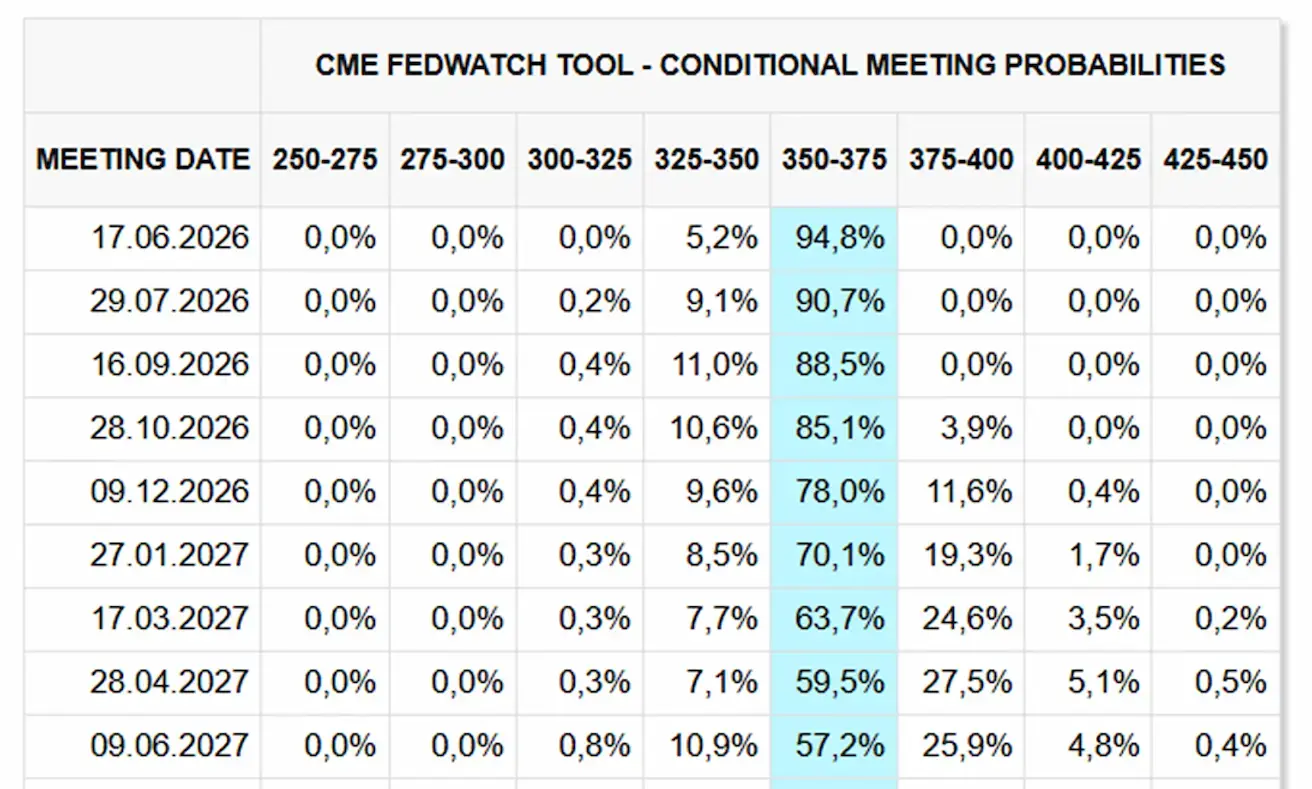
RINKOS PALŪKANŲ NORMOS PROGNOZĖ (FEDWATCH)
Kitame posėdyje (birželio 17 d.) tikimybė, kad norma liks nepakitusi, siekia 94,78 %.
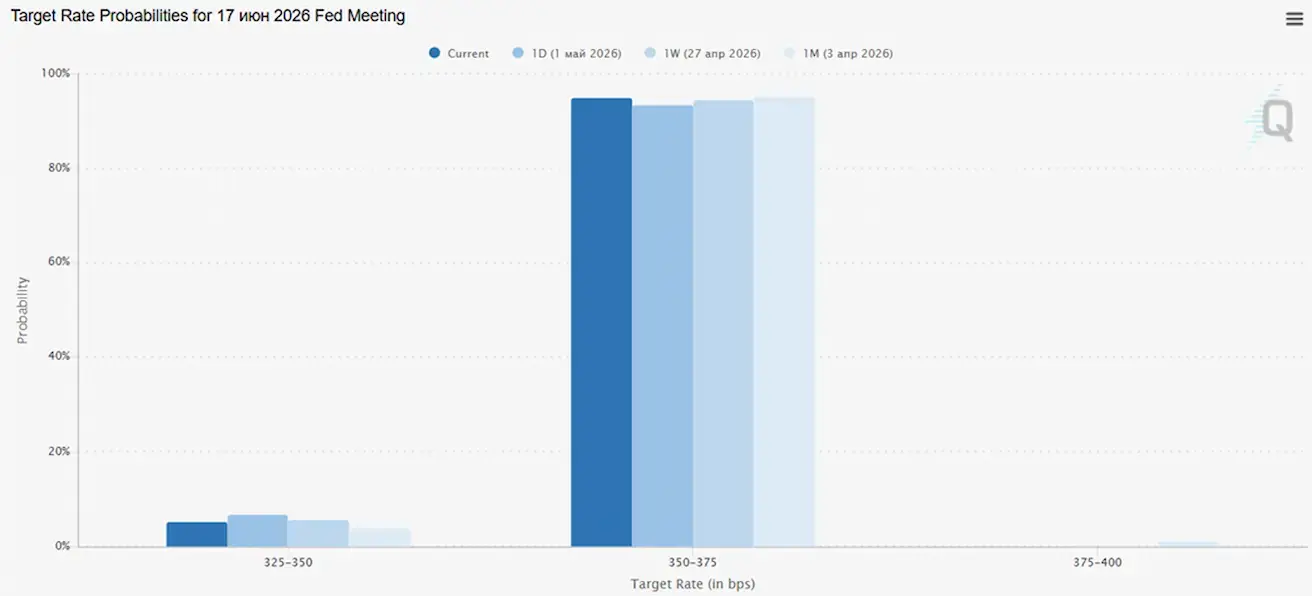
Per artimiausius 12 mėnesių rinka šiuo metu nenumato palūkanų normų mažinimo ir nesitiki jų didinimo.
Rinka
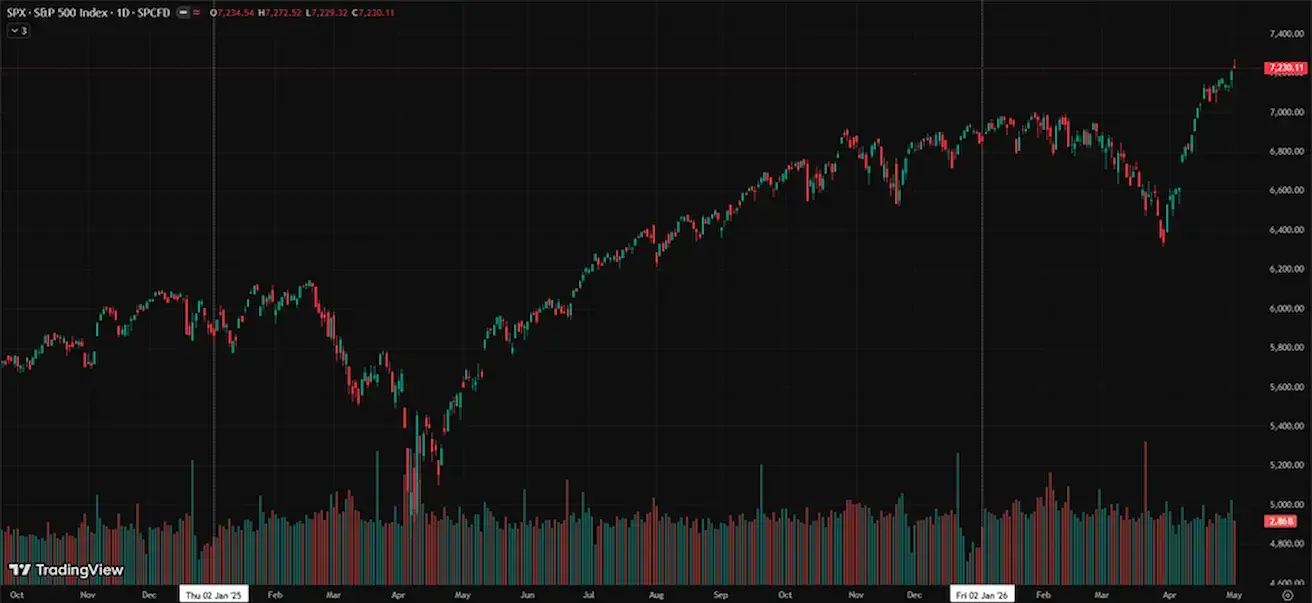
SP500
Savaitės rezultatas: +0,91 % (savaitės pabaigos kaina 7230,11); nuo metų pradžios: +5,62 %.
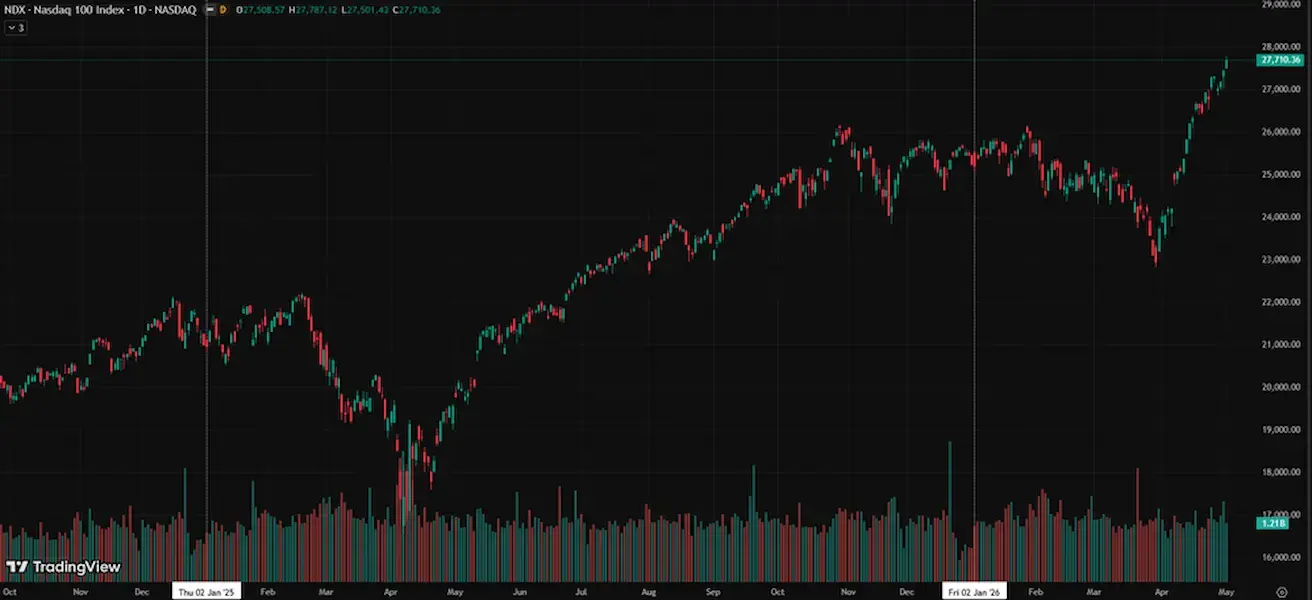
NASDAQ100
Savaitės rezultatas: +1,49 % (savaitės pabaigos kaina 27710,36); nuo metų pradžios: +9,74 %.
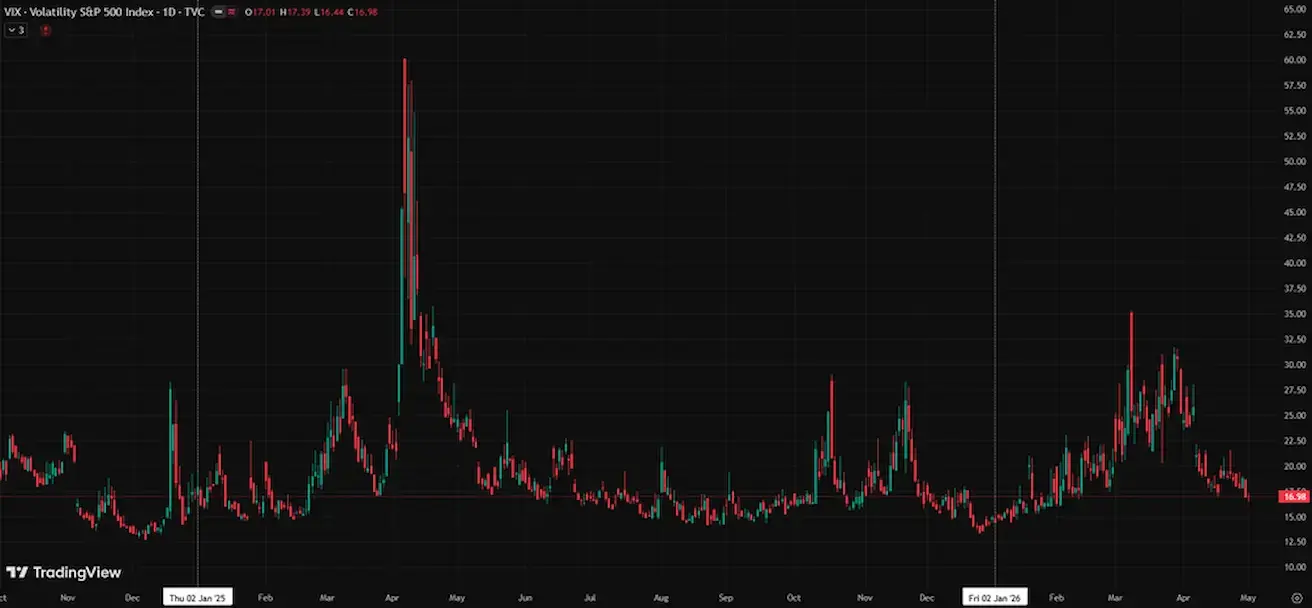
VIX
VIX (volatilumo indeksas): savaitės pabaigos reikšmė – 16,98 punkto.
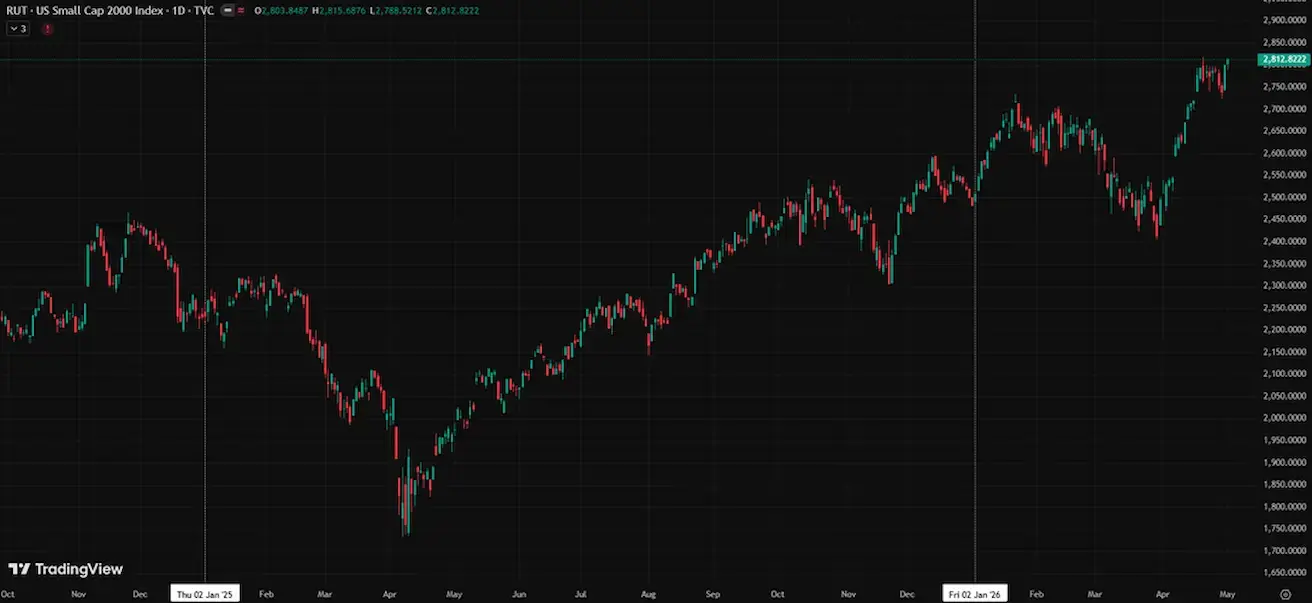
RUSSEL 2000 (RUT)
Savaitės rezultatas: +0,93 % (savaitės pabaigos kaina 2812,822); nuo metų pradžios: +13,33 %.
Akcijų indeksai kyla dėl stiprių rezultatų per vykstantį pelno skelbimo sezoną. Didžiosios technologijų bendrovės toliau pirmauja pelno augime, o įmonės skelbia naujas didelio masto akcijų supirkimo programas (pagrindinis S&P 500 augimo veiksnys).
Investicijų į DI infrastruktūrą mastas iki 2030 m.:
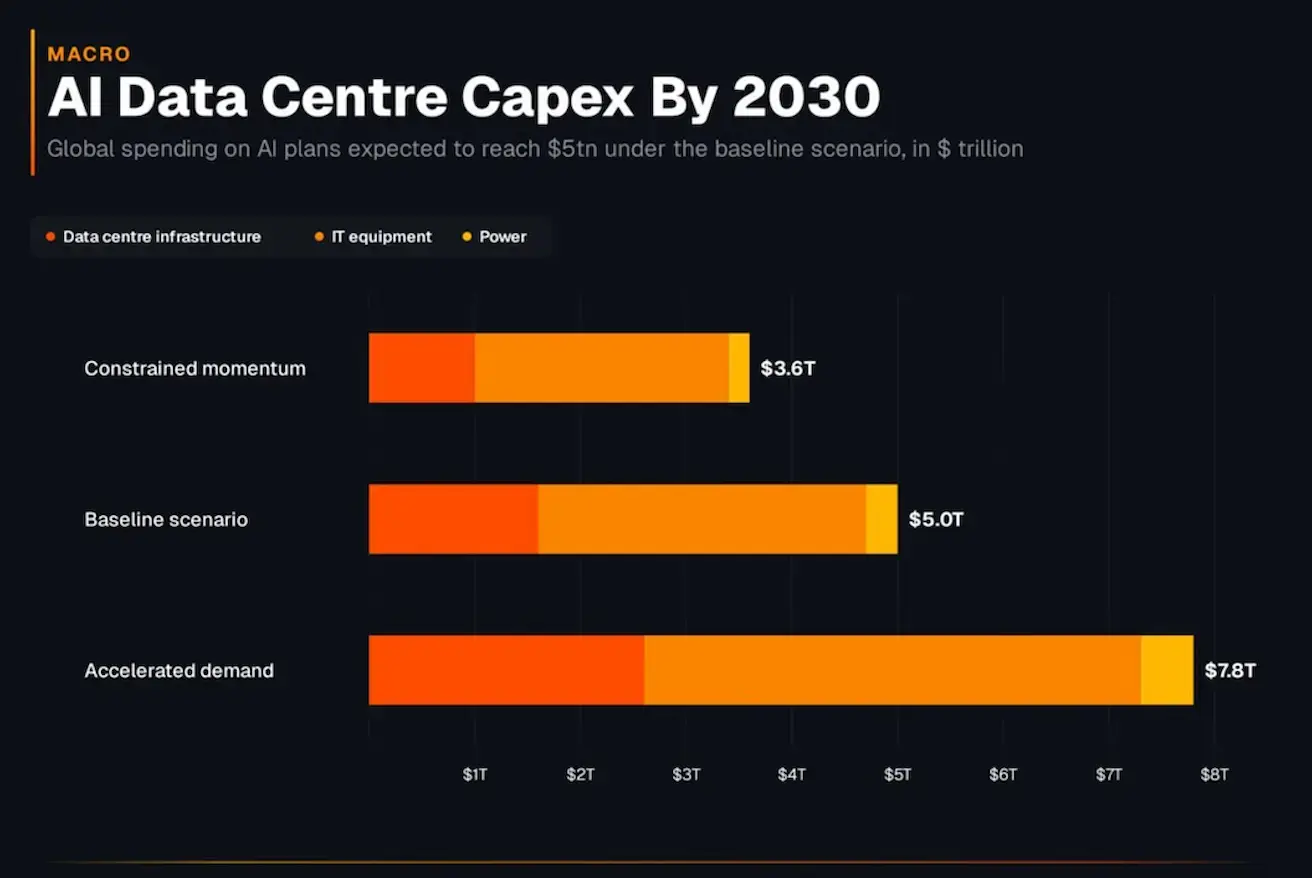
Tai nėra „oficiali ataskaita“, o scenarijų sintezė (Goldman Sachs / McKinsey / pardavimo pusė).
- Oranžinė — infrastruktūra (pastatai);
- Geltona — IT (GPU, serveriai — kapitalo imliausias segmentas);
- Šviesiai geltona — energetika (galia, tinklas, aušinimas). Pagal bazinį scenarijų investicijos į DI infrastruktūrą iki 2030 m. gali viršyti 5+ trln. JAV dolerių, todėl šis technologinis ciklas bus istoriškai kapitalo imlus ir pranoks ankstesnių pramonės ciklų mastą.
Euro zona
- Palūkanų normos kol kas nepakitusios, tačiau infliacijos rizikos didėja;
- Pinigų politikos pozicija neutrali, tačiau rizikų balansas linksta infliacijos kryptimi;
- Didėjant Artimųjų Rytų konflikto įtampai, ECB sumažino BVP prognozes ir padidino infliacijos prognozes artimiausiems metams.
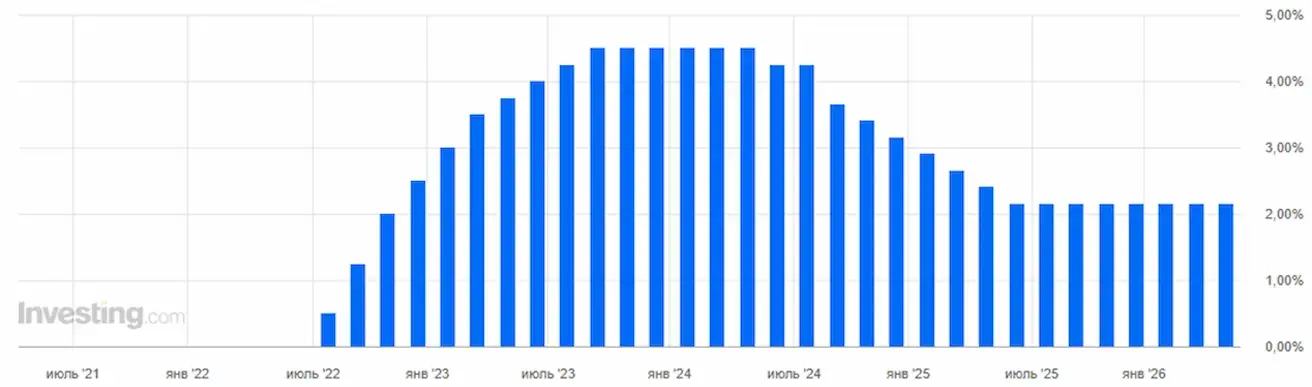
Palūkanų normos
ECB paliko palūkanų normas nepakitusias, tačiau pabrėžė dviejų rizikų didėjimą: spartėjančią infliaciją ir lėtėjantį ekonomikos augimą.
- Indėlių palūkanų norma: 2,0 % (ankst.: 2,0 %);
- Ribinio skolinimosi palūkanų norma: 2,4 % (ankst.: 2,4 %) (norma, už kurią bankai gali skolintis iš reguliuotojo per naktį);
- Trumpalaikė (politikos) norma: 2,15 % (ankst.: 2,15 %).
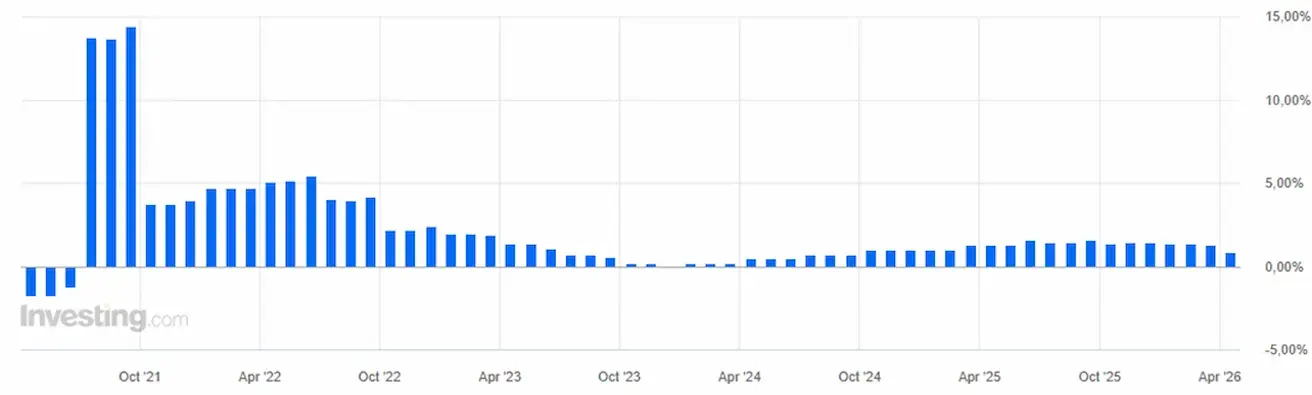
Infliacija: vartotojų kainų indeksas (VKI) (balandis, preliminarūs duomenys):
- Bazinis VKI (met./met.): 2,2 % (ankst.: 2,3 %).
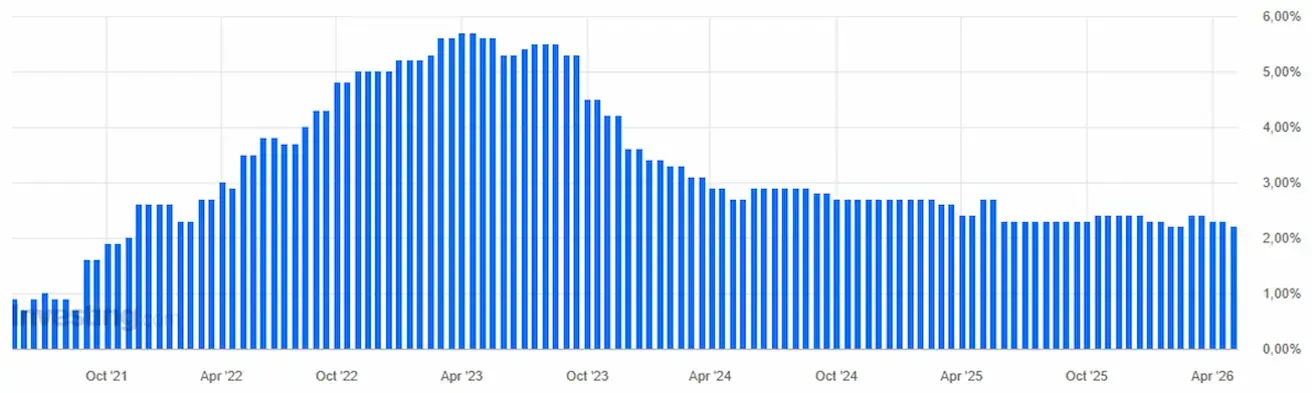
VKI (mėn./mėn.): 1,0 % (ankst.: 1,3 %).
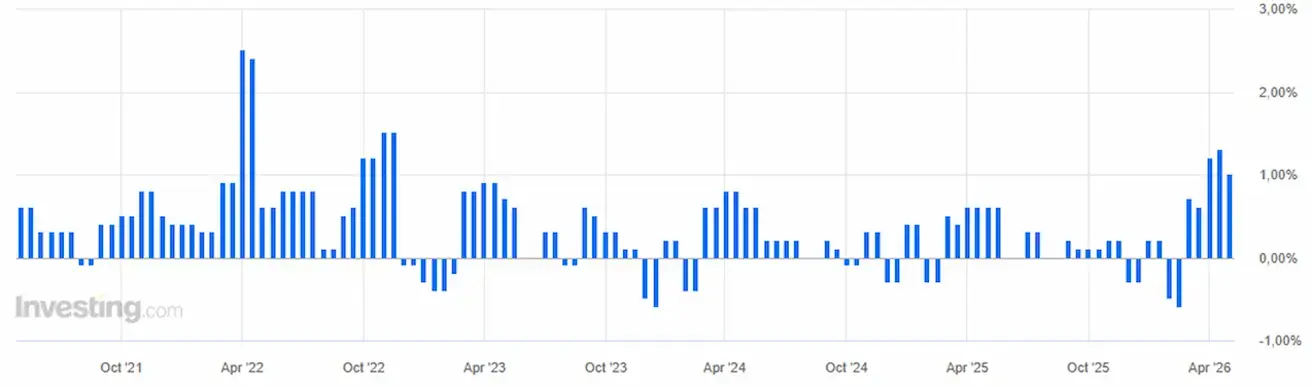
VKI (met./met.): 3,0 % (ankst.: 2,6 %).
BVP I ketv. (preliminarus): ketv./ketv.: 0,1 % (ankst.: 0,2 %, patikslinta); met./met.: 0,8 % (ankst.: 1,2 %).
Nedarbo lygis (kovas): 6,3 % (ankst.: 6,2 %).
Pramonės produkcija (mėn./mėn.) (vasaris): 0,4 % (ankst.: -0,8 %). Pirkimo vadybininkų indeksas (PMI) (balandis): išlieka plėtros zonoje, tačiau lėtėja.
- Paslaugos: 47,4 (ankst.: 50,2);
- Gamyba: 52,2 (ankst.: 51,6);
- S&P Global Composite: 48,6 (ankst.: 50,7).
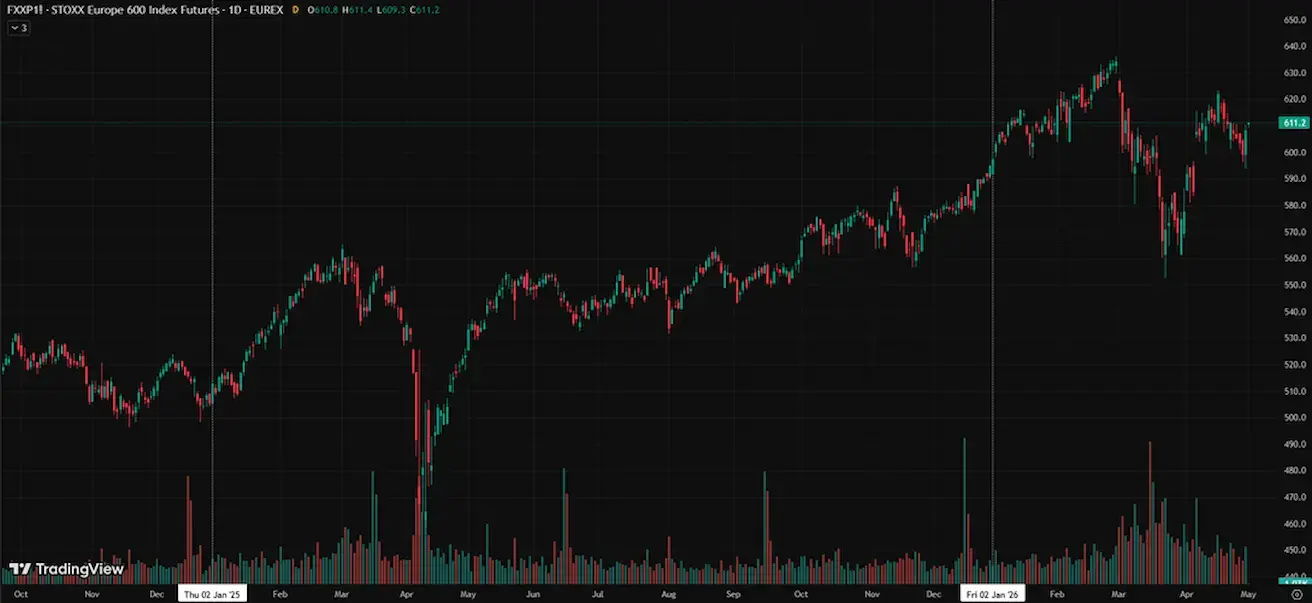
EURO STOXX 600 (FXXP1!)
Savaitės rezultatas: +0,16 % (savaitės pabaigos kaina: 608,2); nuo metų pradžios: +2,39 %.
Kinija
Ekonomika stabilizuojasi dėl eksporto, o vidaus paklausa ir investicijos palaipsniui atsigauna; skatinamosios politikos priemonės išlieka tikslingos ir atsargios.
- Palūkanų normos nepakitusios;
- Pinigų politikos pozicija išlieka skatinamoji;
- Kinija patvirtino tolesnę fiskalinę paramą ekonomikos augimui pagal 2026 m. planą (vidaus paklausos skatinimas, mokesčių lengvatų ir subsidijų optimizavimas, pramonės modernizavimas).
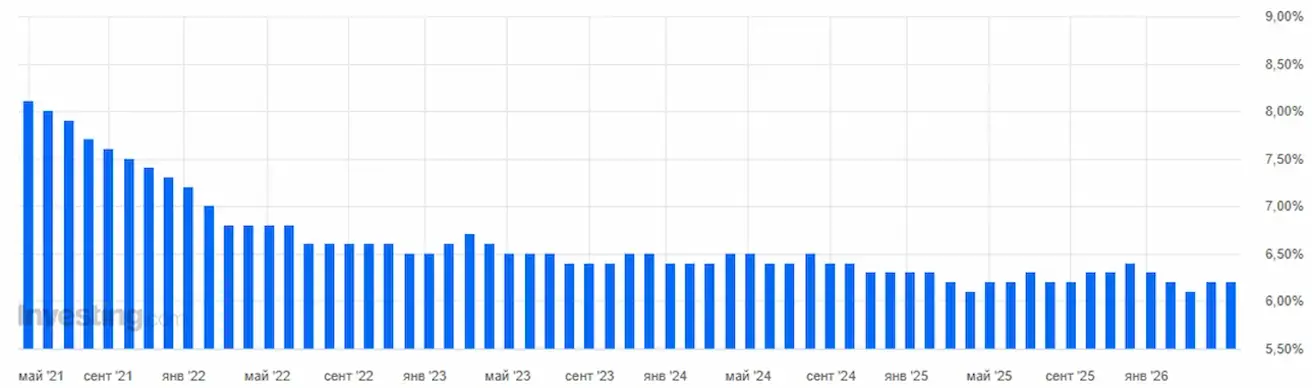
Palūkanų normos:
- 1 m. paskolų bazinė norma (vidutinės trukmės skolinimas): 3,00 %;
- 5 m. paskolų bazinė norma (įtakoja būsto paskolas): 3,50 %.
Infliacijos rodikliai (kovas):
- Vartotojų kainų indeksas (VKI): mėn./mėn.: -0,7 % (ankst.: 1,0 %); met./met.: 1,0 % (ankst.: 1,3 %);
- Gamybos kainų indeksas (GKI) (met./met.): -0,5 % (ankst.: -0,9 %).
BVP I ketv. 2026 m.: ketv./ketv.: 1,3 % (ankst.: 1,2 %); met./met.: 5,0 % (ankst.: 4,5 %).
Nedarbo lygis (kovas): 5,4 % (ankst.: 5,3 %).
Pramonės produkcija (kovas, met./met.): 6,1 % (ankst.: 6,3 %).
Remiantis Nacionalinio statistikos biuro duomenimis, Kinijos pramonės įmonių pelnas per pirmąjį 2026 m. ketvirtį išaugo 15,2 % met./met. (kovą: 15,8 % met./met.). Šis augimas pasiektas nepaisant išorinių iššūkių.
- Valstybinės įmonės: pelno augimas 10,1 %;
- Privačios įmonės (pagrindinis variklis): augimas 25 % met./met. Tarp sektorių reikšmingas augimas fiksuotas kasybos paslaugų, spalvotųjų metalų ir elektronikos srityse.
Investicijos į ilgalaikį turtą (kovas, met./met.): 1,7 % (ankst.: 1,8 %).
Mažmeninė prekyba (kovas, met./met.): 0,9 % (ankst.: 1,3 %).
Importas (kovas, met./met.): 27,8 % (ankst.: 19,8 %).
Eksportas (kovas, met./met.): 2,5 % (ankst.: 21,8 %).
Prekybos balansas (JAV dol.) (kovas): 51,13 mlrd. (ankst.: 213,62 mlrd.).
Pirkimo vadybininkų indeksai (PMI) (kovas):
- Gamyba: 50,3 (ankst.: 50,4);
- Ne gamyba: 49,4 (ankst.: 50,1);
- Composite: 50,1 (ankst.: 50,5).
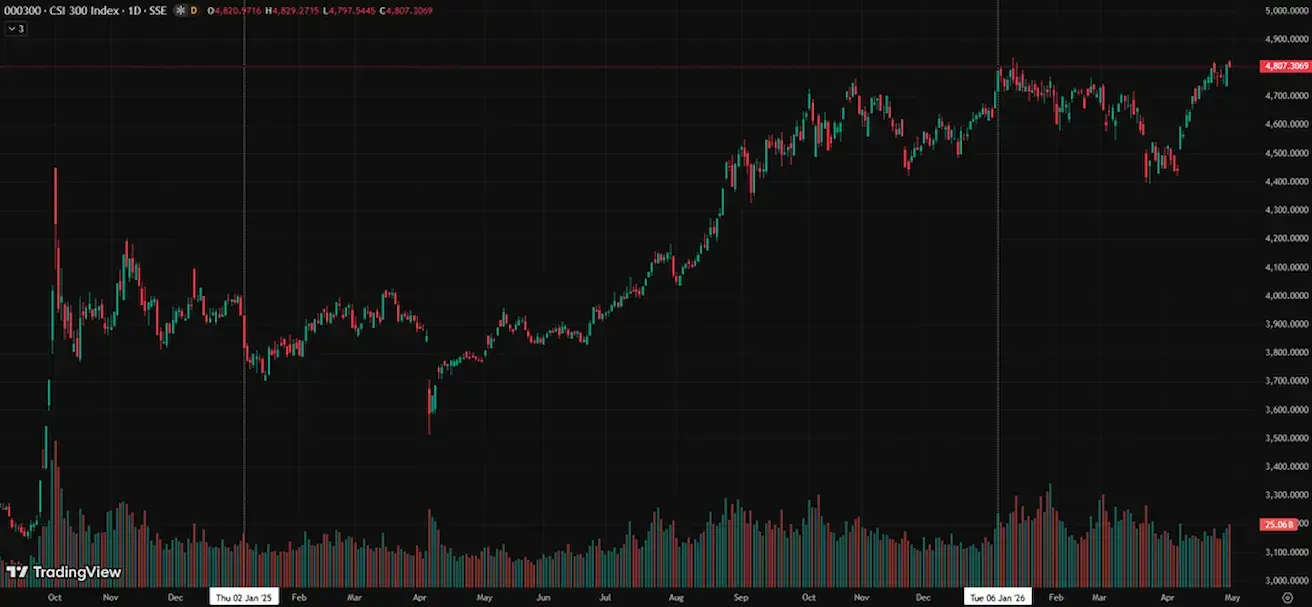
CSI 300 INDEKSAS (000300.HK)
Savaitės rezultatas: +0,76 % (savaitės pabaigos kaina 4807,30); nuo metų pradžios: +3,13 %.
Hang Seng TECH indeksas (HSTECH)
Savaitės rezultatas: +1,08 % (savaitės pabaigos kaina: 4954,9); nuo metų pradžios: -9,98 %.
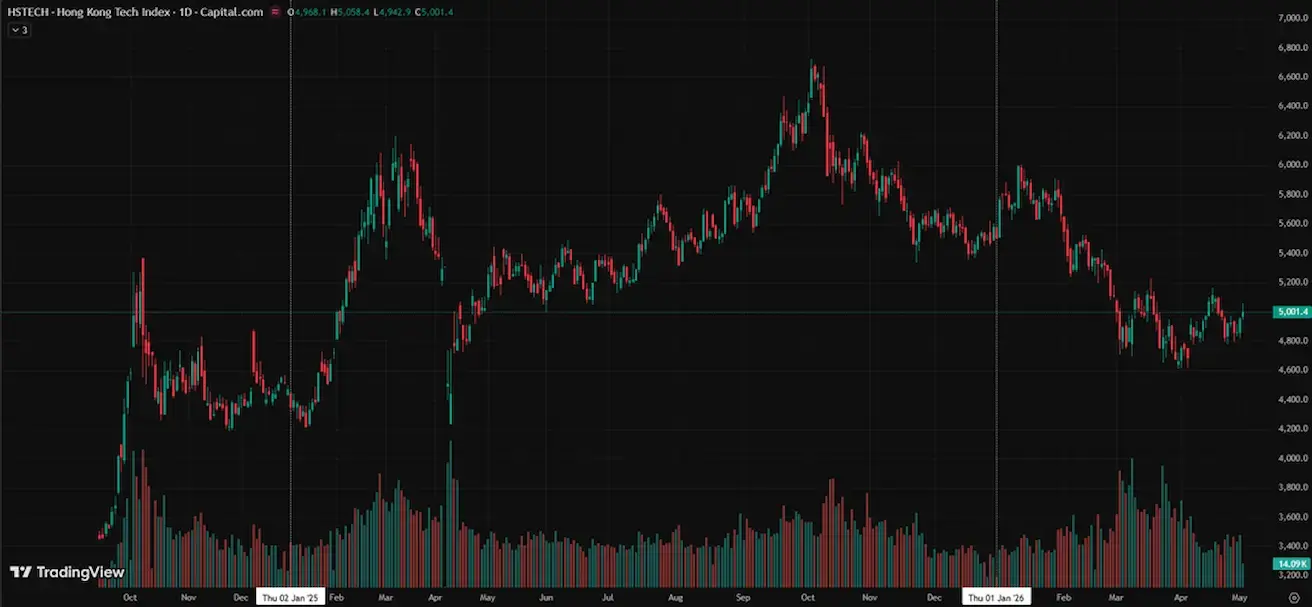
Moody’s pakeitė Kinijos reitingo perspektyvą iš neigiamos į stabilią, palikdama A1 reitingą.
OBLIGACIJŲ RINKA
JAV fiksuoto pajamingumo rinka — infliacijos lūkesčiai ir toliau lemia pajamingumus.
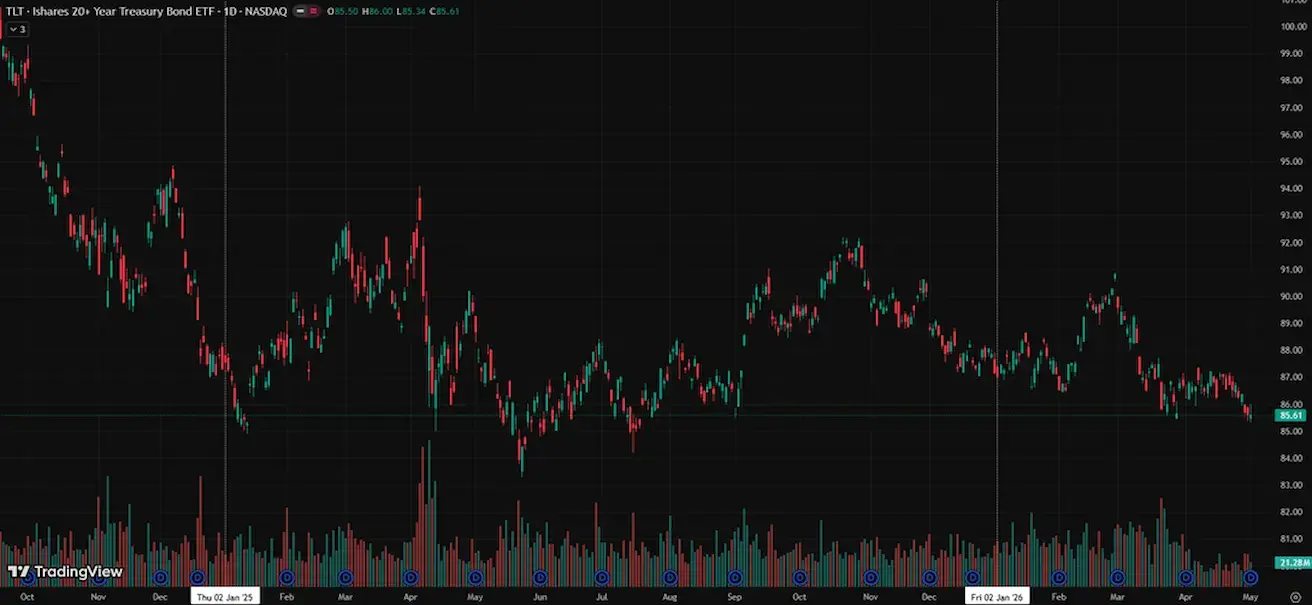
JAV iždo obligacijos 20+ (ETF TLT): savaitės rezultatas: -1,27 % (savaitės pabaigos kaina: 85,61); nuo metų pradžios: -1,78 %.
PAJAMINGUMAI IR SPREADAI
JAV iždo vertybinių popierių 10 metų nuolatinio pajamingumo rinkos pajamingumas: 4,39 % (ankst.: 4,3 %);
2 metų iždo pajamingumas: 3,88 % (ankst.: 3,78 %);
ICE BofA BBB JAV įmonių indekso efektyvus pajamingumas: 5,32 % (ankst.: 5,22 %).
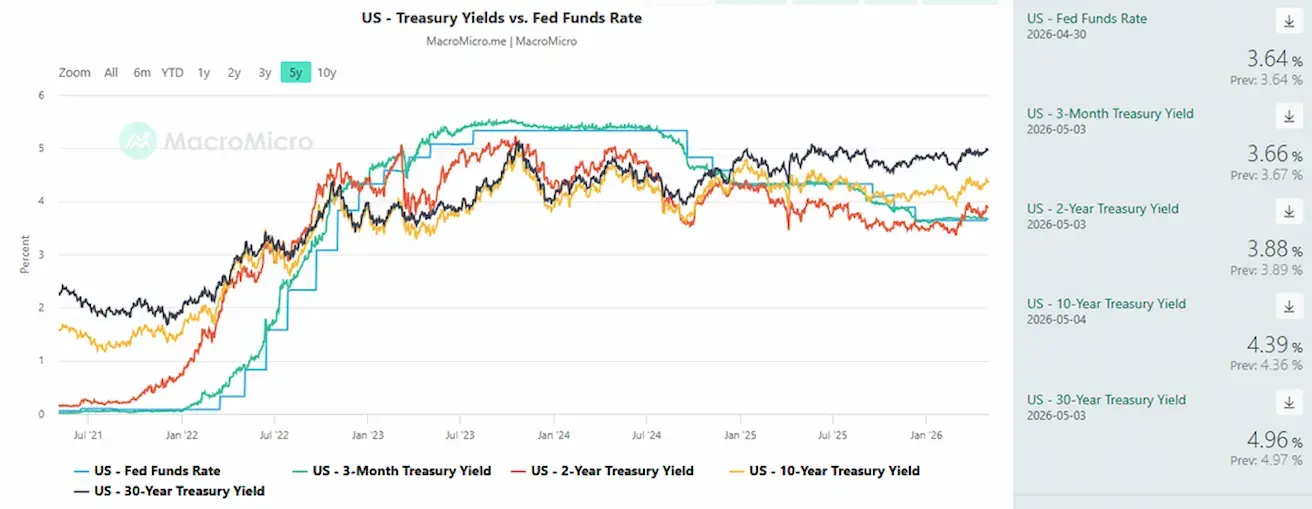
- 10 metų ir 2 metų JAV iždo vertybinių popierių pajamingumo skirtumas: 51 bazinis punktas (ankst.: 54).
- 10 metų ir 3 mėnesių JAV iždo vertybinių popierių pajamingumo skirtumas: 73 baziniai punktai (ankst.: 64).
5 metų JAV kredito įsipareigojimų neįvykdymo apsikeitimo sandorių (CDS) (draudimas nuo nemokumo) kaina: 35,04 bazinio punkto (prieš savaitę – 34,63).
AUKSO ATEITIES SANDORIAI (GC)
Savaitės rezultatas: -2,03 % (savaitės pabaigos kaina: 4644,5 JAV dol. už Trojos unciją); nuo metų pradžios: +7,21 %.
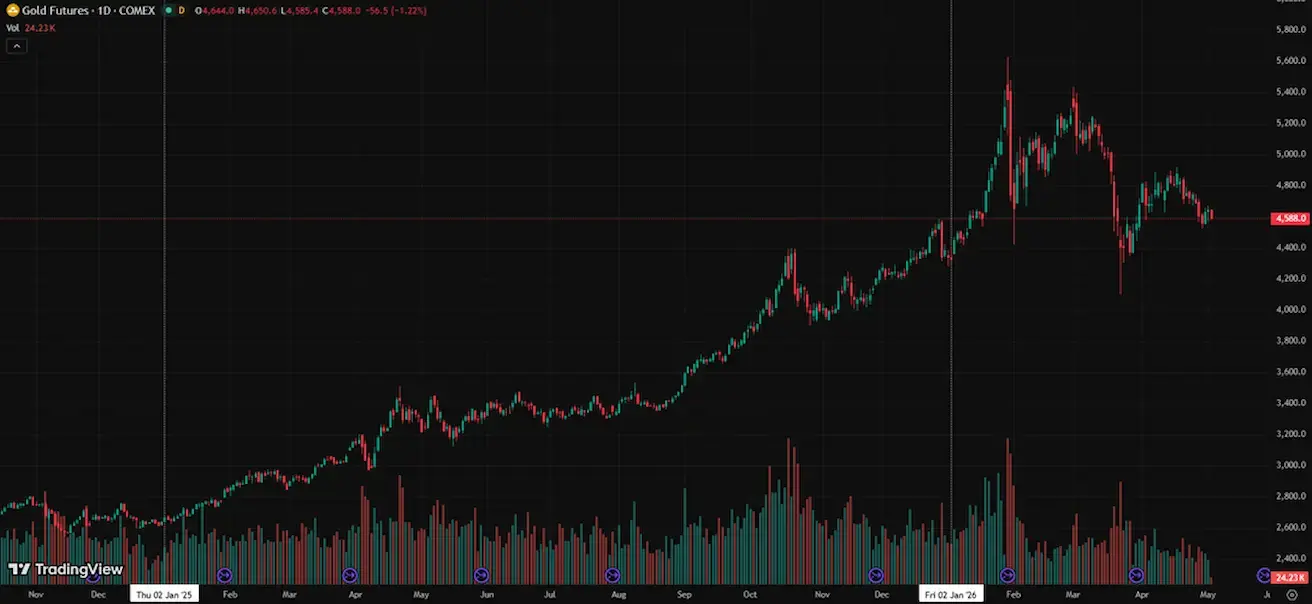
Remiantis Pasaulio aukso tarybos ataskaita: aukso paklausa 2026 m. pirmąjį ketvirtį vidutiniškai padidėjo iki 1 231 tonos. Augimą lėmė investicijos į luitus ir monetas, o investicijos per ETF per ketvirtį sulėtėjo. Centriniai bankai toliau aktyviai pirko auksą. Juvelyrinių dirbinių paklausa išliko spaudžiama dėl rekordiškai aukštų kainų.
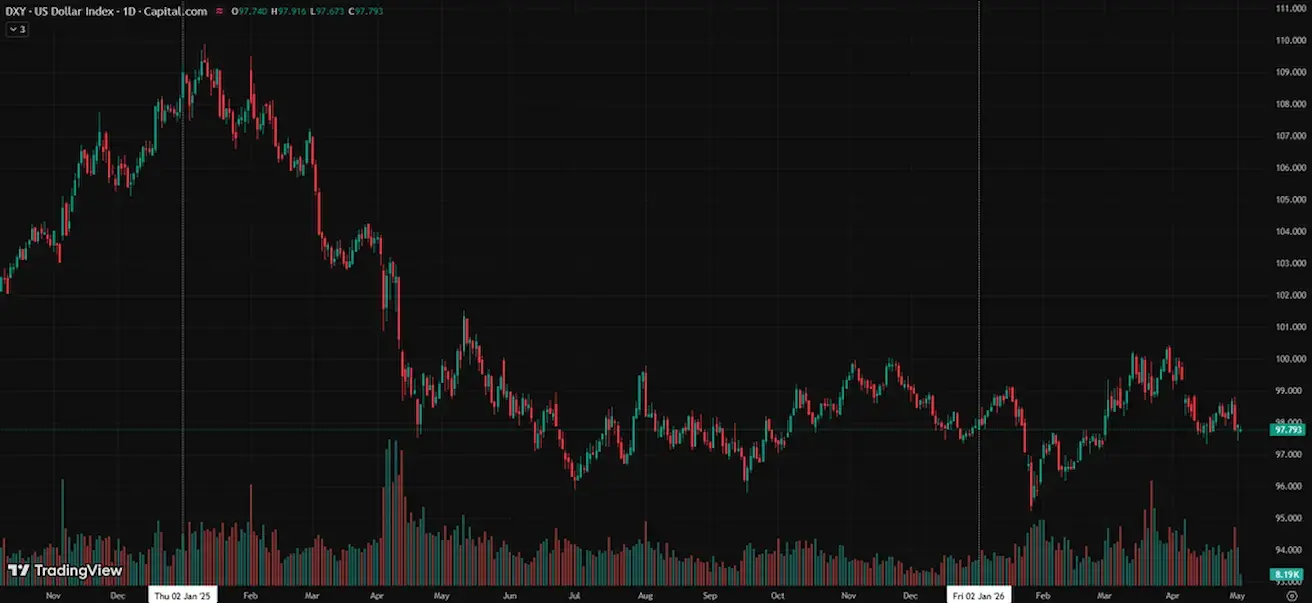
DOLERIO INDEKSO ATEITIES SANDORIAI (DX)
Savaitės rezultatas: -0,16 % (savaitės pabaigos kaina: 98,211). Nuo metų pradžios: +0,22 %.
JAV dolerio dalis tarptautiniuose mokėjimuose (SWIFT):
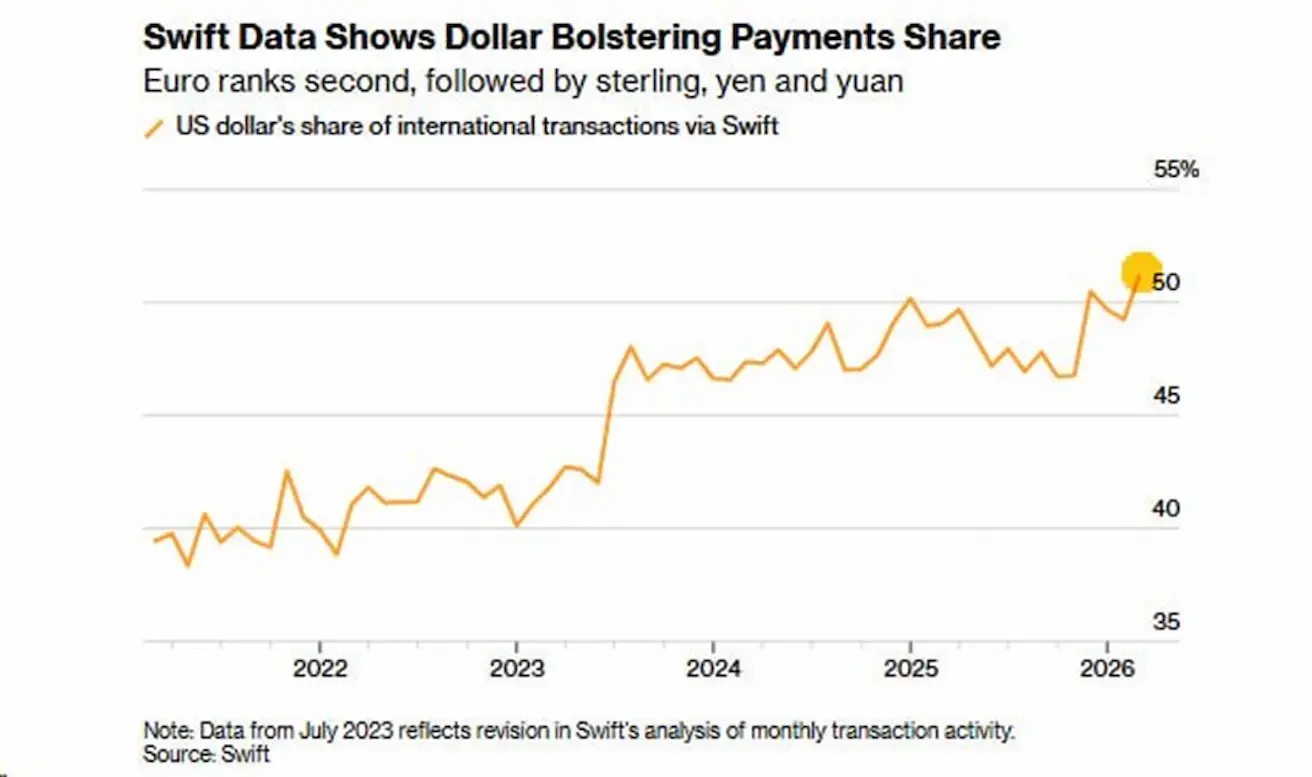
Nuo 2026 m. pradžios dolerio dalis viršija 50 % ir šiuo metu yra ties vietiniais maksimumais.
Nepaisant nuolatinių diskusijų dėl dedolerizacijos, dolerio likvidumo paklausa išlieka stipri. Pasaulinė prekyba ir toliau daugiausia vykdoma JAV doleriais, ypač žaliavų ir finansinių srautų srityse.
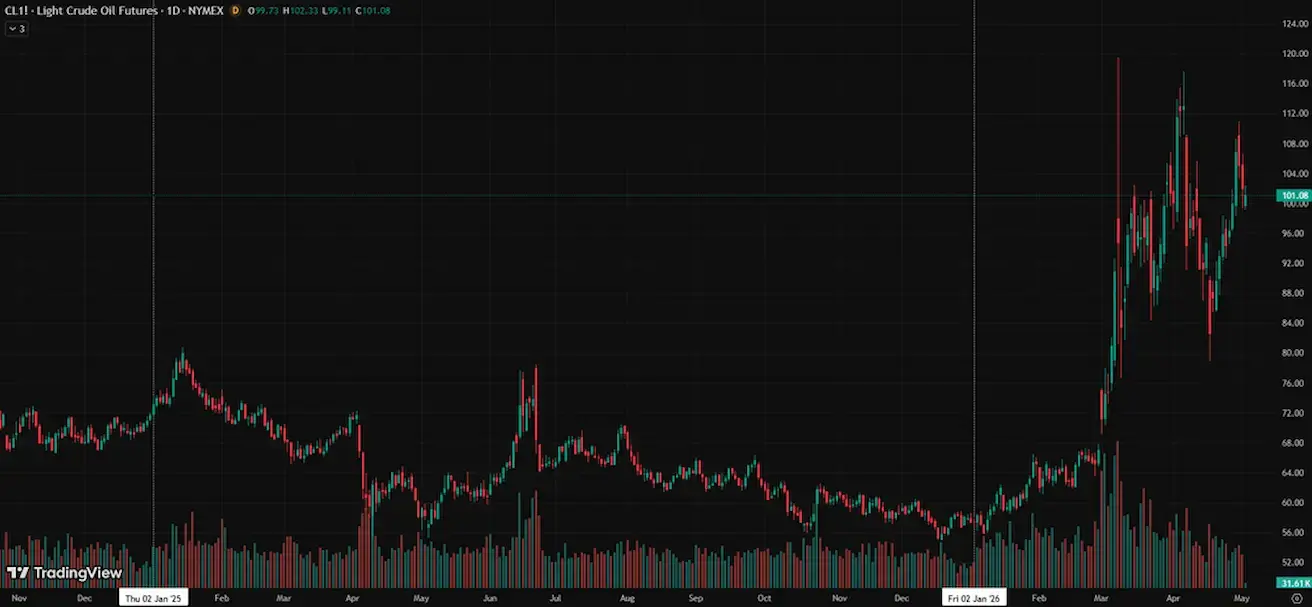
NAFTOS ATEITIES SANDORIAI
Savaitės rezultatas: +7,99 % (savaitės pabaigos kaina: 101,94 JAV dol. už barelį). Nuo metų pradžios: +77,56.
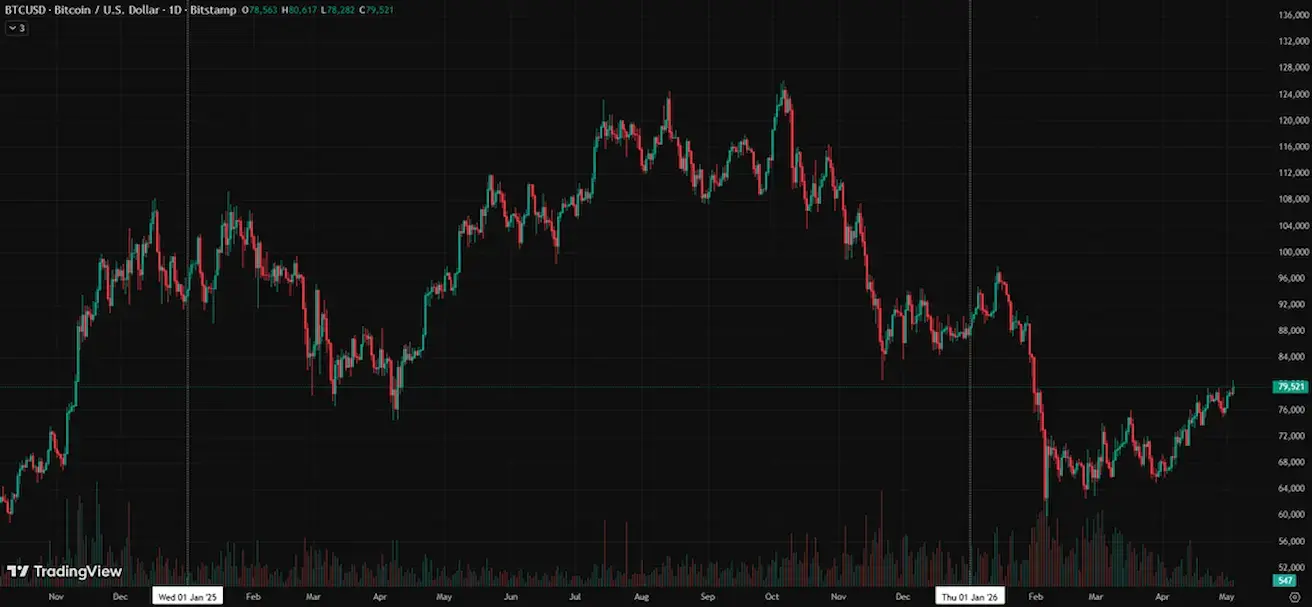
BTC ATEITIES SANDORIAI
Savaitės rezultatas: -0,12 % (savaitės pabaigos kaina: 7856 JAV dol.); nuo metų pradžios: -10,44 %.
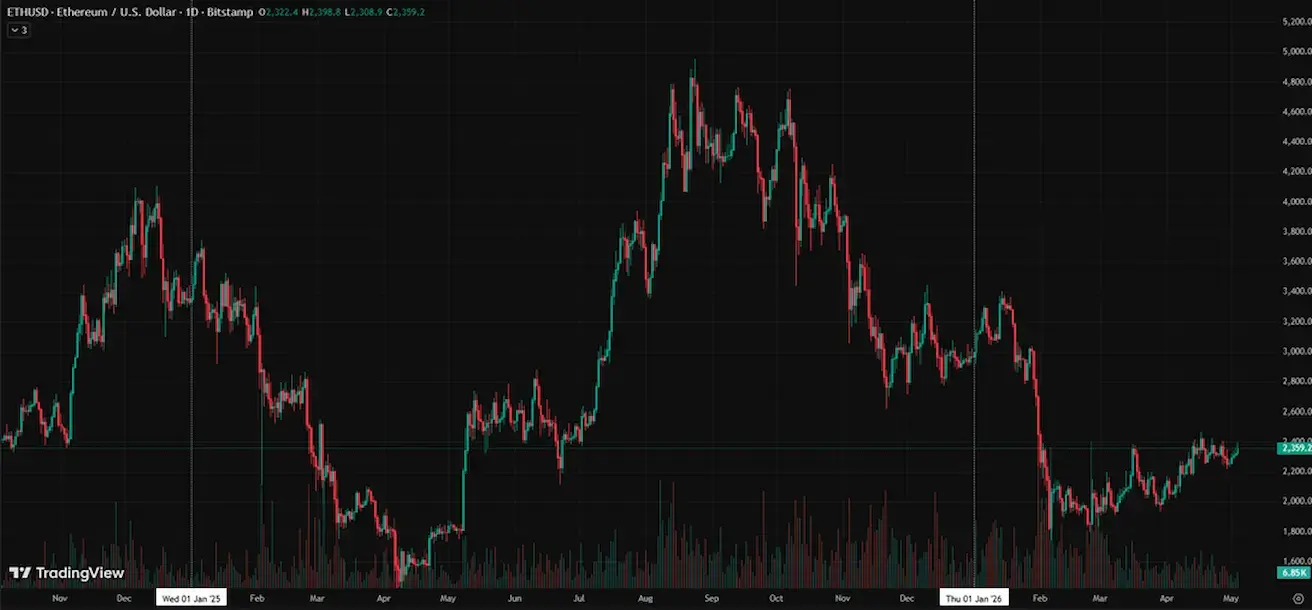
ETH ATEITIES SANDORIAI
Savaitės rezultatas: -2,02 % (savaitės pabaigos kaina: 2322,3 JAV dol.); nuo metų pradžios: -21,91 %.
Didelių turėtojų (piniginės su 1 000–10 000 BTC) dinamika:
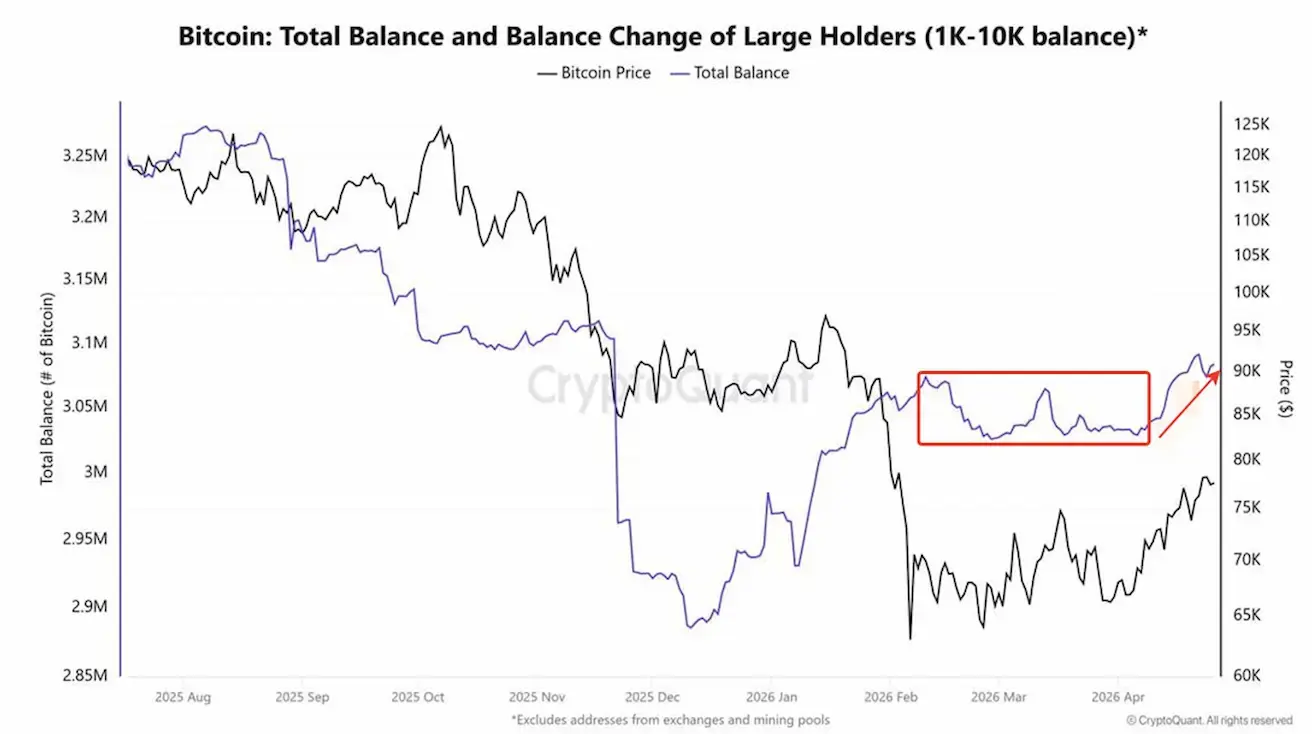
Nuo vasario iki balandžio pradžios didelių turėtojų likučiai mažėjo, rodydami paskirstymo fazę. Nuo balandžio stebima kaupimo fazė, kai likučiai didėja. „Smart money“ išlaiko optimistinę rinkos perspektyvą.
Pagrindiniai rinkos įvykiai
Didžiausias Kolumbijos pensijų fondas Porvenir pradėjo investuoti į BTC, įsigydamas BlackRock IBIT spot ETF.
Senatorė Cynthia Lummis pareiškė, kad įstatymų leidėjai planuoja gegužę pateikti pataisas dėl kriptovaliutų rinkos struktūros įstatymo (CLARITY Act) ir artimiausiu metu siekti jo priėmimo.
Senato bankų komiteto pirmininkas Tim Scott pažymėjo, kad tikisi, jog įstatymo projektas bus pateiktas Prezidentui pasirašyti šią vasarą.
Baltieji rūmai patvirtino planus per artimiausius du mėnesius paskelbti oficialią strategiją dėl BTC rezervo sukūrimo, siekiant naudoti apie 200 000 BTC, konfiskuotų teisėsaugos institucijų, kaip nacionalinį rezervinį turtą.
BENDRA KRIPTOVALIUTŲ RINKOS KAPITALIZACIJA
Bendra kriptovaliutų rinkos kapitalizacija: 2,64 trln. JAV dol. (prieš savaitę – 2,59 trln.) (coinmarketcap.com).
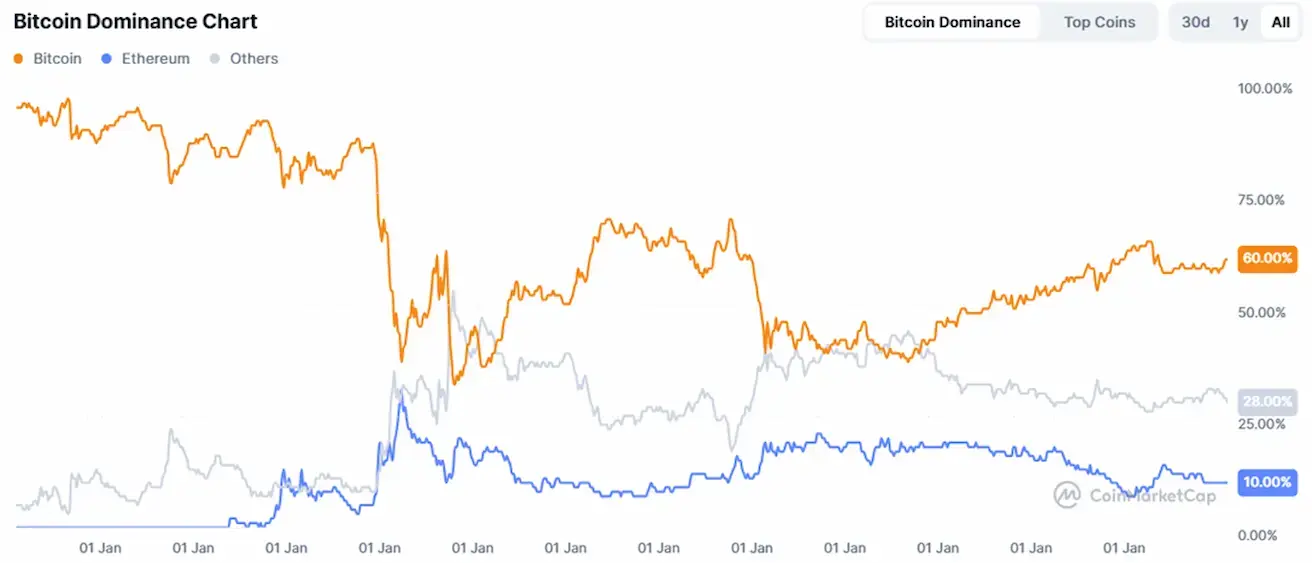
Kripto turto rinkos dalys:
- Bitcoin: 60,4 % (60,0 %)
- Ethereum: 10,8 % (10,8 %)
- Kiti: 28,8 % (29,2 %).
ETF grynųjų srautų diagrama: