 English
 Русский
 Қазақша
 Eesti
Eesti2025 m. rugpjūčio 11–15 d.: Savaitinė ekonomikos apžvalga
Pagrindinės rinkos naujienos

Makroekonominė statistika
Infliacija (VKI):
- Pagrindinis vartotojų kainų indeksas (VKI) (mėn./mėn.) (birželis): 0,3 % (ankst.: 0,2 %)
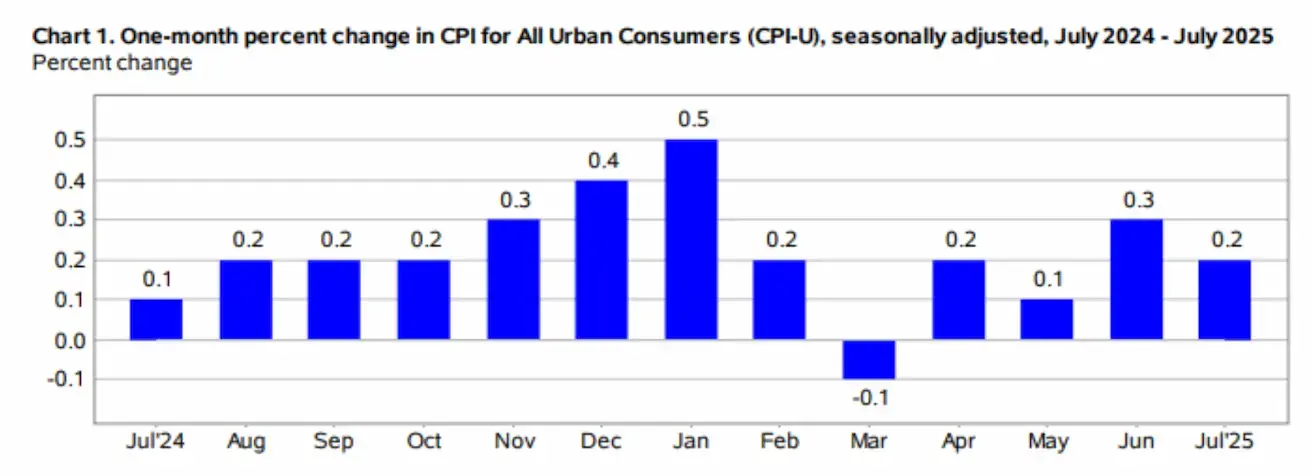
- Vartotojų kainų indeksas (VKI) (mėn./mėn.) (birželis): 0,2 % (ankst.: 0,3 %)
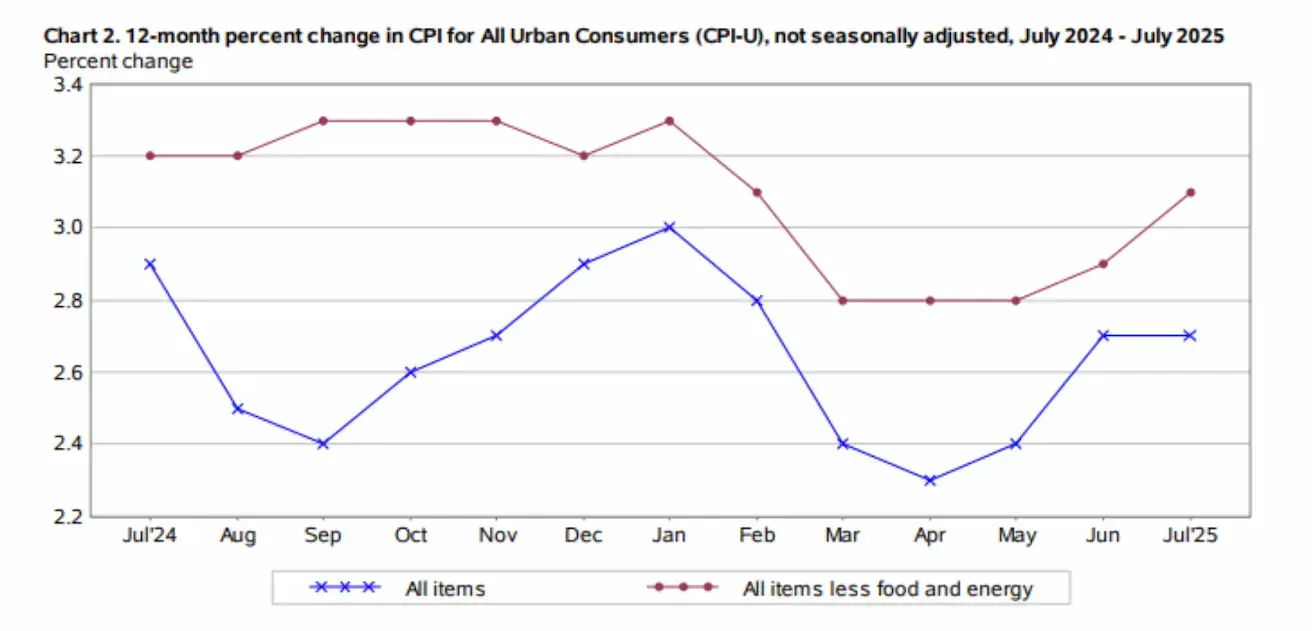
- Pagrindinis VKI (m./m.) (birželis): 3,1 % (ankst.: 2,9 %)
- VKI (m./m.) (birželis): 2,7 % (ankst.: 2,7 %)
Infliacijos lūkesčiai (Mičiganas):
- 12 mėn. prognozuojama infliacija (rugpjūtis): 4,9 % (ankst.: 4,5 %)
- 5 metų prognozuojama infliacija (rugpjūtis): 3,9 % (ankst.: 3,4 %)
Gamintojų kainų indeksas (GKI):
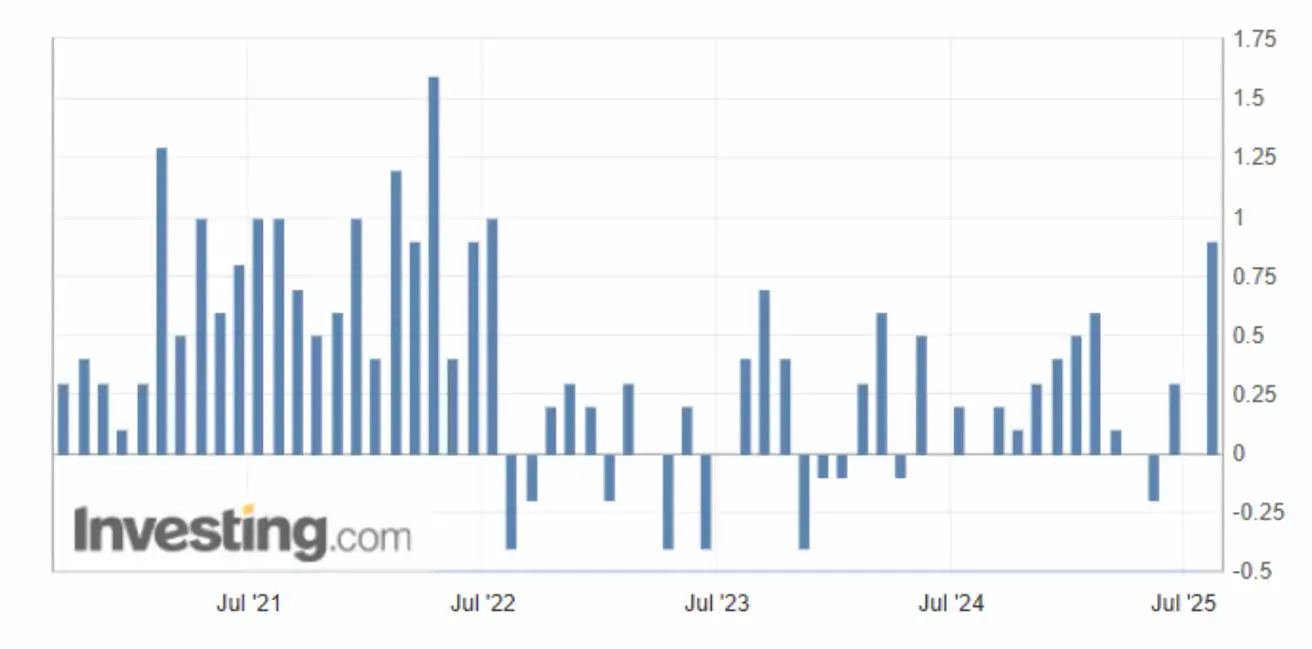
- GKI (mėn./mėn.) (rugpjūtis): 0,9 % (ankst.: 0,0 %)
- Pagrindinis GKI (mėn./mėn.) (rugpjūtis): 0,9 % (ankst.: 0,0 %)
BVP (JAV Ekonominės analizės biuras, BEA):
- 2025 m. 2 ketv. metinis, preliminarus įvertis: 3,0 % (2024 m. 1 ketv.: –0,5 %)
- Atlanta Fed GDPNow (2 ketv.): 2,5 % (prieš 2,5 %) (GDPNow modelis pateikia „real‑time“ oficialaus įverčio versiją prieš jo paskelbimą, naudodamas metodiką, panašią į JAV BEA.)
Verslo aktyvumo indeksas (PMI) (virš 50 = augimas, žemiau 50 = lėtėjimas):
- Paslaugų sektorius (liepa): 55,7 (ankst.: 52,9)
- Gamybos sektorius (liepa): 49,8 (ankst.: pakoreguota 52,0)
- „S&P Global Composite“ (liepa): 55,1 (ankst.: 52,9)
Darbo rinka:
- Nedarbo lygis (birželis): 4,2 % (ankst.: 4,1 %)
- Ne žemės ūkio darbo vietos (birželis): +73 tūkst. (ankst.: pakoreguota 144 tūkst.)
- Privačiojo ne žemės ūkio sektoriaus darbo vietos (birželis): +83 tūkst. (ankst.: 137 tūkst.)
- Vidutinis valandinis uždarbis (m./m., birželis): 3,9 % (ankst.: 3,8 %)
- JOLTS laisvos darbo vietos (gegužė): 7,769 mln. (prieš 7,395 mln.)
Pinigų politika
- Federalinių fondų norma (EFFR): 4,25–4,50 % (tikslinis intervalas)
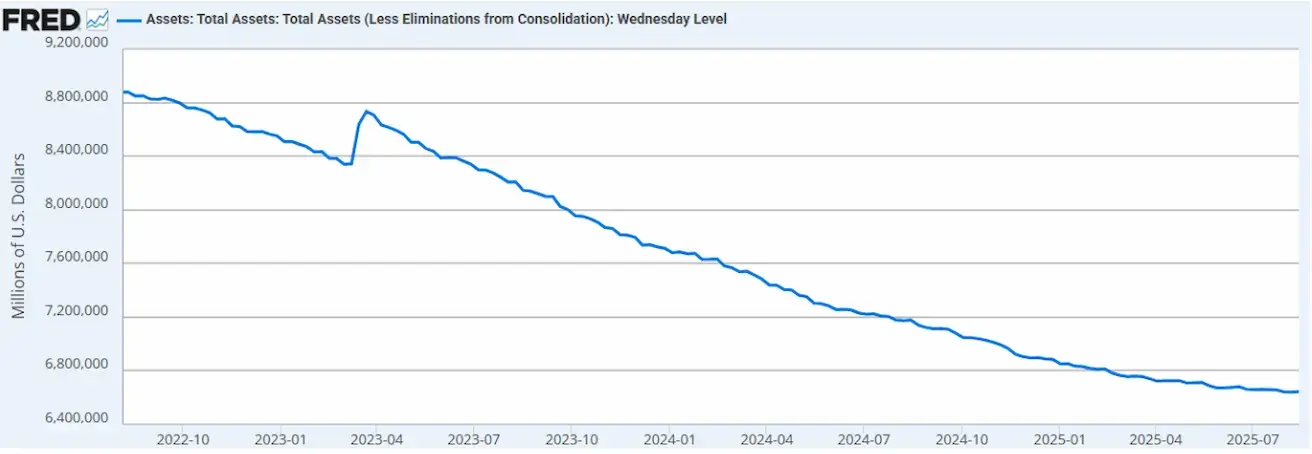
- FED balansas: 6,643 trln. USD (prieš savaitę: 6,42 trln. USD)
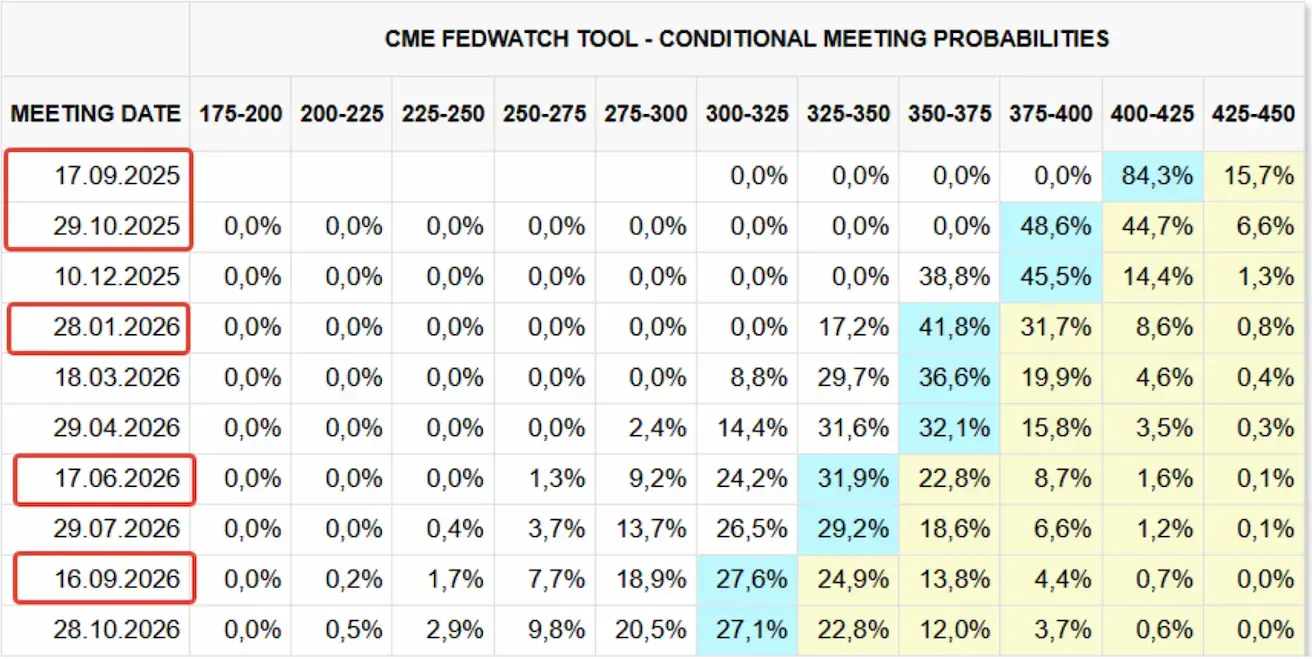
Rinkos palūkanų prognozė (FedWatch):
Šiandien:
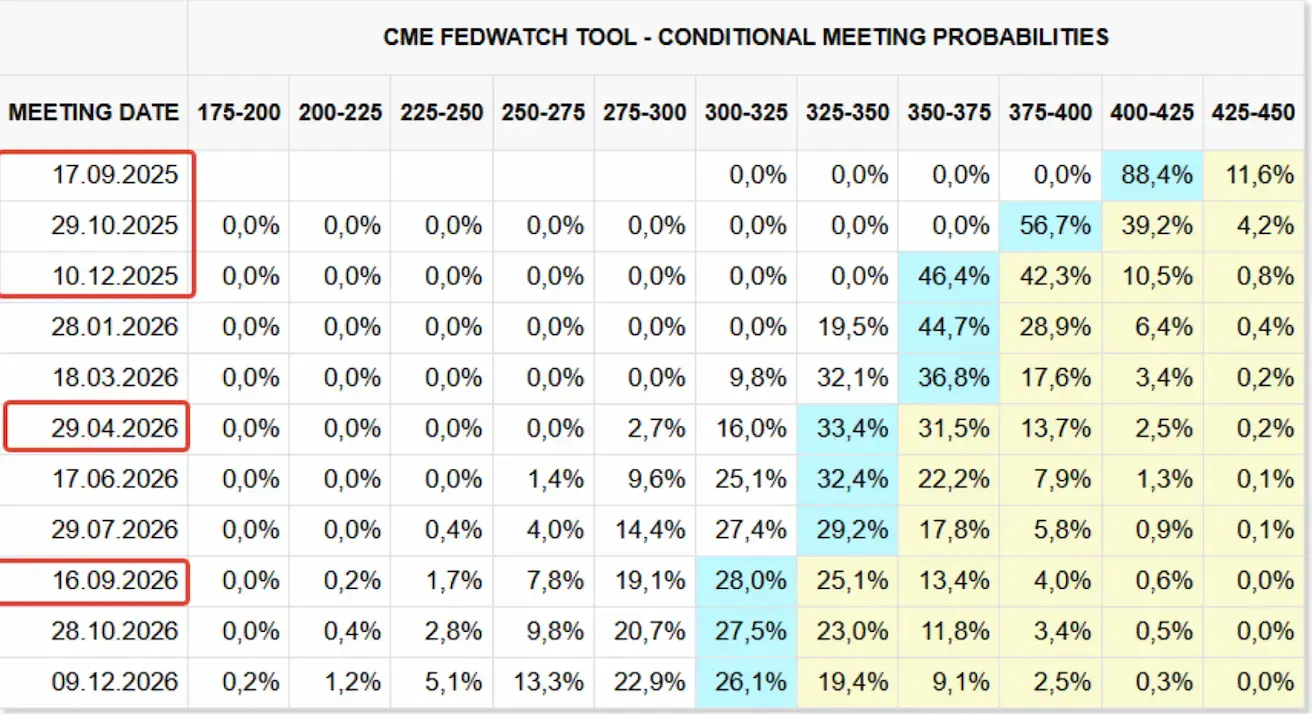
Prieš savaitę:
Komentaras
Praėjusią savaitę akcijų rinkos išliko Risk-on režime. Vartotojų infliacijos duomenys buvo mišrūs ir rinkos priimti vidutiniškai pozityviai. Viena vertus, mėnesinis VKI liepą parodė mažesnį augimą – +0,2 %, palyginti su 0,3 % birželį. Metiniu pagrindu VKI išliko nepakitęs – 2,7 %, tačiau, kita vertus, pagrindinis VKI pakilo iki 3,1 % (prieš 2,9 % birželį) – tai aiškus apsisukimas į viršų.
Ketvirtadienį taip pat buvo paskelbti duomenys apie gamybos infliaciją (GKI). Indeksas parodė 0,9 % augimą (mėn./mėn.) liepą, pakoregavus dėl sezoniškumo, ir tai buvo didžiausias augimas nuo 2022 m. birželio.
Nepritaikius sezoniškumo, indeksas per 12 mėn. iki liepos paaugo 3,3 % – tai didžiausias 12 mėn. padidėjimas nuo 3,4 % šuolio 2025 m. vasarį.
Šis augimas rodo, kad bendrovės neabsorbuoja didesnių importo sąnaudų, susijusių su tarifais.
VKI atspindi einamąją infliaciją, o GKI – būsimą infliaciją. Atitinkamai naujausias GKI paskelbimas didina tikimybę, kad artimiausiomis savaitėmis vartotojų infliacijos rodikliai bus aukštesni. Tokiu scenarijumi FED retorika gali išlikti vidutiniškai griežta.
Be to, padidėjo infliacijos lūkesčiai: 12 mėn. – 4,9 %, 5 metai – 3,9 %.
Tačiau rinkos lūkesčiai pagal FedWatch išlieka pozityvūs:
- Kitam posėdžiui (rugsėjo 17 d.): palūkanų normos mažinimo tikimybė vertinama 84,3 %;
- Per artimiausius 12 mėn.: 5 žingsniai po 0,25 % mažinimą iki 3,00–3,25 % intervalo.
- Iki metų pabaigos lieka 2 sumažinimai.
Prekybos karai per JAV užsienio prekybos balanso prizmę
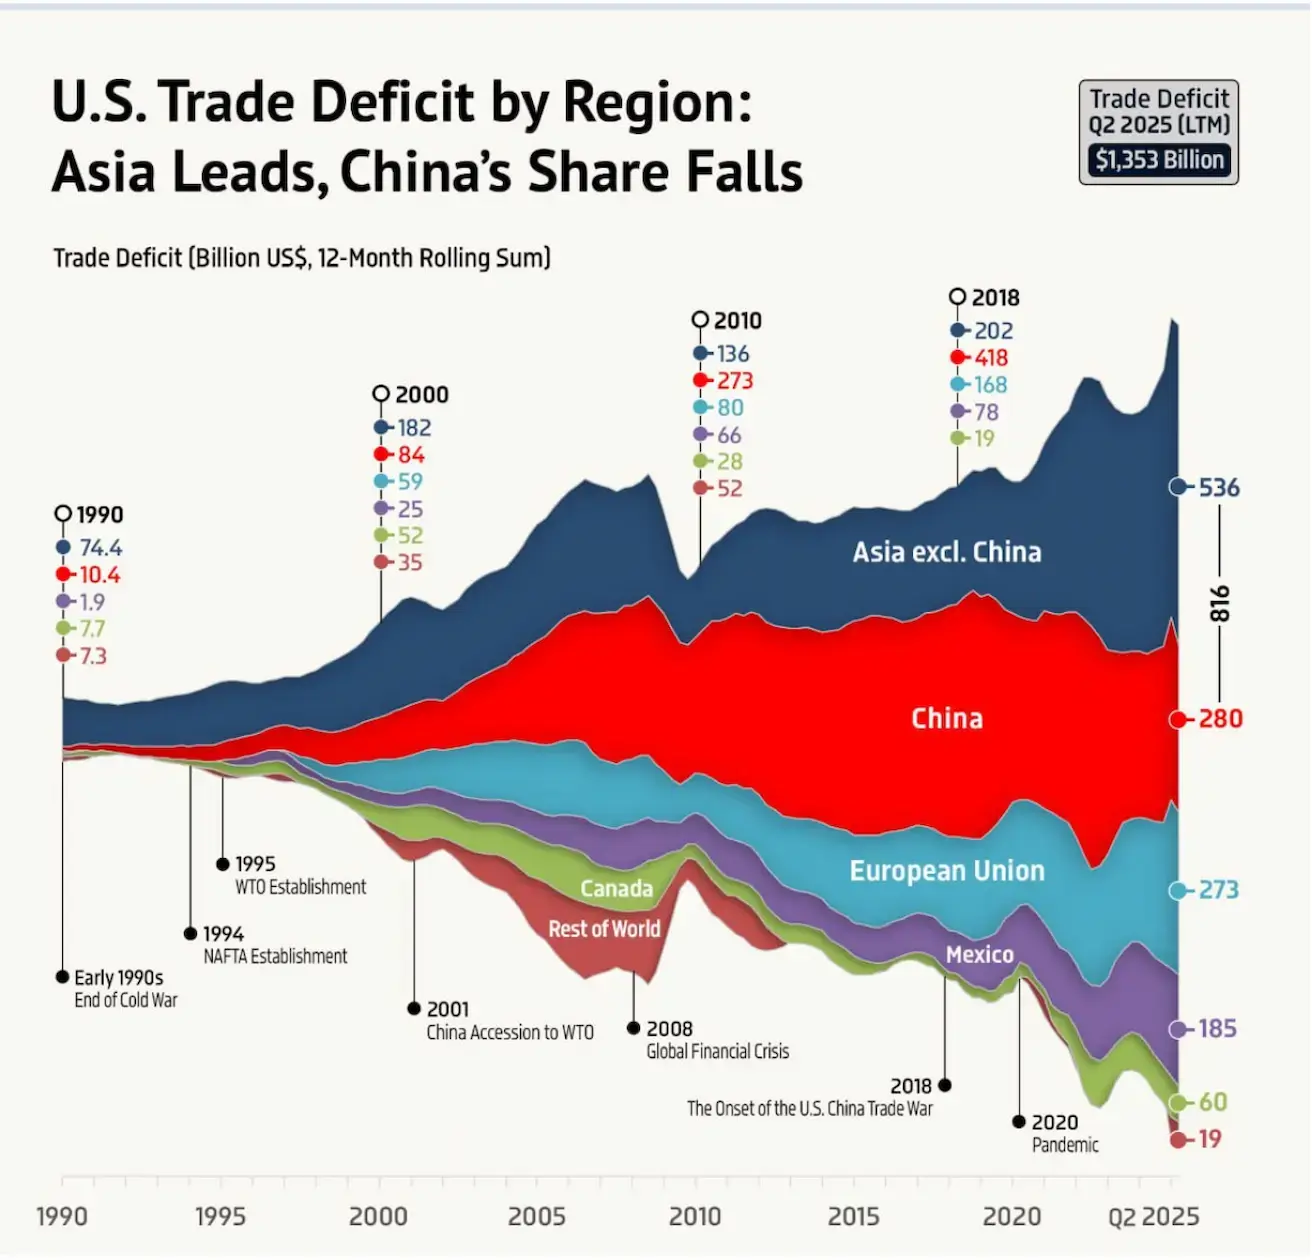
- JAV prekių prekybos deficitas (12 mėn. iki 2025 m. 2 ketv.): 1,353 trln. USD.
- Azija: 816 mlrd. USD (60 %) — Kinija 280 mlrd. USD (21 %), likusi Azija 536 mlrd. USD (40 %).
- ES: 273 mlrd. USD (20 %).
- Meksika: 185 mlrd. USD (14 %).
- Kanada: 60 mlrd. USD (5 %).
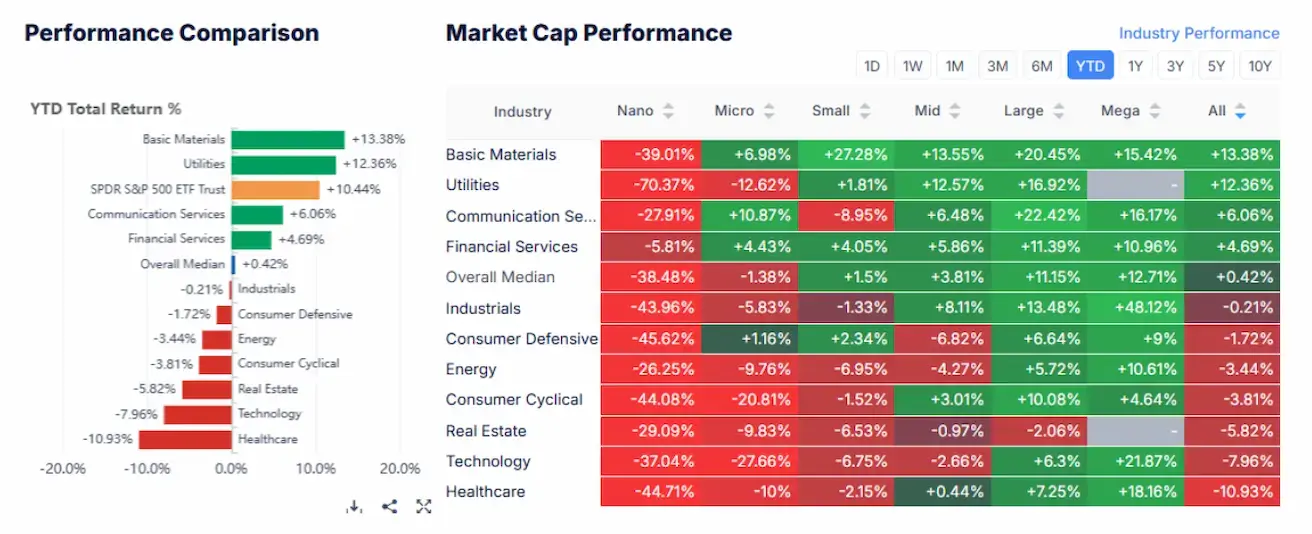
Akcijų rinka
- Savaitinis medianinis augimas: +1,41 %. Lyderiai: bazinės žaliavos, ciklinis vartojimas, sveikatos apsauga.
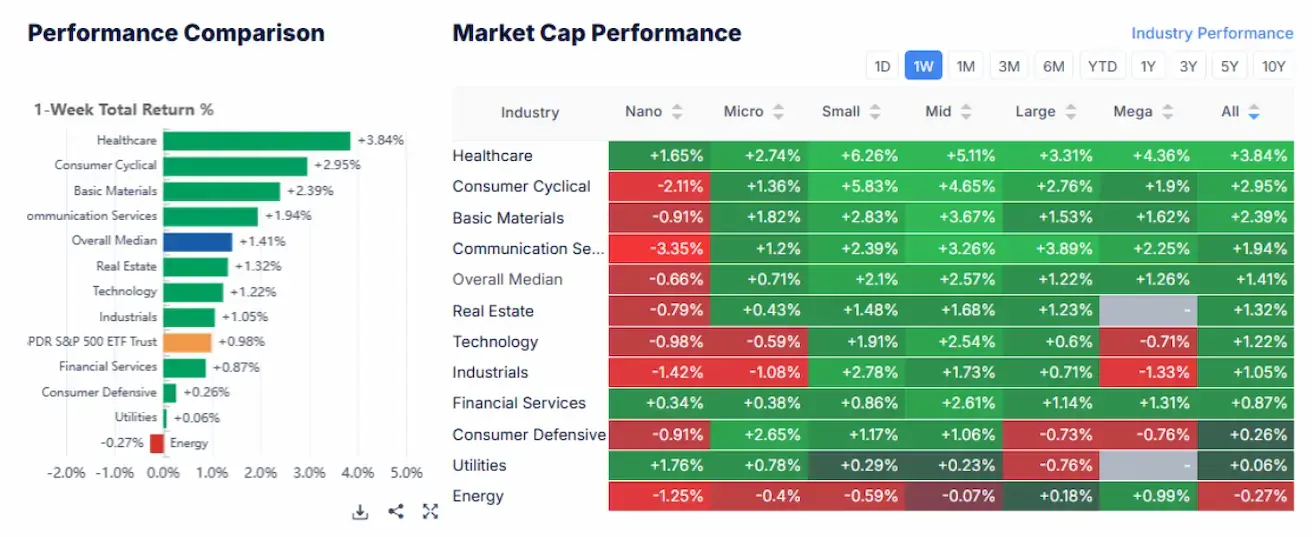
- Nuo metų pradžios: +0,42 %. Lyderiai: komunalinės paslaugos, bazinės žaliavos, ryšių paslaugos. Atšiliekantieji: technologijos (–7,96 %), sveikatos apsauga (–10,93 %).
Indeksai:
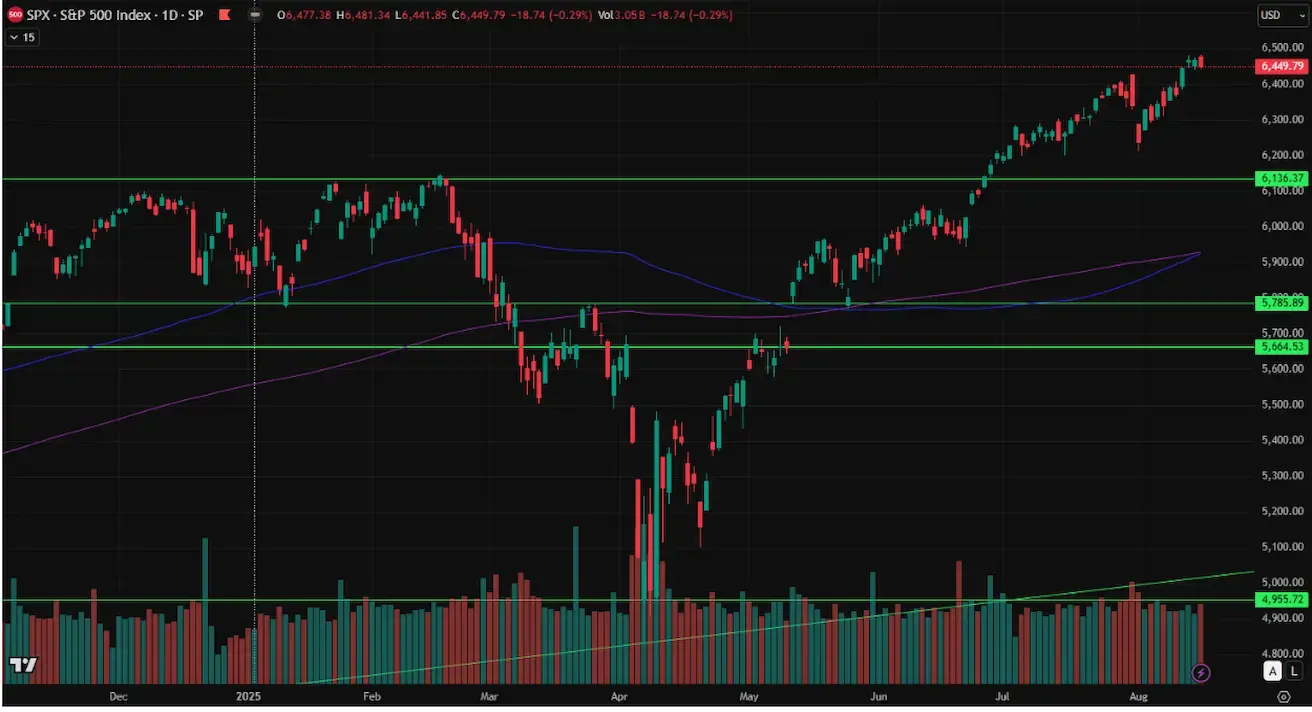
- S&P 500: +0,94 % (savaitės uždarymas 6449,79). Nuo metų pradžios +9,26 %.
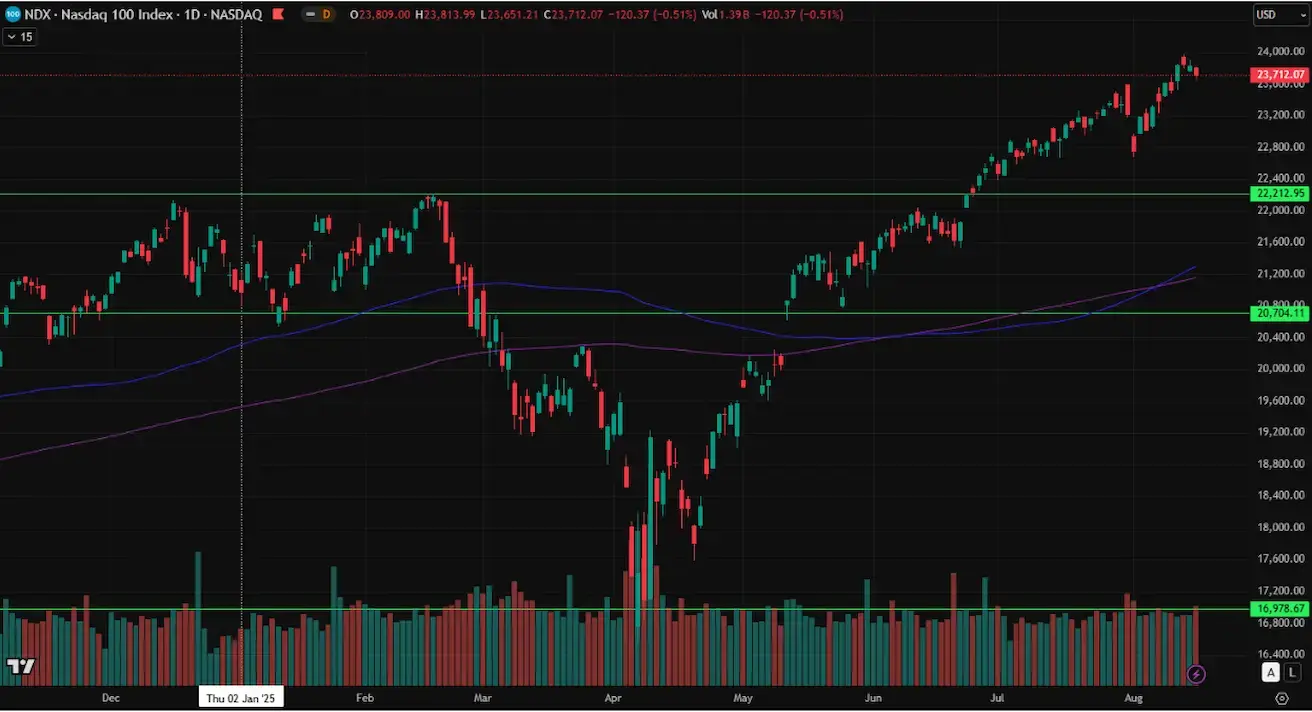
- Nasdaq 100: +0,43 % (savaitės uždarymas 23712,07). Nuo metų pradžios +12,27 %.
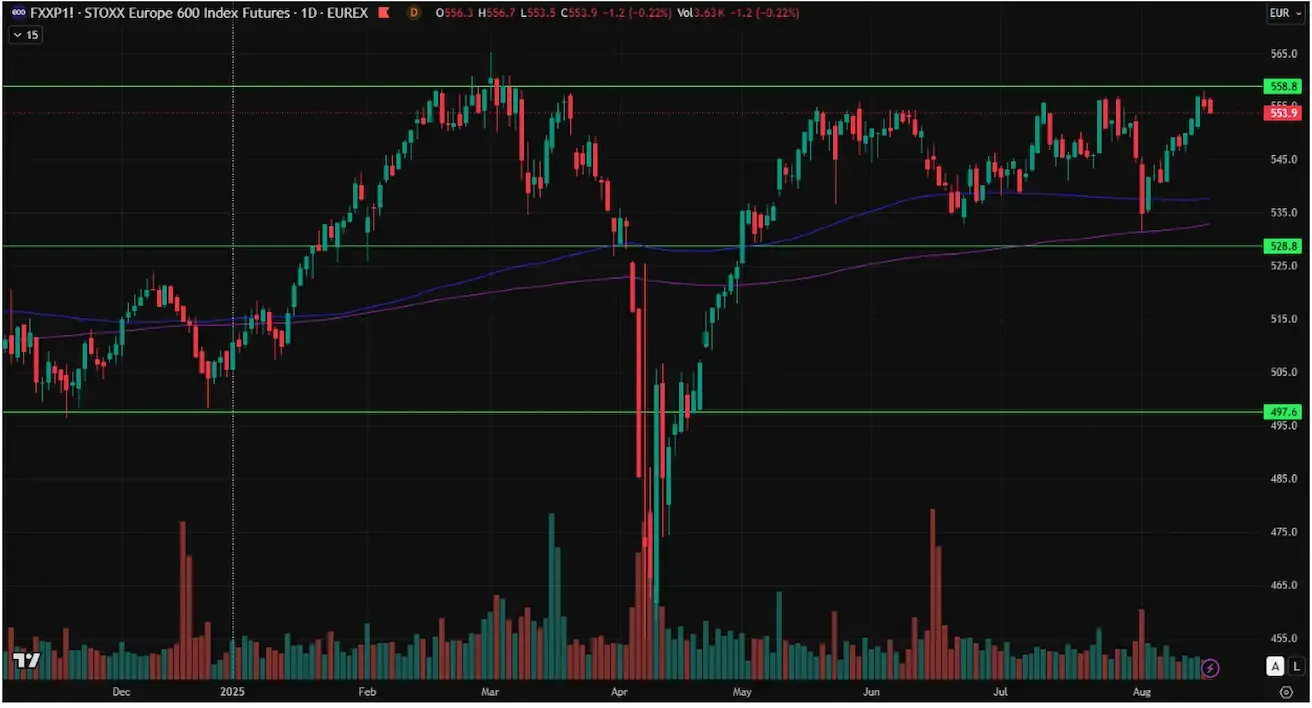
- Euro Stoxx 600: +1,09 % (savaitės uždarymas 555,1). Nuo metų pradžios +9,79 %.
- CSI indeksas (Kinija): +2,37 % (savaitės uždarymas 4202,35). Nuo metų pradžios +6,90 %.
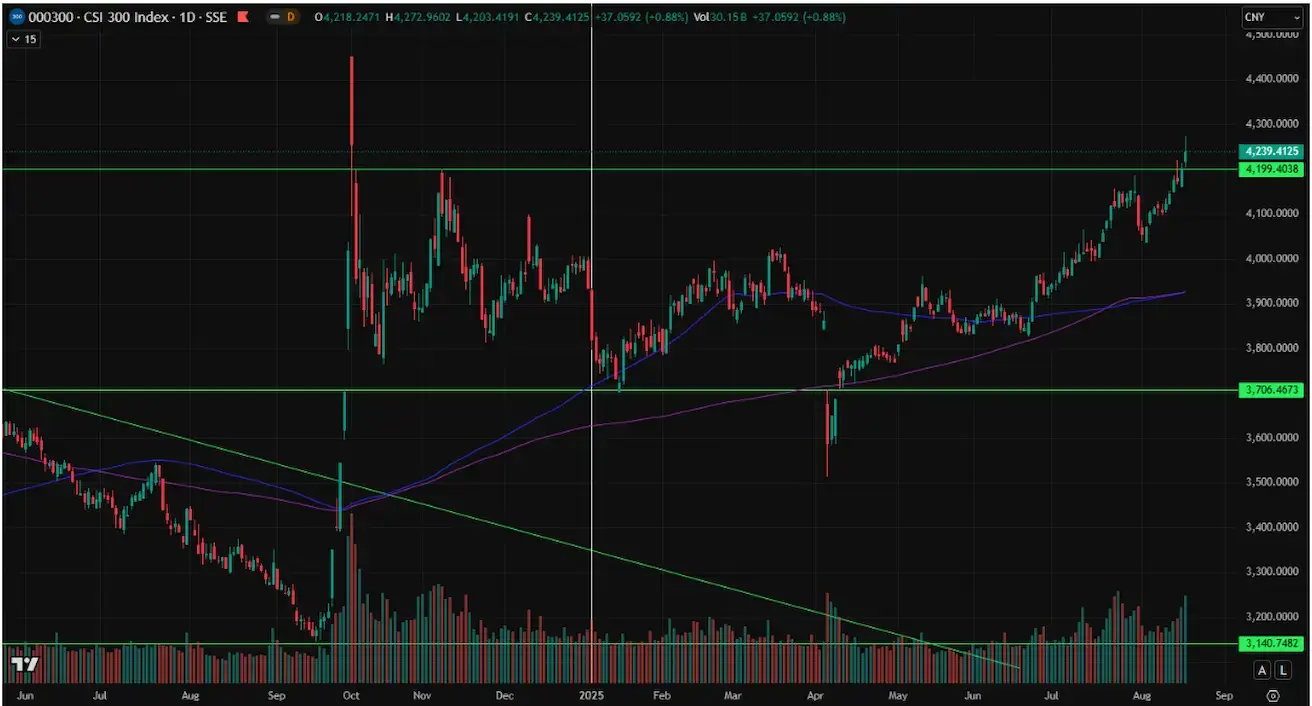
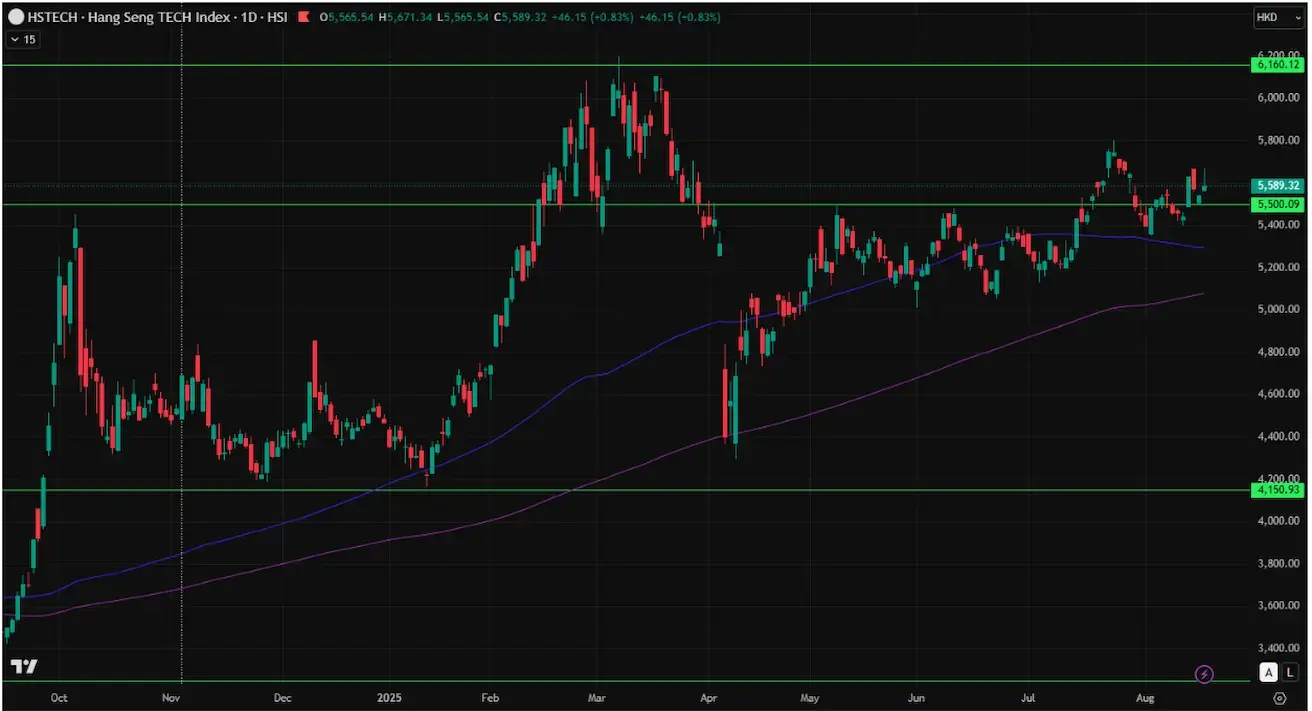
Kinija / prekyba:
- Trumpas leido dalį JAV lustų pardavimų Kinijai; paliaubos su Pekinu pratęstos 3 mėnesiams (iki lapkričio 10 d.).
- Kinijos indeksai atitinkamai pakilo.
- Hang Seng TECH indeksas: +1,52 % (savaitės uždarymas 5543,17). Nuo metų pradžios +24,94 %.
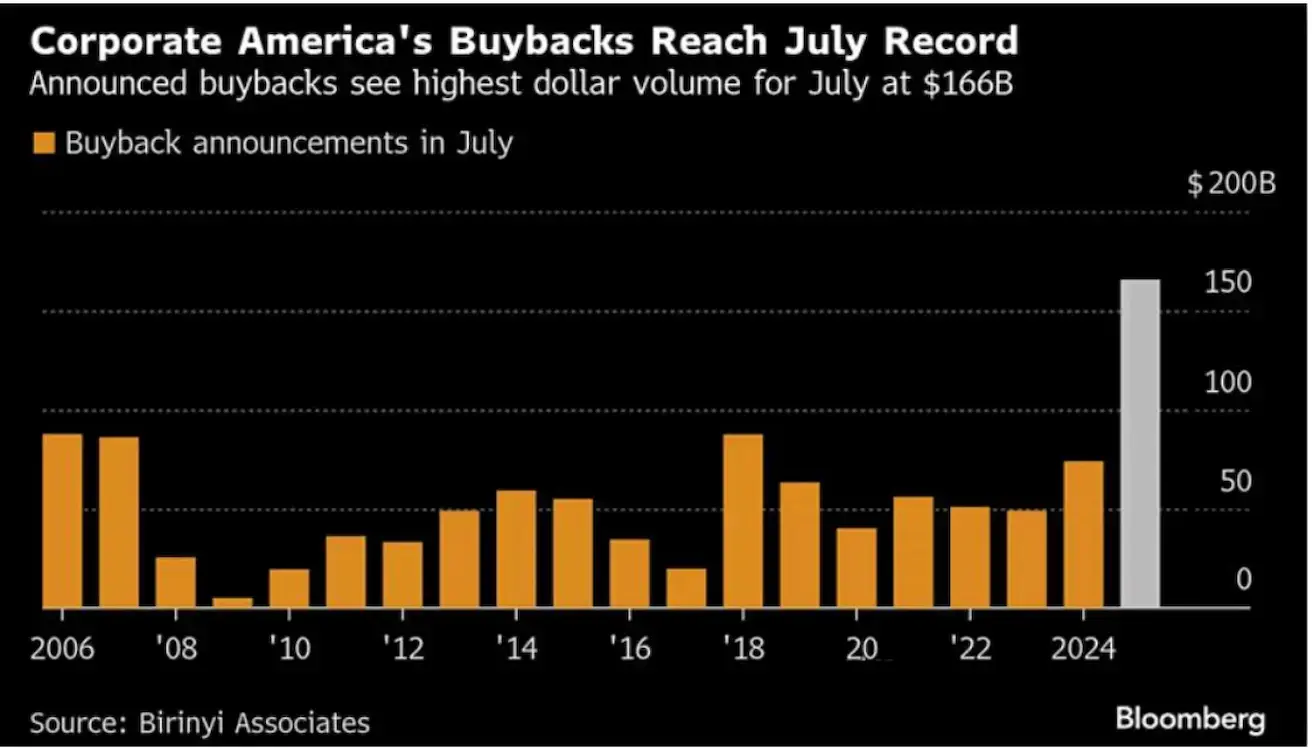
Supirkimas (buybacks):
- Liepa: JAV bendrovės paskelbė apie 166 mlrd. USD vertės akcijų supirkimą — didžiausia liepa per 20 metų.
- Vertinama kaip pasitikėjimas rinkos atsparumu.
- Tačiau vadovų (insider) pardavimai dideli: pavyzdžiui, „Amazon“ įkūrėjas Jeffas Bezosas liepą pardavė akcijų už 1,51 mlrd. USD.
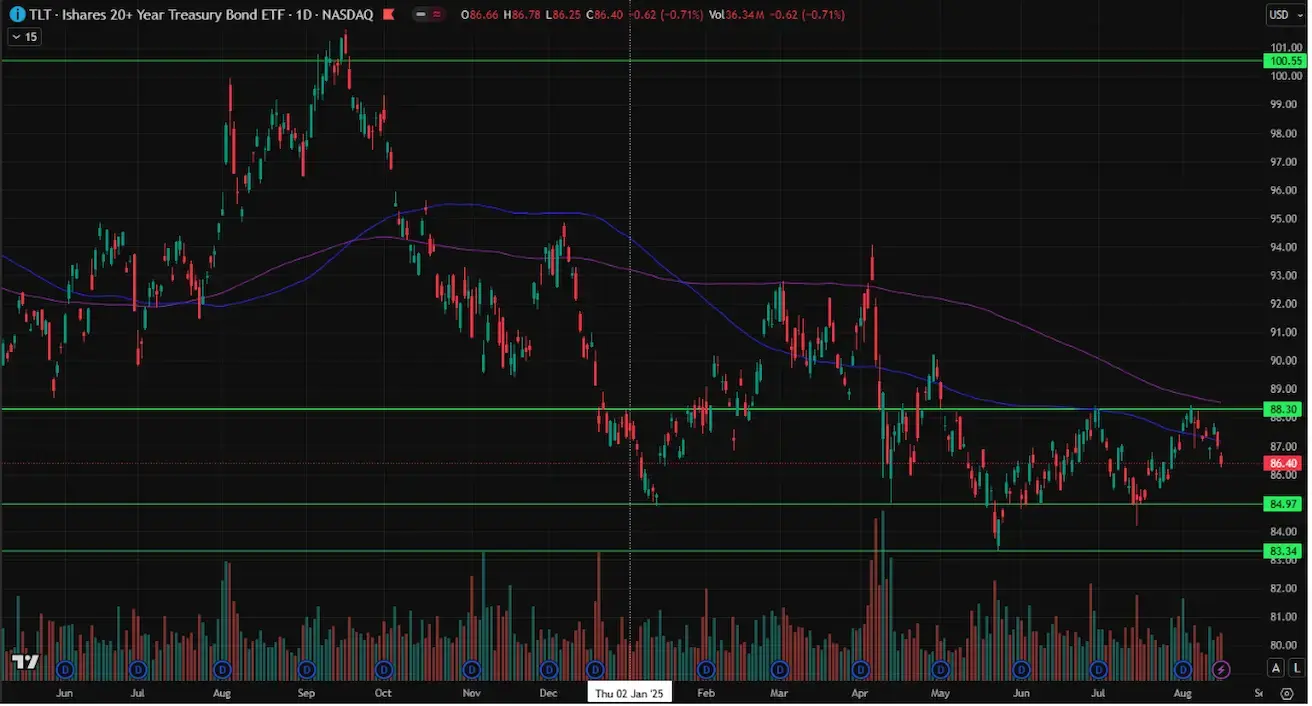
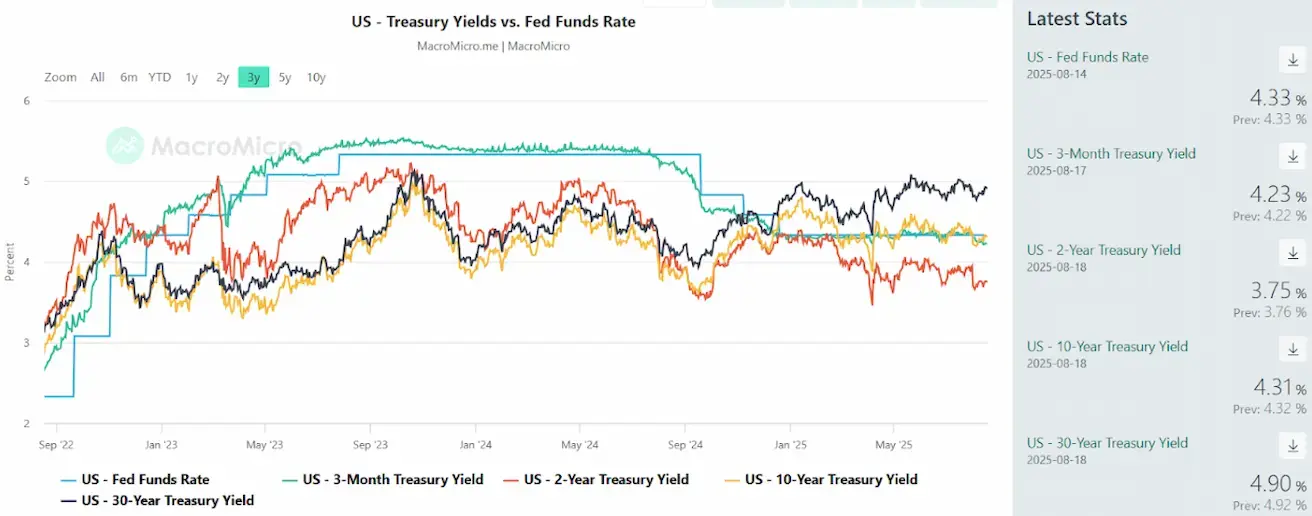
Obligacijų rinka
- JAV iždo pajamingumai kilo (neigiama reakcija į infliacijos duomenis).
- 20+ metų JAV iždo ETF (TLT): –1,02 % (uždarymas 86,40). Nuo metų pradžios –1,59 %.
Pajamingumai ir „spreadai“ (2025-06-30 vs 2024-07-07):
- JAV 10 m. iždo pajamingumas: 4,31 % (prieš 4,27 %).
- ICE BofA BBB JAV įmonių obligacijų indekso pajamingumas: 5,12 % (prieš 5,14 %).
- 10 m.–2 m. iždo „spreadas“: 56 baziniai punktai (prieš 51).
- 10 m.–3 mėn. iždo „spreadas“: 8 baziniai punktai (prieš 2).
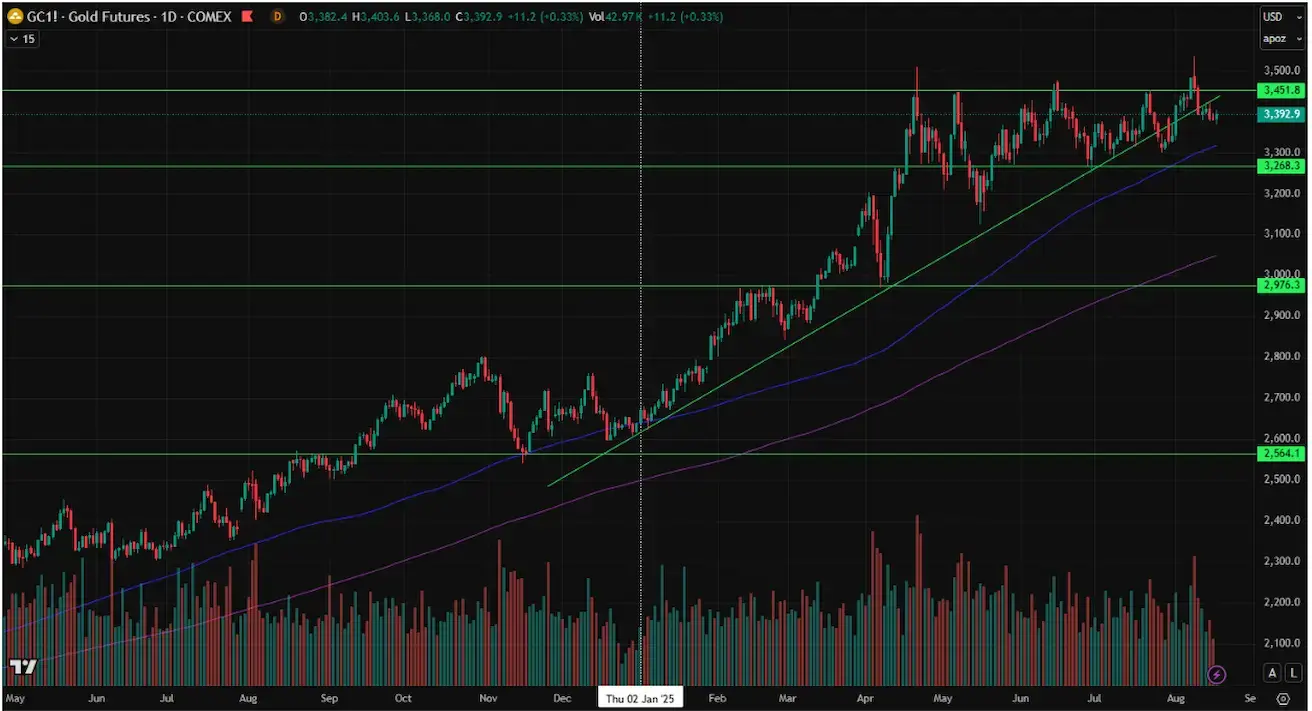
Žaliavos
Auksas (ateities sandoriai, GC):
- –2,21 % (savaitės uždarymas 3381,7 USD/oz).
- Nuo metų pradžios +28,05 %.
- Nuo balandžio prekybos diapazonas: 3250–3450 USD/oz.
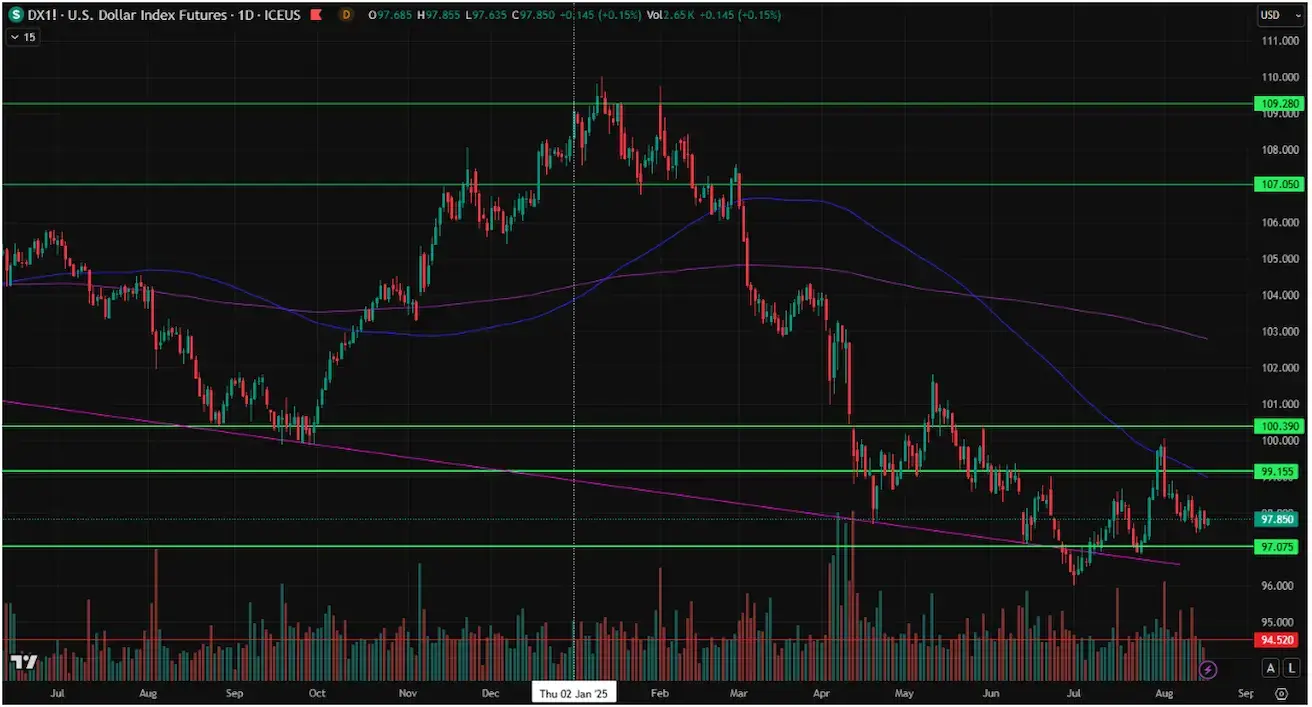
JAV dolerio indeksas (DX ateities sandoriai):
- –0,39 % (savaitės uždarymas 97,705).
- Nuo metų pradžios –9,81 %.
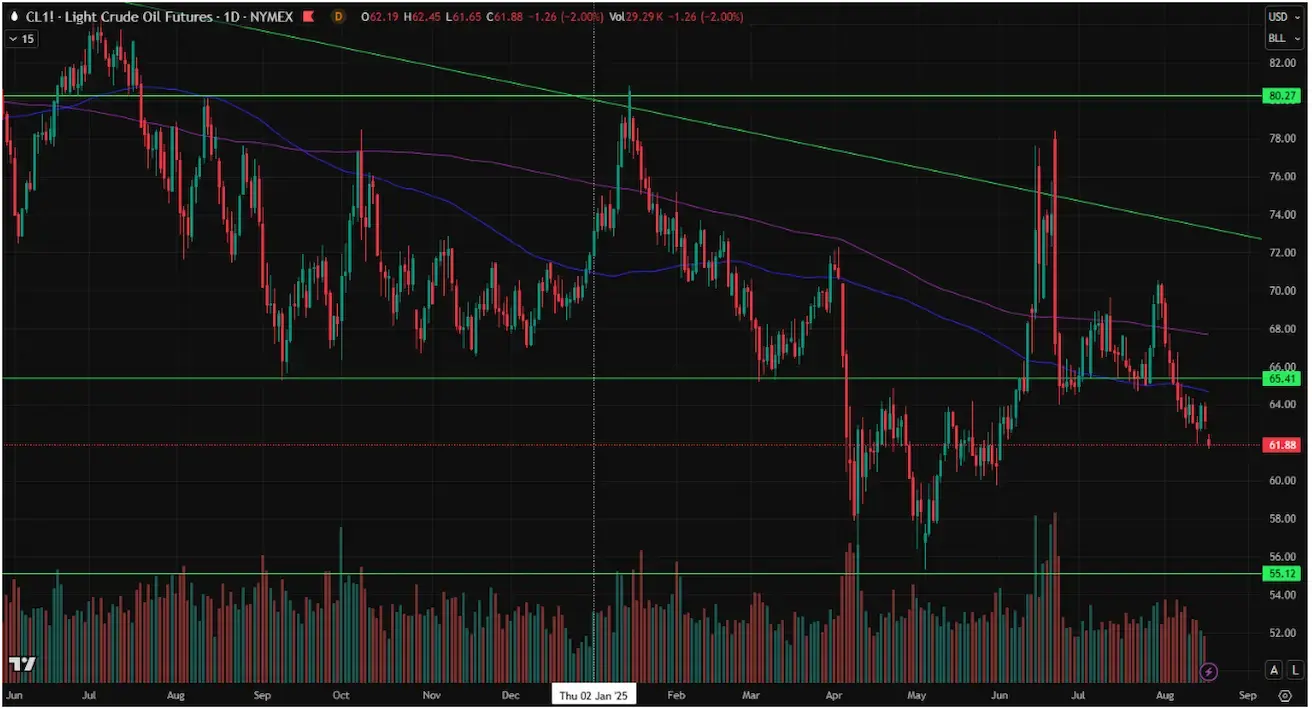
Nafta (CL ateities sandoriai):
- –0,33 % (savaitės uždarymas 63,14 USD/bbl).
- Nuo metų pradžios –12,12 %.
- Esama pasiūlos/paklausos pusiausvyra nepalanki aukštesnėms naftos kainoms.
OPEC+:
- 2025 m. paklausos prognozė nekeičiama: 105,14 mln. bpd (+1,29 mln.).
- 2026 m. paklausa pakoreguota aukštyn: 106,52 mln. bpd (+1,38 mln. vs 1,28 mln.).
- Gamybos koregavimas: 2025 m. rugsėjį 8 nariai sumažins gavybą 547 tūkst. bpd, palyginti su rugpjūčio lygiu (atitinka 4 mėnesių padidinimų atšaukimą).
- Lankstumas leidžia sustabdyti atšaukimą, jei pasikeistų rinkos sąlygos.
EIA (JAV Energetikos informacijos administracija):
- „Brent“ prognozė: kritimas nuo 71 USD/bbl (liepa) iki 58 USD 2025 m. 4 ketv., ir iki ~50 USD 2026 m. pradžioje.
- Priežastis: atsargų didėjimas po OPEC+ sprendimų.
- Tikimasi, kad pasaulinės atsargos 2025 m. 4 ketv. ir 2026 m. 1 ketv. augs daugiau kaip 2 mln. bpd.
Šaltinis: EIA STEO
TJT (Tarptautinė energetikos agentūra, IEA):
- Prognozuoja rekordinius naftos perteklius 2026 m.: +2,96 mln. bpd (didesnis nei per 2020 m. pandemiją).
- Pasaulinės paklausos augimas 2025 m.: 680 tūkst. bpd (prieš 700 tūkst.).
- 2026 m.: 700 tūkst. bpd (prieš 740 tūkst.), iki 104,4 mln. bpd bendros paklausos.
Kriptovaliutos
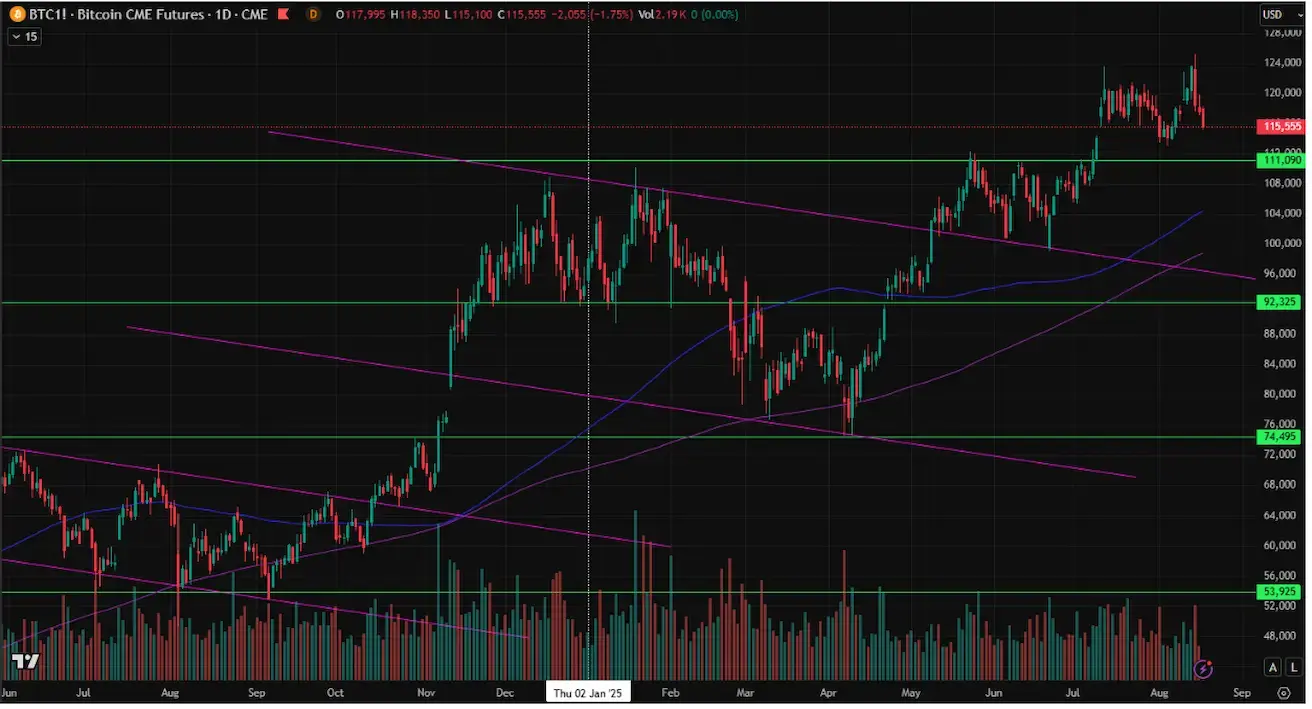
Bitcoin ateities sandoriai:
- +0,16 % (savaitės uždarymas 117 610 USD).
- Nuo metų pradžios +23,45 %.
Ethereum ateities sandoriai:
- +9,02 % (savaitės uždarymas 4448,5 USD).
- Nuo metų pradžios +31,46 %.
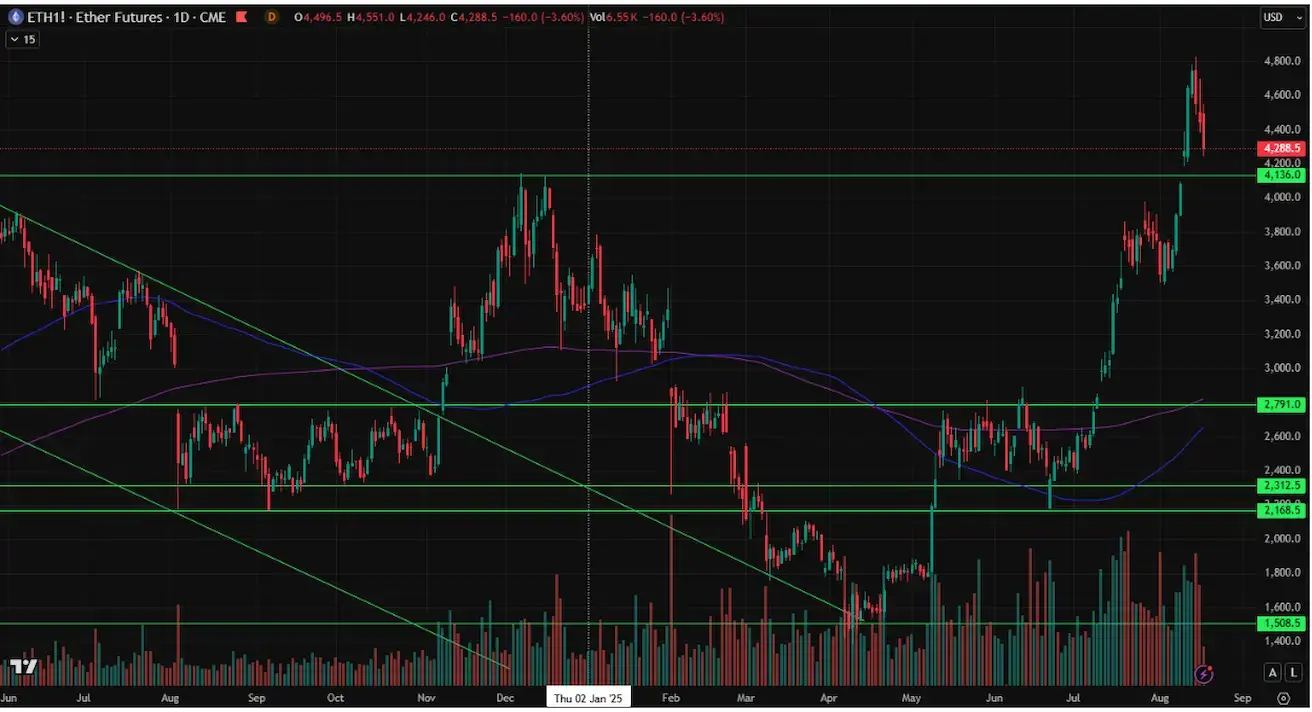
- Tiek BTC (ATH 125 tūkst. USD), tiek ETH (vietinis maksimumas 4800 USD) smuko po GKI paskelbimo.
- Šiandien prieš atidarymą: BTC –2 %, ETH –5 %.
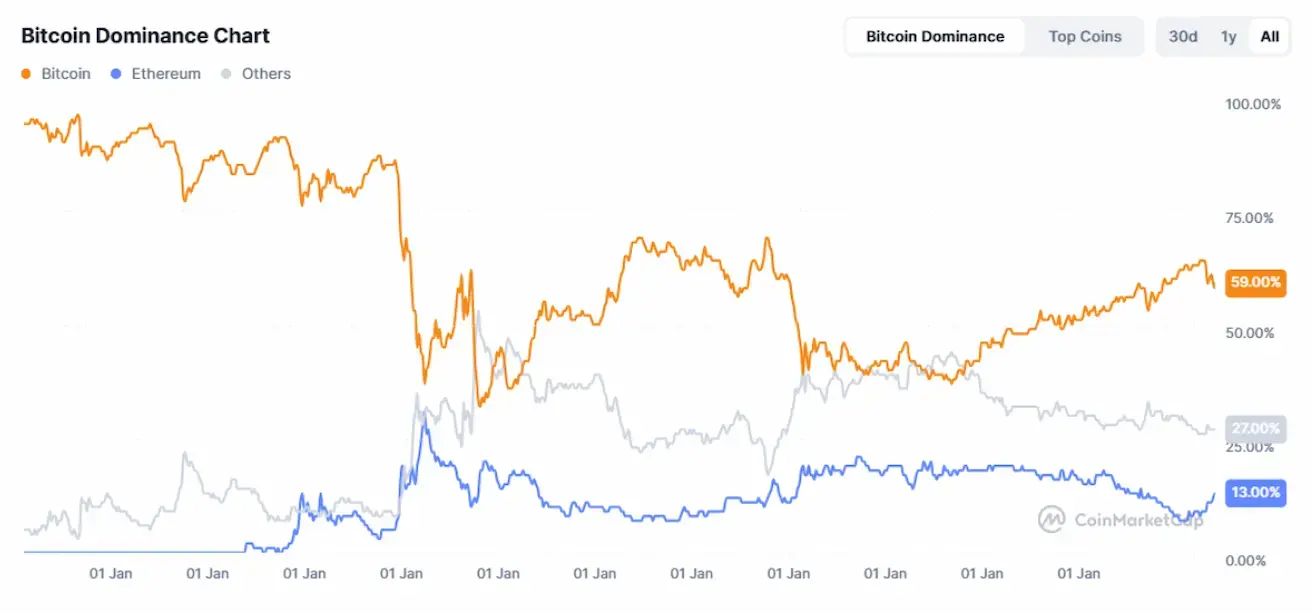
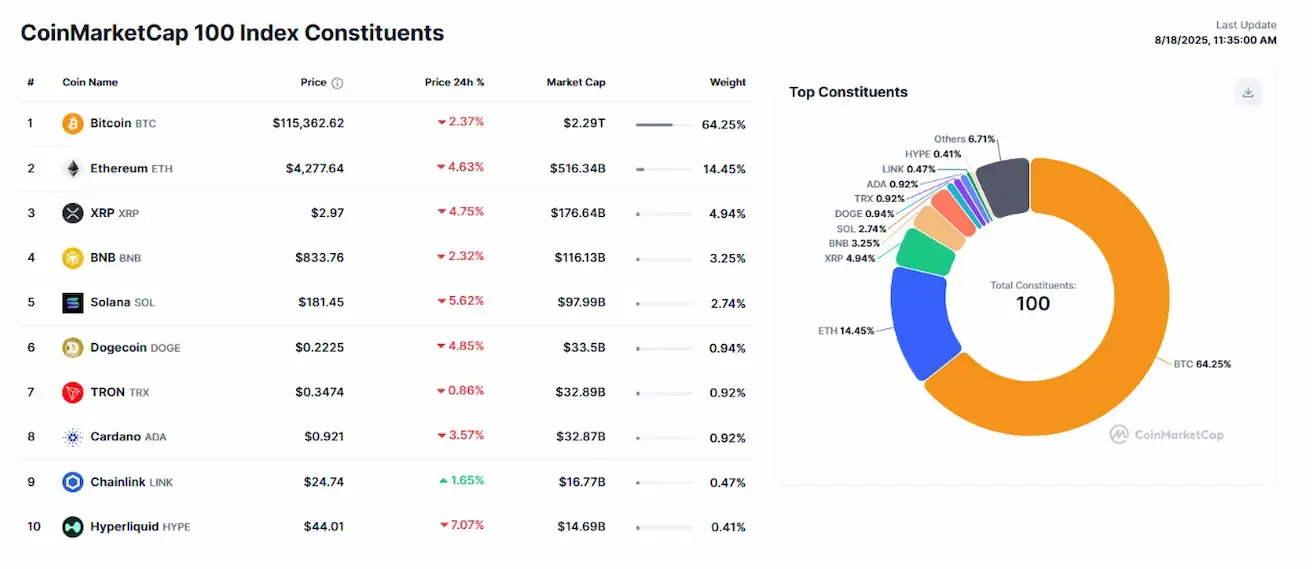
Rinkos kapitalizacija:
- 3,89 trln. USD (prieš 4,06 trln. USD praėjusią savaitę).
- BTC dominavimas: 59,0 % (ankst. 59,9 %).
- ETH dominavimas: 13,3 % (ankst. 12,8 %).
- Kitos kriptovaliutos: 27,7 % (ankst. 27,3 %).
Bitcoin atsargos įmonių balansuose:
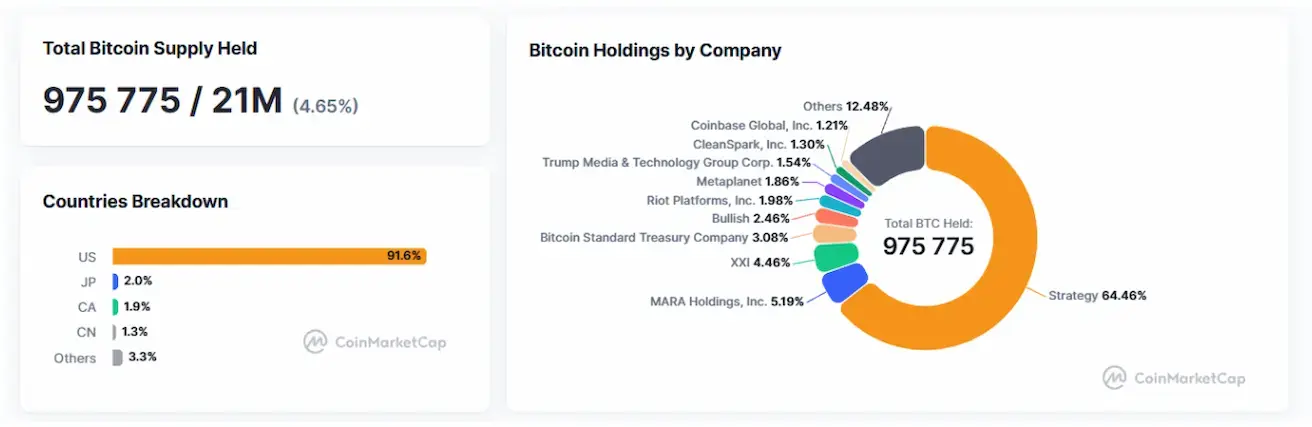
- Bendrovės laiko 4,65 % visos BTC pasiūlos; 91 % – JAV bendrovės.
Naujienos:
- JAV iždo sekretorius Scottas Bessentas atmetė tolesnius Bitcoin rezervų pirkimus (nepaisant ankstesnio palaikymo).
- Dabartiniai JAV BTC rezervai: 15–20 mlrd. USD.
Šaltinis: CryptoBriefing