 English
 Русский
 Қазақша
 Eesti
Eesti2025 m. rugpjūčio 25–29 d.: Savaitinis ekonomikos atnaujinimas
Svarbiausios rinkos naujienos

Makroekonominė statistika
INFLIACIJA
- Bazinis vartotojų kainų indeksas (CPI) (m/m) (birželis): 0,3% (ankstesnis: 0.2%)
- Vartotojų kainų indeksas (CPI) (m/m) (birželis): 0.2% (ankstesnis: 0.3%)
- Bazinis vartotojų kainų indeksas (CPI) (y/y) (birželis): 3.1% (ankstesnis: 2.9%)
- Vartotojų kainų indeksas (CPI) (y/y) (birželis): 2.7% (ankstesnis: 2.7%)
INFLIACIJOS LŪKESČIAI (MICHIGAN)
- 12 mėn. numatoma infliacija (gegužė): 4.8% (ankst.: 4.9%)
- 5 metų numatoma infliacija (balandis): 3.5% (ankst.: 3.4%)
GAMINTOJŲ KAINŲ INDEKSAS (PPI):
- PPI (m/m) (rugpjūtis): 0.9%, ankst.: 0.0%
- Bazinis PPI (m/m) (rugpjūtis): 0.9%, ankst.: 0.0%
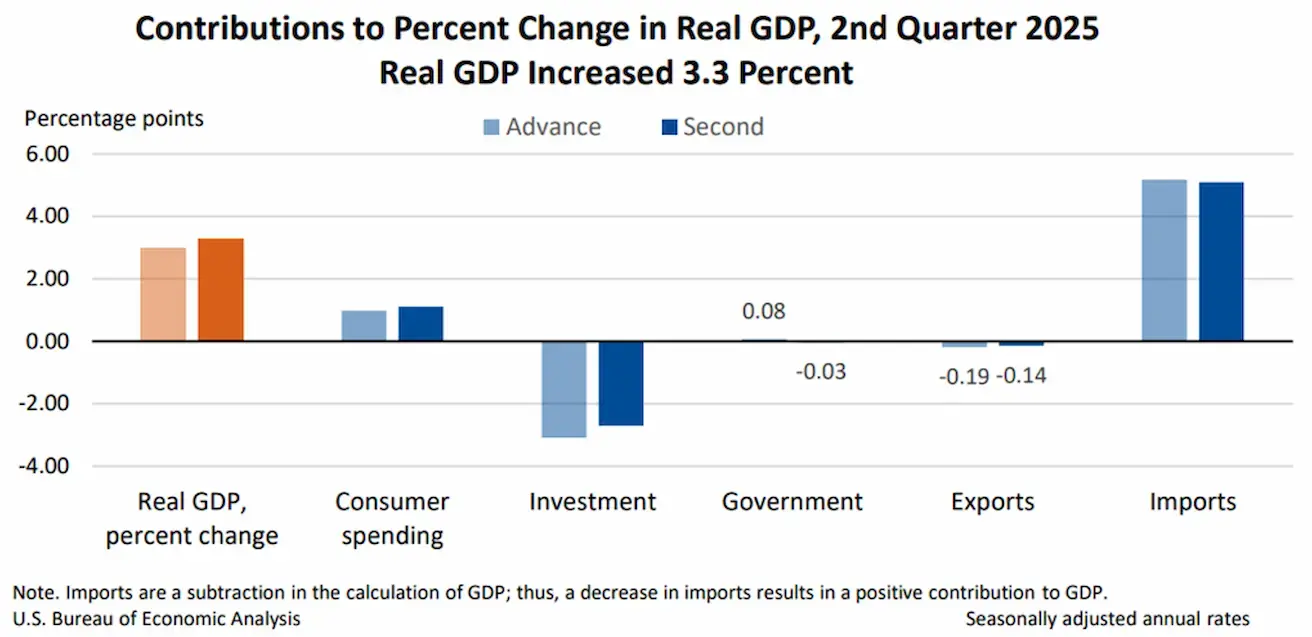
BVP (U.S. Bureau of Economic Analysis, BEA) (2025 m. II ketv., anualizuotas, antrasis įvertis): +3.30% (pirminis įvertis: 3.0%; 2024 m. I ketv.: –0.5%):
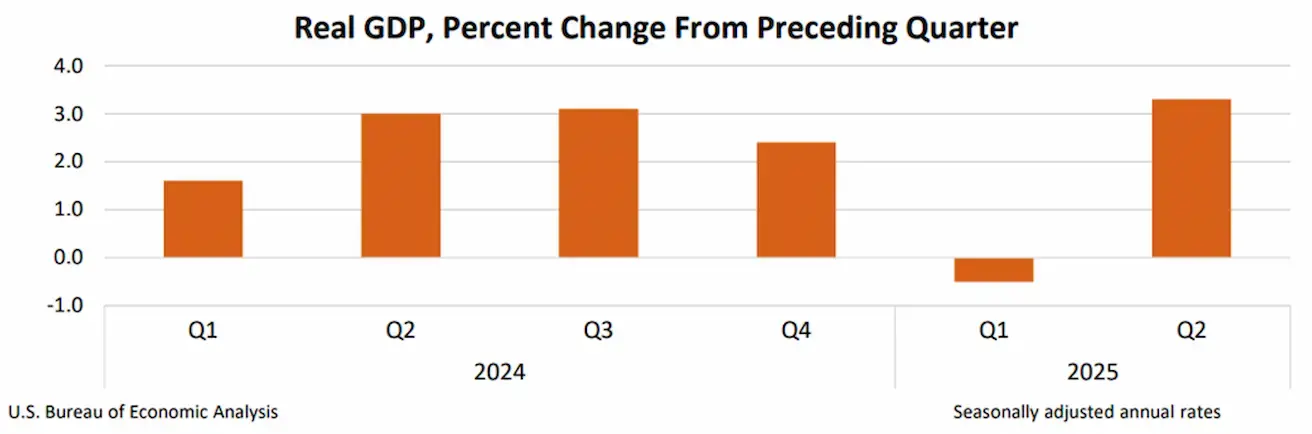
Realiojo BVP augimą antrąjį ketvirtį daugiausia lėmė importo sumažėjimas, kuris BVP skaičiavime yra atimamas, ir stipresnės vartotojų išlaidos. Šiuos laimėjimus iš dalies kompensavo investicijų ir eksporto sumažėjimas.
Atlanta Fed GDPNow rodiklis (II ketv.): 3.5% (palyginti su 2.2%).
*(GDPNow prognozavimo modelis pateikia „real-time“ oficialaus BVP augimo įvertį prieš jo paskelbimą, naudodamas metodiką, panašią į tą, kurią taiko U.S. Bureau of Economic Analysis.)
PCE (Federalinio rezervo pirmenybę teikiamas infliacijos rodiklis):
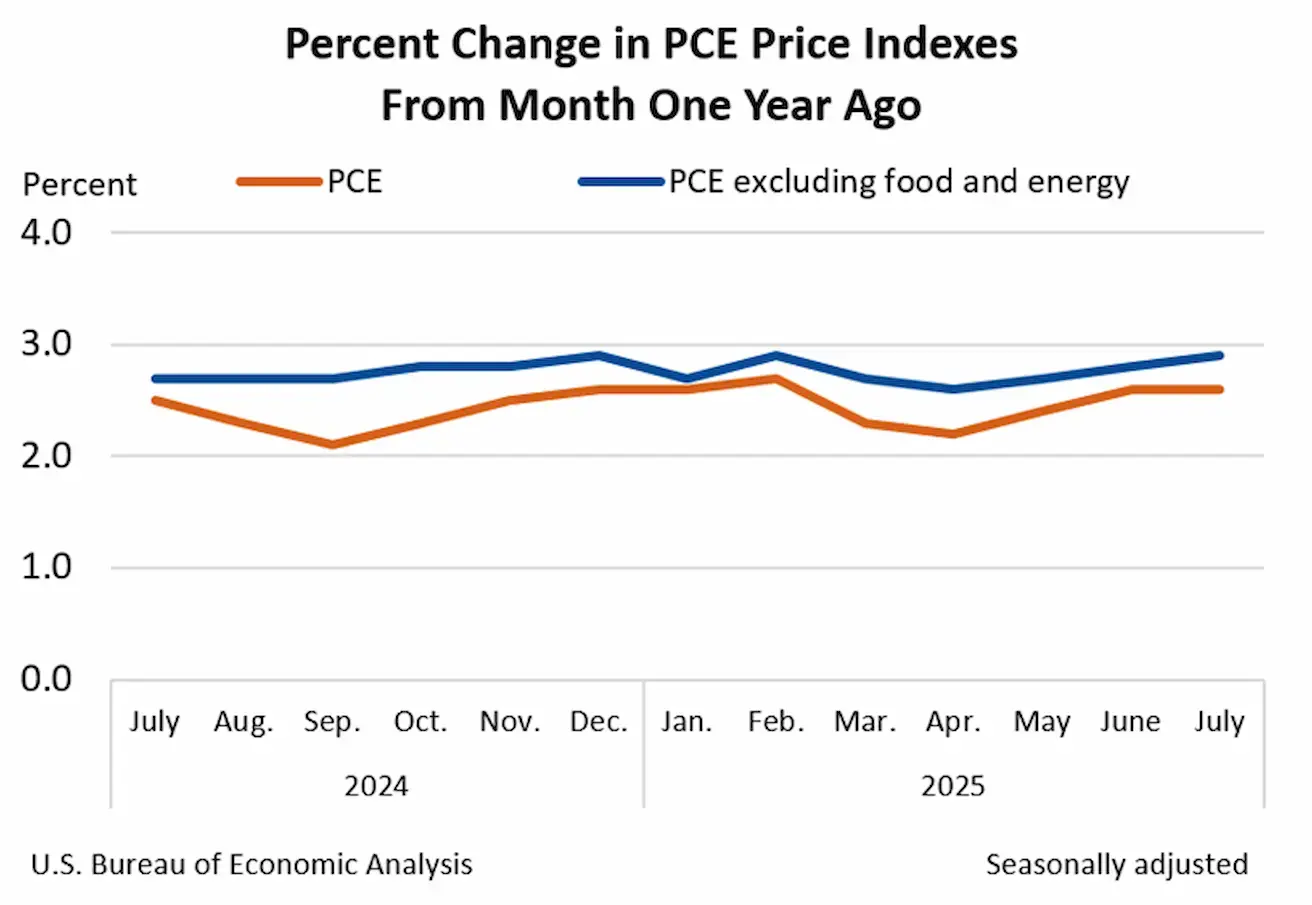
- Bazinis asmeninių vartojimo išlaidų (PCE) kainų indeksas (m/m, liepa): +0.3% (palyginti su 0.3%)
- PCE kainų indeksas (m/m, liepa): +0.2% (palyginti su 0.3%)
- Bazinis PCE kainų indeksas (y/y, liepa): +2.9% (palyginti su 2.8%)
- PCE kainų indeksas (y/y, liepa): +2.6% (palyginti su 2.6%)
JAV BVP defliatorius (q/q): 2.0% (palyginti su 3.8%)
BVP defliatorius – BVP kainų indeksas – matuoja metinį prekių ir paslaugų, įtrauktų į BVP, kainų pokytį.
Verslo aktyvumo indeksas (PMI):
(Virš 50 rodo plėtrą; žemiau 50 – susitraukimą)
- Paslaugų sektorius (liepa): 55.4 (ankstesnis: 55.7)
- Pramonės sektorius (liepa): 53.3 (ankstesnis: 49,8)
- „S&P Global Composite“ (liepa): 55.4 (ankstesnis: 55.1)
DARBO RINKA:
- Nedarbo lygis (birželis): 4.2% (ankstesnis: 4.1%)
- Ne žemės ūkio darbo vietų pokytis (birželis): 73 tūkst. (ankstesnis: 144 tūkst., patikslinta)
- JAV privačių ne žemės ūkio darbo vietų pokytis (birželis): 83 tūkst. (ankst.: 137 tūkst.)
- Vidutinis valandinis darbo užmokestis (birželis, y/y): 3.9% (ankstesnis: 3.8%)
- JOLTS laisvos darbo vietos (gegužė): 7.769 mln. (palyginti su 7.395 mln.)
PINIGŲ POLITIKA
- Federalinių fondų efektyvioji palūkanų norma (EFFR): 4.25% - 4.50% (be pokyčių)
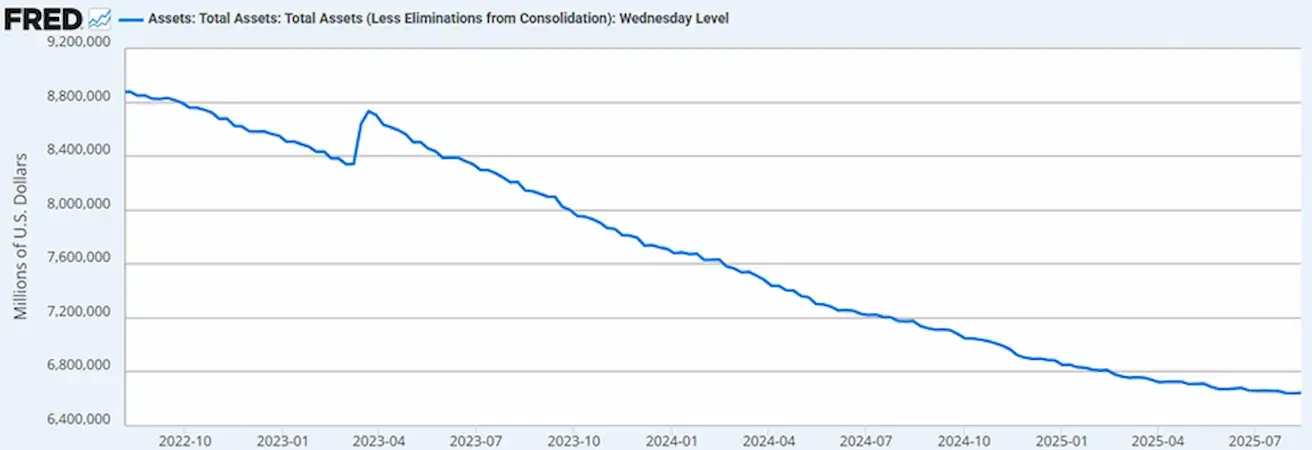
- Federalinio rezervo balansas padidėjo iki: $6,603T (palyginti su praėjusia savaite: $6,18T)
RINKOS PALŪKANŲ NORMOS PROGNOZĖ
Šiandien
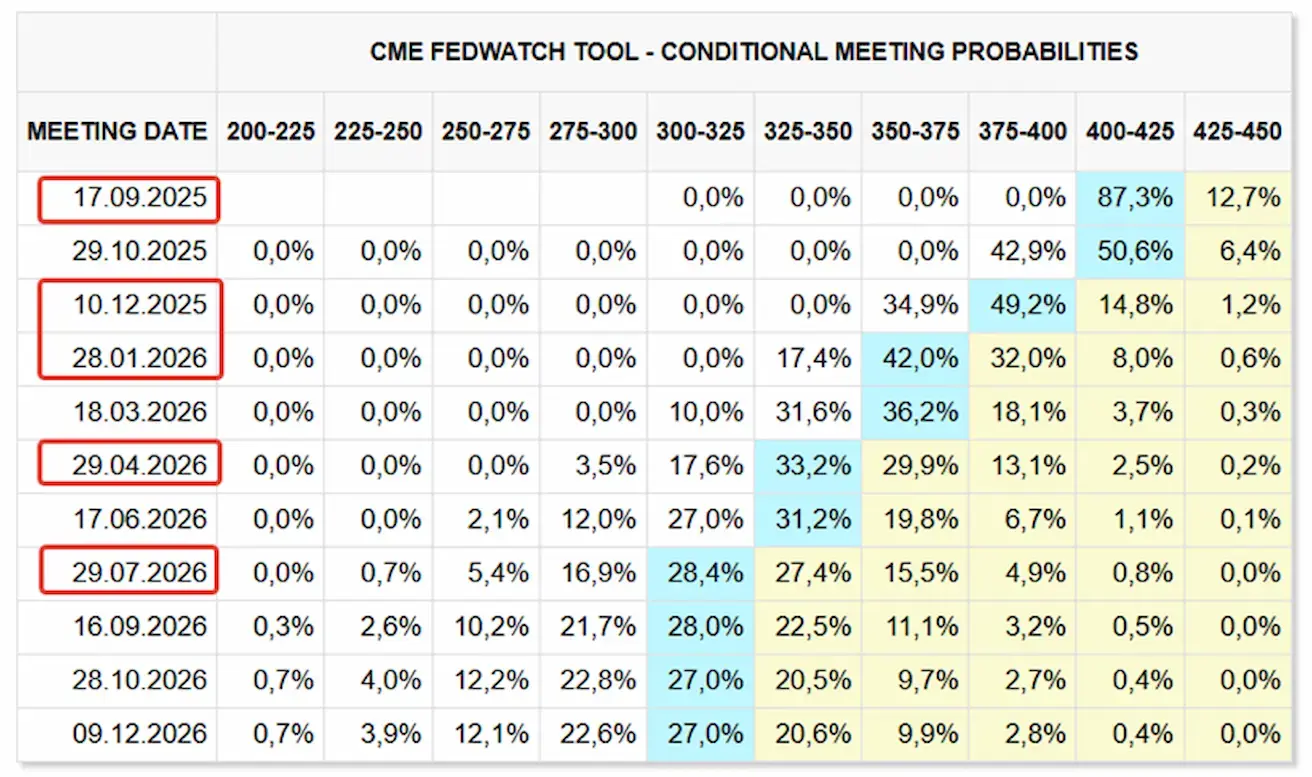
Prieš savaitę:
Komentaras
Pagrindinės išvados iš ECB pinigų politikos posėdžio protokolo:
- Infliacijos dinamika: infliacija atitinka Vykdomosios tarybos vidutinio laikotarpio tikslą – 2%. Birželį ji pakilo nuo 1.9% gegužę iki 2.0%, daugiausia dėl energijos infliacijos atšokimo nuo –3.6% iki –2.6%. Maisto kainų infliacija šiek tiek sumažėjo – nuo 3.2% iki 3.1%. Bazinė infliacija (HICP be energijos ir maisto) birželį išliko nepakitusi – 2.3%. Remiantis naujausiomis energijos ateities sandorių kainomis, prognozuojama, kad bendroji infliacija likusią 2025 m. dalį išliks dabartiniame lygyje ir tik 2026 m. pirmąjį ketvirtį pasieks žemiausią lygį – apie 1.5%. Dauguma ilgalaikių infliacijos lūkesčių rodiklių išlieka įsitvirtinę ties maždaug 2%.
- Pasaulinis PMI: pasaulinis sudėtinis pirkimo vadybininkų indeksas (PMI), neįskaitant euro zonos, antrąjį ketvirtį vidutiniškai sumažėjo iki 51.4 nuo 52.0 pirmąjį ketvirtį, atspindėdamas tiek pramonės, tiek paslaugų sektorių sulėtėjimą.
- Euro zonos atsparumas: iš dalies dėl ankstesnio Vykdomosios tarybos palūkanų normų mažinimo euro zonos ekonomika išliko atspari sudėtingoje pasaulinėje aplinkoje. 2025 m. I ketvirtį augimas viršijo lūkesčius, jį skatino eksporto šuolis prieš numatomą tarifų didinimą, ypač Airijos farmacijos sektoriuje. Teigiamai prisidėjo ir privatus vartojimas bei investicijos, o atsargos darė neigiamą įtaką.
- Darbo rinka: nedarbo lygis per pastaruosius metus iš esmės nepasikeitė ir gegužę sudarė 6.3%. Užimtumas 2025 m. I ketvirtį augo 0.2%, palyginti su 0.1% 2024 m. IV ketvirtį. Kadangi realiojo BVP augimas viršijo užimtumo augimą, darbo našumas padidėjo tiek valandai, tiek darbuotojui.
- Rizikos: neigiamos ekonomikos augimo rizikos išlieka. Pagrindinės rizikos – tolesnė pasaulinės prekybos įtampų eskalacija ir su tuo susijęs neapibrėžtumas, galintis slopinti eksportą ir lemti investicijų bei vartojimo mažėjimą.
Antrasis JAV BVP duomenų paskelbimas parodė aukštyn pakoreguotą įvertį: antrasis įvertis siekė +3.30% (pirminis įvertis: 3.0%; 2024 m. I ketv.: –0.5%).
Rinkos laukė vartojimo išlaidų (PCE) duomenų, kurie neparodė mėnesinio augimo tempų paspartėjimo. Metų bazėje PCE indeksas išliko nepakitęs – 2.6%, o bazinis PCE paaugo 0.1 procentinio punkto, iki 2.9%. Šie skaičiai šiuo etapu nekelia nerimo, todėl bendra infliacijos situacija išlieka mišri.
JAV BVP defliatorius rodo mažėjančius infliacinius spaudimus (q/q: 2.0% prieš 3.8%). Tačiau lūkesčiai išlieka gerokai virš tikslo: 12 mėn. į priekį prognozuojama infliacija siekia 4.8%, o 5 metų infliacijos lūkestis (rugpjūtis) – 3.5%.
Per pastarąjį posėdį pirmininkas Powellas signalizavo, kad FED ketina laikytis aktyvios pinigų politikos pozicijos infliacijos akivaizdoje. Tuo tarpu bedarbių paraiškų skaičiaus augimas sulėtėjo ir darbo rinka atrodo mažiau kelianti nerimą. Apskritai FED rizikų balansas išlieka pasviręs infliacijos kryptimi.
Rinkos į makroekonominius duomenis sureagavo nedideliu kritimu.
Trumpas atleido Federalinio rezervo valdytoją Lisą Cook dėl įtarimų sukčiavimu su būsto paskolomis. Atsakydama Cook pateikė ieškinį, ginčijantį šį sprendimą. Trumpas į FED valdybą paskyrė Judy Shelton, o patvirtinimo klausymus numatyta surengti rugsėjo 4 d.
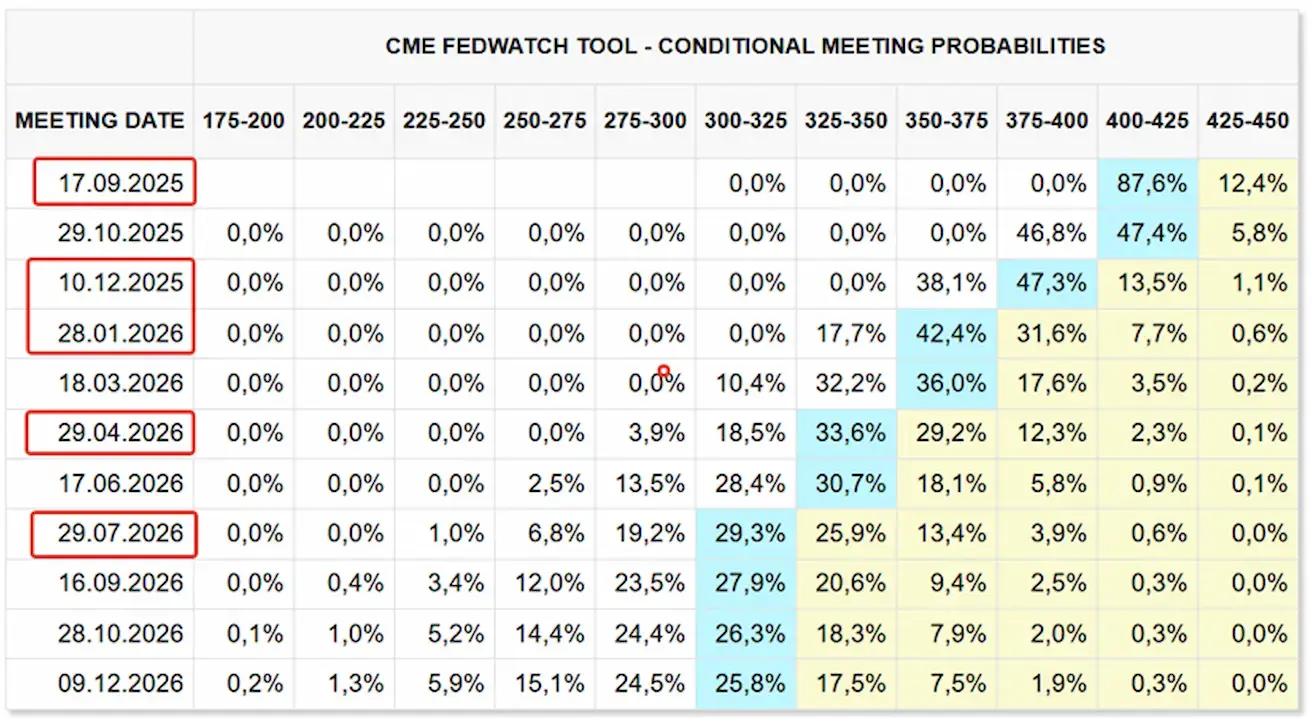
Tuo pačiu metu FED valdytojas Christopheris Walleris išreiškė paramą 25 bazinių punktų palūkanų normos sumažinimui per rugsėjo FOMC posėdį. Rinkos lūkesčiai pagal FedWatch:
- Kitas posėdis (rugsėjo 17 d.): vertinama palūkanų normos sumažinimo tikimybė – 87.6%
- Per artimiausius 12 mėn.: tikimasi penkių 25 bazinių punktų mažinimų, tikslinį intervalą sumažinant iki 3.00–3.25%
- Iki metų pabaigos: rinkos vis dar įkainoja du sumažinimus.
Trumpo muitų vizualizacija:
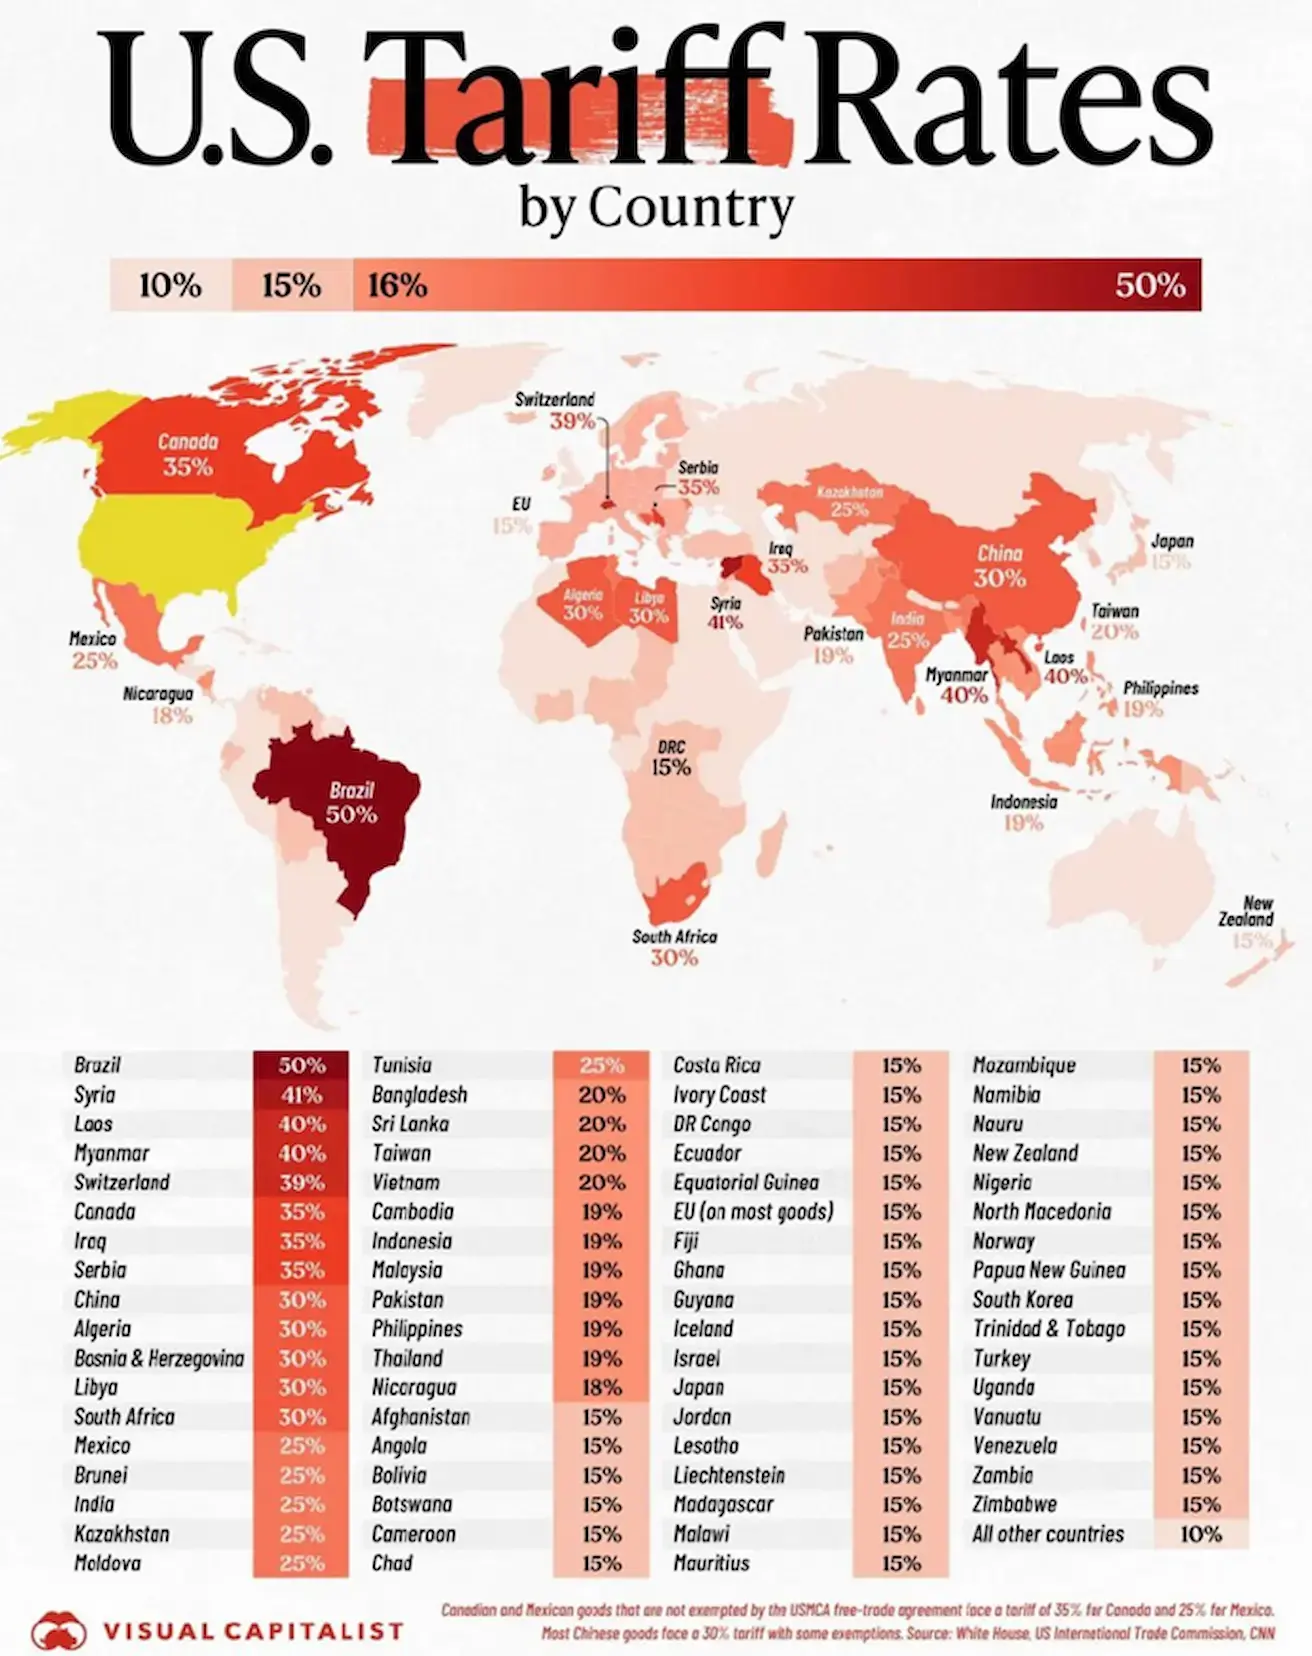
Naujausia raida:
- JAV muitai Indijai: Jungtinės Valstijos taiko 50% muitus Indijai, išskyrus elektroniką ir farmacijos produktus. Jeigu jie bus išlaikyti, šie muitai gali sulėtinti Indijos ekonomiką, kuri šiuo metu, tarp kitų besiformuojančių rinkų, fiksuoja sparčiausią – 7.4% – augimą.
- Kinija ir retosios žemės: Trumpas pareiškė, kad Kinija turi užtikrinti retųjų žemių magnetų tiekimą arba susidurs su 200% muitais.
- ES pasiūlymas: šią savaitę Europos Sąjunga ketina pasiūlyti panaikinti visus muitus JAV pramoninėms prekėms, kad patenkintų Trumpo reikalavimus ir sumažintų muitus automobilių eksportui iš bloko. Komisija taip pat ketina įvesti lengvatinius tarifus jūros gėrybėms ir žemės ūkio produktams. Dabartiniai muitai ES automobiliams, eksportuojamiems į JAV, siekia 27.5% ir būtų sumažinti iki 15%, bet tik įsigaliojus teisės aktams, panaikinantiems pramoninių prekių muitus.
- Įmonių perspektyvos: „Walmart“ generalinis direktorius pareiškė, kad su muitais susijusios išlaidos turėtų padidėti III ir IV ketvirčiais.
Rinka
Per savaitę medianinis nuosmukis sudarė +0.14%. Pirmaujantys sektoriai: energetika, bazinės žaliavos ir nekilnojamasis turtas.
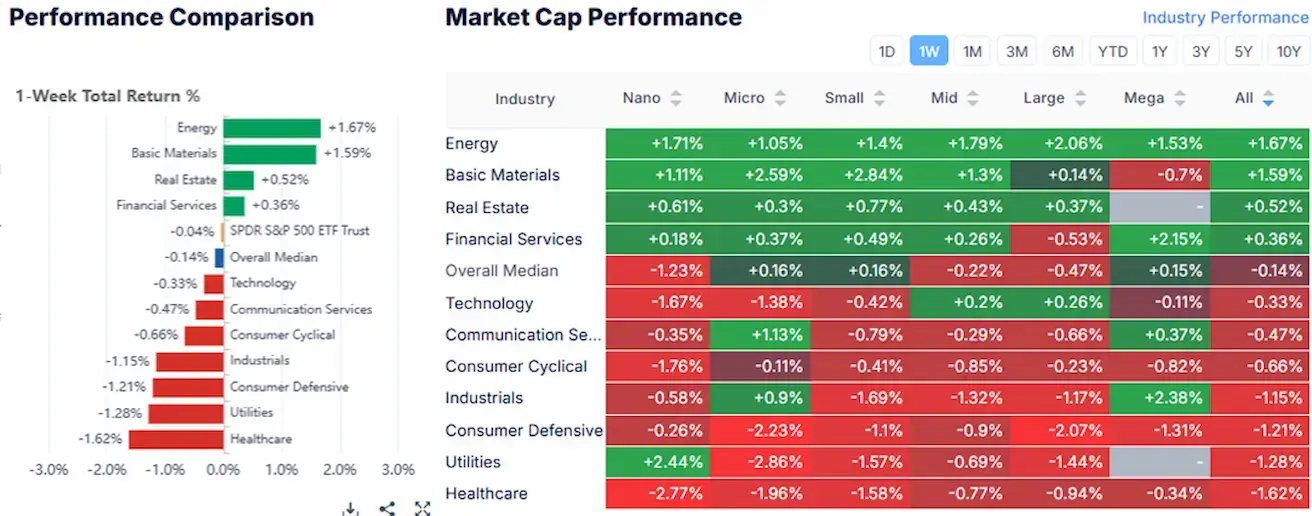
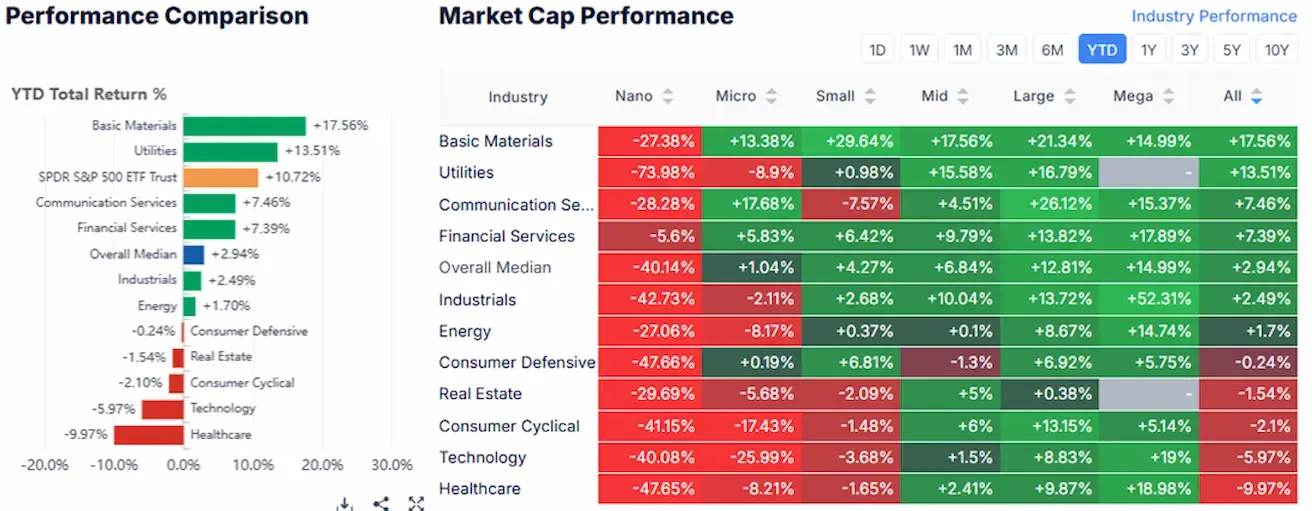
YTD (metų pradžios rezultatas): +2.73%. Pirmaujantys sektoriai išlieka komunalinės paslaugos, bazinės žaliavos ir ryšių paslaugos. Atsiliekantys sektoriai – technologijos (–5.97%) ir sveikatos priežiūra (–9.97%).
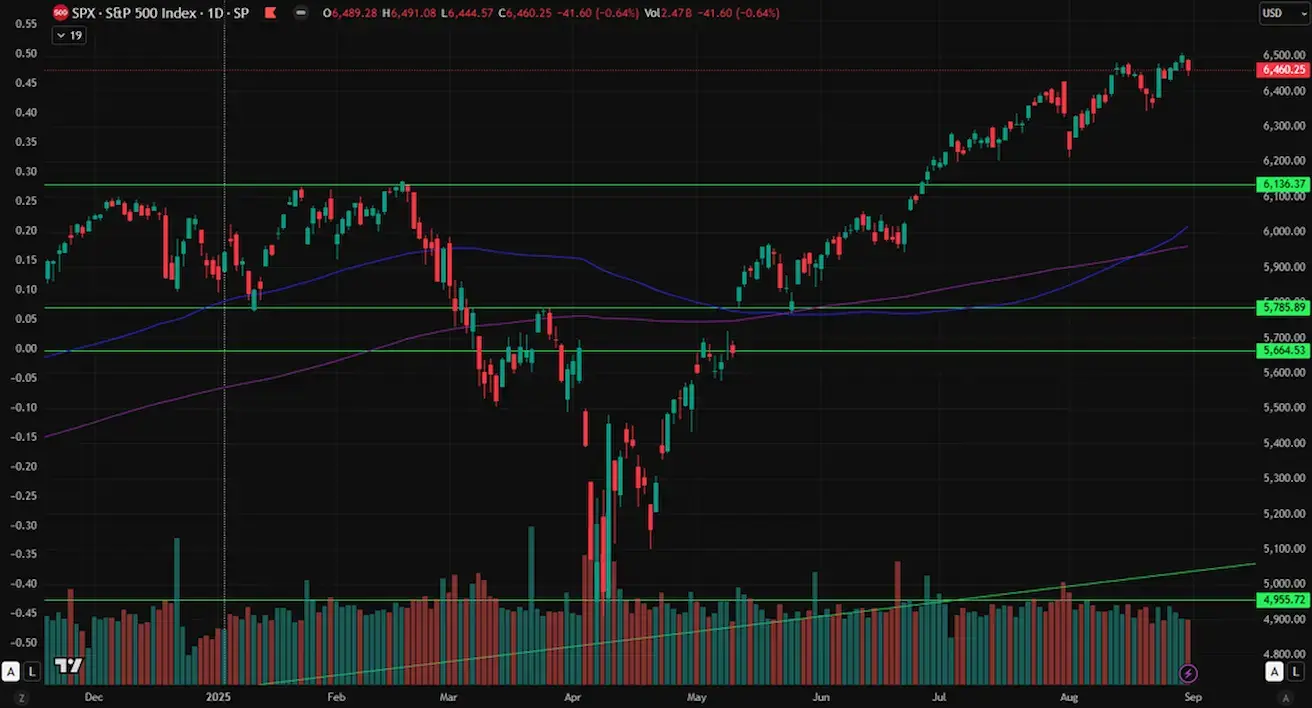
SP500
S&P 500 indeksas ketvirtadienį pakilo iki naujo visų laikų rekordo – 6,508, tačiau savaitę užbaigė nukritęs 0.1% iki 6,460.20. 2025 m. metų pradžios rezultatas: +9.44%.
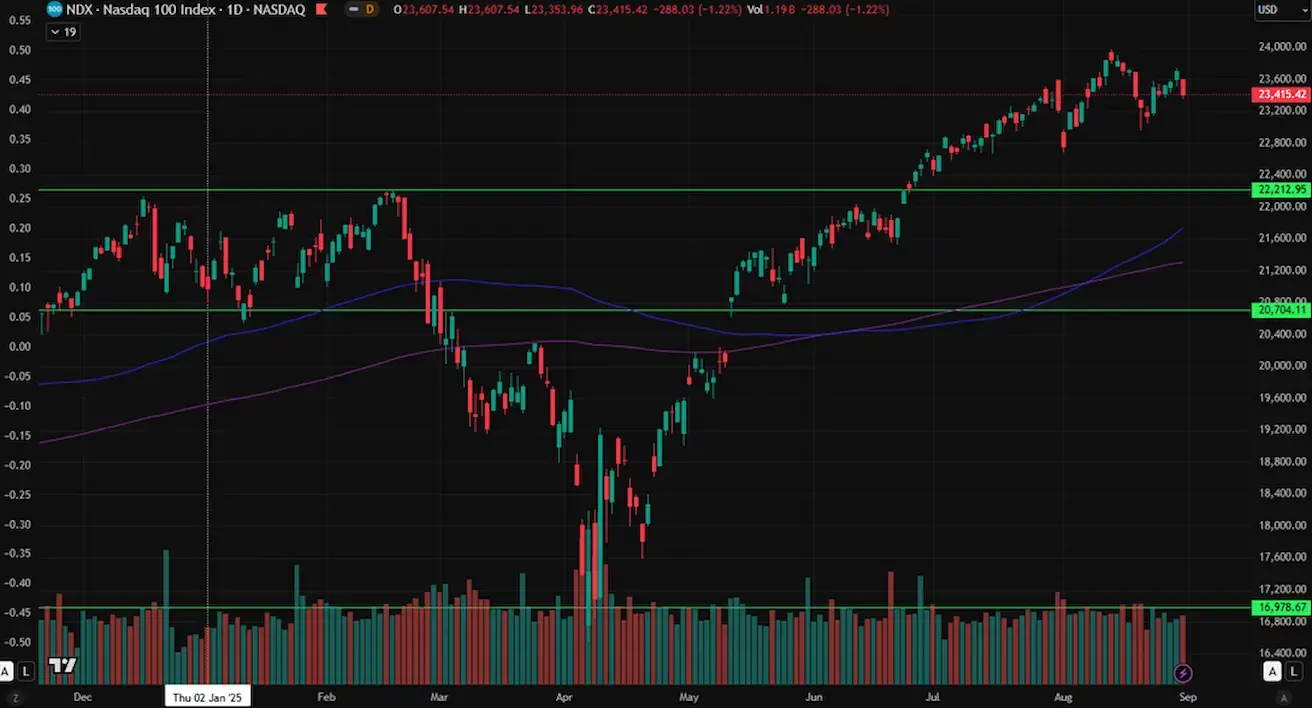
NASDAQ100
„Nasdaq 100“ savaitę užbaigė sumažėjęs –0.35%, užsidarydamas ties 23,415.42. Metų pradžios rezultatas: +10.87%.
NVDA
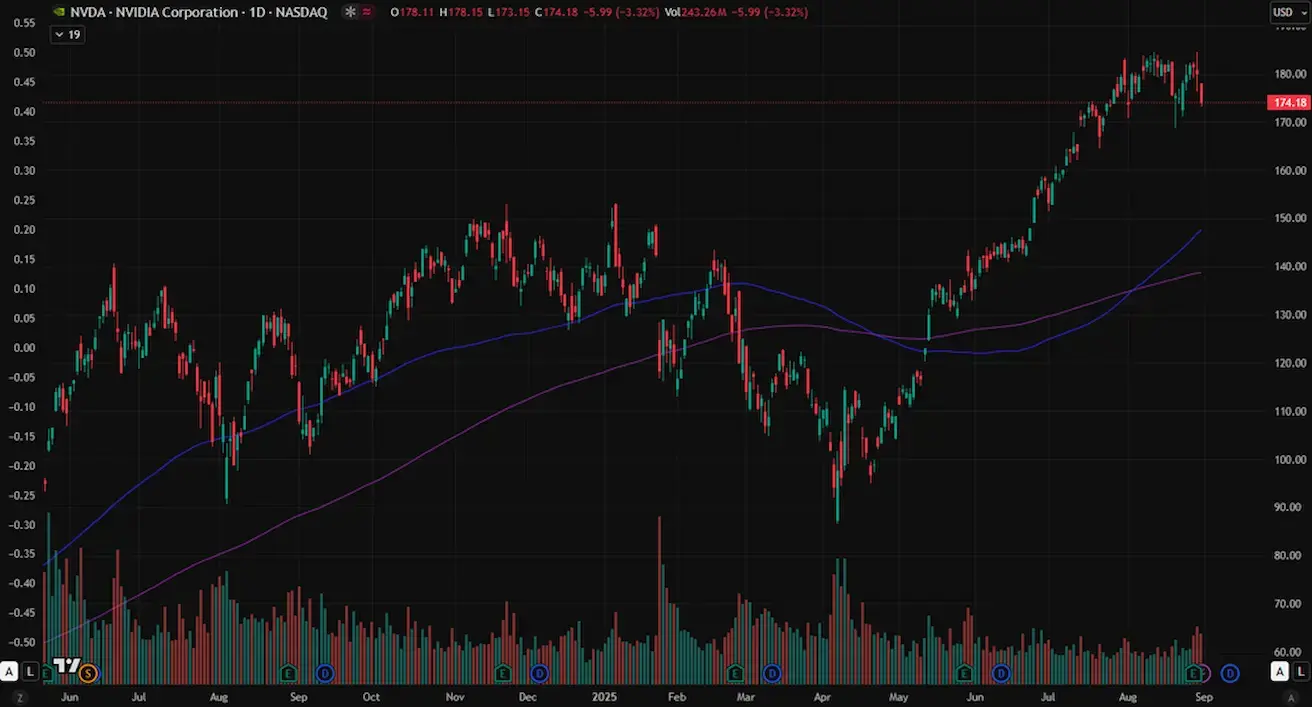
Antrąjį ketvirtį pardavimai išaugo 56% – iki 46.7 mlrd. USD, nors tai buvo lėčiausias augimo tempas per dvejus metus. Grynosios pajamos sudarė 1.05 USD akcijai (palyginti su 1.01 USD prognoze). Duomenų centrų segmentas sugeneravo 41.1 mlrd. USD, o žaidimų pajamos pasiekė 4.29 mlrd. USD – abu rodikliai viršijo lūkesčius.
Nvidia pateikė atsargesnę III ketvirčio prognozę, numatydama 54 mlrd. USD pajamas – mažiau nei optimistiškesnės 60 mlrd. USD prognozės. Po ataskaitos paskelbimo akcijų kaina smuko 4.5%.
Nvidia generalinio direktoriaus Jenseno Huango komentarai:
- Silpnumas Kinijoje išlieka pagrindine rizika: H20 lustas dar nepradėtas tiekti, o tai įmonei kainuoja apie 4 mlrd. USD negautų pajamų.
- III ketvirčio prognozėje H20 neįtrauktas.
- JAV eksporto apribojimai ir planuojamas 15% pajamų susigrąžinimas iš Kinijos gali reikšmingai paveikti pardavimus (Nvidia ir AMD sutiko pervesti 15% AI lustų pajamų Kinijoje JAV vyriausybei, kad gautų eksporto licencijas).
- Huangas pabrėžė, kad „iki dešimtmečio pabaigos AI infrastruktūrai bus išleista 3–4 trln. USD“, taip pat akcentuodamas Kinijos rinkos potencialą, jei prekybos barjerai būtų panaikinti.
Įmonė patvirtino naują 60 mlrd. USD vertės akcijų supirkimo programą. Metinės pajamos galėtų pasiekti 200 mlrd. USD ir iki 2028 m. viršyti 300 mlrd. USD, sudarydamos maždaug trečdalį pasaulinės puslaidininkių pramonės.
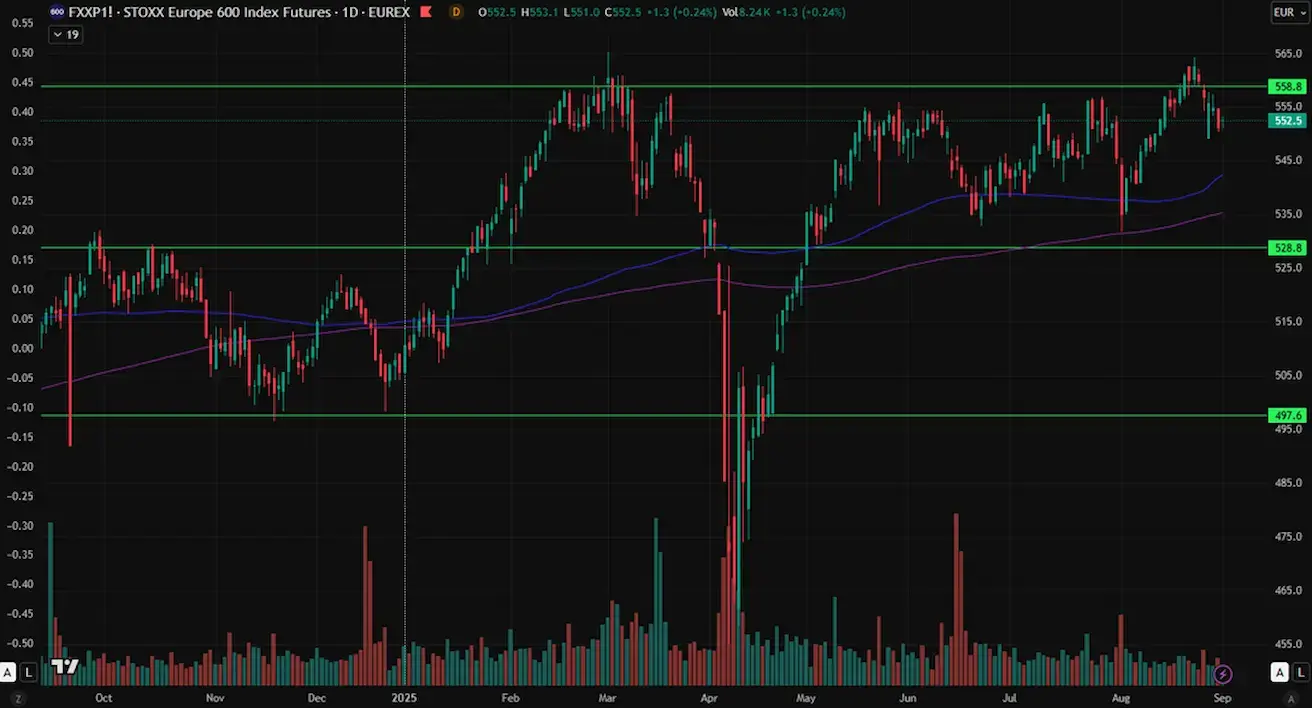
Euro Stoxx 600
Savaitę užbaigė sumažėjęs –2.01%, užsidarydamas ties 551.2. Metų pradžios rezultatas: +9.02%.
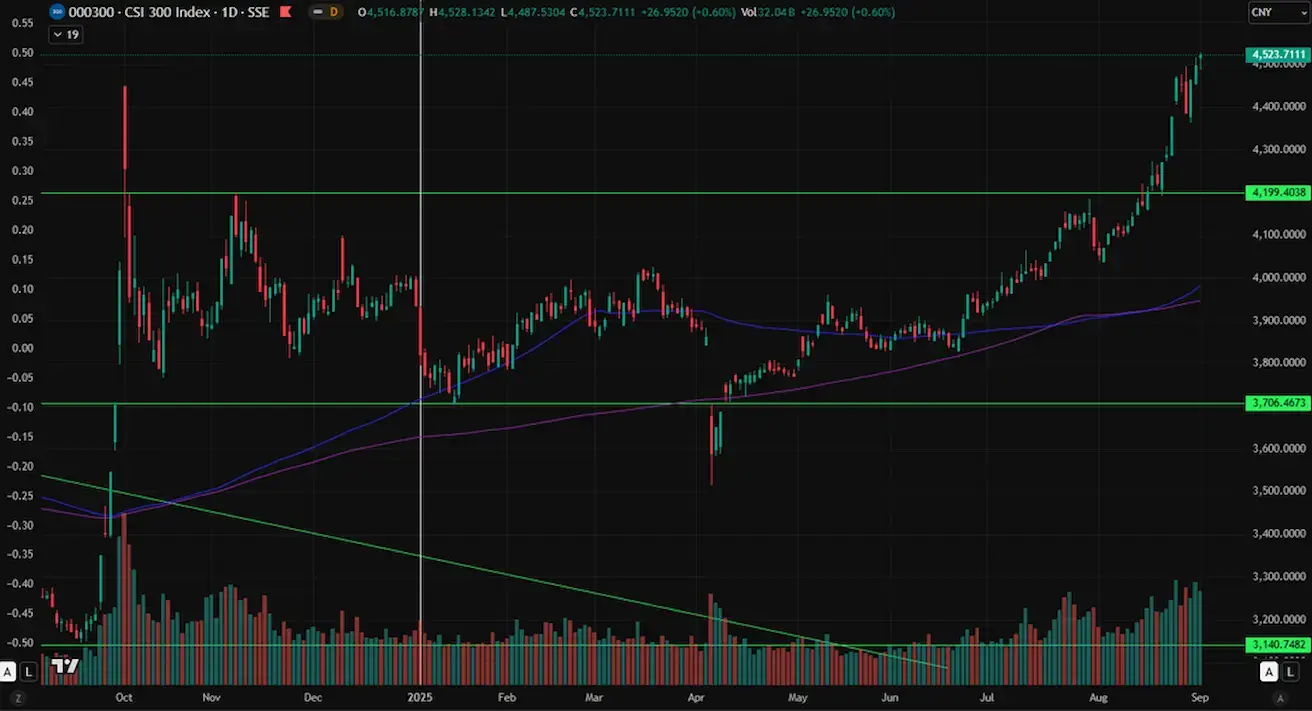
CSI indeksas: +1.22% iki 4,523.71. Metų pradžios rezultatas: +15.08%.
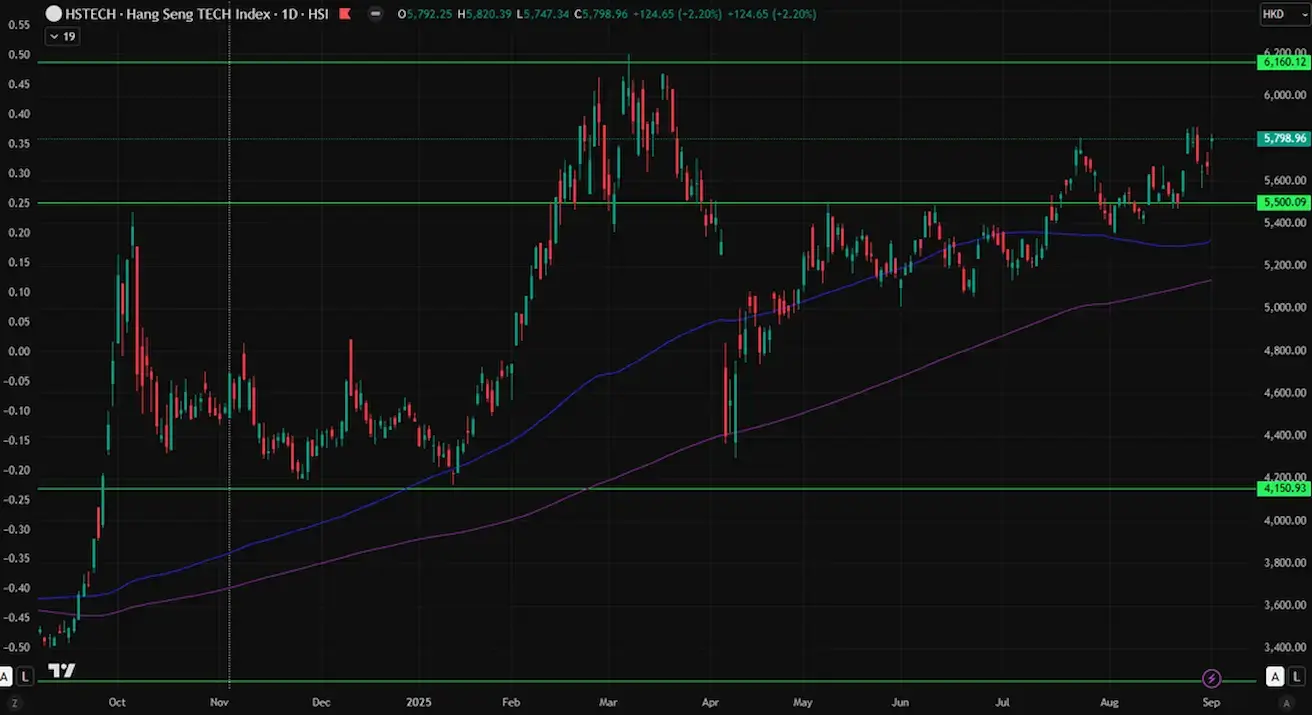
Hang Seng TECH indeksas (HSTECH.HK): –1.45% pirmadienį, užsidarė ties 5,798.96. Metų pradžios rezultatas: +30.70%.
OBLIGACIJŲ RINKA
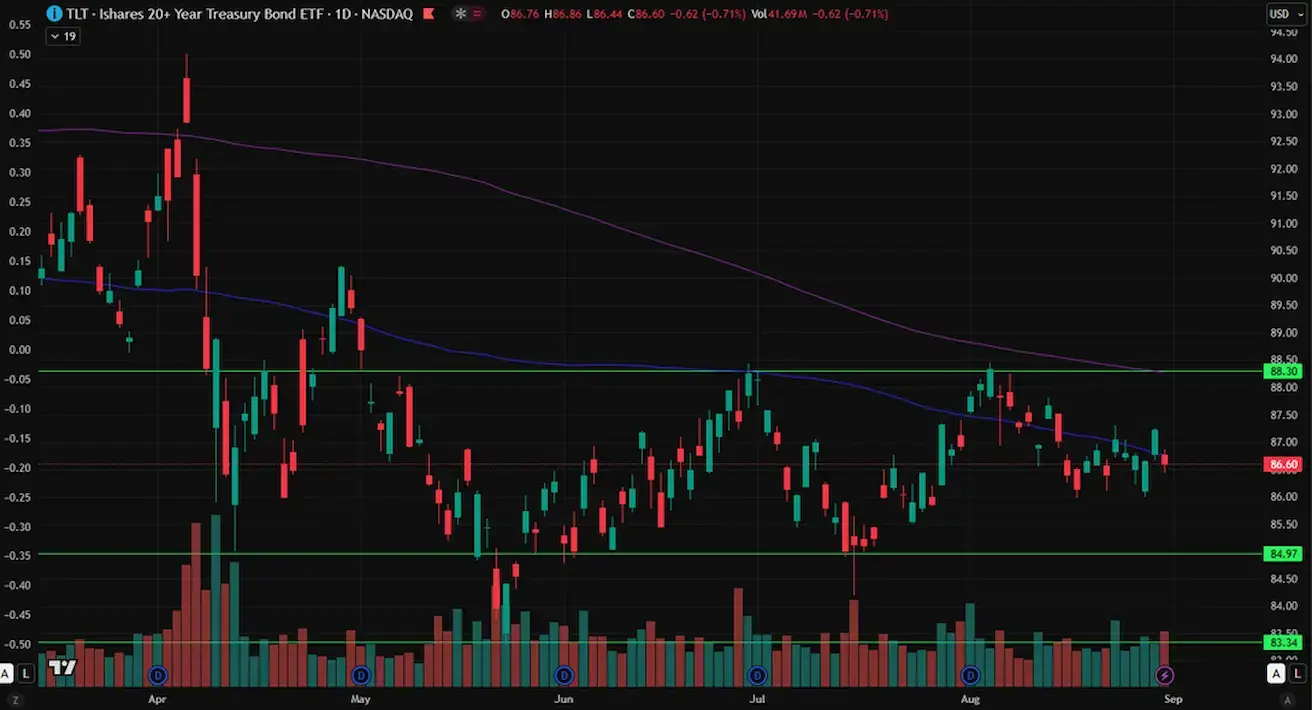
Obligacijų rinka savaitę užbaigė neutralia dinamika. JAV iždo obligacijos 20+ (ETF TLT): savaitės rezultatas –0.52%, užsidarė ties 86.6. 2025 m. metų pradžios rezultatas: –1.37%.
JAV 2 metų iždo vekselių aukcionas: 3.641%. JAV iždas leidžia naują skolą mažesne palūkanų norma.
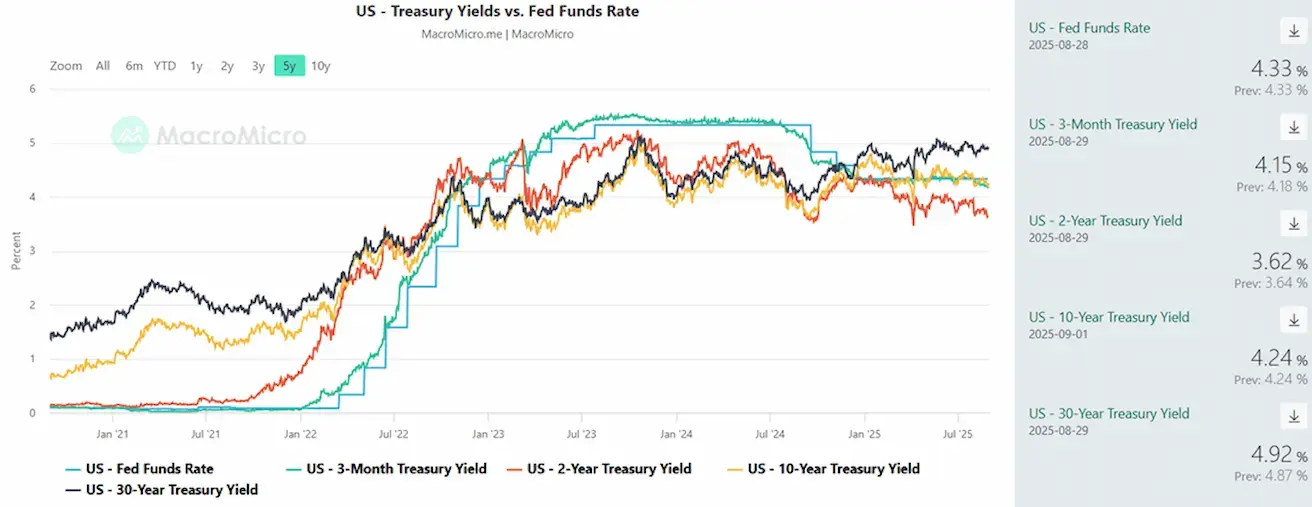
PAJAMINGUMAI IR SPREDAI 2025/08/25 vs 2025/08/18
- JAV 10 metų trukmės iždo vertybinių popierių rinkos pajamingumas: 4.24% (vs. 4.273%)
- ICE BofA BBB JAV įmonių obligacijų indekso efektyvus pajamingumas: 5.06% (vs. 5.17%)
- Pajamingumo spredas (10 m. vs. 2 m. JAV iždo obligacijos): 62.0 bps (vs. 55.0 bps)
- Pajamingumo spredas (10 m. vs. 3 mėn. JAV iždo obligacijos): 9.0 bps (vs. 4.6 bps)
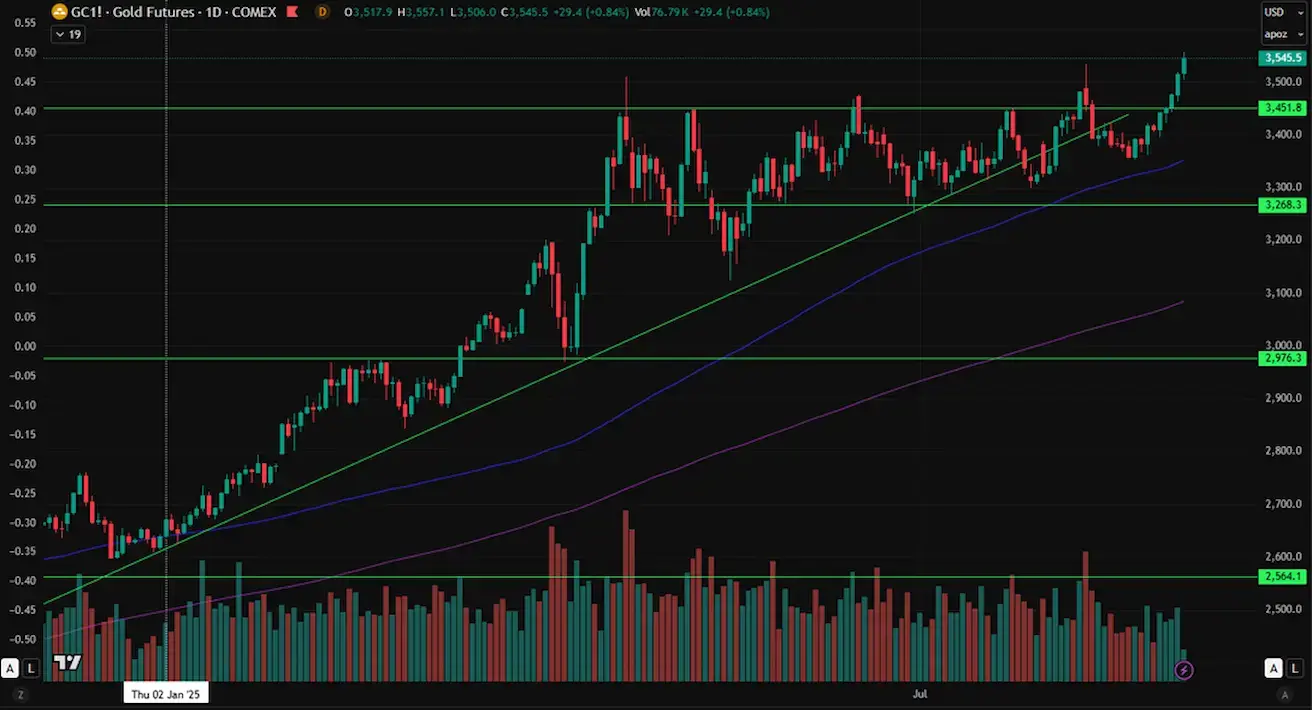
AUKSO ATEITIES SANDORIAI (GC)
Per savaitę: +2.89%, užsidarė ties $3,516.1/oz. Metų pradžios augimas: +33.14%. Šiandien ateities sandoriai pasiekė naują visų laikų rekordą – $3,557/oz.
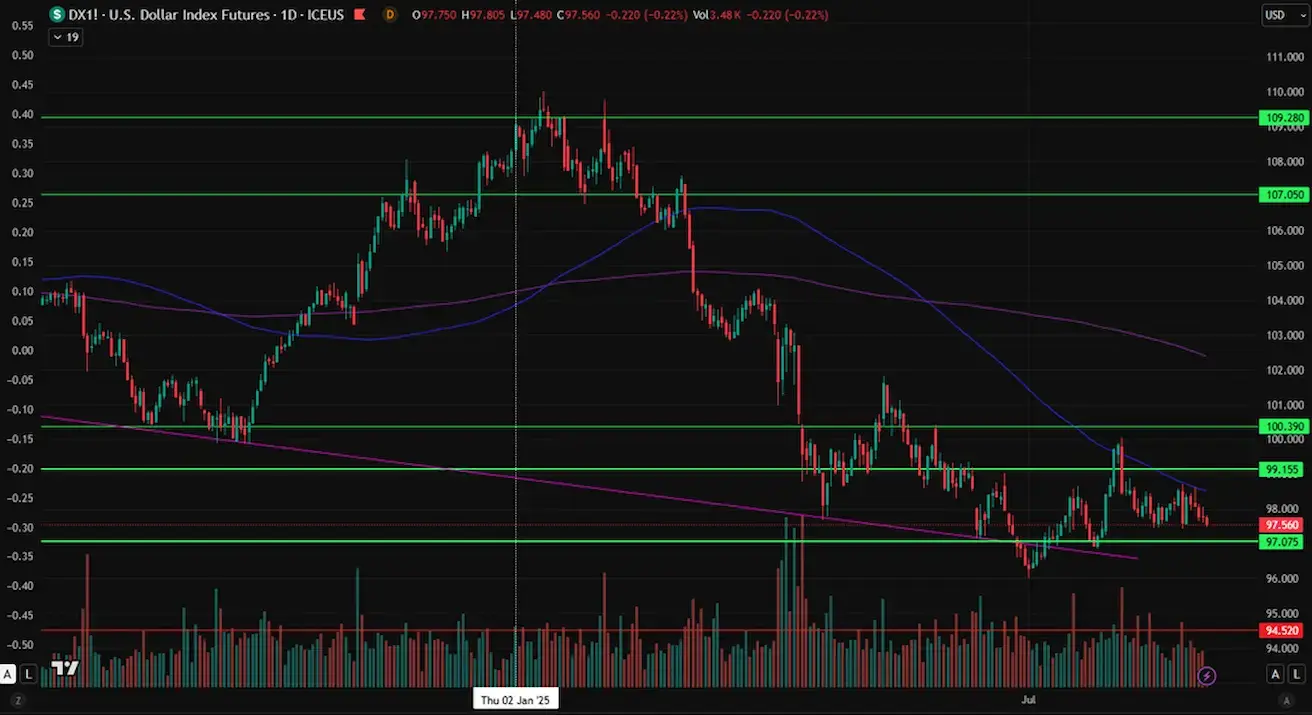
DOLERIO INDEKSO ATEITIES SANDORIAI (DX)
Per savaitę: +0.18%, užsidarė ties 97.780. 2025 m. metų pradžios rezultatas: –9.74%.
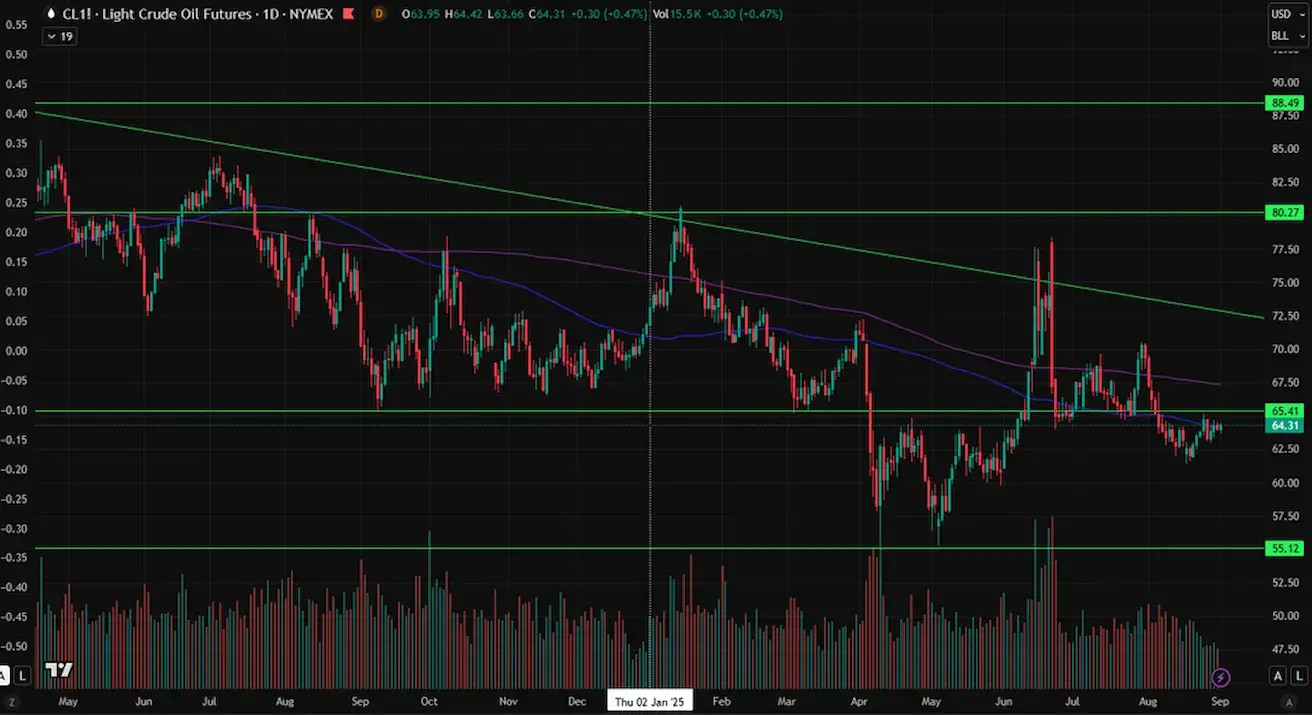
NAFTOS ATEITIES SANDORIAI
Per savaitę: +0.38%, užsidarė ties $64.01 už barelį. Metų pradžios rezultatas: –10.91%.
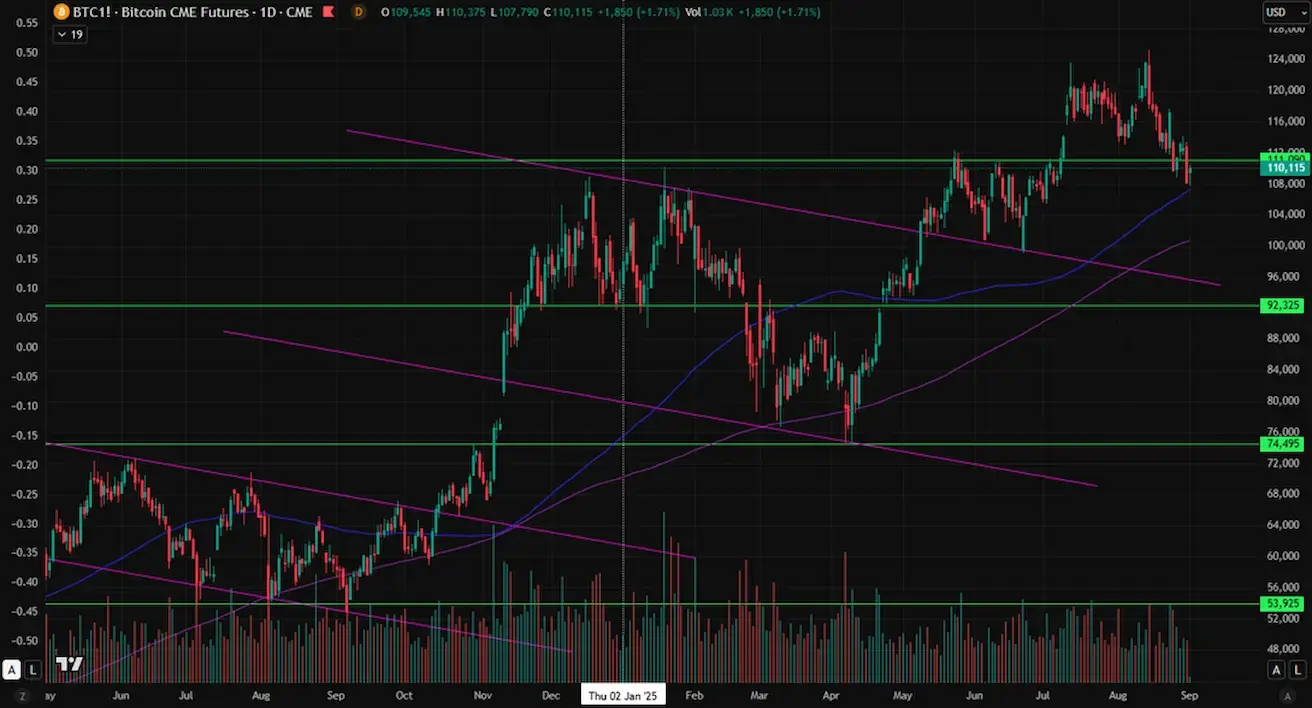
BTC ATEITIES SANDORIAI
Per savaitę: –4.64%, užsidarė ties $108,420. Metų pradžios grąža: +13.80%.
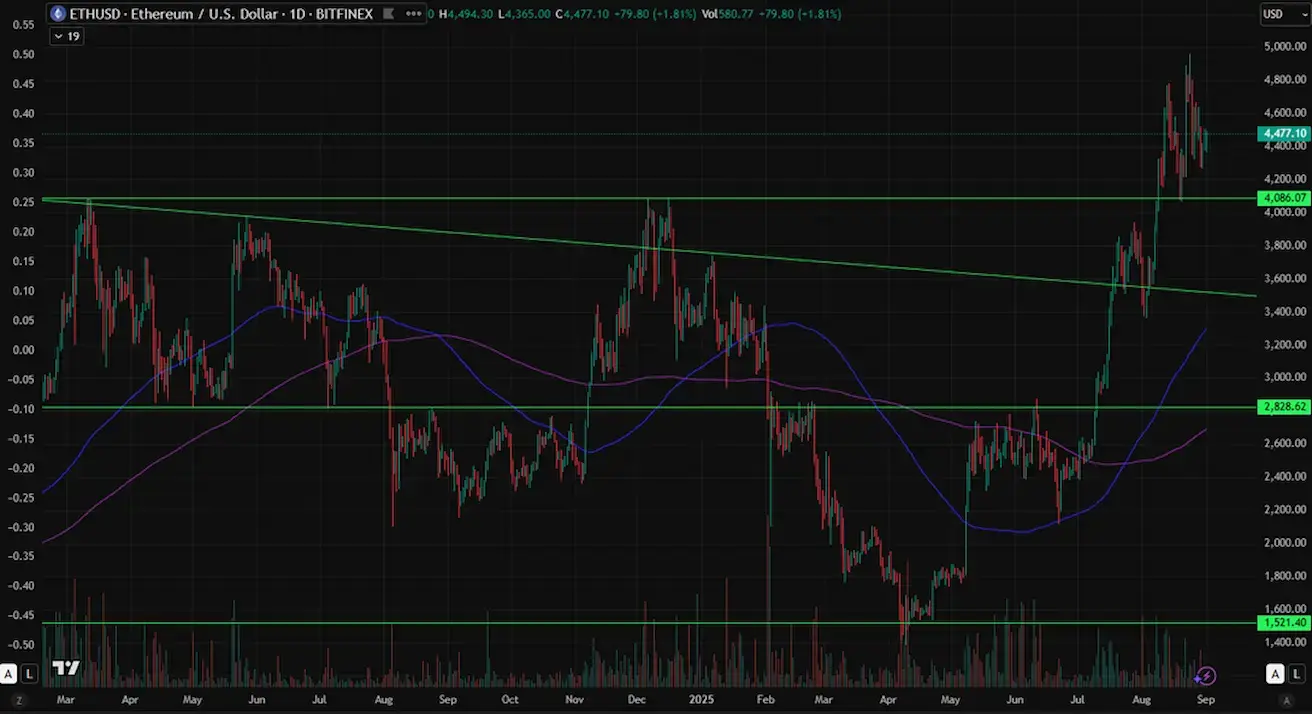
ETH ATEITIES SANDORIAI
Per savaitę: –1.61%, užsidarė ties $4,397.3. Metų pradžios rezultatas: +11.86%.
Kriptovaliutų rinkos apžvalga
2025 m. liepos 18 d. JAV prezidentas Donaldas Trumpas pasirašė GENIUS Act (Guiding and Establishing National Innovation for U.S. Stablecoins), kuris tapo pirmuoju šalyje išsamiu federaliniu teisės aktu, reglamentuojančiu stablekoinų išleidimą ir apyvartą. Įstatymas siekia sukurti struktūruotą ir saugią skaitmeninio turto ekosistemą, nustatydamas emitentams reikalavimus, tokius kaip 100% padengimas likvidžiomis atsargomis, griežtas kovos su pinigų plovimu taisyklių laikymasis ir privalomas licencijavimas finansų priežiūros institucijose.
Pirmą kartą šis teisės aktas suteikia reguliacinį aiškumą tiek stablekoinams, tiek tokenizuotam turtui (RWA). Pagal naująją sistemą stablekoinai oficialiai pripažįstami išmaniosiomis sutartimis, veikiančiomis daugiausia „Ethereum“ ekosistemoje. Tai reiškia, kad kiekvienam naujam į USDC, USDT ar kitus stablekoinus tokenizuojamam doleriui reikia „Ethereum“ tinklo resursų – „gas“ mokesčių už sandorius ir išmaniųjų sutarčių vietos.
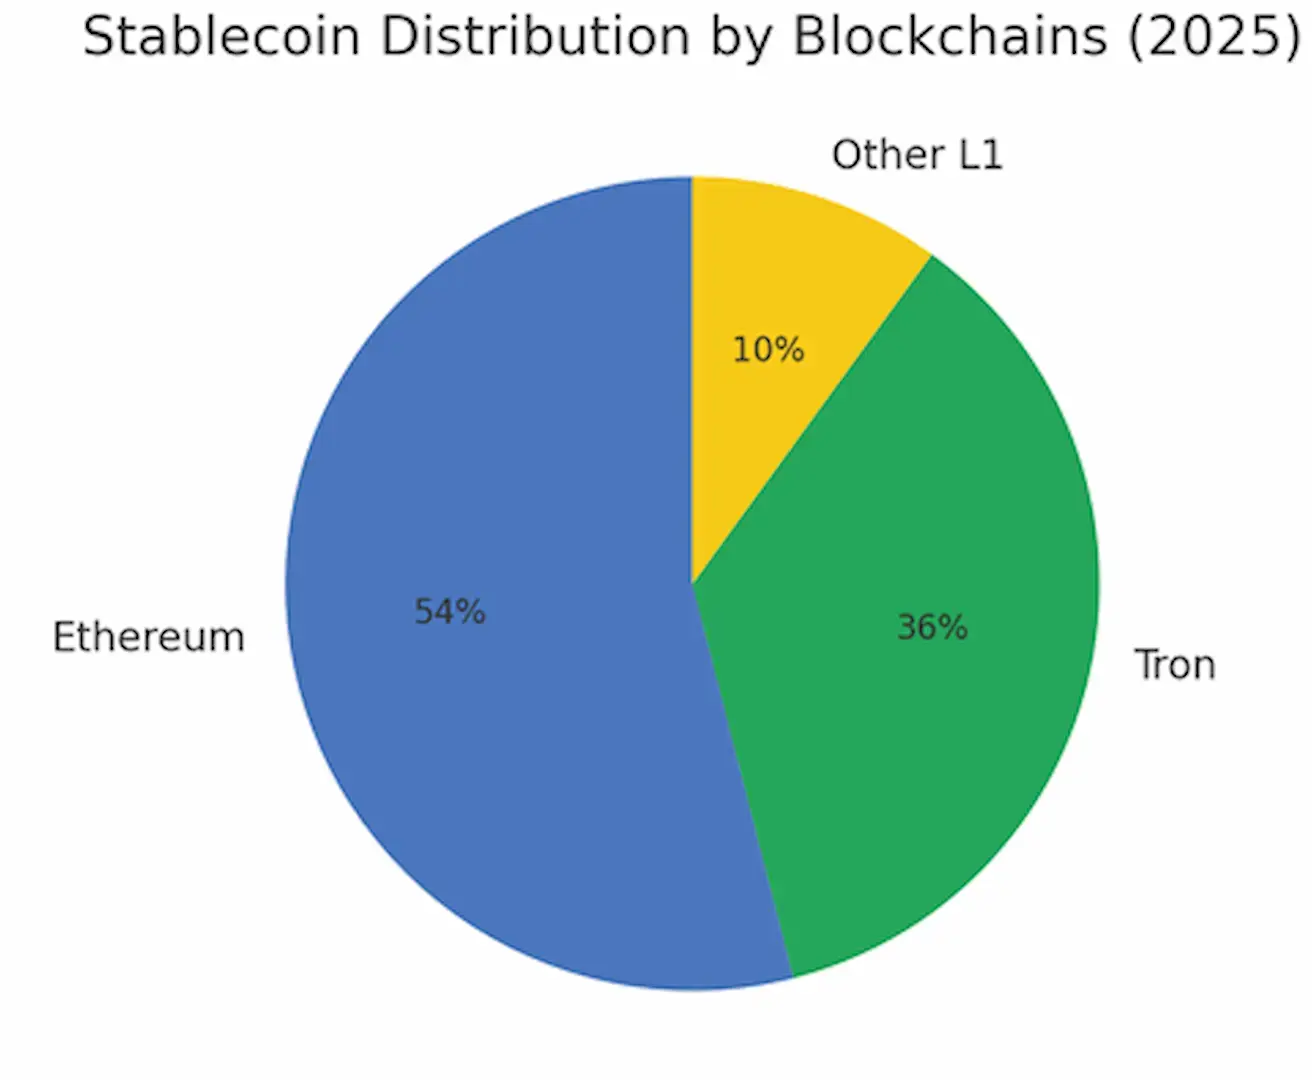
Šiuo metu daugiau nei 54% visų stablekoinų cirkuliuoja „Ethereum“ tinkle, todėl jis tampa pagrindiniu infrastruktūros aktyvu būsimiems skaitmeniniams pinigams.
Įsigaliojus GENIUS Act, didžiausi fondai ir bankai pradėjo kaupti ETH tiek kaip apsidraudimo priemonę, tiek kaip strateginį ilgalaikį aktyvą. Pasak „CoinTelegraph“ ir „MarketWatch“, prognozėse numatoma, kad iki metų pabaigos ETH gali pakilti iki $6,000–$7,000 (ne investicinė rekomendacija).
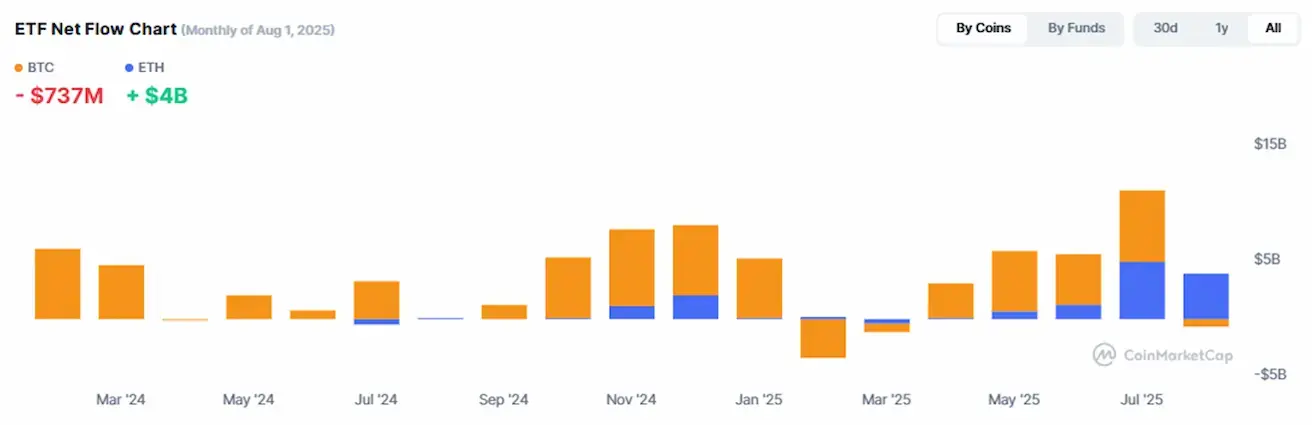
Rinkos reakcija: grynosios įplaukos į „Ethereum“ ETF pasiekė rekordinius lygius.
Diagramos rodo, kad liepa ir rugpjūtis iki šiol buvo stipriausi mėnesiai pagal kapitalo įplaukas į ETH:
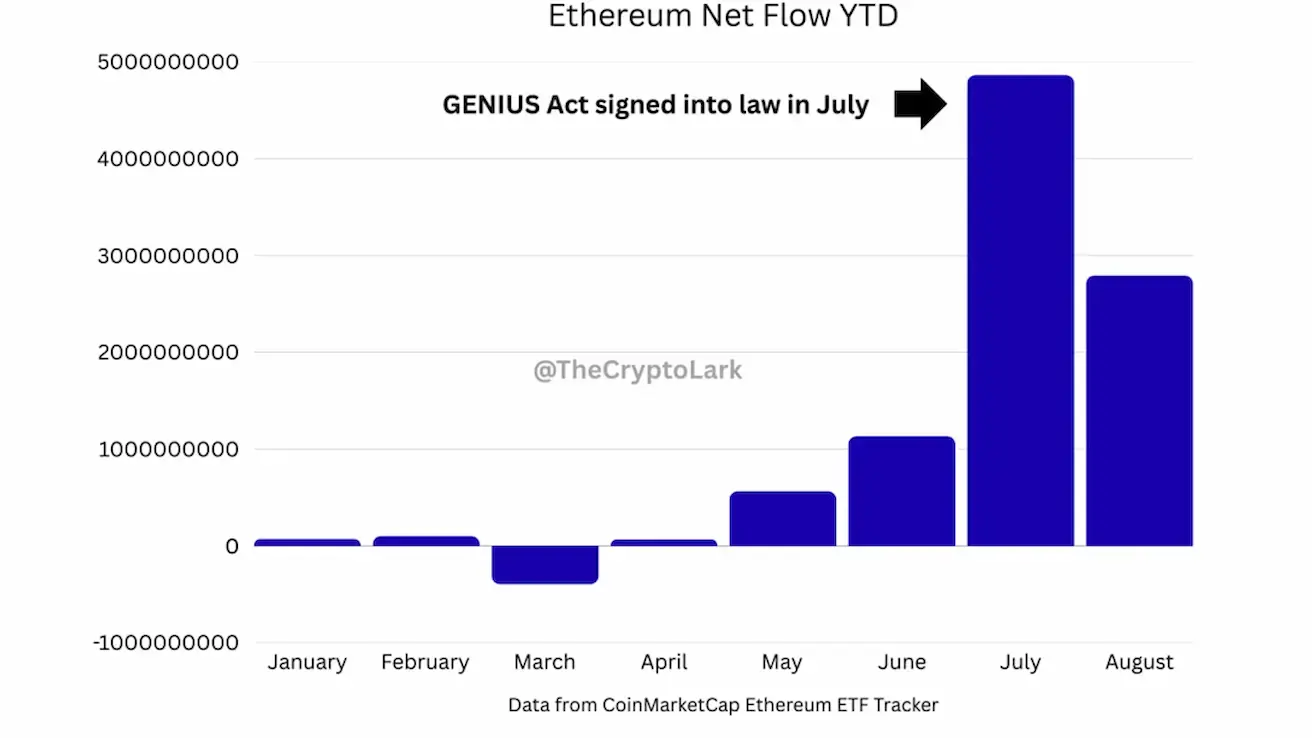
Rugpjūtį iš Bitcoin buvo išimta –$737 mln., tuo tarpu į Ethereum įplaukė +$4 mlrd.
Kairėje (apačioje): stablekoinų pasiskirstymas pagal blokų grandines – „Ethereum“ tenka 54% rinkos, po jo seka „Tron“ su 36% dalimi.
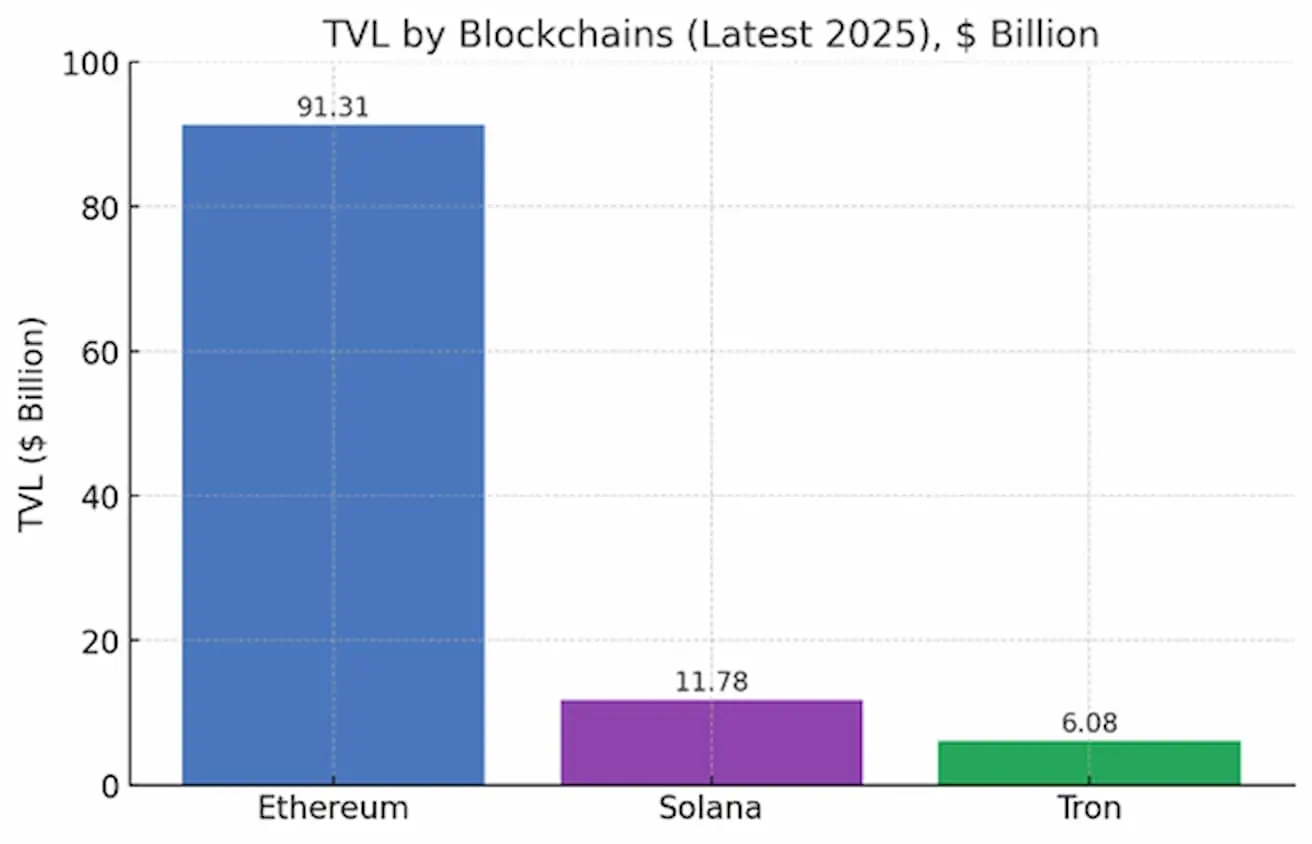
Dešinėje: TVL (Total Value Locked) augimas – kapitalo, aktyviai naudojamo blokų grandinėse, apimtis.
- Pasak „DeFiLlama“ (2025 m. rugpjūtis):
- Ethereum TVL 2025 m. išaugo nuo $45 mlrd. iki $91.31 mlrd. (vs. $4.04 mlrd. prieš metus).
- Solana (SOL): $11.78 mlrd. (vs. $6.22 mlrd.).
- Tron (TRX): $6.077 mlrd. (vs. $4.63 mlrd.).
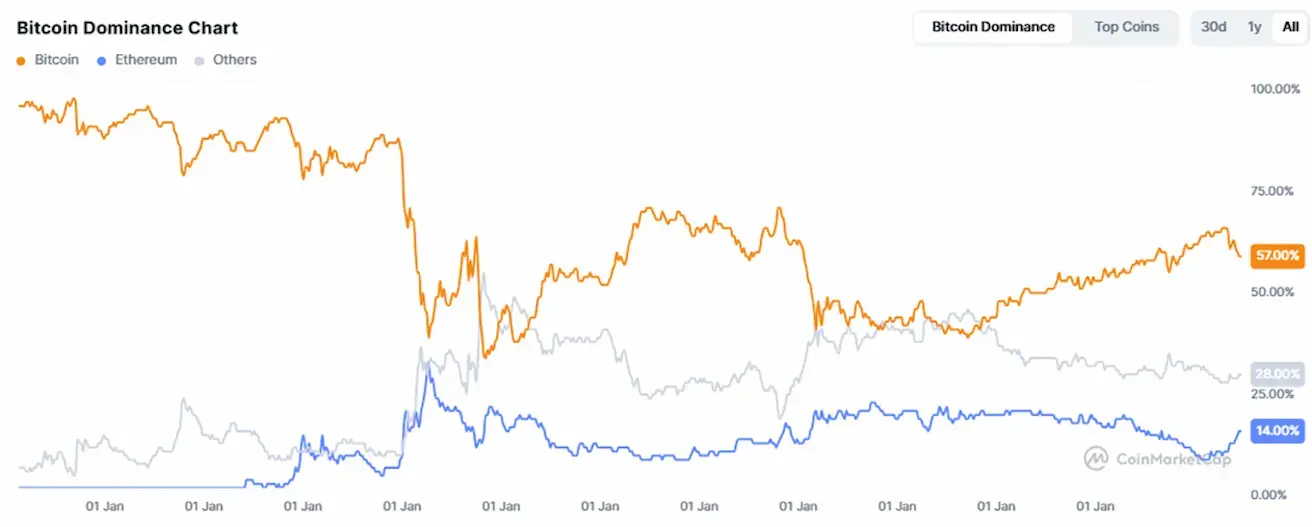
Kriptovaliutų rinkos kapitalizacija: $3.77 trln. (vs. $3.86 trln. prieš savaitę) (coinmarketcap.com).
- Bitcoin dominavimas: 57.4% (ankst. 57.5%)
- Ethereum dominavimas: 14.1% (ankst. 14.3%)
- Kitos: 28.5% (ankst. 28.2%)
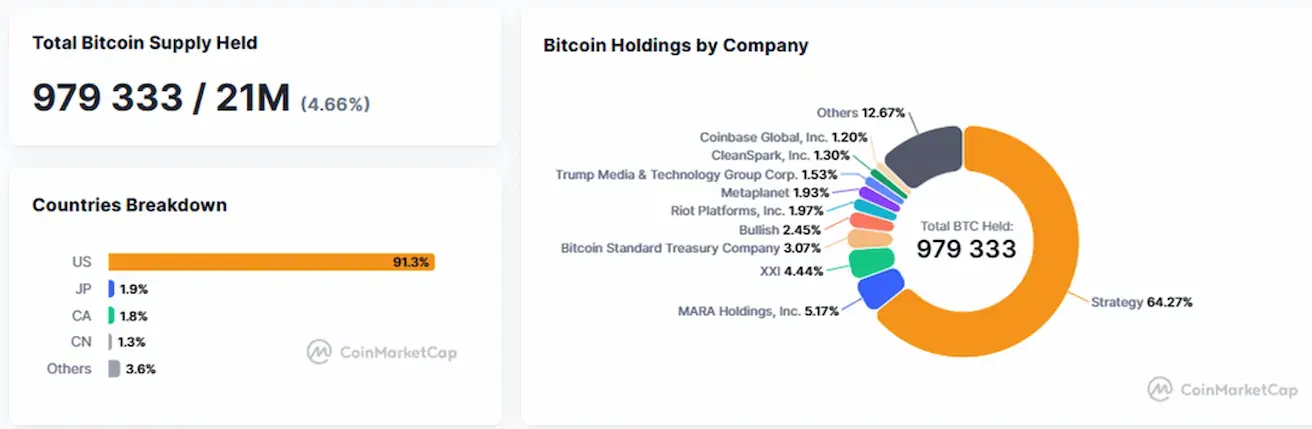
Viešosios įmonės, turinčios Bitcoin iždo strategijas:
Įmonių balansų sąskaitose laikomų bitkoinų dalis sudaro 4.66% visos Bitcoin pasiūlos.
Kriptovaliutų rinkos naujienos
- JAV BVP duomenys blokų grandinėje: JAV Prekybos departamentas pirmą kartą paskelbė oficialius BVP duomenis blokų grandinėje. Statistika prieinama devyniuose tinkluose: Bitcoin, Ethereum, Solana, TRON, Stellar, Avalanche, Arbitrum One, Polygon ir Optimism. Duomenų tikrinimą ir platinimą užtikrina „Chainlink“ ir „Pyth“ orakulai, bendradarbiaudami su didžiausiomis biržomis, įskaitant „Coinbase“, „Gemini“ ir „Kraken“.
- Kraken–SEC derybos dėl tokenizacijos: kriptovaliutų birža „Kraken“ susitiko su SEC atstovais aptarti tokenizacijos iniciatyvų po to, kai reguliuotojas anksčiau atmetė „Binance“ tokenizacijos projektą.
- JPMorgan apie Bitcoin: JPMorgan pažymėjo, kad Bitcoin kintamumas nukrito iki istoriškai žemo lygio, o ši kriptovaliuta šiuo metu yra neįvertinta, palyginti su auksu.