English
 Русский
 Қазақша
 Eesti
Eesti2026 m. vasario 16–22 d.: Savaitinė ekonomikos apžvalga
Pagrindiniai rinkos atnaujinimai

Per pastarąją savaitę akcijų indeksai svyravo siaurame intervale, fiksuotas nedidelis atšokimas.
FED infliacijos rodiklis (vartojimo išlaidų indeksas, PCE) nuo šių metų sausio padidėjo nuo 2.6% iki 3.0%. JAV BVP ketvirtą ketvirtį sumažėjo iki 1.4% po 4.4% augimo trečią ketvirtį. Tai sudaro mišrų vaizdą dėl tolesnės palūkanų normų trajektorijos, esant staigiam užimtumo augimui ir nedarbo lygio kritimui.
Federalinio rezervo valdybos narys Michael Barr nurodė, kad politika gali išlikti ribojamoji ilgesnį laiką.
JAV Aukščiausiasis Teismas atmetė Trumpo globalių muitų politiką, pareiškęs, kad prezidentas viršijo savo įgaliojimus. Teisėjai nenagrinėjo, kokiu mastu importuotojai turi teisę į kompensaciją, palikdami šiuos klausimus žemesnės instancijos teismui. Bendra kompensacijų suma gali siekti iki $170 mlrd.
Savo ruožtu Trump pareiškė (nenurodydamas datos), kad globalus tarifas bus padidintas nuo 10% iki 15%, pereinant prie 1974 m. Prekybos įstatymo 122 skyriaus taikymo, kuris leidžia 150 dienų taikyti muitus be įstatymų leidžiamosios valdžios pritarimo.
JAV iždo sekretorius Scott Bessent: pagal IEEPA nustatyti muitai per 3 dienas bus pakeisti muitais pagal 122 skyrių.
Europos Parlamento Prekybos komiteto pirmininkas Bernd Lange pasiūlė sustabdyti ES–JAV prekybos susitarimo ratifikavimą, kol bus aiškumas dėl Trumpo administracijos prekybos politikos.
Jungtinės Valstijos priėmė Irano pasiūlymus išlaikyti urano sodrinimą.
Makroekonominė statistika
INFLIACIJA: VARTOTOJŲ KAINŲ INDEKSAS (SAUSIS):
- Bazinis VKI: (mėn./mėn.) 0.2% (ankst.: 0.2%); (met./met.) 2.6% (ankst.: 2.6%).
- VKI: (mėn./mėn.) 0.3% (ankst.: 0.3%); (met./met.) 2.7% (ankst.: 2.7%).
GAMINTOJŲ KAINŲ INDEKSAS (SAUSIS):
- GKI (mėn./mėn.): 0.5%, ankst.: 0.2%.
- Bazinis GKI (mėn./mėn.): 0.7%, ankst.: 0.3%.
FED INFLIACIJOS RODIKLIS
Bazinis asmeninių vartojimo išlaidų (PCE) kainų indeksas (met./met.): 3.0% (ankst.: 2.8%):
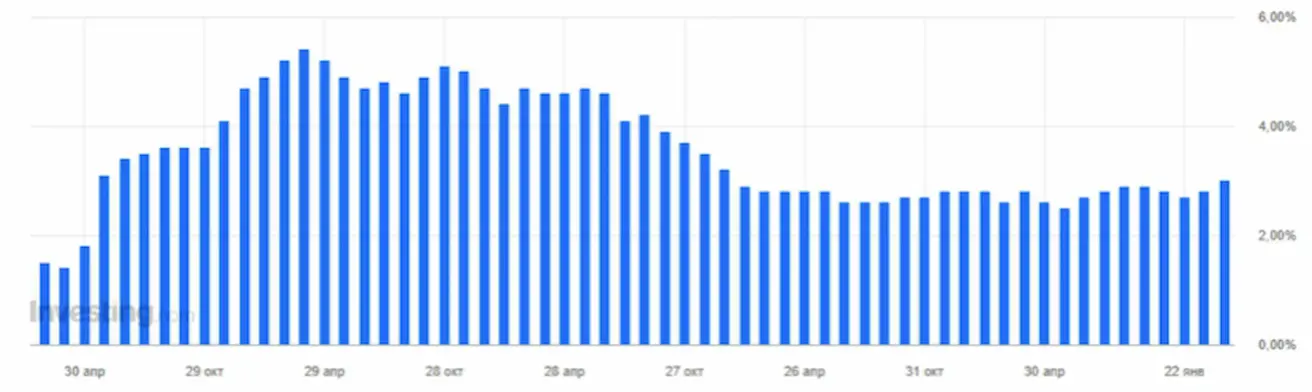
Asmeninių vartojimo išlaidų (PCE) kainų indeksas (met./met.): 2.9% (ankst.: 2.8%):
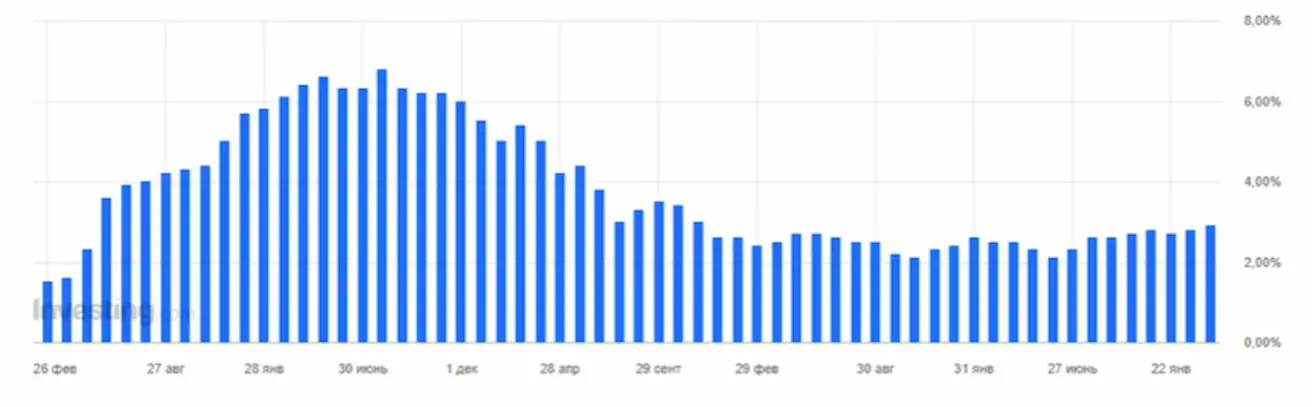
INFLIACIJOS LŪKESČIAI (MICHIGAN) (VASARIS):
- 12 mėn. infliacijos lūkesčiai: 3.4%, ankst.: 4.0%.
- 5 metų infliacijos lūkesčiai: 3.3%, ankst.: 3.3%.
BVP (JAV Ekonominės analizės biuras, BEA) (2025 m. IV ketv., metinis įvertis, antras vertinimas): +1.4% (2025 m. III ketv.: +4.4%)
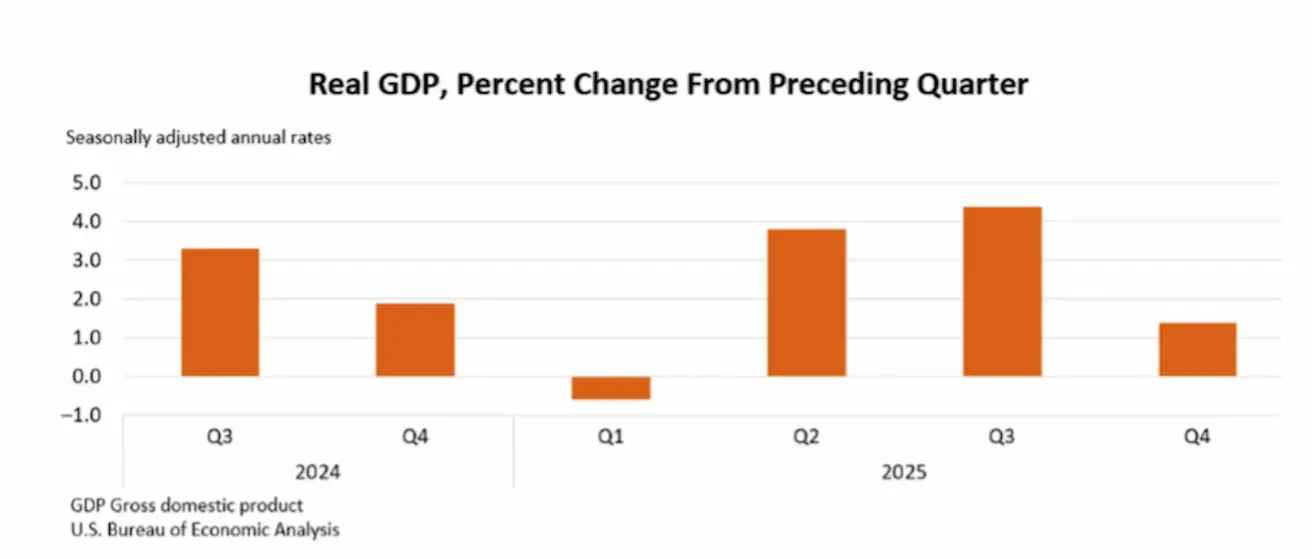
Vartojimo išlaidų ir investicijų augimas prisidėjo prie realiojo BVP augimo ketvirtą ketvirtį. Šiuos pokyčius iš dalies kompensavo valdžios sektoriaus išlaidų ir eksporto sumažėjimas. Importas, kuris atimamas iš BVP, sumažėjo.
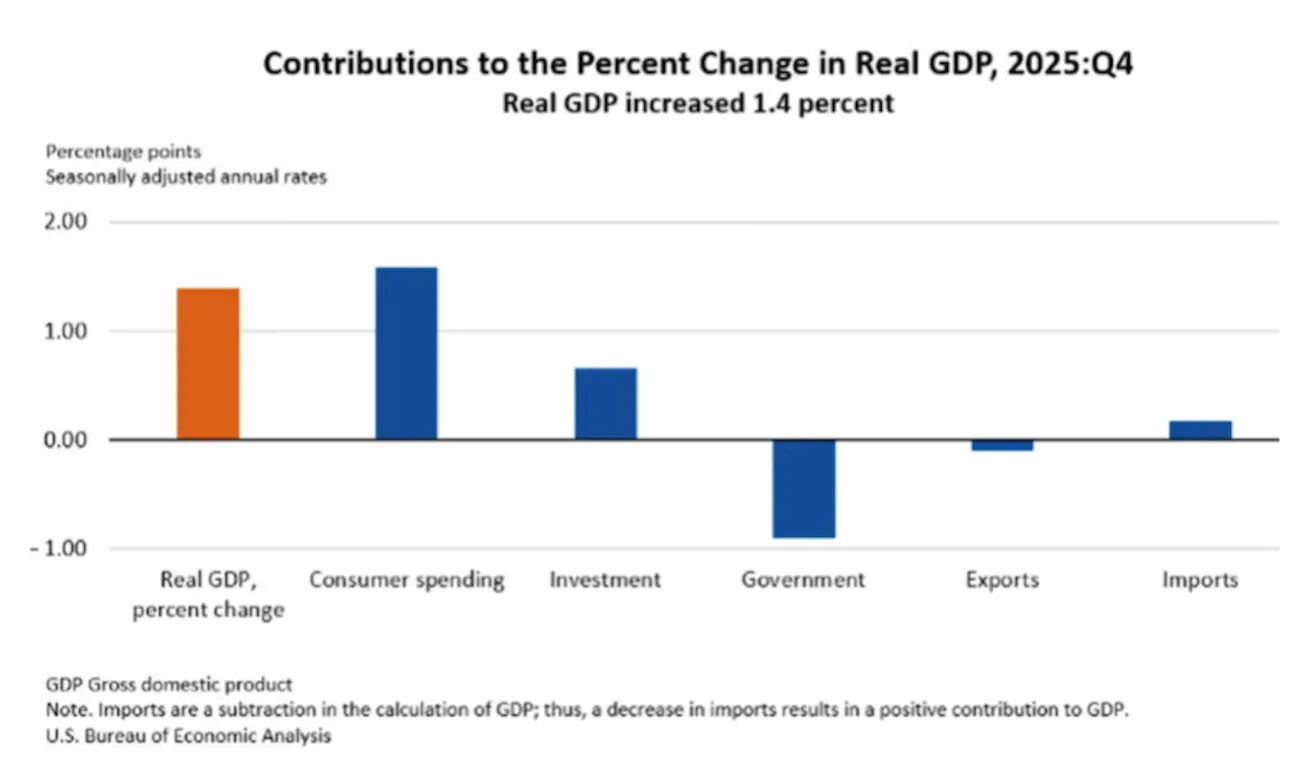
Palyginti su trečiu ketvirčiu, ketvirto ketvirčio realiojo BVP augimo sulėtėjimą lėmė sumažėjusios valdžios sektoriaus išlaidos ir eksportas, taip pat lėtesnis vartojimo išlaidų augimas, kuriuos iš dalies kompensavo spartesnės investicijos. Importo sumažėjimas buvo mažiau ryškus nei ankstesnį ketvirtį.
Atlantos Federalinio rezervo banko rodiklis GDPNow („dabartinis“ oficialaus rodiklio įvertis iki jo paskelbimo): 3.0% (ankst.: 3.7%).
VERSLO AKTYVUMO INDEKSAS (PMI) (VASARIS)
(Daugiau nei 50 rodo plėtrą; mažiau nei 50 rodo susitraukimą)
- Paslaugų sektorius: 52.3 (ankst.: 52.7);
- Pramonės sektorius: 51.2 (ankst.: 52.4);
- S&P Global Composite: 52.3 (ankst.: 53.0).
DARBO RINKA (BLS) (VASARIS)
- Nedarbo lygis: 4.3% (ankst.: 4.4%);
- Bendras tęstinių bedarbio pašalpų paraiškų skaičius JAV: 1,869K (ankst.: 1,819K);
- Pradinių bedarbio pašalpų paraiškų skaičius: 206K (ankst.: 231K, patikslinta);
- Nežemės ūkio sektoriaus darbo vietų pokytis: 130K (ankst.: 48K);
- Privačiojo nežemės ūkio sektoriaus darbo vietų pokytis: 172K (ankst.: −64K);
- Vidutinis valandinis uždarbis (met./met.): 3.7% (ankst.: 3.8%);
- JOLTS laisvų darbo vietų skaičius: 6.542M (ankst.: 6.928M).
PINIGŲ POLITIKA
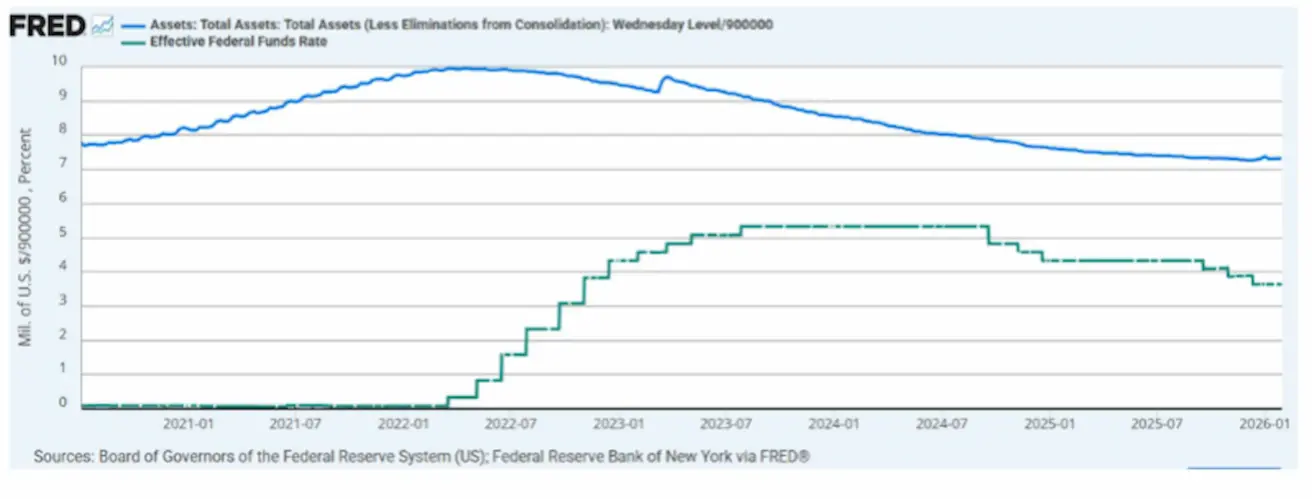
- Efektyvioji federalinių fondų norma (EFFR): 3.50%–3.75%;
- Federalinio rezervo balansas: $6.613T, padidėjęs 1.19% nuo kiekybinio griežtinimo (QT) sustabdymo ($6.535 trln.).
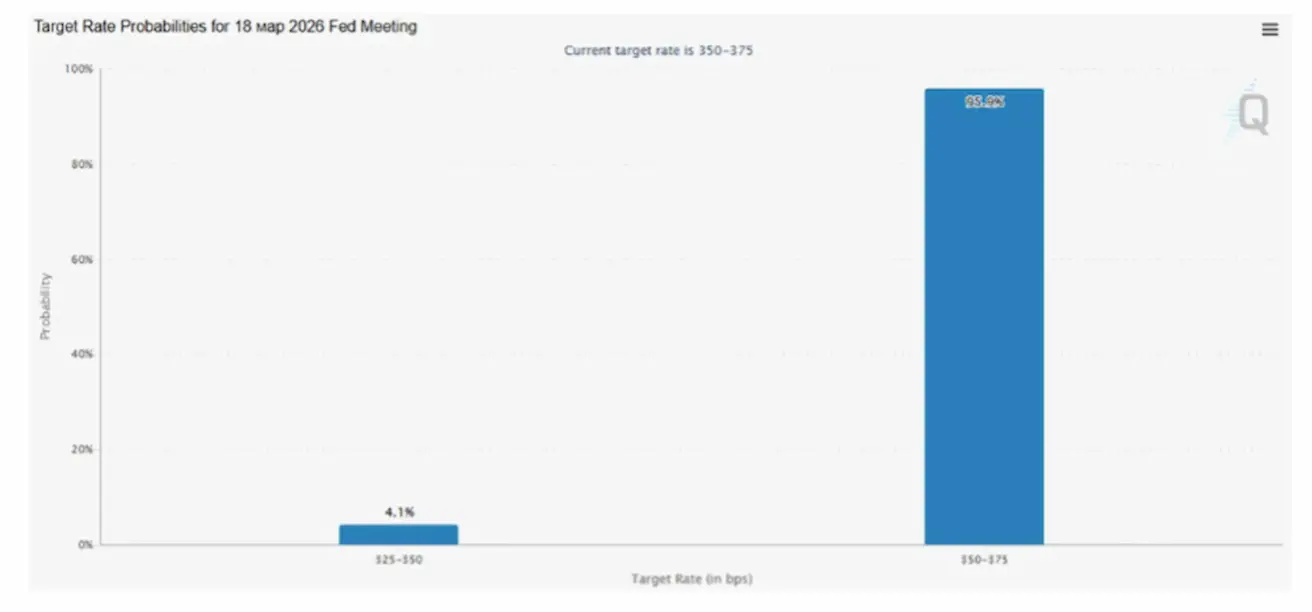
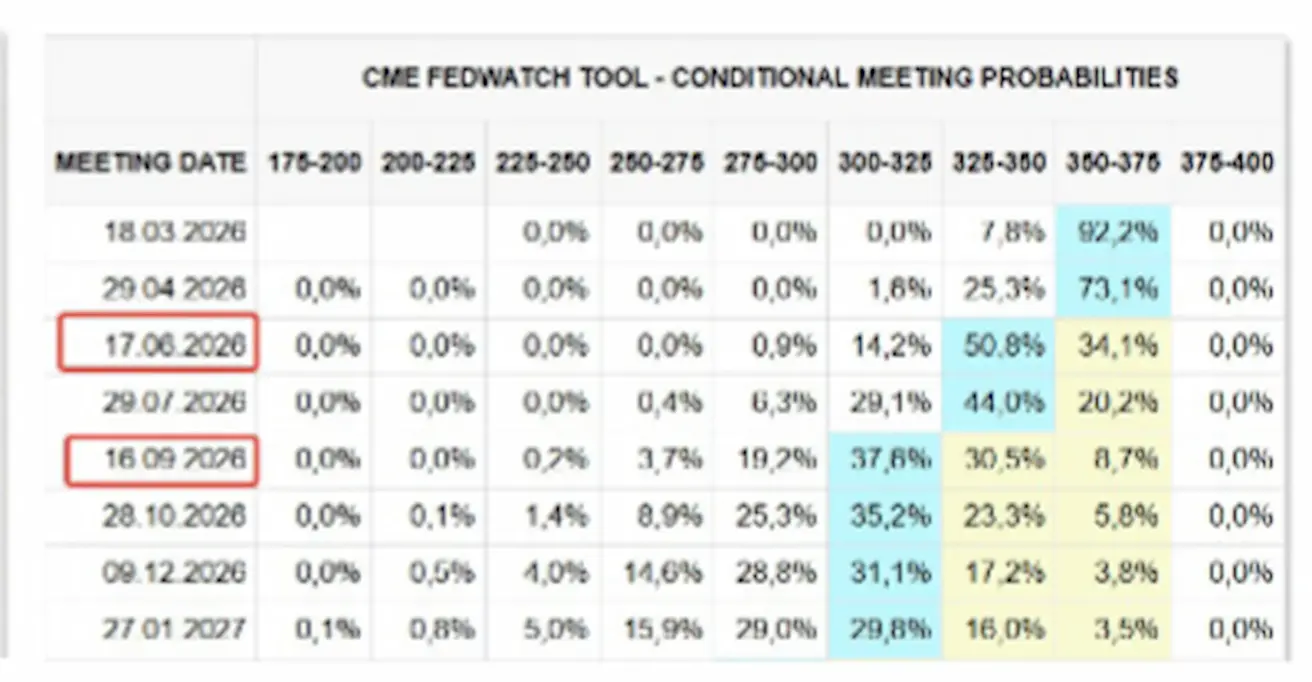
Kitas FOMC posėdis (kovo 18 d.): implikuota 25 bp palūkanų normos sumažinimo tikimybė yra 4.1%.
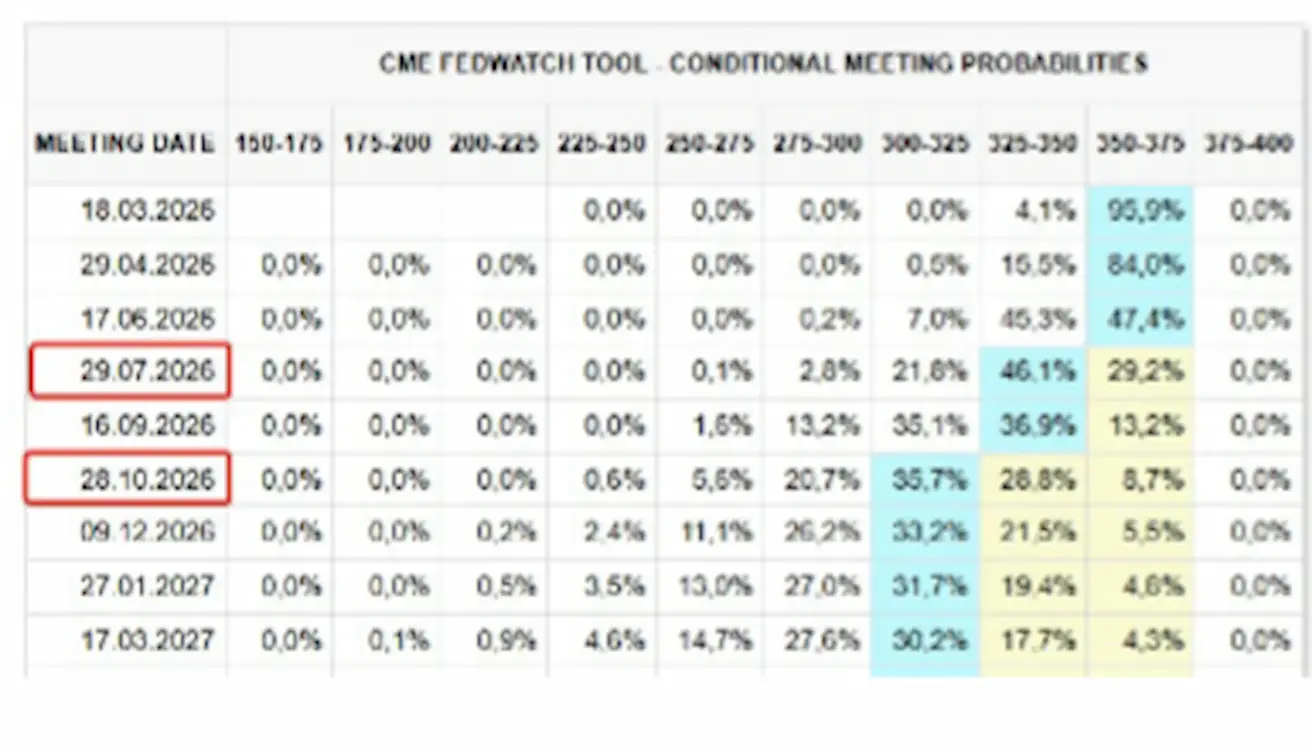
RINKOS PROGNOZĖ DĖL NORMOS (FEDWATCH)
Per artimiausius 12 mėn. numatomi du 0.25% palūkanų normos sumažinimai iki 3.00–3.25% intervalo. Rinka pirmą žingsnį perkėlė į liepą.
Šiandien:
Prieš savaitę:
Rinka
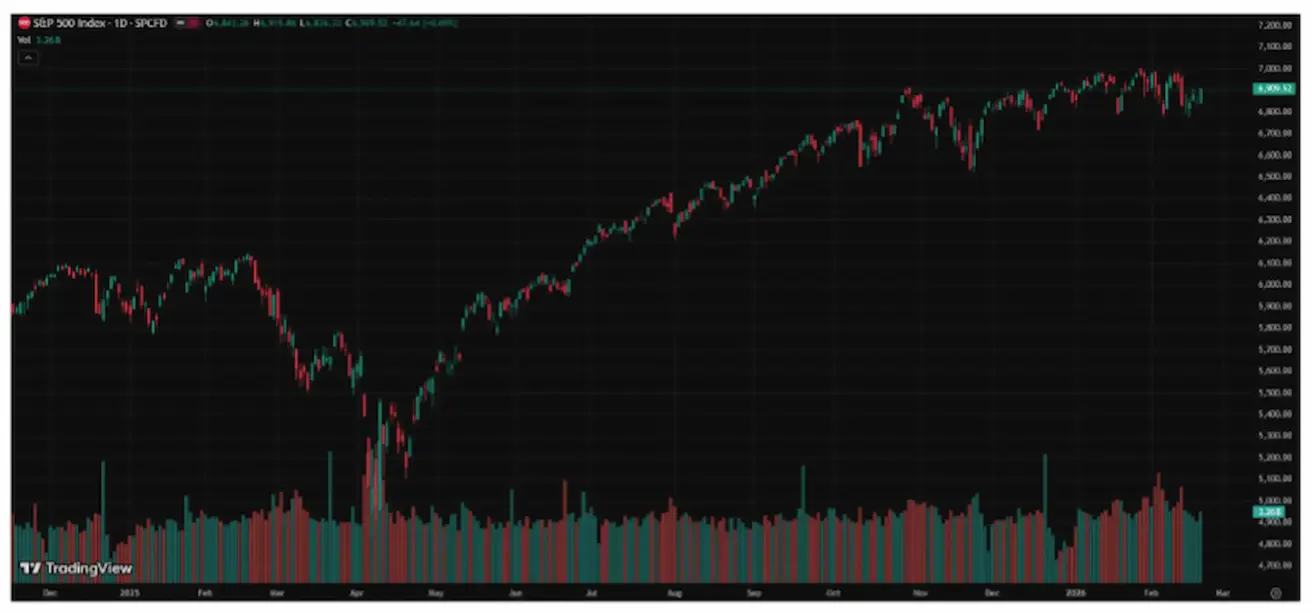
SP500
Savaitinis pokytis: +1,07% (savaitės pabaigos uždarymas 6909,52); nuo metų pradžios: 0,94%.
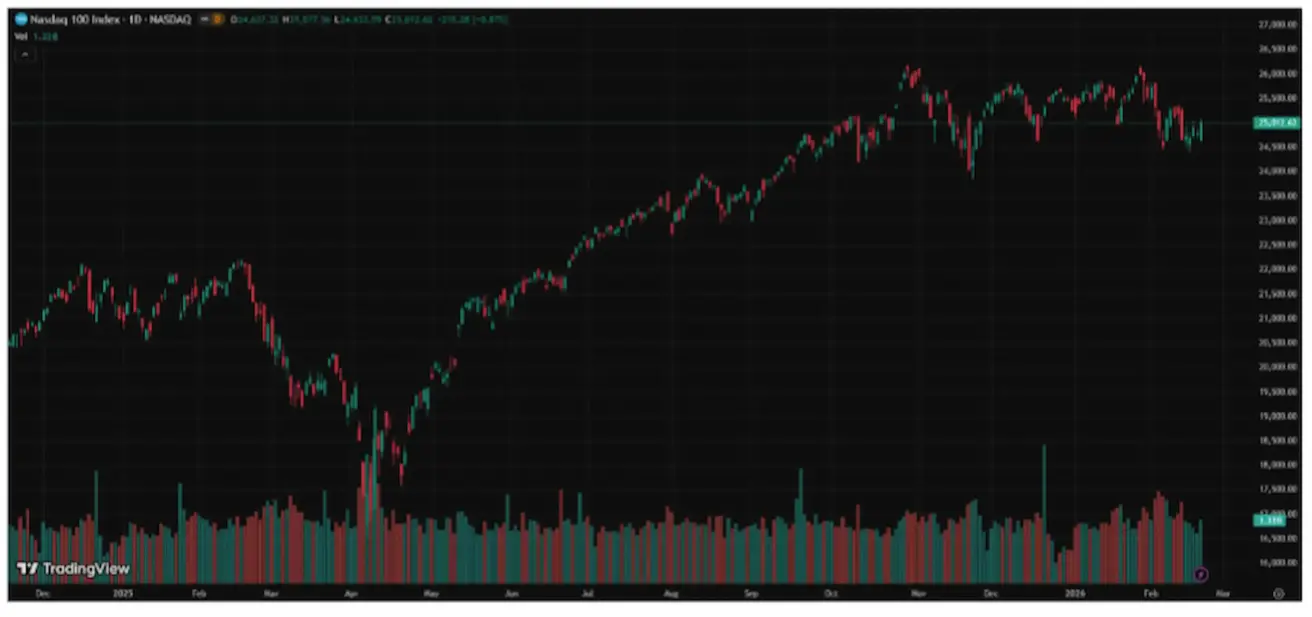
NASDAQ100
Savaitinis pokytis: +1,13% (savaitės pabaigos uždarymas 25012,62); nuo metų pradžios: -0,94%.
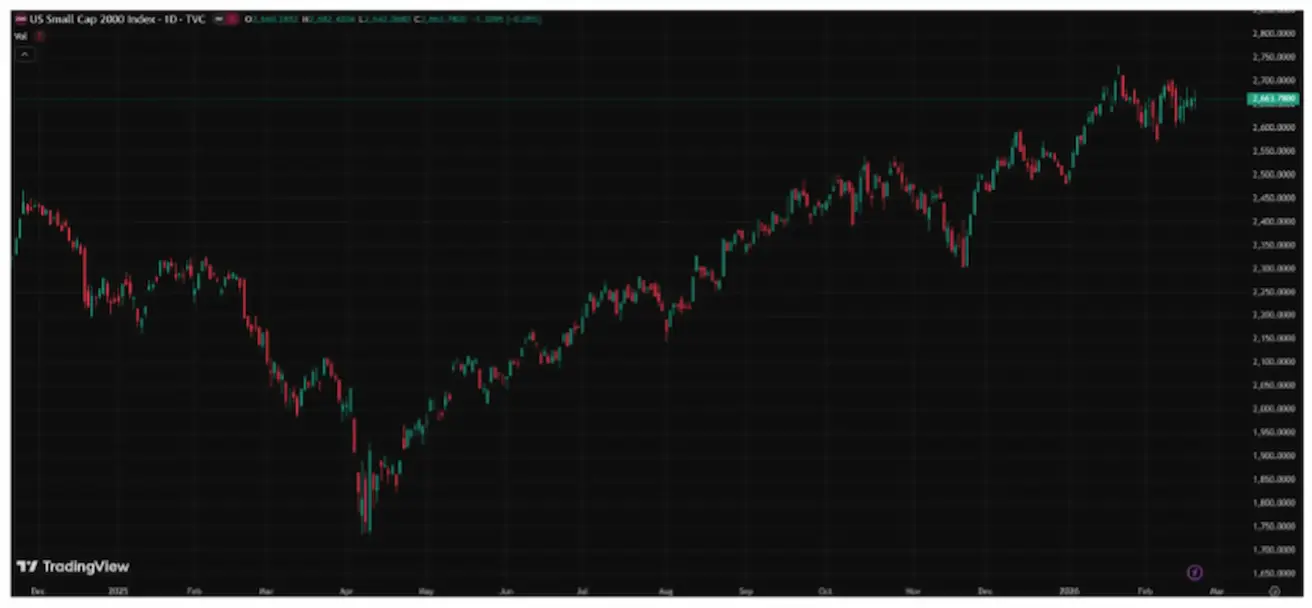
RUSSEL 2000 (RUT)
Savaitinis pokytis: -0,49% (savaitės pabaigos uždarymas 2663,78); nuo metų pradžios: 6,12%.
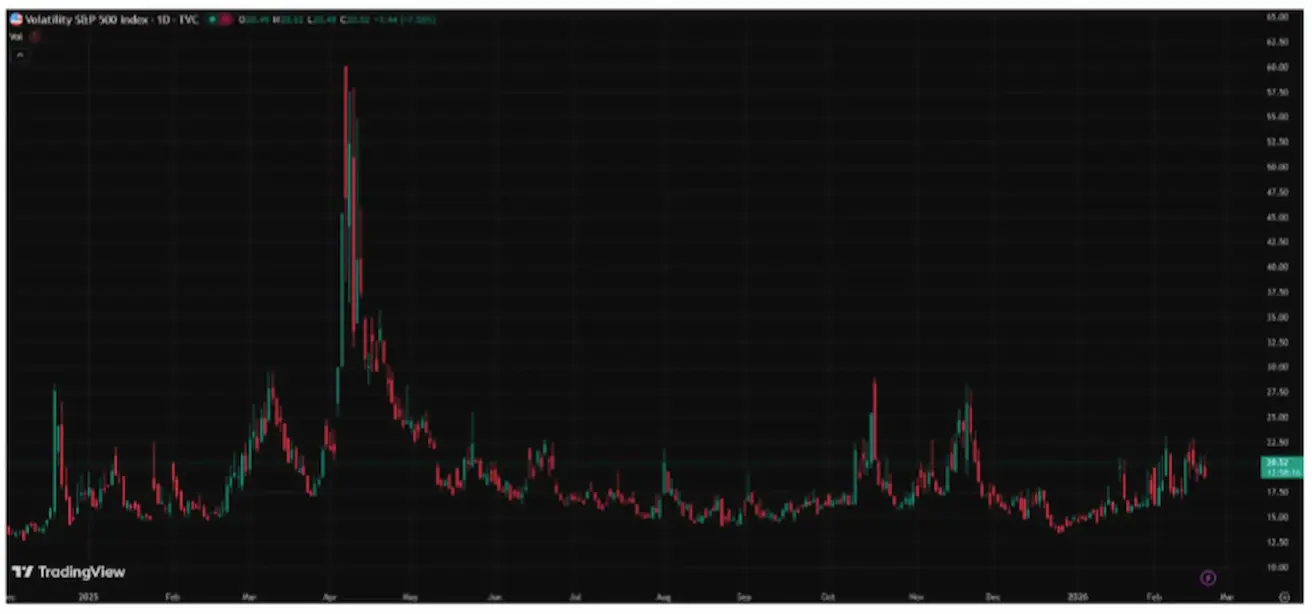
VIX
VIX nepastovumo indeksas yra 20,52.
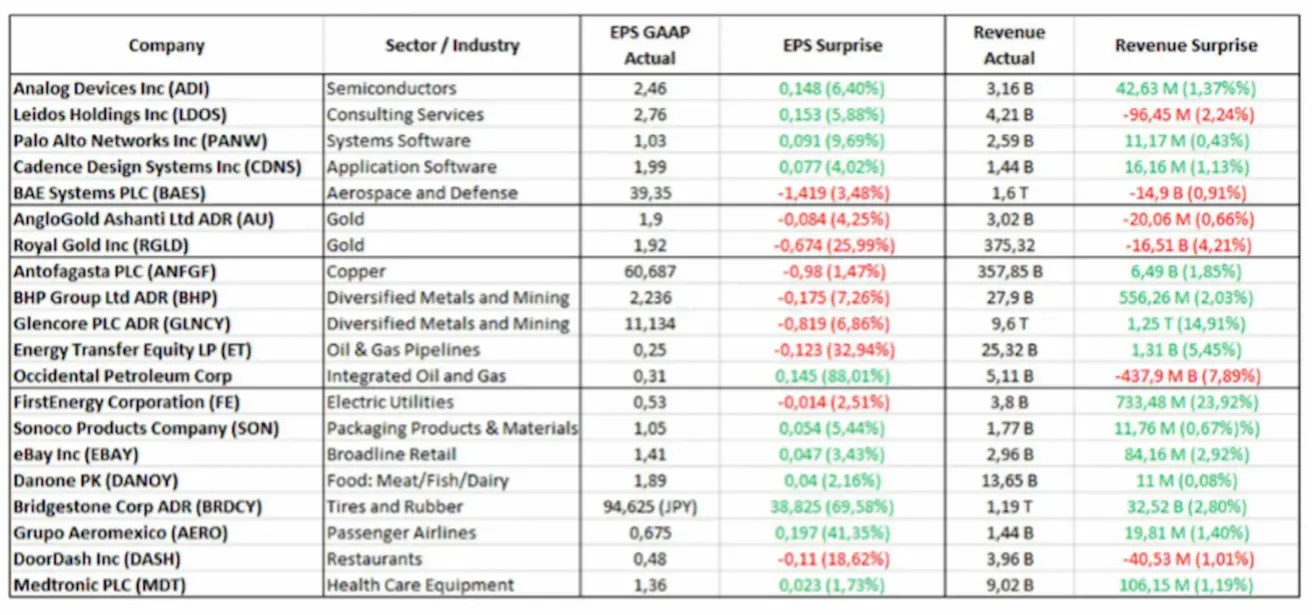
Pelno ataskaitos (ištrauka: 2026 m. vasario 16–22 d.).
Apskritai technologijų įmonės toliau skelbia stiprius rezultatus. Aukso kasybos bendrovės pranešė apie prognozes pranokusius rodiklius. Kasybos bendrovės viršijo pajamų lūkesčius, tačiau praleido EPS tikslus. Kiti sektoriai demonstruoja mišrią dinamiką, tačiau be ryškios neigiamos tendencijos.
Euro zona
- Norma išlieka nepakitusi, infliacija yra kontroliuojama;
- Pinigų politikos režimas neutralus — rizikų balansas pasislinko nuo infliacijos link ekonominio silpnumo;
- Silpnėjant prekybos įtampai, ECB peržiūrėjo BVP ir infliacijos prognozes į viršų ateinantiems metams;
- Europa stabilizuojasi, tačiau pagal augimo dinamiką atsilieka nuo JAV.
Palūkanų normos
- Indėlių palūkanų norma: 2.0% (ankst.: 2.0%).
- Ribinio skolinimo galimybė: 2.4% (ankst.: 2.4%) — vienos nakties norma, už kurią bankai gali skolintis iš ECB.
- Pagrindinė refinansavimo norma (pagrindinė politika): 2.15% (ankst.: 2.15%).
Infliacija: vartotojų kainų indeksas (sausis):
- Bazinis VKI (met./met.): 2.2% (ankst.: 2.3%).
- Bendra VKI (mėn./mėn.): –0.5% (ankst.: 0.2%, patikslinta).
- Bendra VKI (met./met.): 1.7% (ankst.: 2.0%).
ECB komunikacija
Ketvirto ketvirčio BVP (galutinis įvertis):
- ketv./ketv.: 0.3% (ankst.: 0.3%).
- met./met.: 1.3% (ankst.: 1.4%).
Nedarbo lygis (gruodis): 6.20% (ankst.: 6.23%).
Pirkimo vadybininkų indeksas (vasaris)
- Paslaugų PMI: 51.8 (ankst.: 51.6).
- Gamybos PMI: 50.8 (ankst.: 49.4).
- S&P Global Composite PMI: 51.9 (ankst.: 51.3).
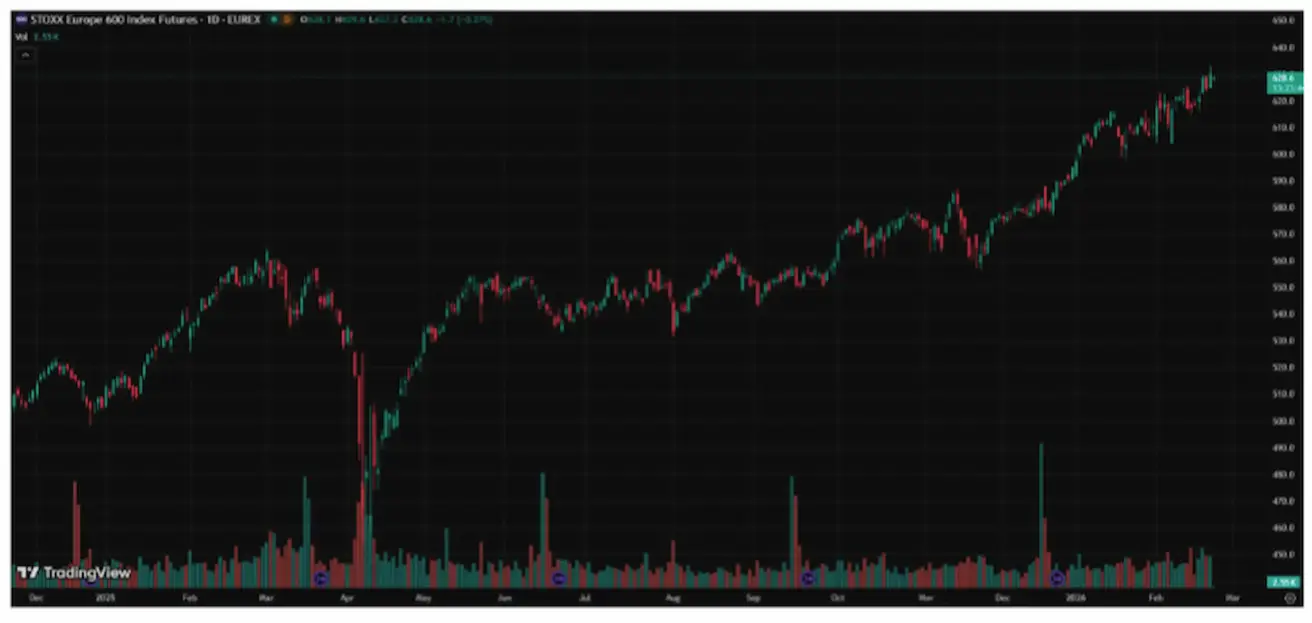
EURO STOXX 600 (FXXP1!)
Savaitinis pokytis: +1,78% (savaitės pabaigos uždarymas: 628,6); sausio pokytis: +5,82%.
Kinija
Ekonomika stabilizuojasi dėka eksporto, tuo tarpu vidaus paklausa ir investicijos išlieka silpnos; skatinimo priemonės yra tikslingos ir atsargios.
- Normos išlieka nepakitusios;
- Pinigų politikos režimas yra skatinamasis;
- Kinija paskelbė tęsianti fiskalinę paramą ekonomikos augimui pagal 2026 m. planą (skatindama vidaus paklausą, optimizuodama mokestines lengvatas ir subsidijas bei pramonės modernizavimą).
Palūkanų normos
- 1 m. Loan Prime Rate (vidutinės trukmės skolinimo etalonas): 3.00%.
- 5 m. Loan Prime Rate (penkerių metų etalonas, darantis įtaką būsto paskolų kainodarai): 3.50%.
Infliacija (sausis)
- Vartotojų kainų indeksas (VKI):
- mėn./mėn.: 0.2% (ankst.: 0.2%).
- met./met.: 0.2% (ankst.: 0.8%).
- Gamybos kainų indeksas (GKI), met./met.: –1.4% (ankst.: –1.9%).
Ekonominiai rodikliai
- BVP už IV ketv. (galutinis): ketv./ketv.: 1.2% (ankst.: 1.1%); met./met.: 4.5% (ankst.: 4.8%)
- Nedarbo lygis (sausis): 5.1% (ankst.: 5.1%)
- Pramonės gamyba (sausis), met./met.: 5.9% (ankst.: 4.8%)
- Investicijos į ilgalaikį turtą (sausis), met./met.: -3.8% (ankst.: -2.6%)
- Mažmeninė prekyba (sausis), met./met.: 0.9% (ankst.: 1.3%)
- Importo apimtys (sausis), met./met.: 5.7% (ankst.: 1.9%)
- Eksporto apimtys (sausis), met./met.: 6.6% (ankst.: 5.9%)
- Prekybos balansas (USD) (sausis): 114.30 mlrd. (ankst.: 111.68 mlrd.)
Pirkimo vadybininkų indeksai (PMI) (sausis):
- Gamybos sektorius: 49.3 (ankst.: 49.2);
- Negamybinis sektorius: 49.4 (ankst.: 49.0);
- Sudėtinis indeksas: 50.7 (ankst.: 49.1).
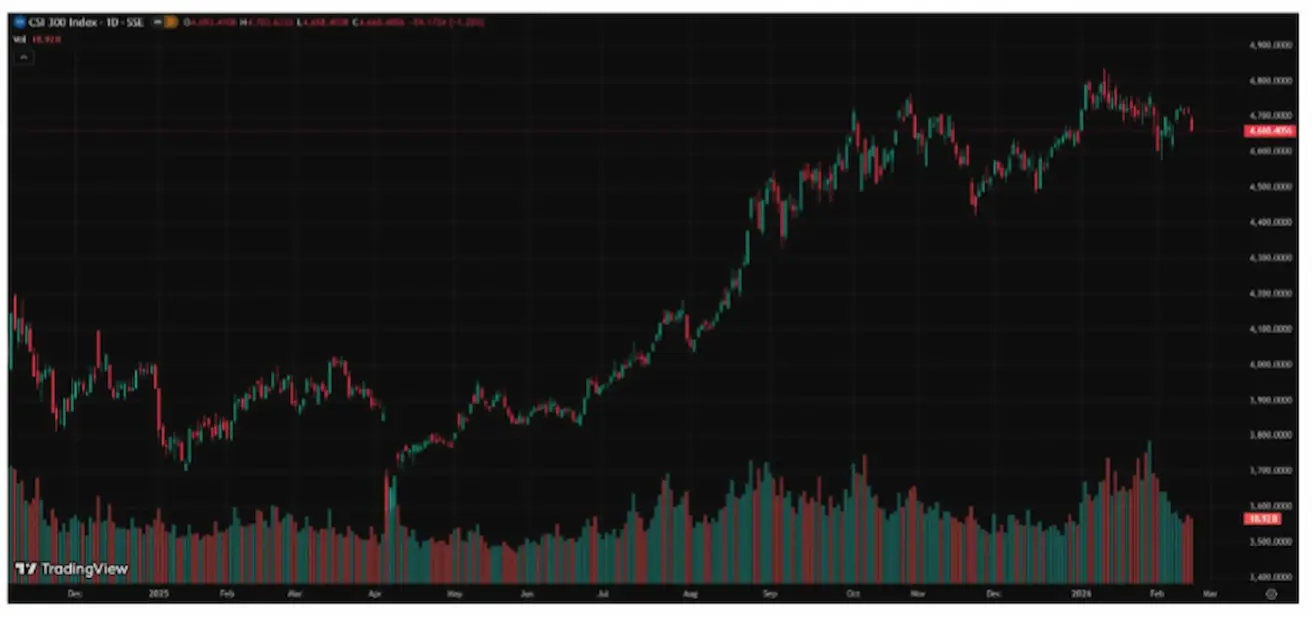
CSI 300 INDEKSAS (000300.HK)
Savaitinis pokytis: 0,00% (savaitės pabaigos uždarymas 4660,40); nuo metų pradžios: 0,66%.
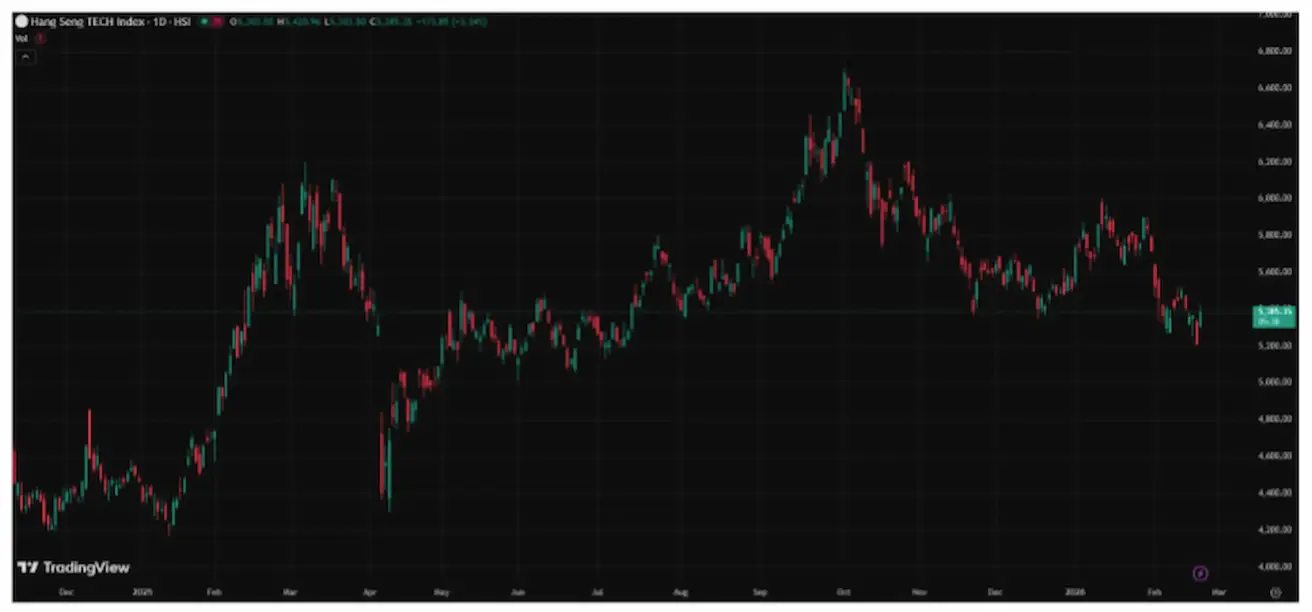
Hang Seng TECH indeksas (HTI1!)
Savaitinis pokytis: +0,47% (savaitės pabaigos uždarymas: 5385,35); nuo metų pradžios: -2,16%.
OBLIGACIJŲ RINKA
JAV skolų rinka nerodo gilios recesijos ar sisteminės rizikos požymių.
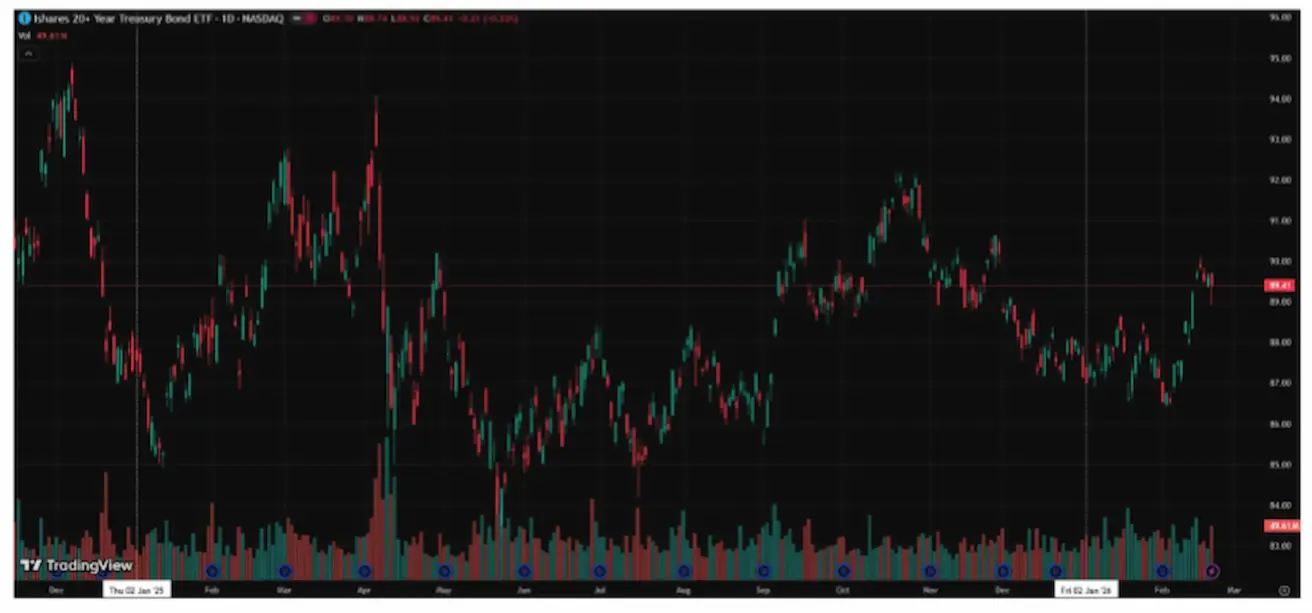
- JAV iždo 20+ metų trukmės obligacijos (ETF: TLT):
- Savaitinis pokytis: -0.35% (savaitės pabaigos uždarymas: 89.41).
- Nuo metų pradžios: +2.58%.
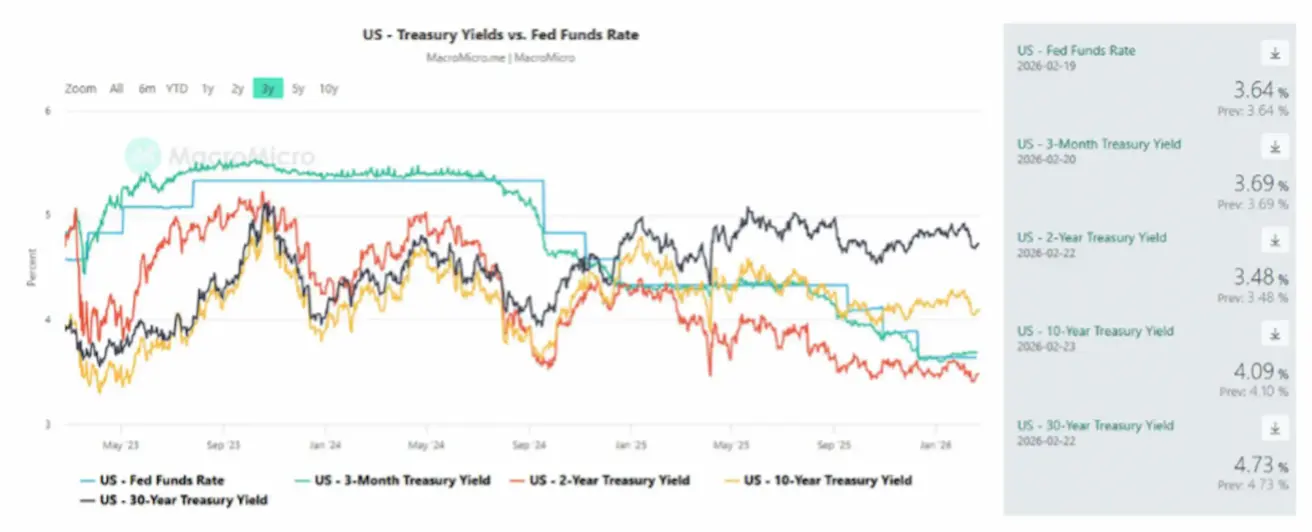
PAJŪMINGUMAI IR SPREDAS
10 metų trukmės JAV iždo vertybinių popierių pajamingumas (pastovios trukmės): 4.09% (ankst.: 4.21%);
- 2 metų trukmės JAV iždo obligacijų pajamingumas: 3.48% (ankst.: 3.50%);
- ICE BofA BBB US Corporate Index Effective Yield: % (ankst.: 4.94%).
- 10 ir 2 metų JAV iždo obligacijų pajamingumų spredas sudaro 61 bazinį punktą (ankst.: 65);
- 10 metų ir 3 mėn. JAV iždo obligacijų pajamingumų spredas sudaro 40 bazinių punktų (ankst.: 38).
5 metų trukmės JAV kredito įsipareigojimų neįvykdymo apsikeitimo sandorio (CDS) (defolto draudimas) kaina: 31.03 bp (palyginti su 31.02 bp prieš savaitę).
AUKSO ATEITIES SANDORIAI (GC)
Savaitinis pokytis +2,05% (savaitės pabaigos uždarymas: $5149,5 už Trojos unciją); nuo metų pradžios: +18,87%.
Aukso kainų augimas tęsiasi, esant nuolatinei centrinių bankų paklausai ir sparčiam pasaulinės skolos augimui, geopolitinio ir makroekonominio neapibrėžtumo fone.
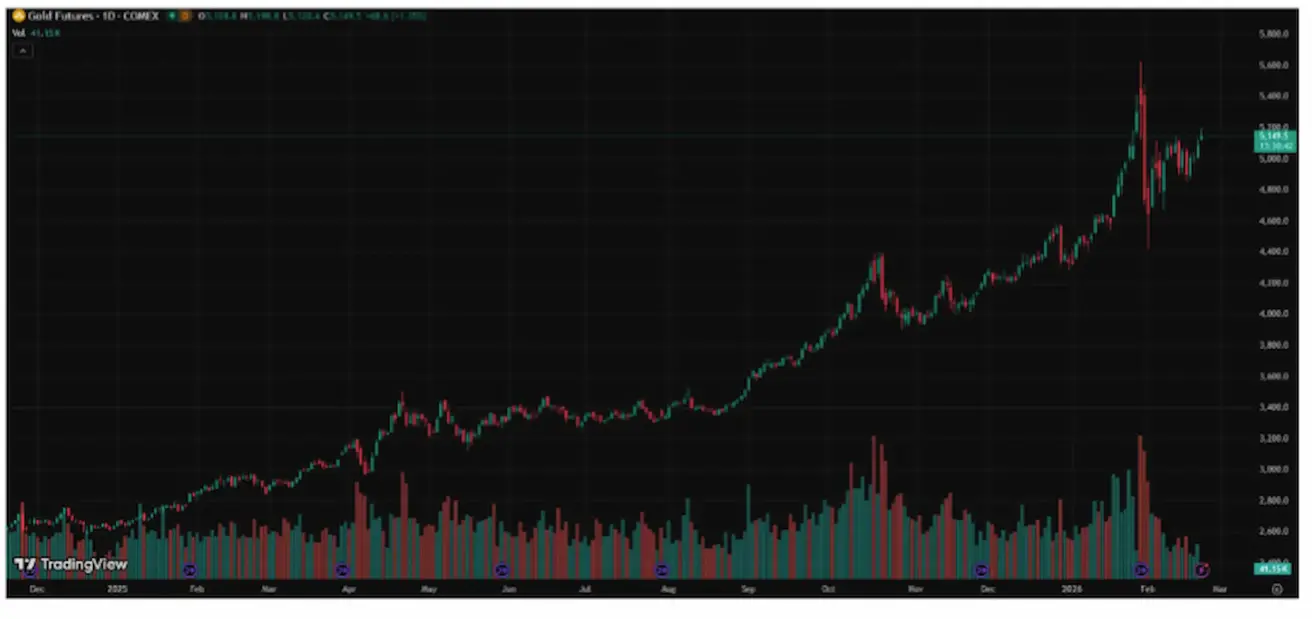
Augimo veiksniai:
- Geopolitinė rizika ir nepastovi Trumpo politika;
- Aktyvūs centrinių bankų ir aukso ETF pirkimai;
NAFTOS ATEITIES SANDORIAI
Savaitinis pokytis: +4.37% (savaitės pabaigos uždarymas: $65.64 už barelį). Nuo metų pradžios: +14.34%.
Pagrindiniai veiksniai:
- Prognozės dėl augančios naftos pasiūlos rinkoje išlieka;
- OPEC+ planuoja sustabdyti tolesnį pasiūlos didinimą;
- Geopolitinė rizika Irane didina susirūpinimą dėl tiekimo.
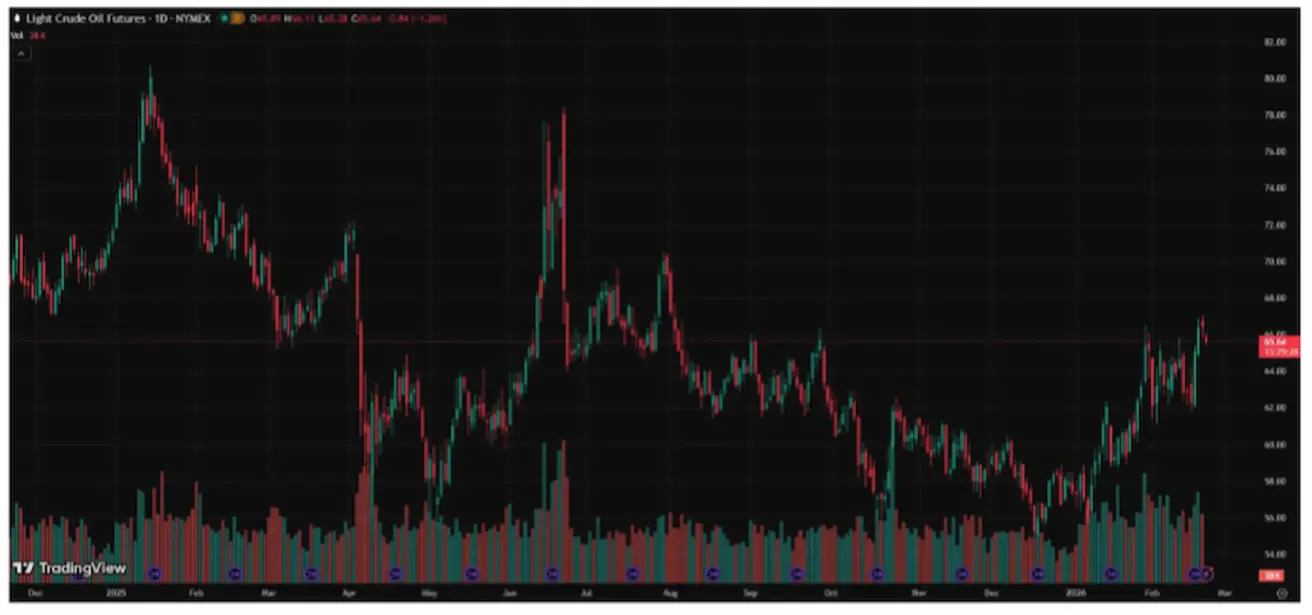
Nafta nuo metų pradžios pabrango 18%, lengvosios naftos ateities sandorio kaina siekia $65. Trigeris buvo OPEC paskelbtas staigus gavybos mažinimas sausį, tačiau didesne dalimi kainų kilimą lėmė augančios geopolitinės įtampos JAV spaudimo Iranui fone.
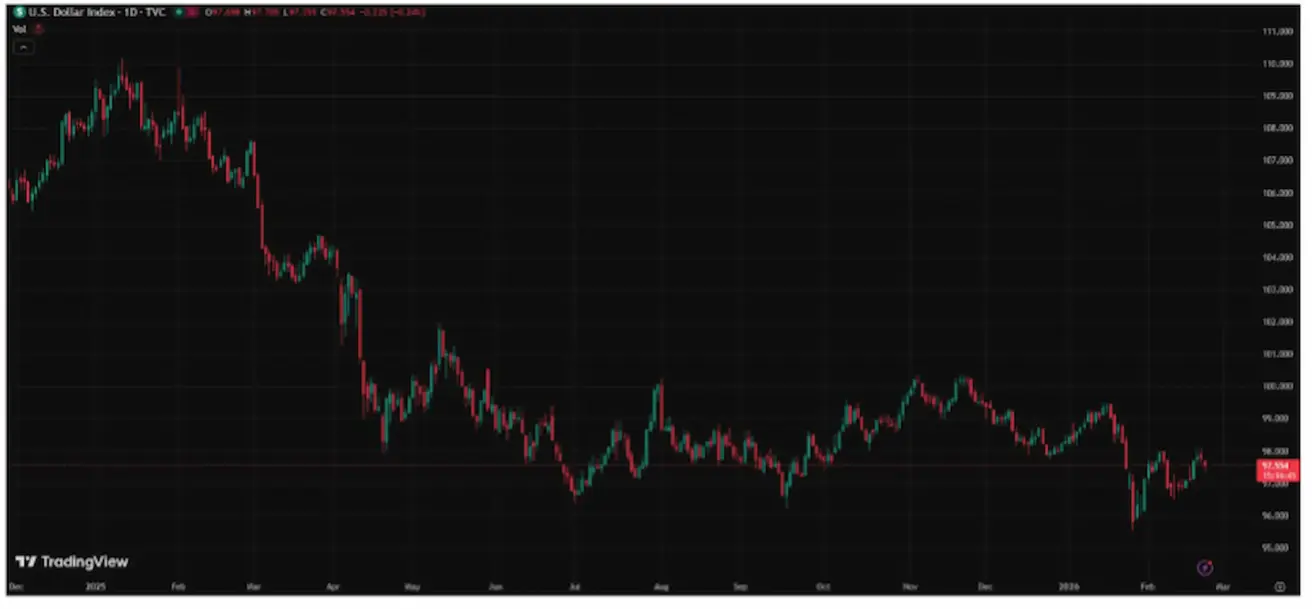
DOLERIO INDEKSO ATEITIES SANDORIAI (DX)
Savaitinis pokytis: 0.76% (savaitės pabaigos uždarymas: 97.554). Nuo metų pradžios: –0.45%.
Po kritimo 2025 m. pabaigoje doleris prekiaujasi 96–99 intervale; lūkesčiai dėl labiau neutralios FED politikos riboja brangimo potencialą, tačiau nesudaro nuolatinio spaudimo USD.
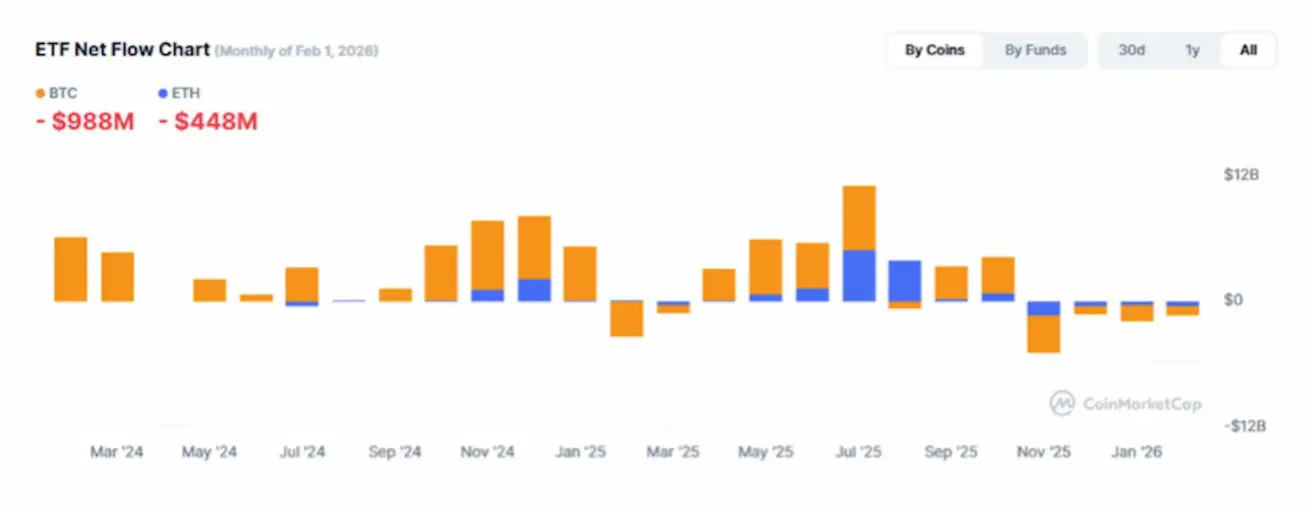
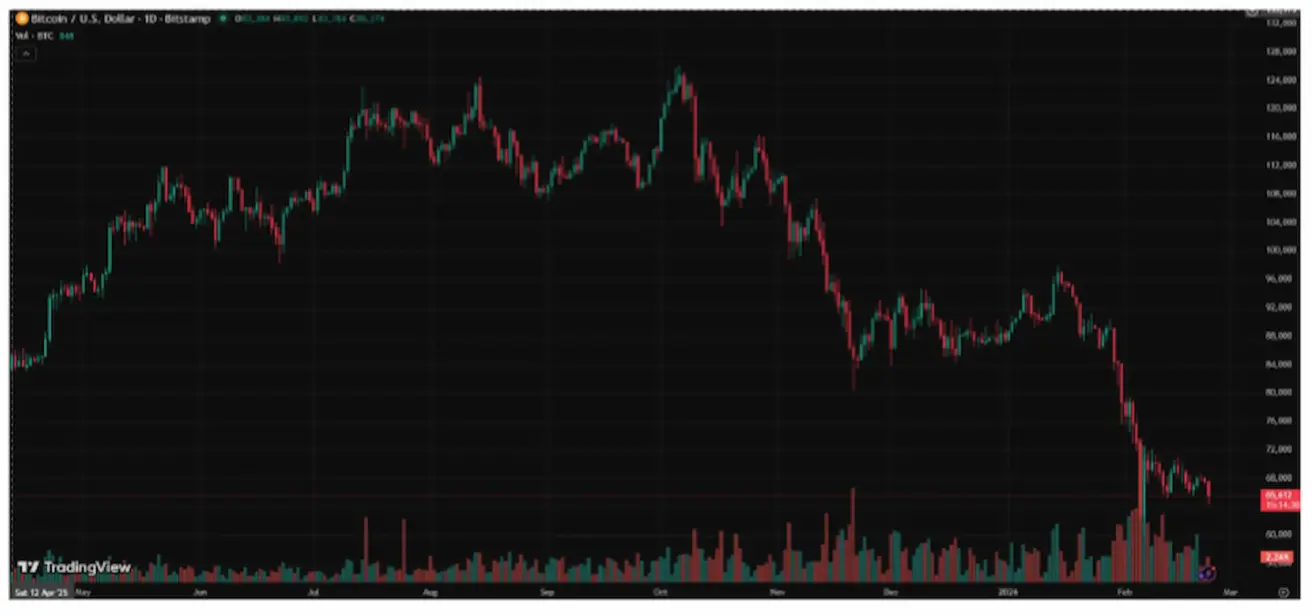
BTC ATEITIES SANDORIAI
Savaitinis pokytis -4,62% (savaitės pabaigos uždarymas: $65612); nuo metų pradžios: -25,2%.
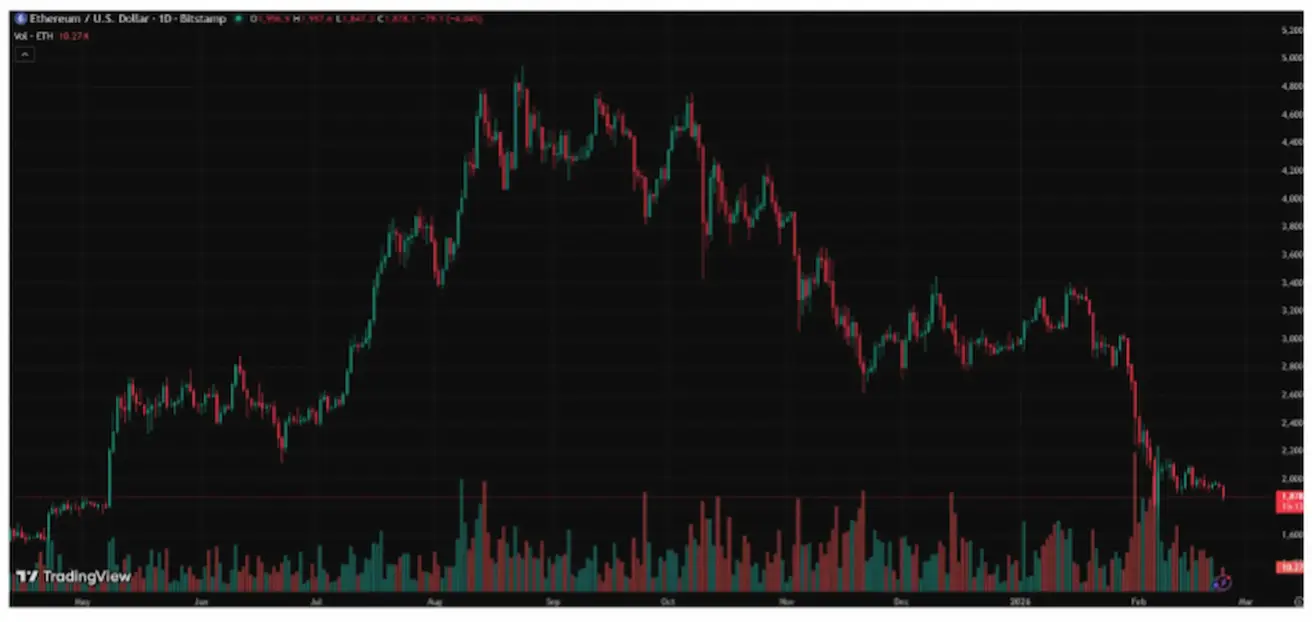
ETH ATEITIES SANDORIAI
Savaitinis pokytis -4,41% (savaitės pabaigos uždarymas: $1878,7); nuo metų pradžios: -36,83%.
BENDRA KRIPTOVALIUTŲ RINKOS KAPITALIZACIJA
Bendra kriptovaliutų rinkos kapitalizacija: $2,25T (palyginti su $2.37T prieš savaitę) (coinmarketcap.com).
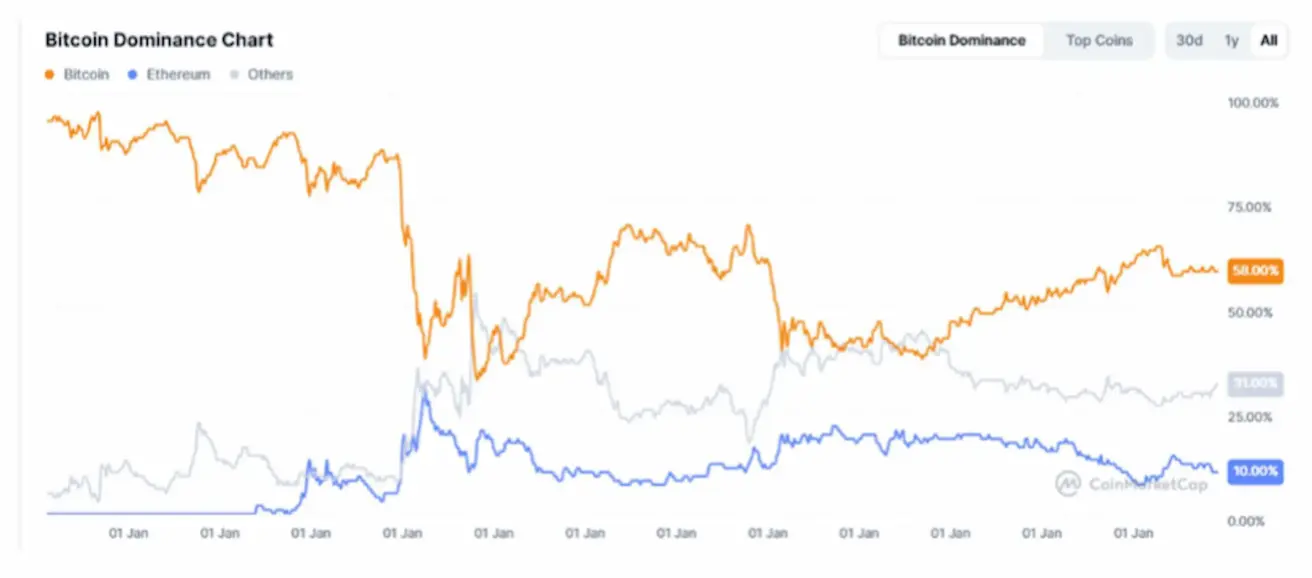
Kriptoaktyvų dalys
- Bitcoin: 58,2% (58,5%);
- Ethereum: 10,1% (10,4%);
- kiti: 31.7% (31.1%).
ETF grynųjų srautų diagrama: