English
 Русский
 Қазақша
 Eesti
Eesti2025 m. rugsėjo 22–26 d.: savaitinis ekonominis atnaujinimas
Pagrindiniai rinkos atnaujinimai

Makroekonominė statistika
INFLIACIJA
- Pagrindinis vartotojų kainų indeksas (CPI) (mėn./mėn.) (rugpjūtis): 0,3% (ankstesnis: 0.3%)
- Vartotojų kainų indeksas (CPI) (mėn./mėn.) (rugpjūtis): 0.4% (ankstesnis: 0.2%)
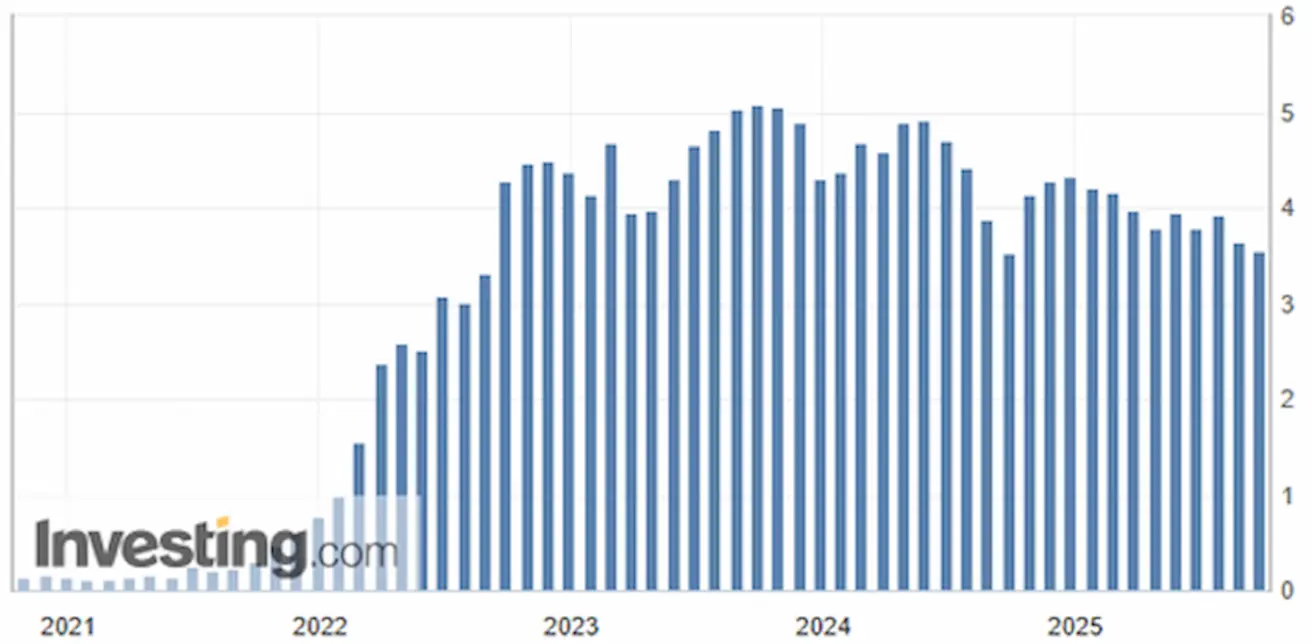
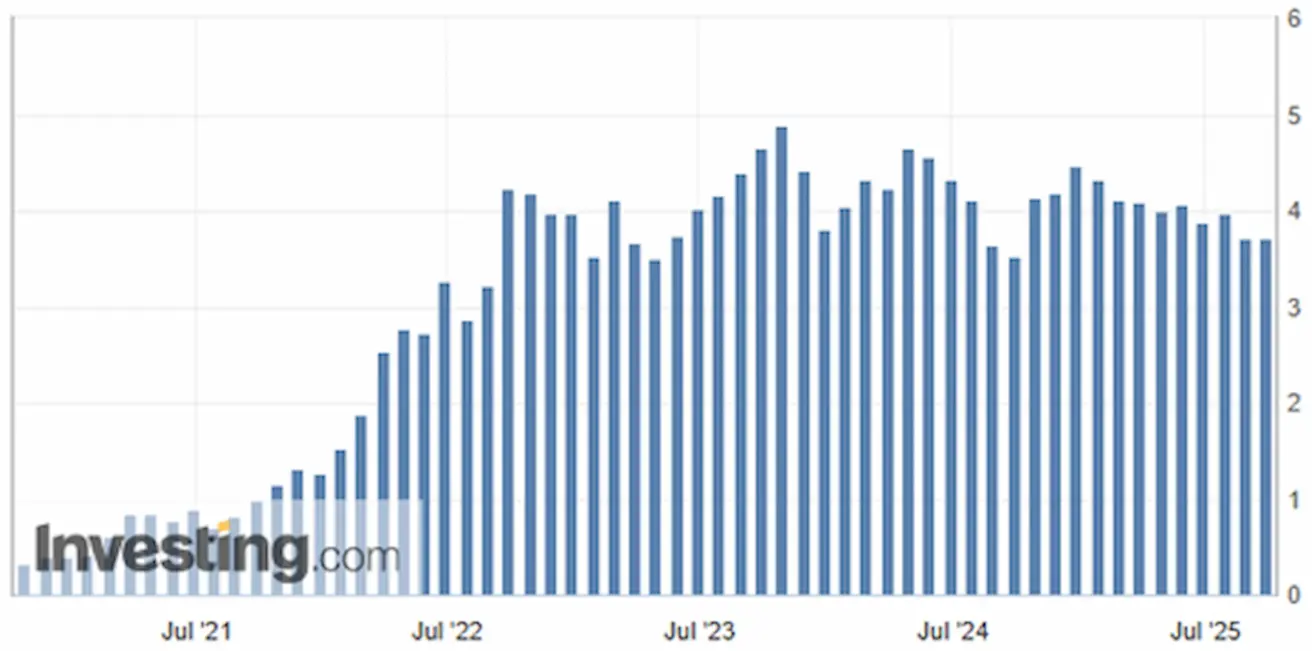
- Pagrindinis vartotojų kainų indeksas (CPI) (m./m.) (rugpjūtis): 3.1% (ankstesnis: 2.9%)
- Vartotojų kainų indeksas (CPI) (m./m.) (rugpjūtis): 2.9% (ankstesnis: 2.7%)
INFLIACIJOS LŪKESČIAI (MICHIGAN)
- 12 mėn. infliacijos lūkesčiai (rugpjūtis): 4.7% (ankst.: 4.8%)
- 5 metų infliacijos lūkesčiai (rugpjūtis): 3.7% (ankst.: 3.5%)
GAMINTOJŲ KAINŲ INDEKSAS (PPI):
- PPI (mėn./mėn.) (rugpjūtis): -0.1%, ankst.: 0.7%
- Pagrindinis PPI (mėn./mėn.) (rugpjūtis): -0.1%, ankst.: 0.7%
BVP (JAV ekonominės analizės biuras, BEA) (2025 m. II ketv., anualizuotas, antrasis įvertis): +3.8% (pirminis įvertis: 3.30%; 2024 m. I ketv.: – 0.5%):
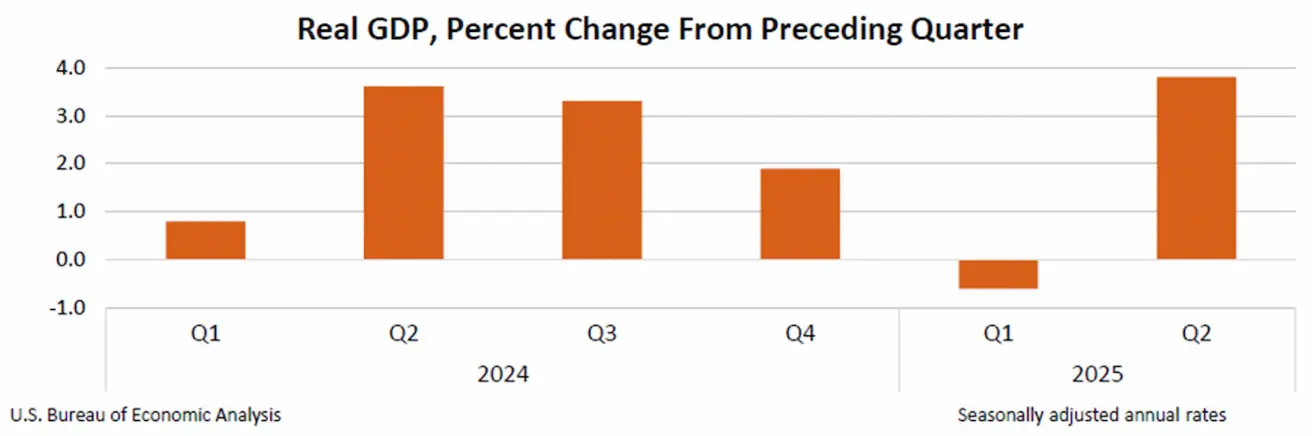
Atlanta Fed GDPNow įvertis (II ketv.): 3.9% (palyginti su 3.3%). *(GDPNow prognozavimo modelis pateikia „real-time“ oficialaus BVP augimo įvertį iki jo paskelbimo, naudodamas metodiką, panašią į taikomą JAV ekonominės analizės biuro.)
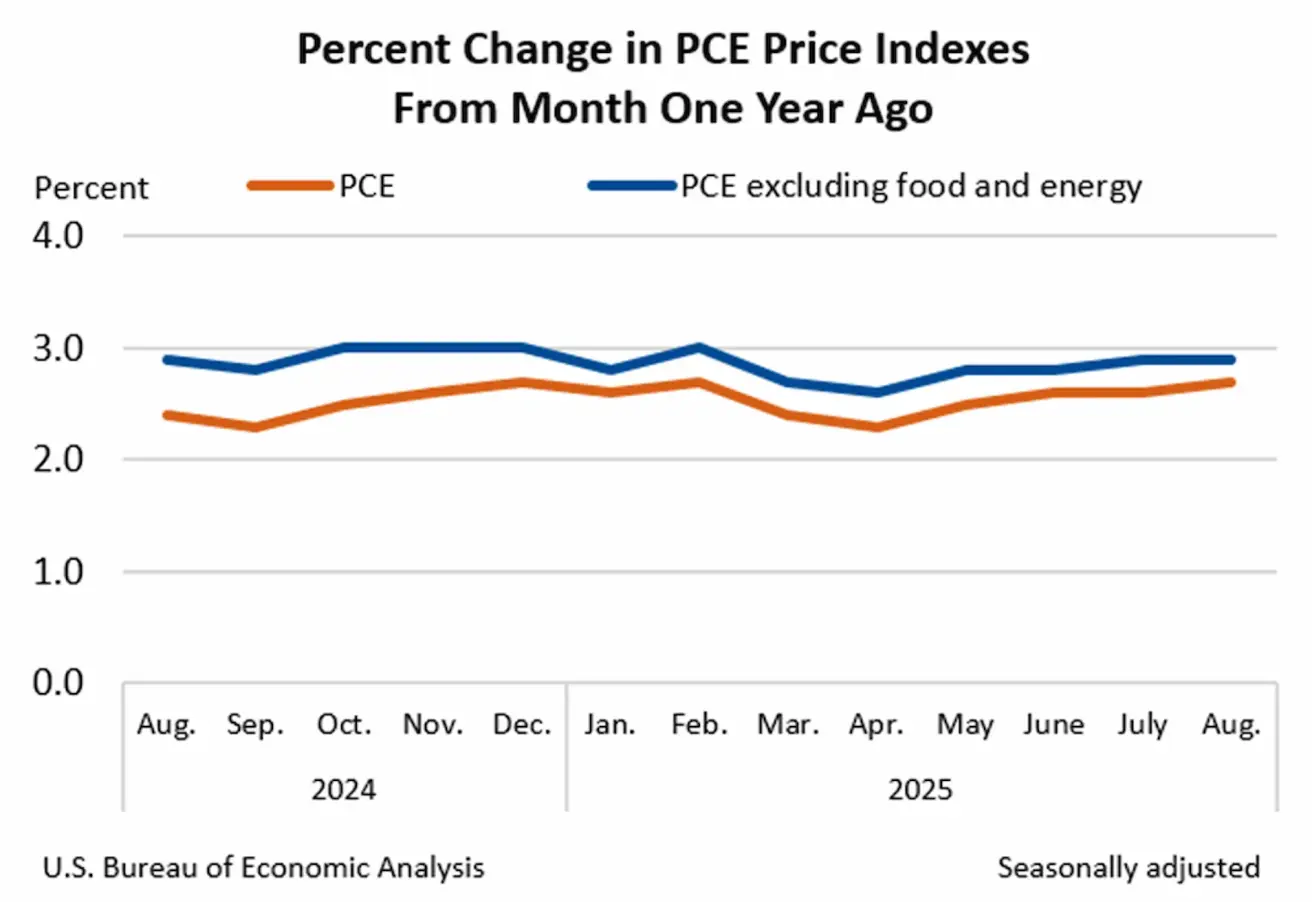
Federalinio rezervo pirmenybę turimas infliacijos rodiklis – asmeninių vartojimo išlaidų (PCE) indeksas – už rugpjūtį: PCE: 2.7% (palyginti su 2.6%); pagrindinis PCE: 2.9% (palyginti su 2.9%).
Verslo aktyvumo indeksas (PMI):
(Virš 50 rodo plėtrą; žemiau 50 rodo nuosmukį)
- Paslaugų sektorius (rugpjūtis): 53.9 (ankstesnis: 54.5)
- Gamybos sektorius (liepa): 52.0 (ankstesnis: 53,0)
- S&P Global Composite (rugpjūtis): 53.6 (ankstesnis: 54.6)
DARBO RINKA:
- Nedarbo lygis (rugpjūtis): 4.3% (ankstesnis: 4.2%)
- Ne žemės ūkio darbo vietų pokytis (rugpjūtis): 22K (ankstesnis patikslintas: 79K)
- JAV privačių ne žemės ūkio darbo vietų pokytis (rugpjūtis): 38K (ankstesnis: 77K)
- Vidutinis valandinis darbo užmokestis (rugpjūtis, m./m.): +3.7% (ankstesnis: +3.9%)
- JOLTS laisvos darbo vietos (rugpjūtis): 7.181M (palyginti su 7.357M)
- Bendras asmenų, gaunančių nedarbo išmokas JAV, skaičius: 1,926K (palyginti su 1,920K).
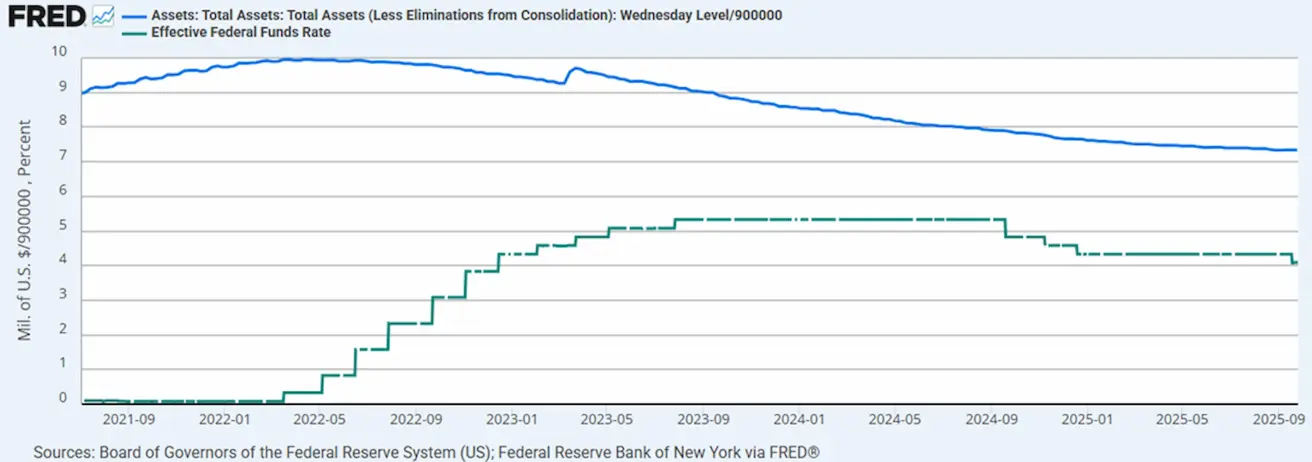
PINIGŲ POLITIKA
- Federalinių fondų efektyvioji palūkanų norma (EFFR): 4.00% - 4.25% (be pokyčių)
- Federalinio rezervo balansas padidėjo: $6,608T (palyginti su ankstesne savaite: $6,605T)
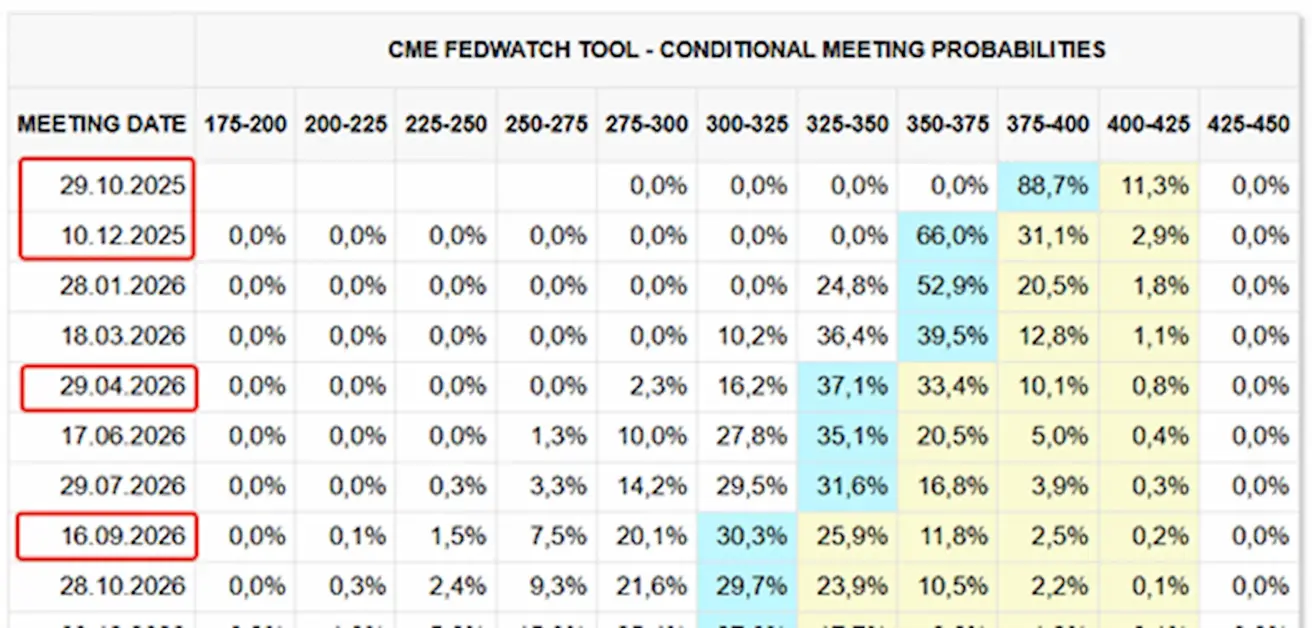
RINKOS PALŪKANŲ PROGNOZĖ (FEDWATCH)
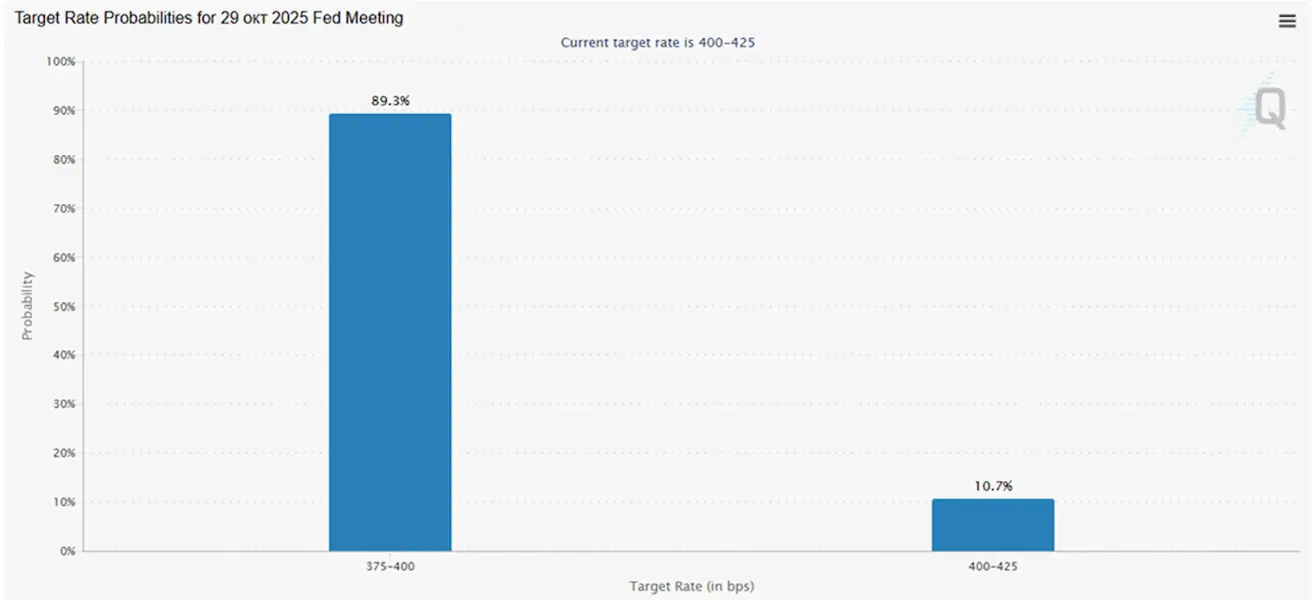
Lūkesčiai dėl artėjančio FOMC posėdžio spalio 29 d.:
Šiandien:
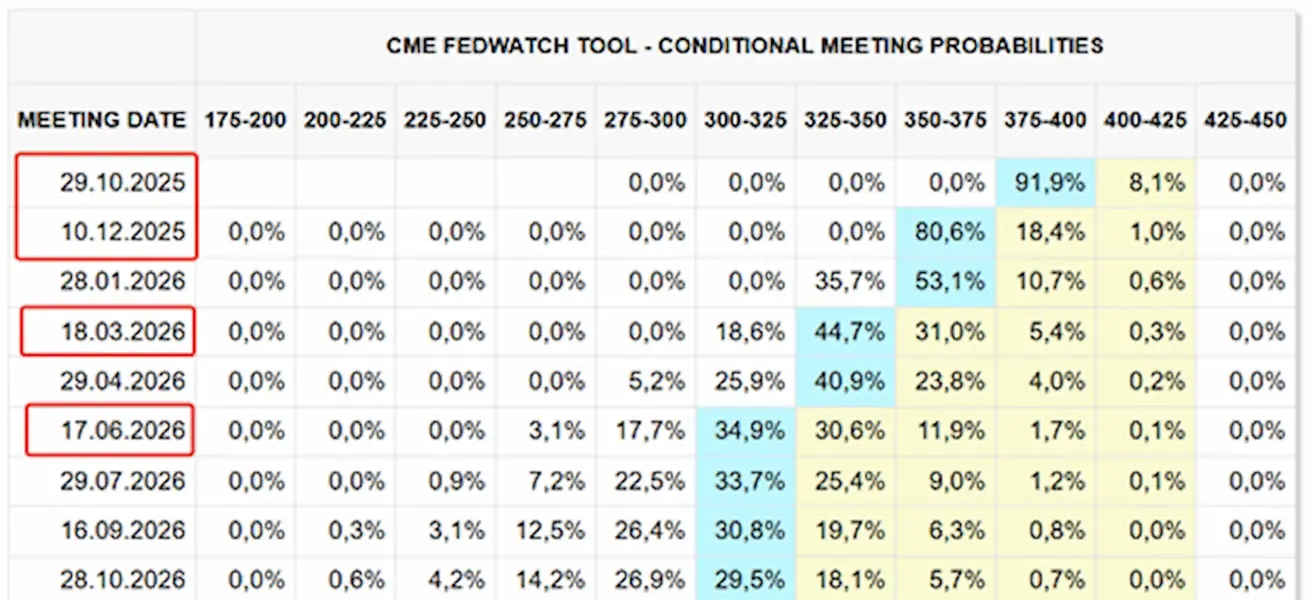
Prieš savaitę:
Komentaras
Savaitės viduryje Federalinio rezervo atstovų retorika darė spaudimą akcijų indeksams. Vis dėlto penktadienį paskelbti PCE duomenys ir trumpalaikių infliacijos lūkesčių sumažėjimas suteikė rinkoms pozityvų toną.
JAV
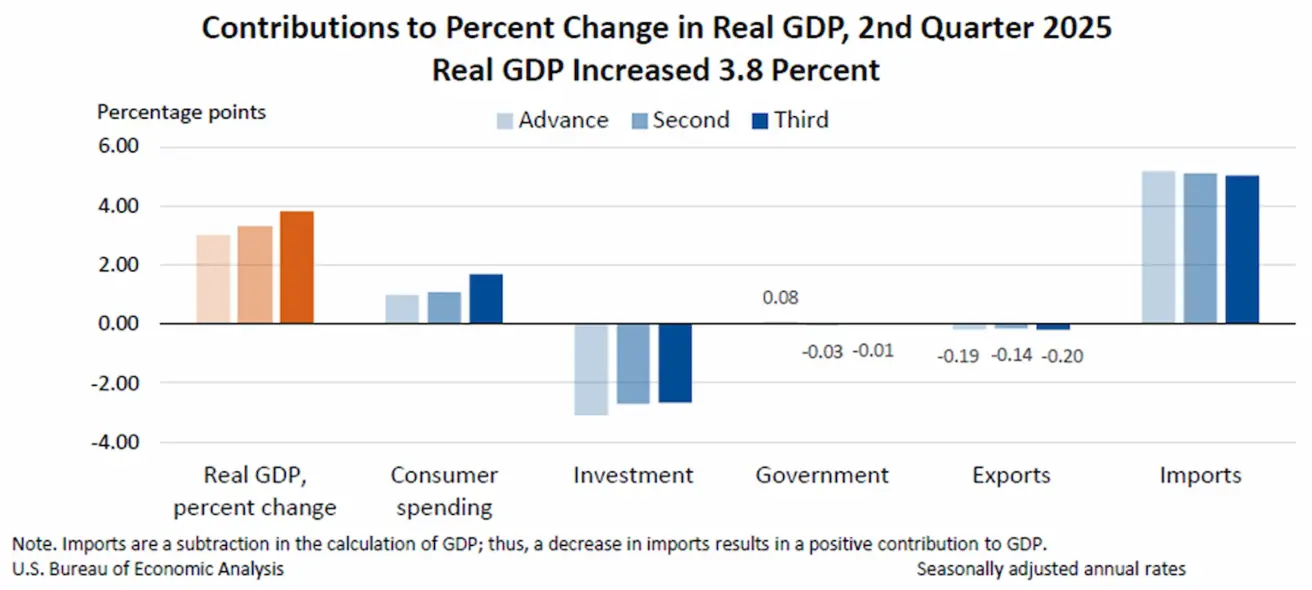
JAV ekonomika antrąjį ketvirtį augo sparčiausiu tempu per beveik dvejus metus. Realusis BVP buvo padidintas 0.5 proc. punkto iki 3.8% (palyginti su antruoju 3.30% įverčiu), daugiausia dėl stipresnių vartojimo išlaidų. Toks tvirtas BVP augimas mažina greito palūkanų normų mažinimo ciklo tikimybę.
Asmeninių vartojimo išlaidų (PCE) kainų indeksas augo 0.3% mėn./mėn. (palyginti su 0.2% anksčiau), o pagrindinis PCE išliko nepakitęs – 0.2% — nėra staigaus šuolio, tačiau tendencija palaipsniui krypsta aukštyn. Tuo pat metu BVP defliatorius (kitas svarbus infliacijos rodiklis) per tą patį laikotarpį sumažėjo perpus – iki 2.1% (palyginti su 3.8%). JAV PMI indeksai išlieka virš 50 ribos, signalizuodami plėtrą, tačiau per praėjusią savaitę sumažėjo. Tęstinės nedarbo išmokų paraiškos išaugo iki 1.926M (palyginti su 1.920M), šiek tiek daugiau, bet vis dar žemiau prognozių.
Federalinio rezervo pirmininkas Jerome’as Powellas Greater Providence prekybos rūmuose pristatė ekonomikos perspektyvą. Apskritai jo tonas išliko nuoseklus, lyginant su paskutiniuoju FOMC posėdžiu.
Powellas pakartojo:
Trumpalaikės infliacijos rizikos išlieka pasvirusios į viršų, o užimtumo rizikos – į apačią, todėl aplinka yra sudėtinga. Šios dvipusės rizikos reiškia, kad nėra no risk-free path. Padidėjusios užimtumo rizikos pakeitė pusiausvyrą, kuri riboja mūsų galimybes įgyvendinti dvigubą mandatą. Todėl per paskutinį posėdį nusprendėme žengti dar vieną žingsnį link labiau neutralios politikos.
Tačiau jis taip pat atkreipė dėmesį į riziką, susijusią su palūkanų normų mažinimo tempo lėtinimu:
Jei per agresyviai švelninsime pinigų politiką, galime palikti infliacijos užduotį neužbaigtą — ir vėliau būti priversti keisti kryptį, kad infliacija vėl pasiektų 2%. Neapibrėžtumas dėl infliacijos trajektorijos išlieka didelis. Atidžiai vertinsime ir valdysime didesnės ir labiau užsitęsusios infliacijos riziką. Užtikrinsime, kad šis vienkartinis kainų šuolis nevirstų ilgalaike infliacijos problema.
Naujausi Federalinio rezervo pareigūnų komentarai:
- Raphael Bostic (Atlanta Fed): „Šiuo metu nematau įtikinamos priežasties tolesniam palūkanų normų mažinimui.“
- Alberto Musalem (St. Louis Fed): „Erdvė papildomiems palūkanų mažinimams yra ribota.“
- Mary Daly (San Francisco Fed): „Papildomi žingsniai mažinant bazinę palūkanų normą vis dar gali būti būtini.“
Rinkos lūkesčiai (CME FedWatch):
- Artimiausiam posėdžiui (spalio 29 d.): implikuota 25 bazinių punktų palūkanų mažinimo tikimybė yra 89.3%.
- Iki metų pabaigos: rinkos įkainoja dar du palūkanų sumažinimus.
- Per artimiausius 12 mėn.: lūkesčiai rodo keturis 25 bazinių punktų sumažinimus iš viso, sumažinant tikslinį intervalą iki 3.00–3.25%.
Visi buvę Federalinio rezervo pirmininkai pasirašė laišką, kuriame raginama Aukščiausiąjį Teismą užtikrinti Fed nepriklausomybę.
ES
PMI duomenys parodė mišrų vaizdą: sudėtinis indeksas ir paslaugų sektorius išlieka plėtros zonoje, o gamybos PMI nuslydo į nuosmukį ir siekė 49.5.
ECB vartotojų lūkesčių apklausa (2025 m. rugpjūtis):
- Vidutiniai infliacijos lūkesčiai per artimiausius 12 mėn. pakilo iki 2.8% (nuo 2.6% liepą), o trejų metų į priekį lūkesčiai išliko nepakitę.
- Tikimasi, kad nominaliosios pajamos per ateinančius 12 mėn. rugpjūtį augs 1.1% (palyginti su 0.9% liepą).
- Ekonomikos augimo lūkesčiai per artimiausius 12 mėn. liko –1.2%.
- Nedarbo lūkesčiai per artimiausius 12 mėn. padidėjo iki 10.7% (nuo 10.6% liepą). Vartotojai vis dar prognozuoja, kad būsimas nedarbas išliks tik šiek tiek didesnis už dabartiniu laikomą lygį — tai signalizuoja iš esmės stabilią darbo rinkos perspektyvą.
Kinija
Kinijos liaudies bankas (PBoC) paliko politikos palūkanų normas nepakeistas – 3.00–3.50%.
Prekybos karai
Prezidentas Donaldas Trumpas paskelbė naują sektoriams taikomų tarifų etapą, siekdamas apsaugoti JAV gamybą:
Nuo 2025 m. spalio 1 d. įsigalios:
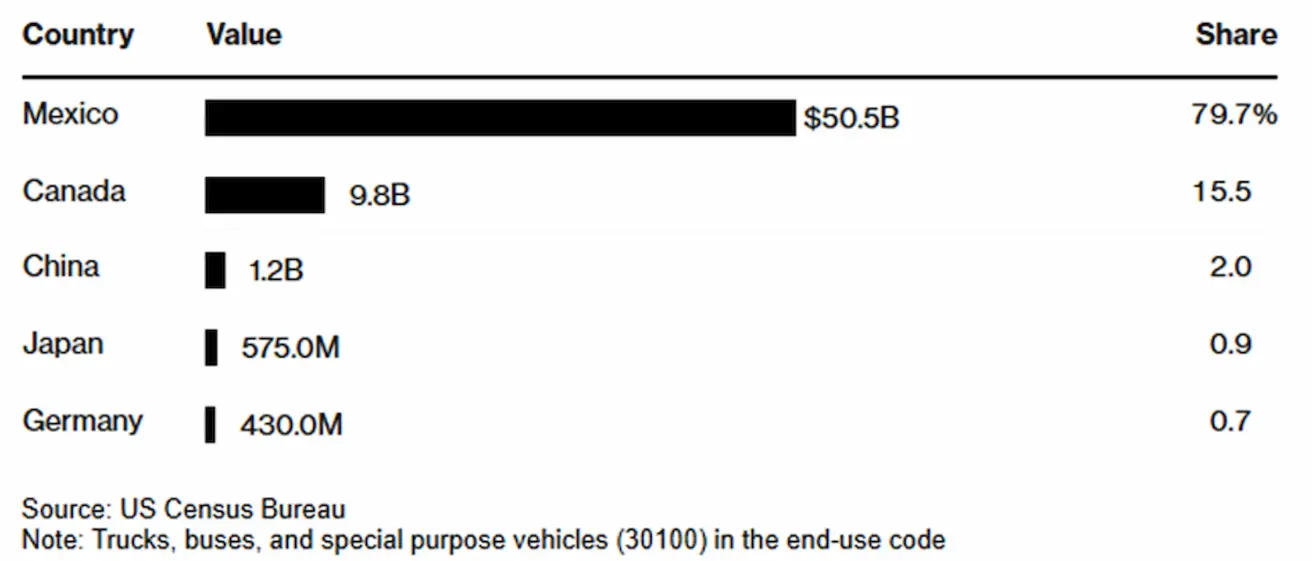
- 25% muito tarifai sunkvežimiams,
- 30% muito tarifai minkštiesiems baldams,
- 50% importo muito tarifai virtuvės spintelėms ir vonios kambario spintelėms. Penki didžiausi sunkvežimių eksportuotojai į JAV 2024 m.
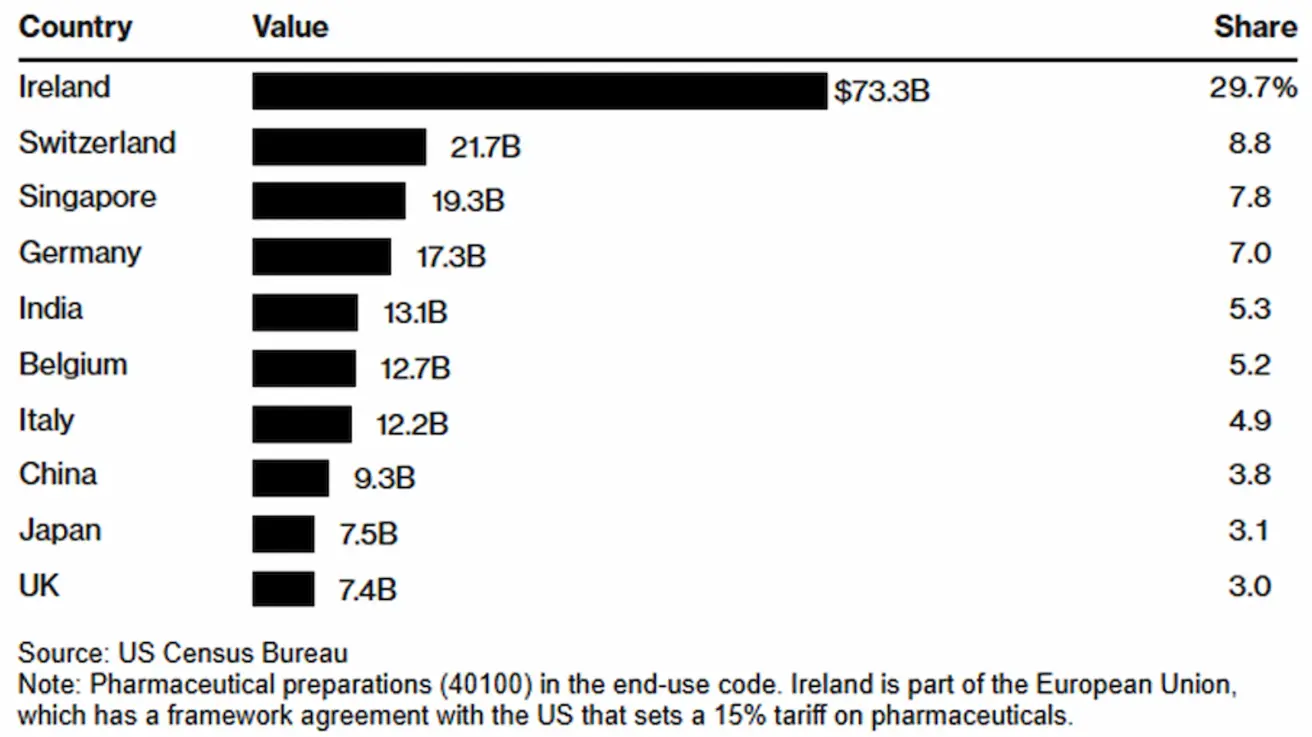
Be to, Trumpas paskelbė, kad nuo spalio 1 d. JAV taikys 100% muitą firminiams ir patentuotiems vaistams, jei gamintojas nepastato gamybos pajėgumų JAV.
- Išimtys: šalys, turinčios prekybos sutartis, kuriose yra nuostatos dėl farmacijos sektoriaus — ypač ES ir Japonija.
- Tarifai nebus taikomi, jei JAV gamybos objekto statyba jau pradėta.
Dešimt didžiausių farmacijos produktų eksportuotojų į JAV 2024 m. buvo:
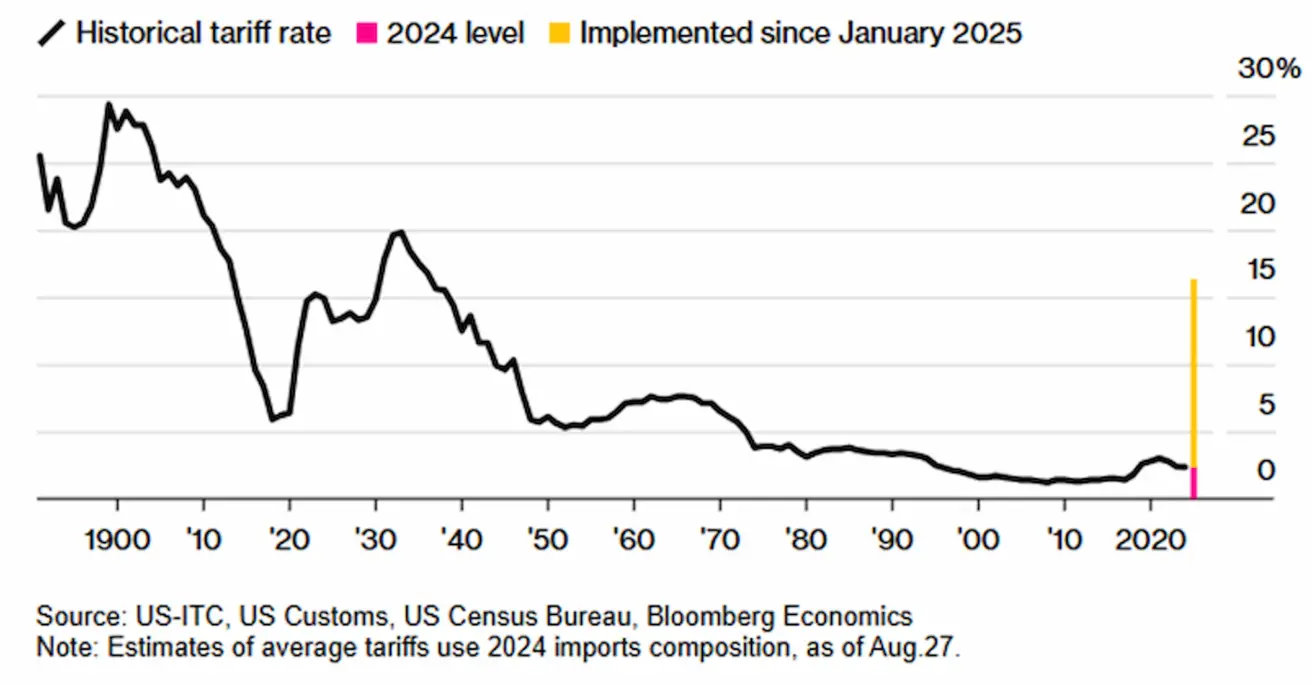
Bloomberg Economics vertinimu, naujai paskelbti tarifai gali padidinti vidutinį JAV importo muito tarifą 3.3 procentinio punkto. Tačiau šį poveikį iš dalies gali sušvelninti išimtys bendrovėms, kurios sukuria vietinius gamybos pajėgumus. (Šaltinis: Bloomberg)
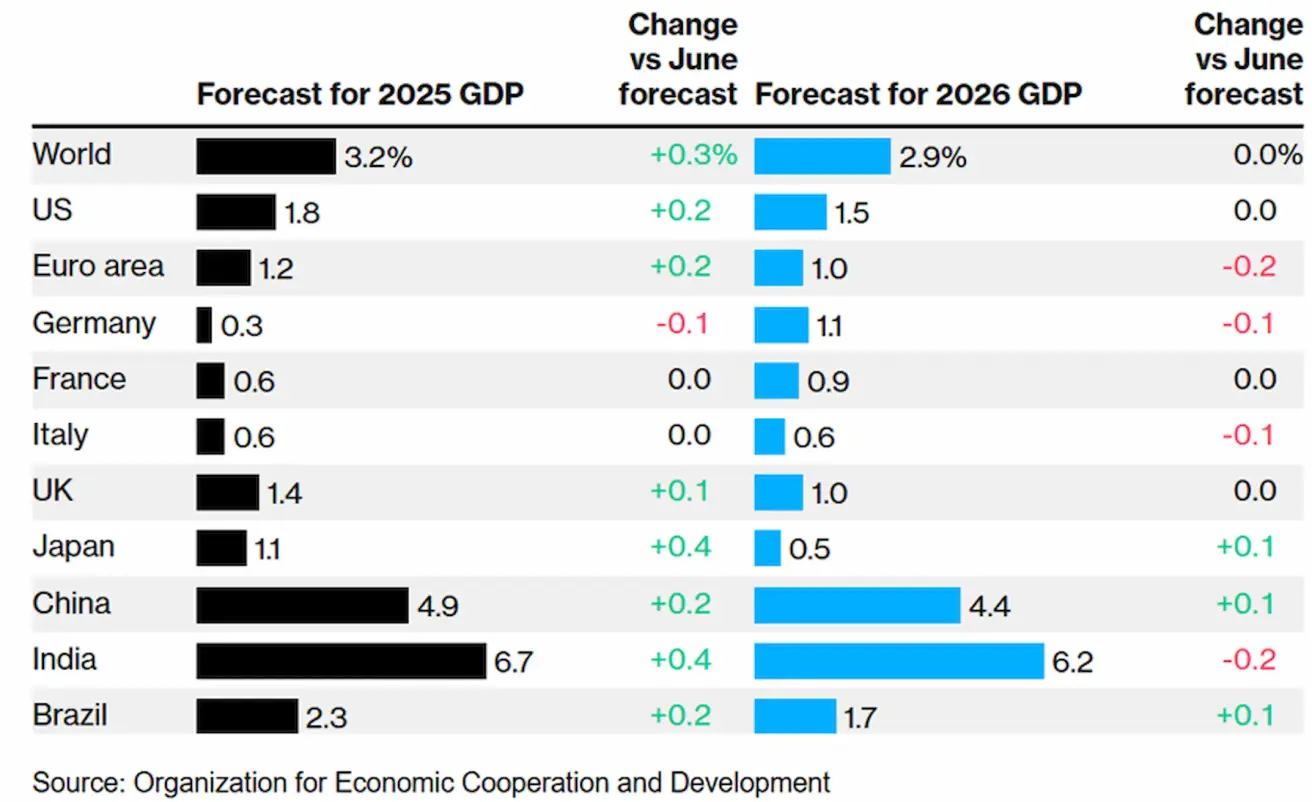
EBPO pareiškė, kad pasaulio ekonomika vis dar juda link reikšmingo smūgio dėl Donaldo Trumpo prekybos priemonių, nors pastaraisiais mėnesiais ji pasirodė esanti atsparesnė, nei tikėtasi.
Organizacija dabar tikisi, kad pasaulio augimas 2026 m. sulėtės nuo 3.2% iki 2.9%, didėjant importo muitams ir neapibrėžtumui — o visas prekybos priemonių poveikis dar nėra pasireiškęs.
EBPO augimo prognozės
Vidutiniai JAV importo muitų tarifai — dalis nuo bendros importo vertės:
Rinka
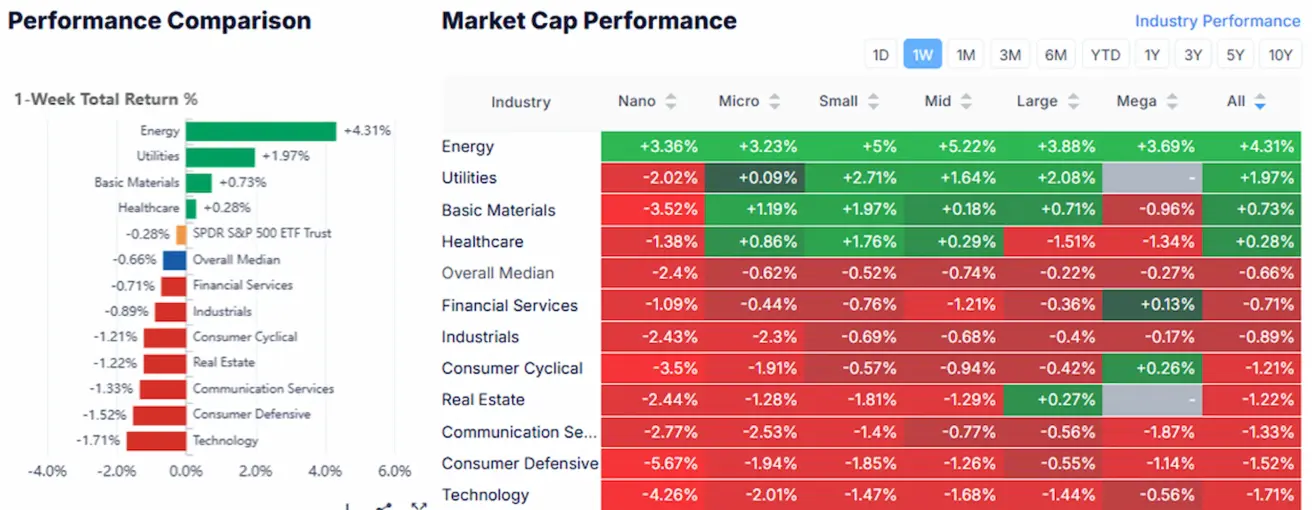
Per savaitę rinka fiksavo vidutinį –0.66% nuosmukį. Stipriausiai pasirodė Energetikos, Bazinių medžiagų ir Komunalinių paslaugų sektoriai, o Vartojimo prekių, Nekilnojamojo turto ir Technologijų sektoriai atsiliko.
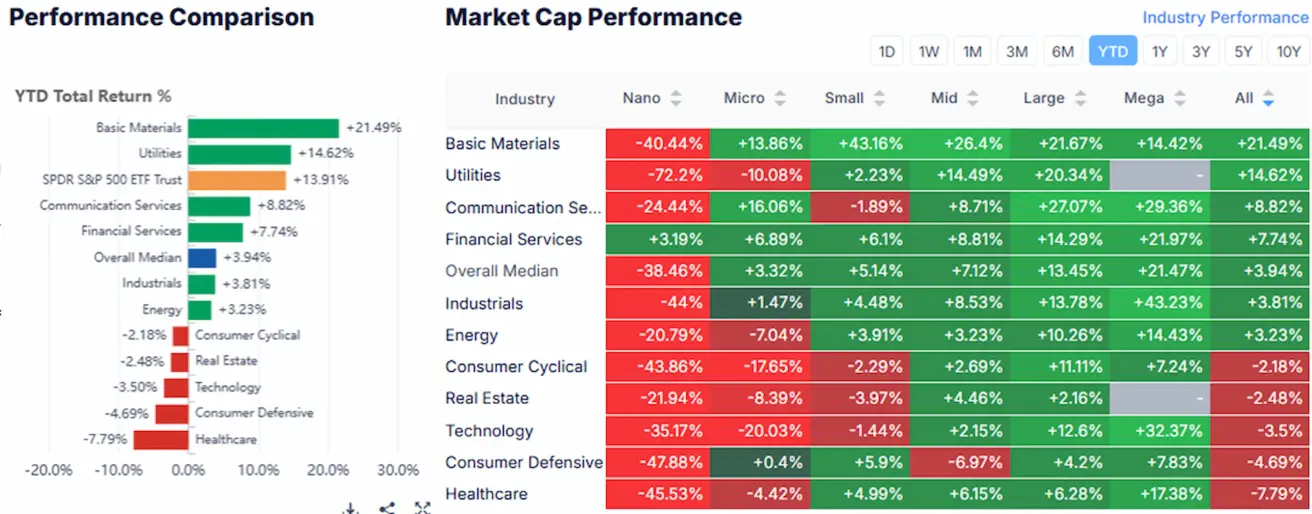
Nuo metų pradžios (YTD) rinka yra pakilusi +3.94%. Geriausiai pasirodantys sektoriai yra Bazinės medžiagos, Ryšių paslaugos ir Komunalinės paslaugos, o atsiliekantys — Vartojimo prekės, Sveikatos priežiūra ir Technologijos.
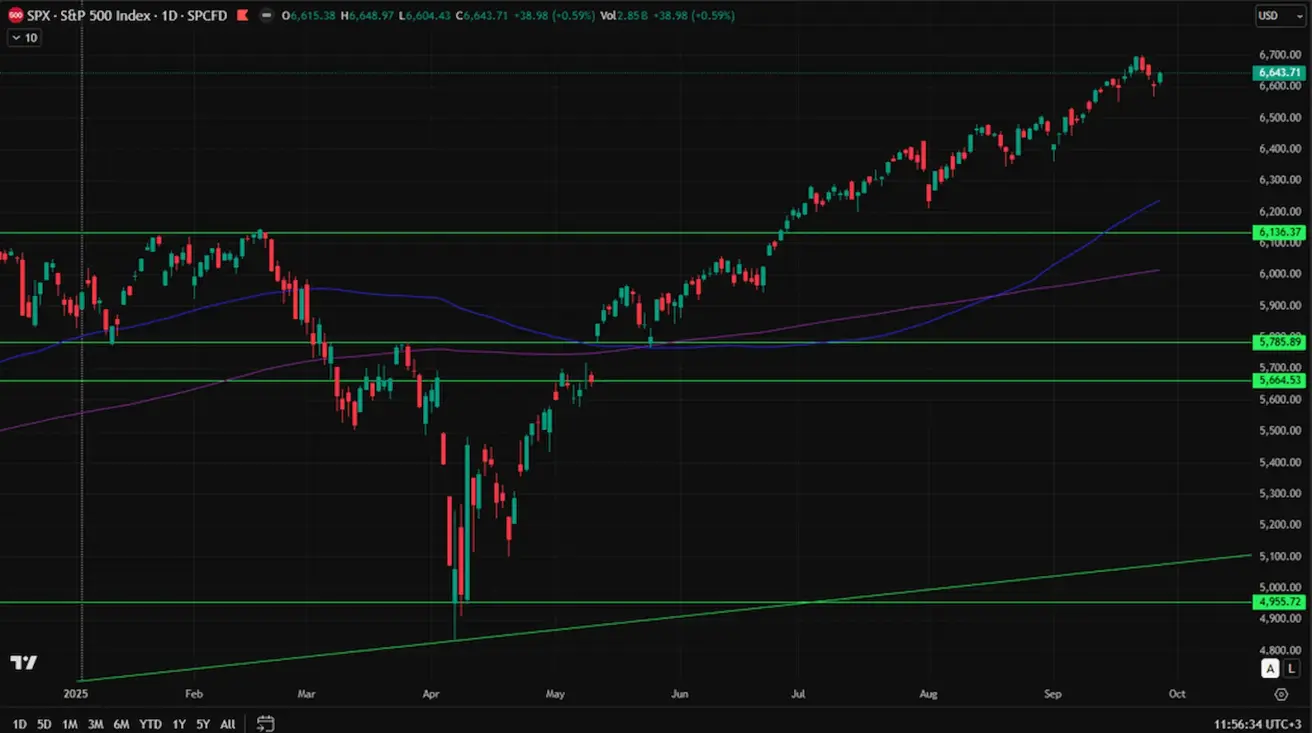
SP500
S&P 500 indeksas savaitę baigė smukęs 0.31%, užsidarydamas ties 6,643.71. Nuo metų pradžios indeksas yra pakilęs +12.54%.
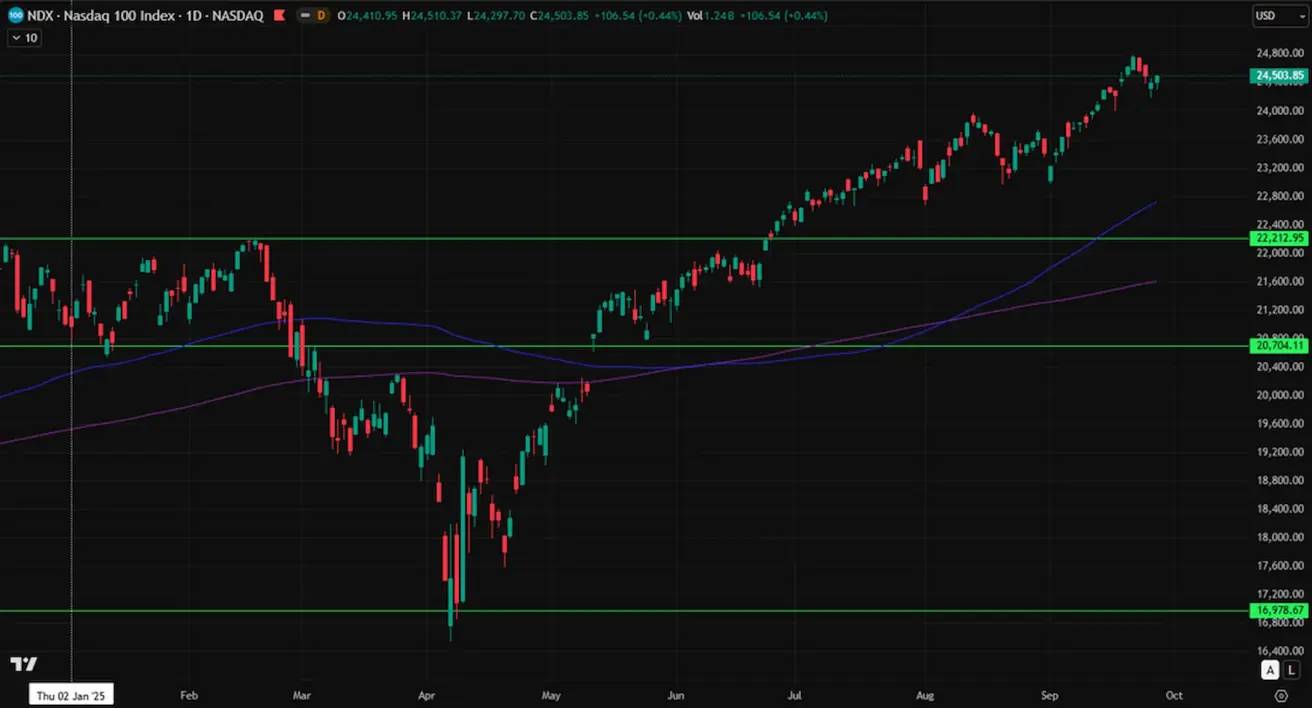
NASDAQ100
Nasdaq 100 indeksas savaitę baigė smukęs 0.50%, užsidarydamas ties 24,503.85. Nuo metų pradžios indeksas yra pakilęs +16.02%.
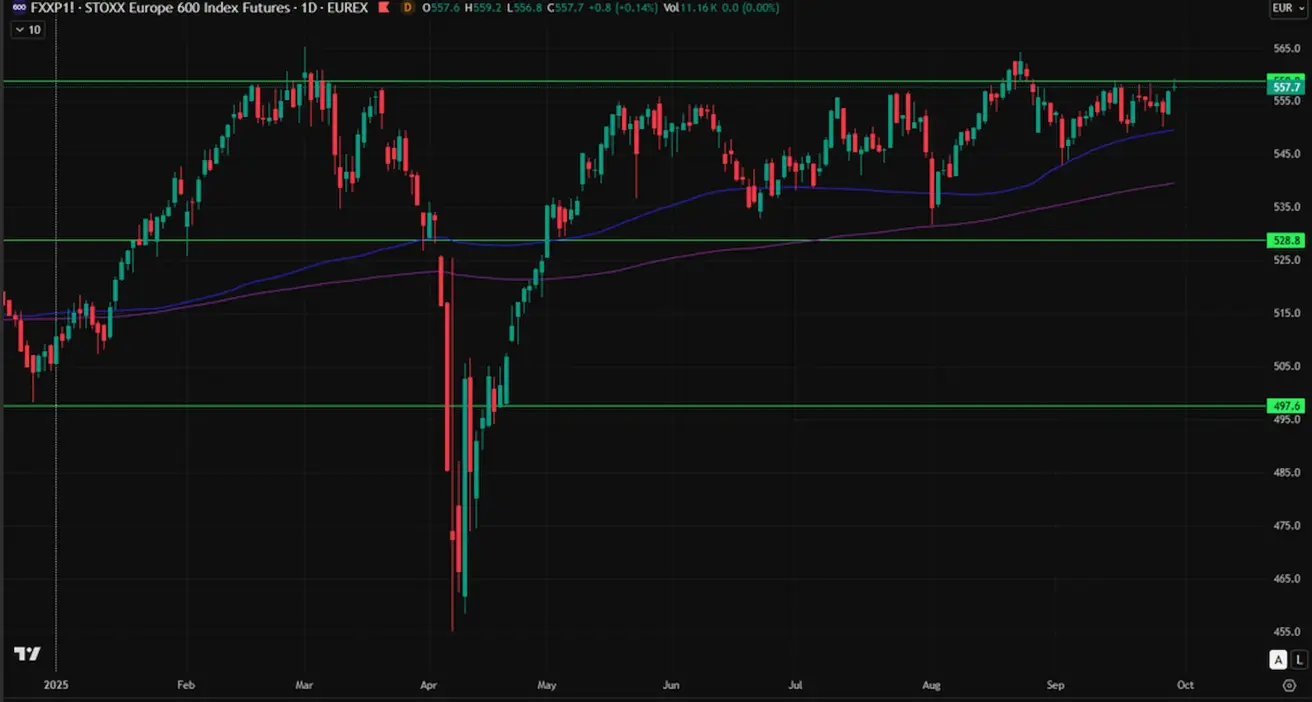
Euro Stoxx 600
Euro Stoxx 600 indeksas savaitę baigė pakilęs 0.20%, užsidarydamas ties 556.9. Nuo metų pradžios indeksas išaugo +10.15%.
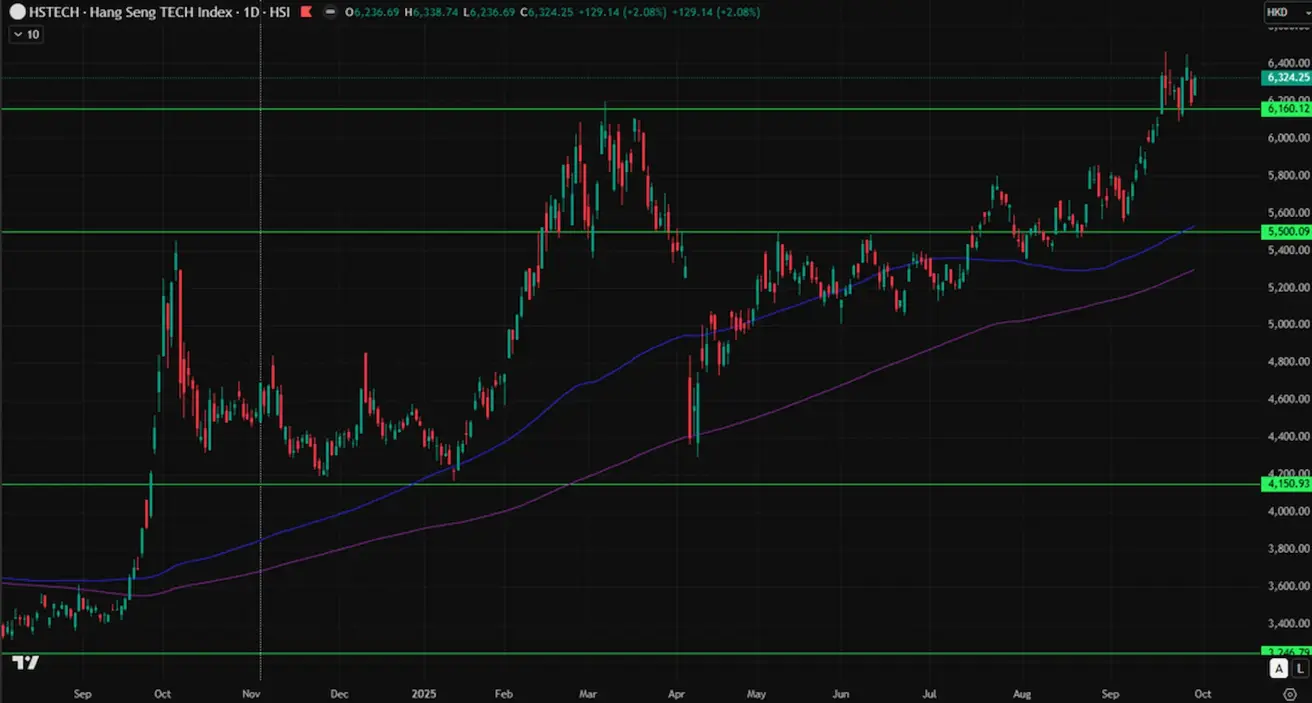
Hang Seng TECH indeksas (HSTECH.HK)
Hang Seng TECH indeksas (HSTECH.HK) pirmadienį atsidarė pakilęs 1.07%, ties 6,324.25. Nuo metų pradžios indeksas yra pakilęs +42.54%.
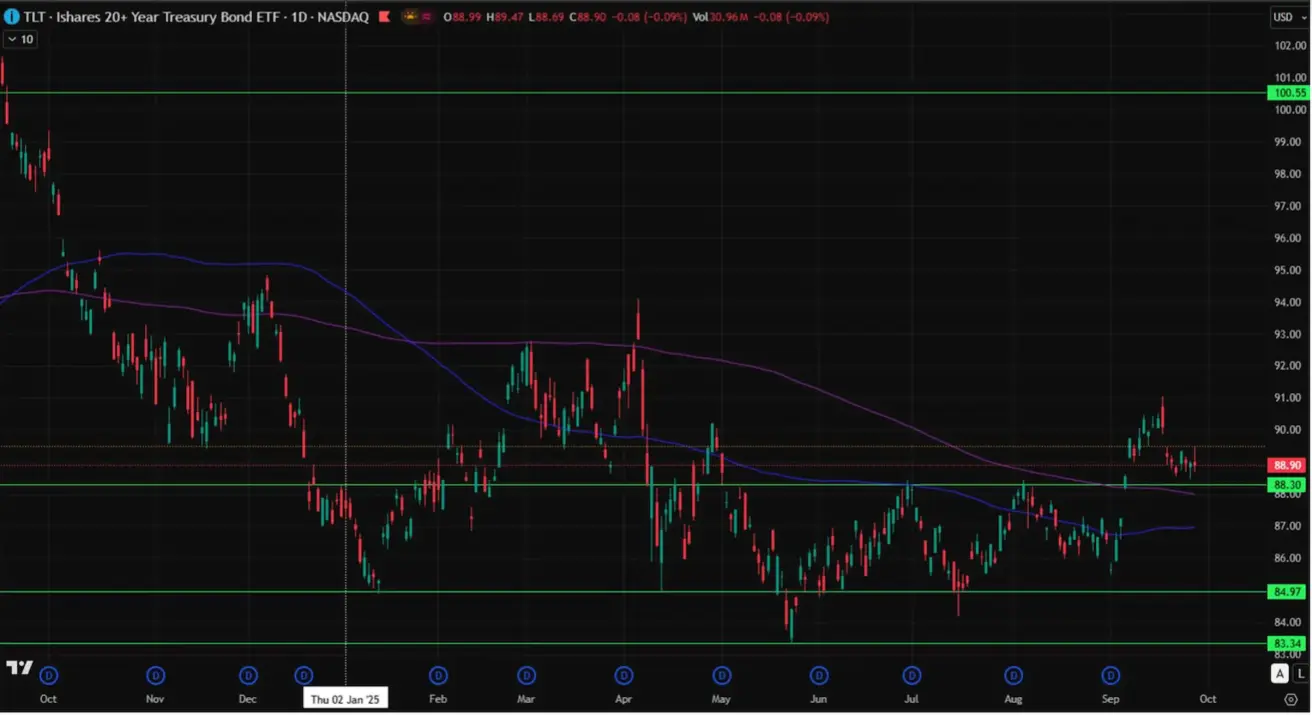
OBLIGACIJŲ RINKA
20+ metų JAV iždo obligacijų ETF (TLT) savaitę baigė smukęs 0.13%, užsidarydamas ties 88.90. Nuo metų pradžios fondas yra pakilęs +1.25%.
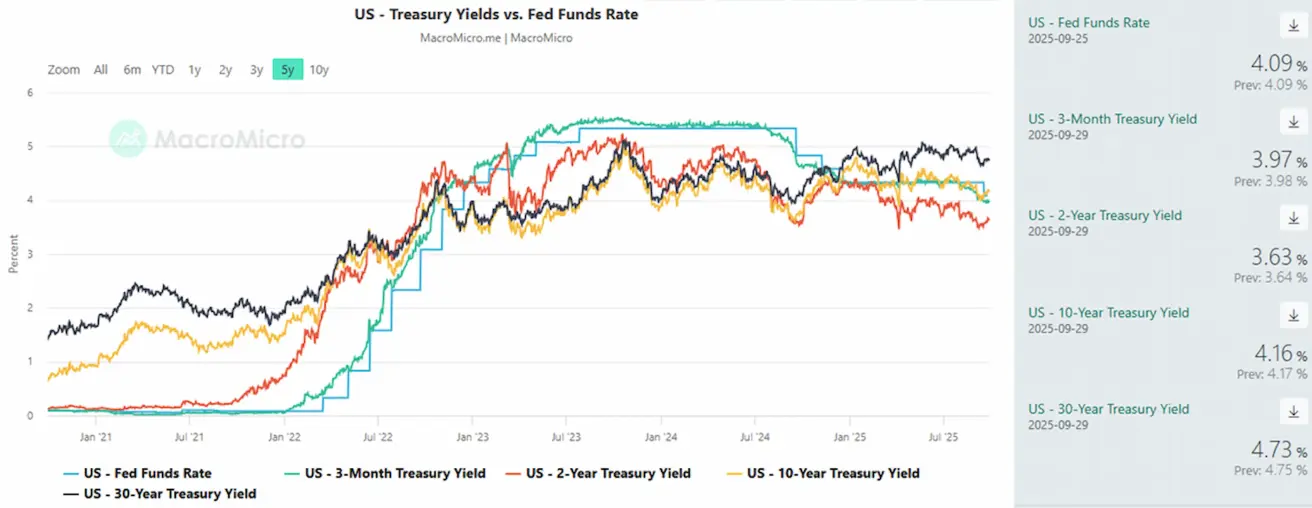
JAV iždo naujų emisijų aukcionuose ir toliau fiksuojami mažėjantys pajamingumai: 2 metų trukmės iždo vekseliai parduoti su 3.561% pajamingumu (palyginti su 3.641% anksčiau), o 5 metų trukmės — su 3.71% (palyginti su 3.724% anksčiau).
PAJAMINGUMAI IR SPREDAS
- Rinkos pajamingumas JAV iždo vertybiniams popieriams (10 metų pastovios trukmės): 4.16% (palyginti su 4.14%).
- ICE BofA BBB JAV įmonių obligacijų indekso efektyvus pajamingumas: 4.97% (palyginti su 4.93%).
- Pajamingumo spredas — 10 metų vs. 2 metų JAV iždo obligacijos: 53.0 bazinio punkto (palyginti su 56.0 bps).
- Pajamingumo spredas — 10 metų vs. 3 mėn. JAV iždo obligacijos: 19.0 bps (palyginti su 16.0 bps).
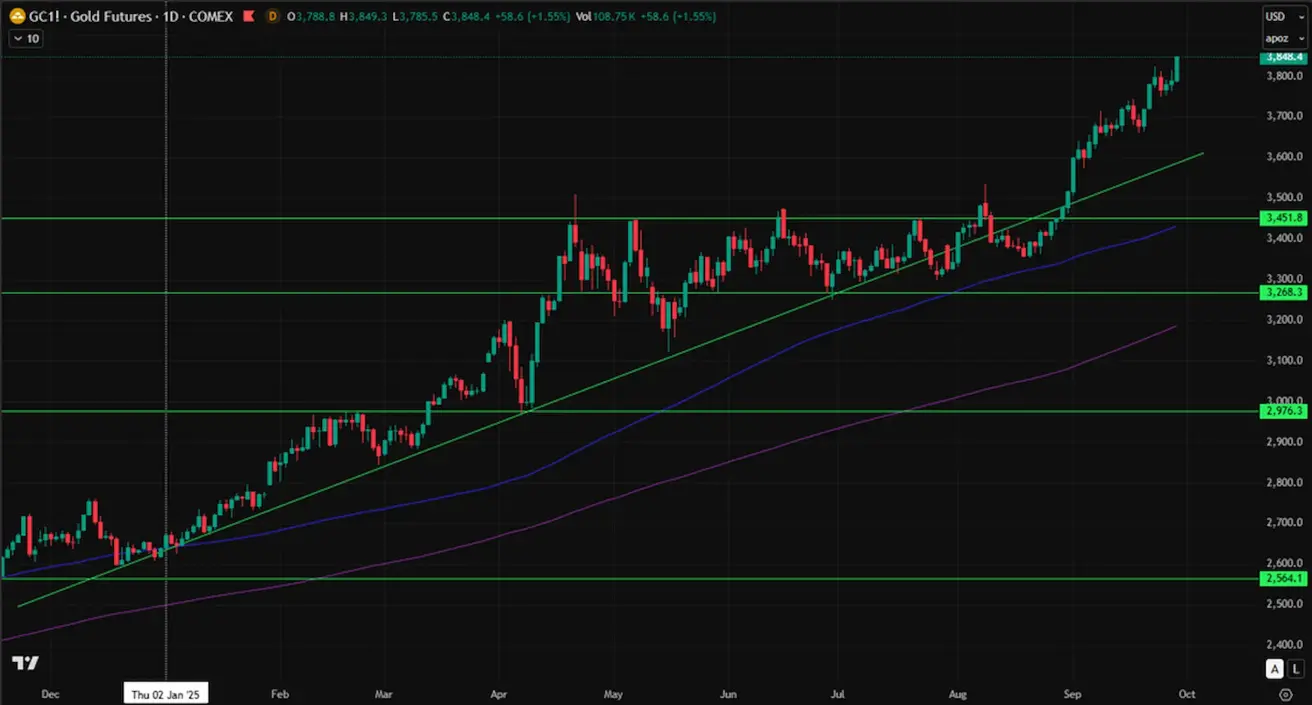
AUKSO ATEITIES SANDORIAI (GC)
Aukso ateities sandorių (GC) kontraktas savaitę baigė pakilęs 1.89%, užsidarydamas ties $3,789.8 už Trojos unciją. Nuo metų pradžios jo vertė išaugo +43.50%.
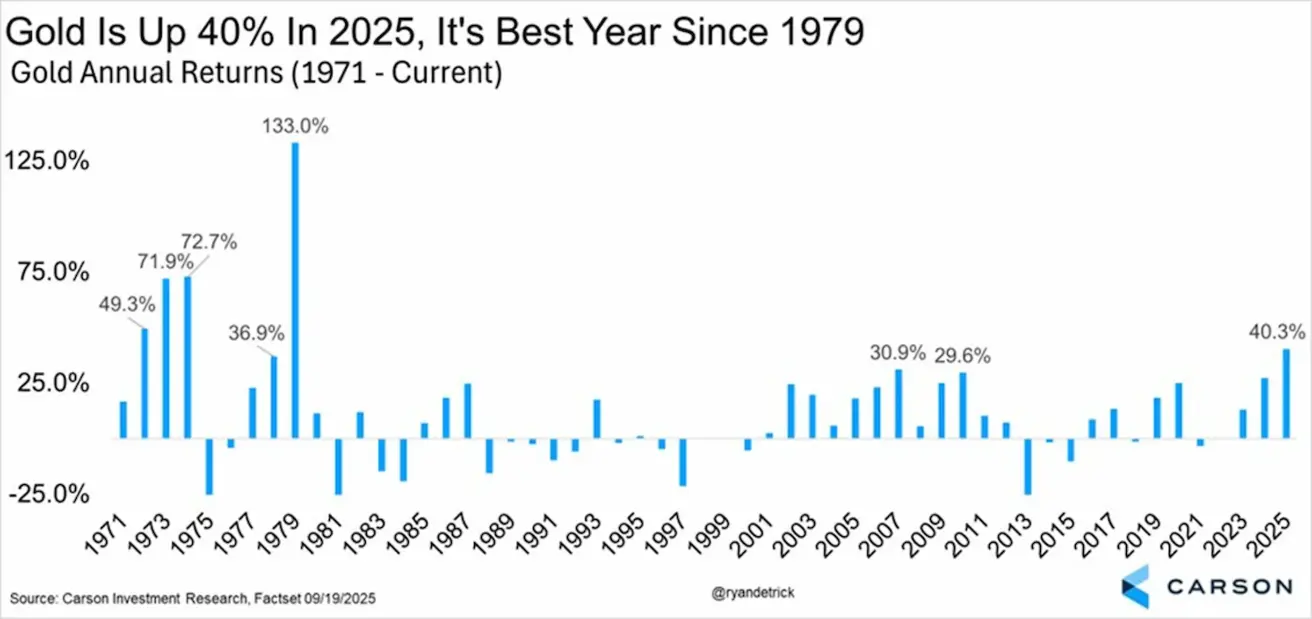
Metiniai aukso grąžos rodikliai
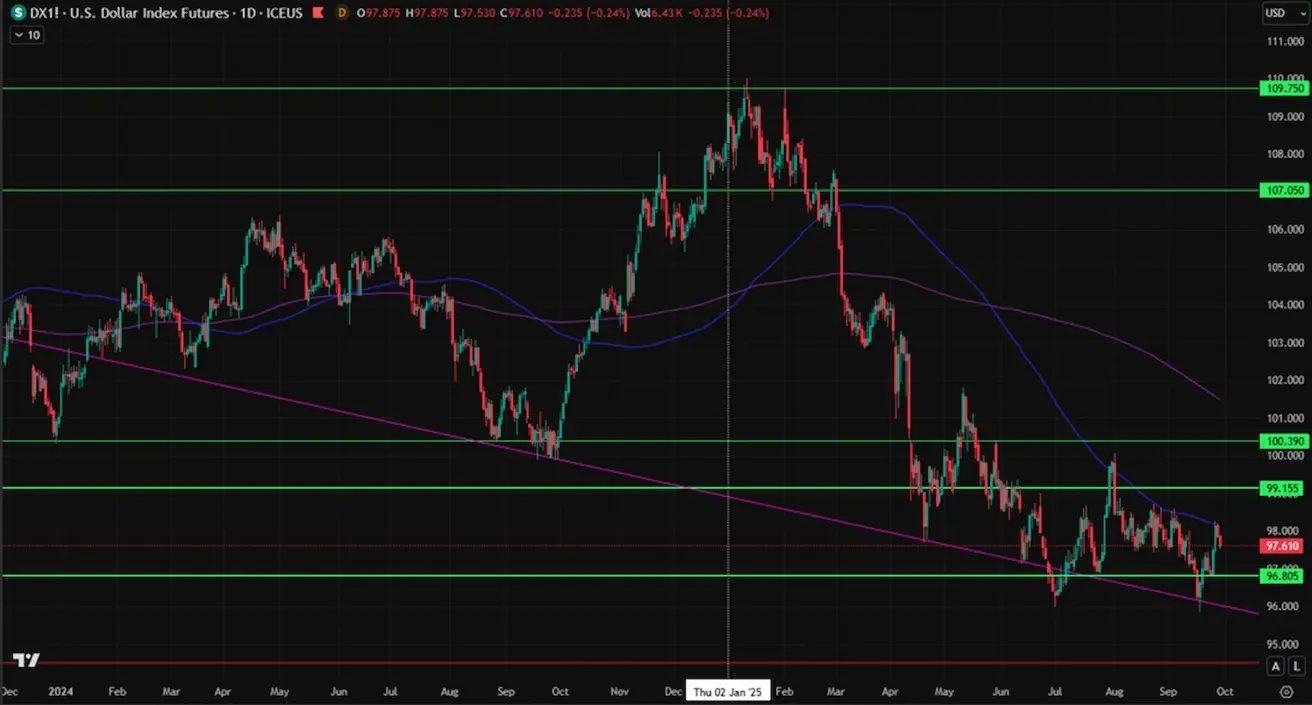
DOLERIO INDEKSO ATEITIES SANDORIAI (DX)
JAV dolerio indekso ateities sandoriai (DX) savaitę baigė pakilę 0.55%, užsidarydami ties 97.845. Nuo metų pradžios indeksas yra smukęs –9.68%.
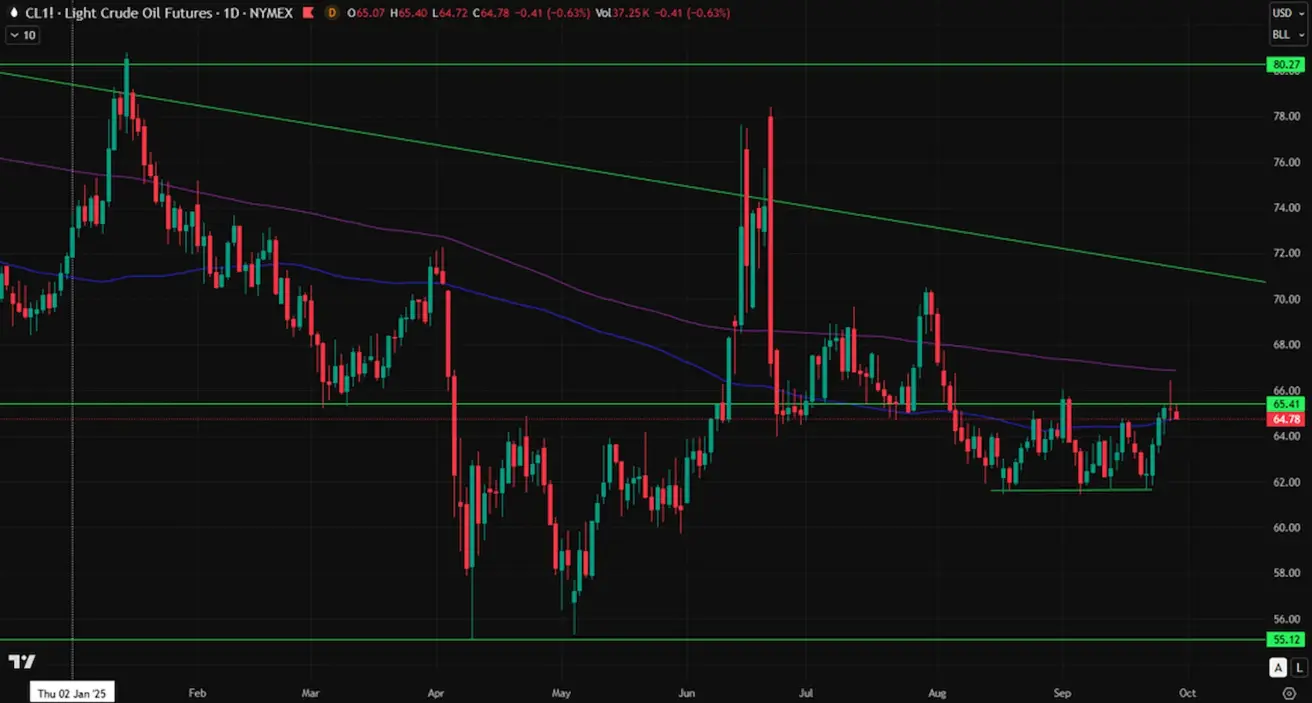
NAFTOS ATEITIES SANDORIAI
Žaliavinės naftos ateities sandorių (CL) kontraktas savaitę baigė pakilęs 4.54%, užsidarydamas ties $65.19 už barelį. Nuo metų pradžios jo vertė yra smukusi –9.27%.
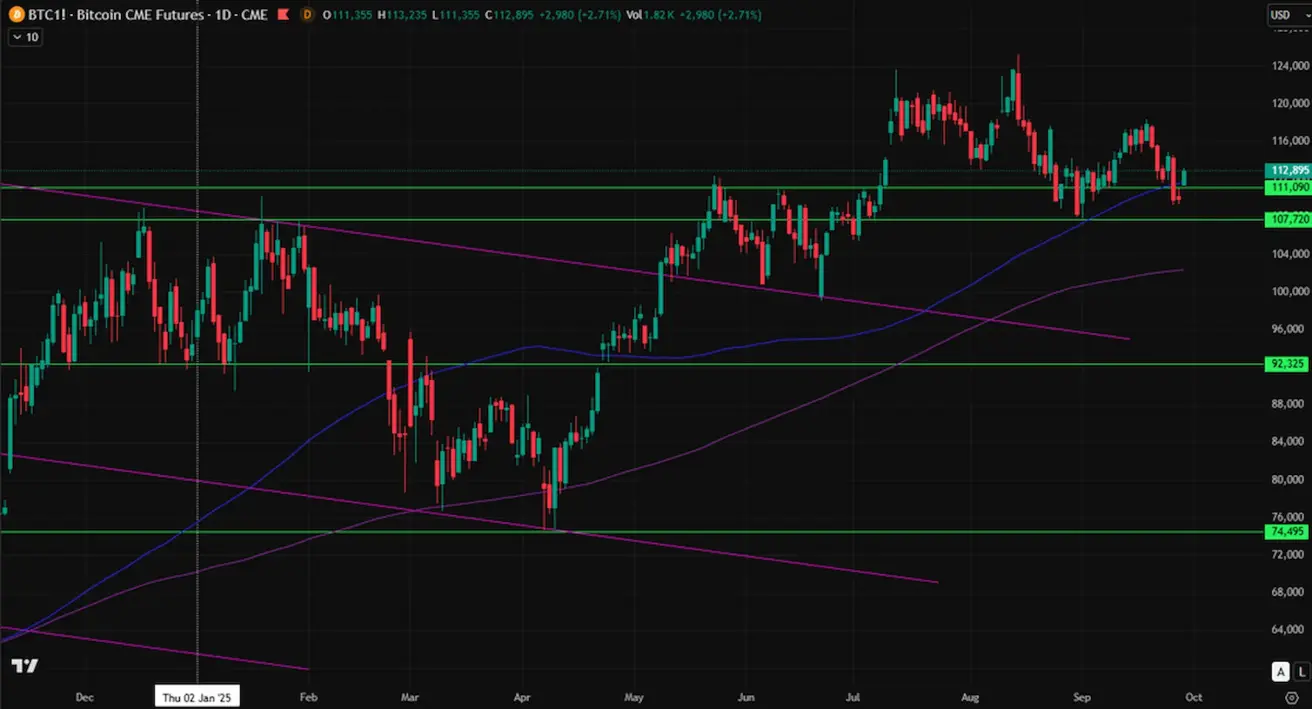
BTC ATEITIES SANDORIAI
Bitcoin savaitę baigė smukęs 4.79%, užsidarydamas ties $109,915. Nuo metų pradžios jo vertė išaugo +15.37%.
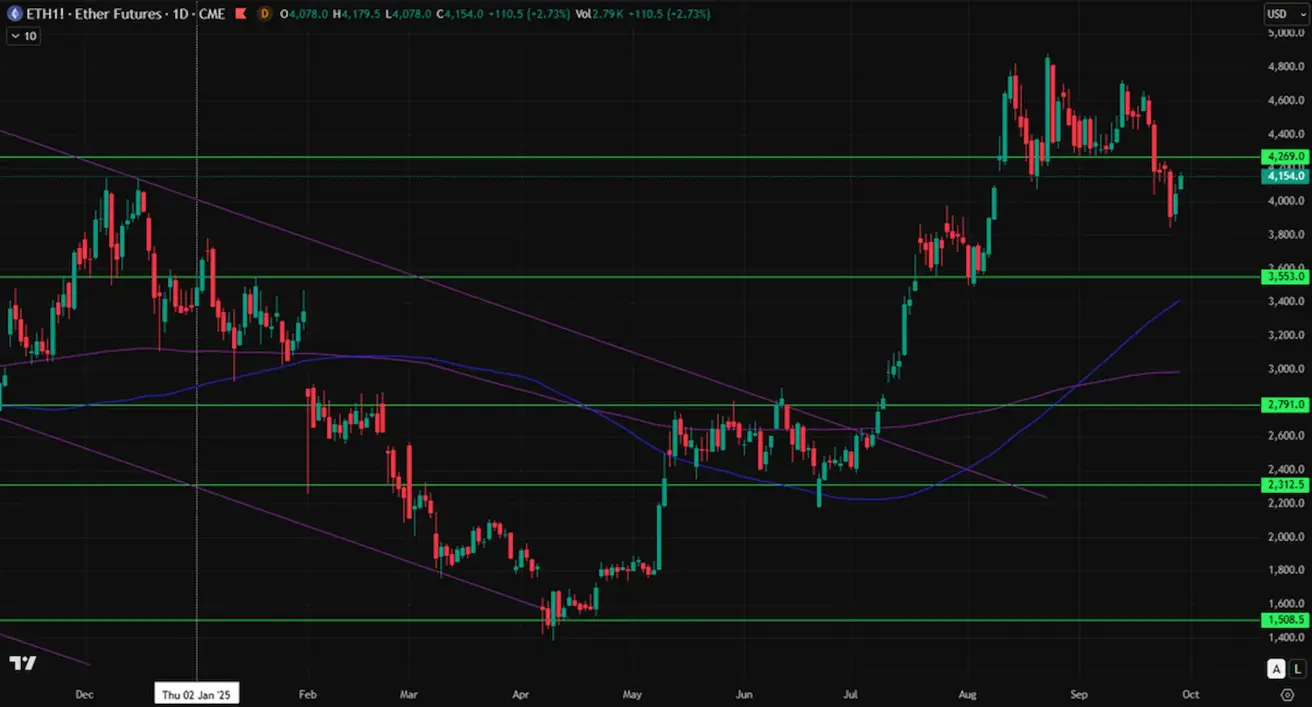
ETH ATEITIES SANDORIAI
Ethereum savaitę baigė smukęs 9.40%, užsidarydamas ties $4,043.50. Nuo metų pradžios jo vertė išaugo +19.49%
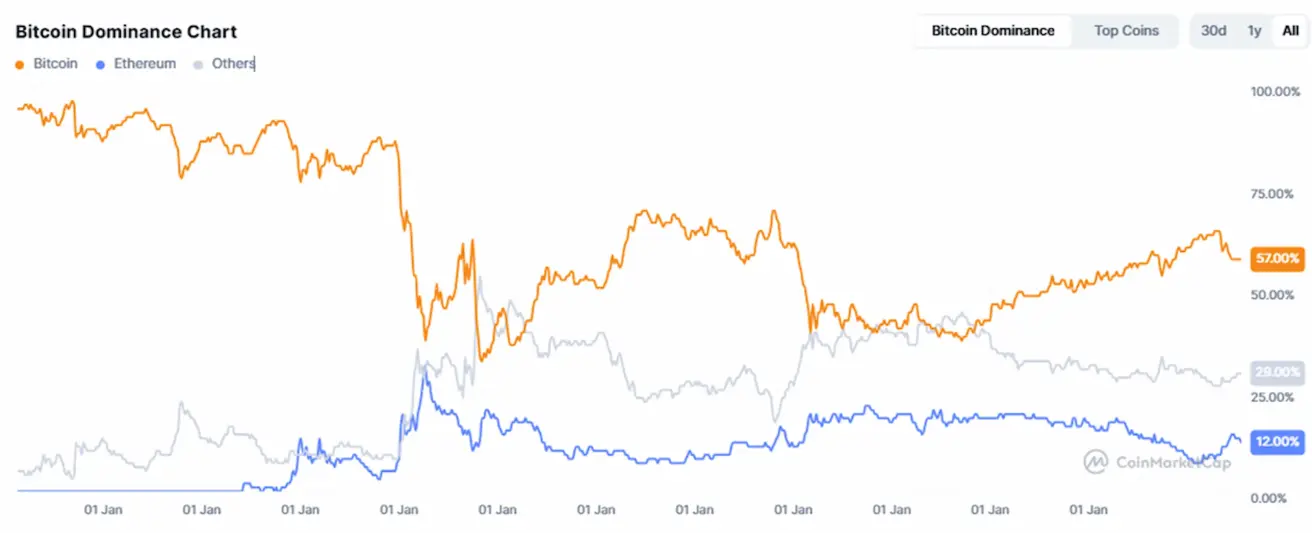
Bendra kriptovaliutų rinkos kapitalizacija siekia $3.86 trln. (palyginti su $3.89 trln. prieš savaitę) (šaltinis: CoinMarketCap).
- Bitcoin dalis — 57.8% (palyginti su 57.7%),
- Ethereum dalis — 12.9% (palyginti su 13.0%),
- Kiti aktyvai sudaro 29.3% (palyginti su 29.2%).
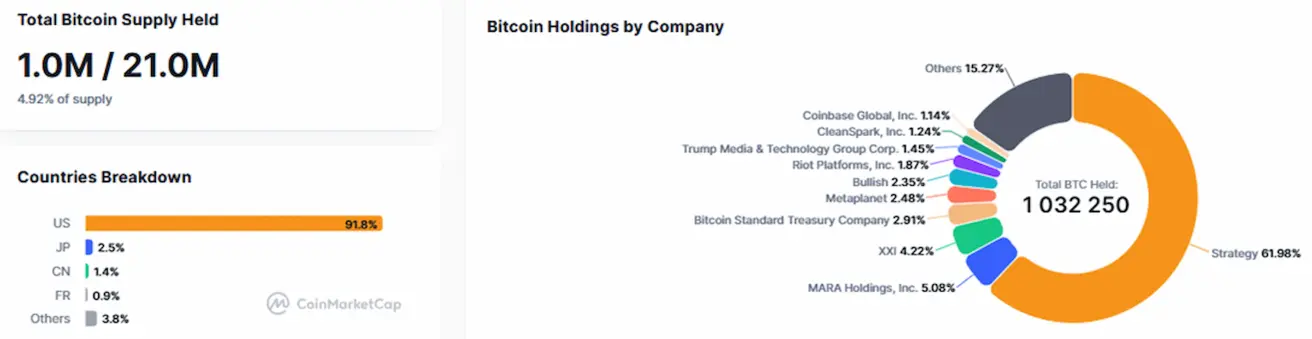
Viešosios bendrovės, taikančios Bitcoin rezervų strategiją, laiko 4.92% bendro Bitcoin pasiūlos (palyginti su 4.85% prieš savaitę) — ši dalis išliko nepakitusi nuo ankstesnės savaitės lygio.
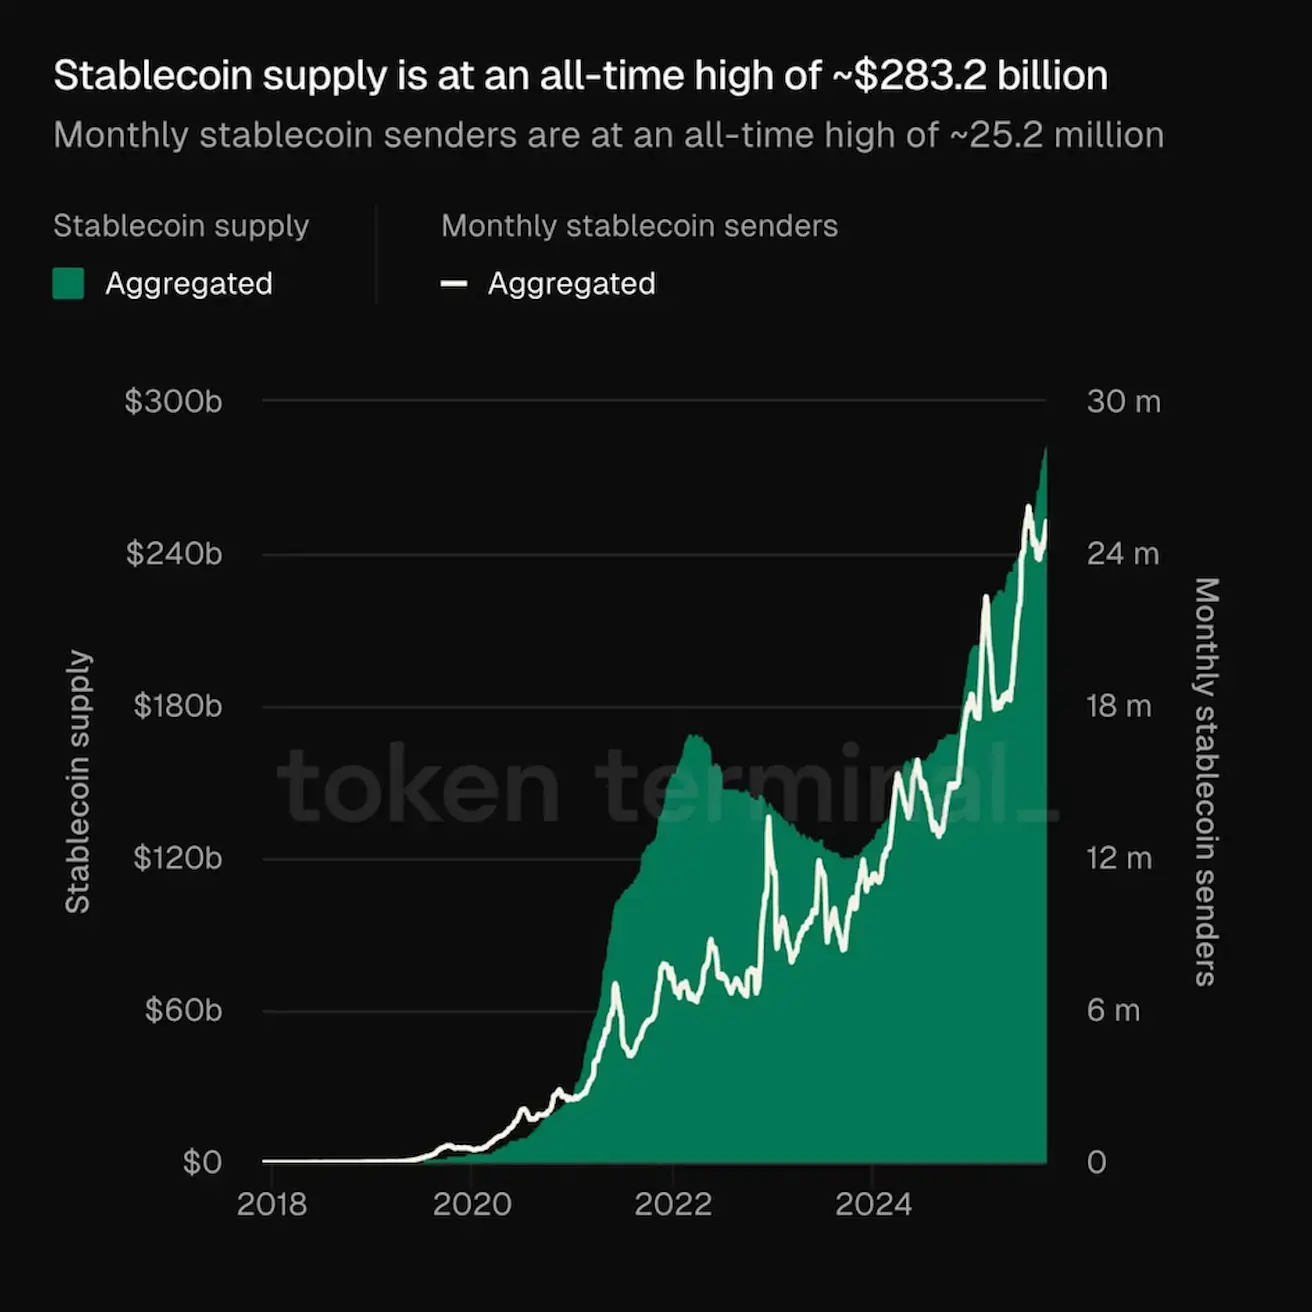
- Stablecoinų pasiūla pasiekė rekordinį, maždaug $283.2 mlrd., lygį.
- Mėnesinių stablecoin siuntėjų skaičius taip pat pasiekė rekordą — apie 25.2 mln.