 Lietuvių
 Русский
 Қазақша
 Eesti
EestiCrypto Market: From Shock to Stabilization
Raison Analytical Report on 2025 Results and 2026 Outlook

Raison’s research team conducted a detailed review of the recent cryptocurrency drawdown and prepared a report outlining the key drivers of the sell-off, why the decline became prolonged, and which factors are likely to shape market dynamics in 2026.
On October 10, global financial markets shifted decisively into risk-off mode, triggering a broad-based sell-off across asset classes. The move was prompted by Donald Trump's statements about the potential for a substantial increase in tariffs on Chinese imports, as well as his refusal to engage in talks with President Xi Jinping.
Additional pressure stemmed from mounting uncertainty surrounding a possible U.S. government shutdown, further exacerbating investor caution and reinforcing defensive positioning across markets.
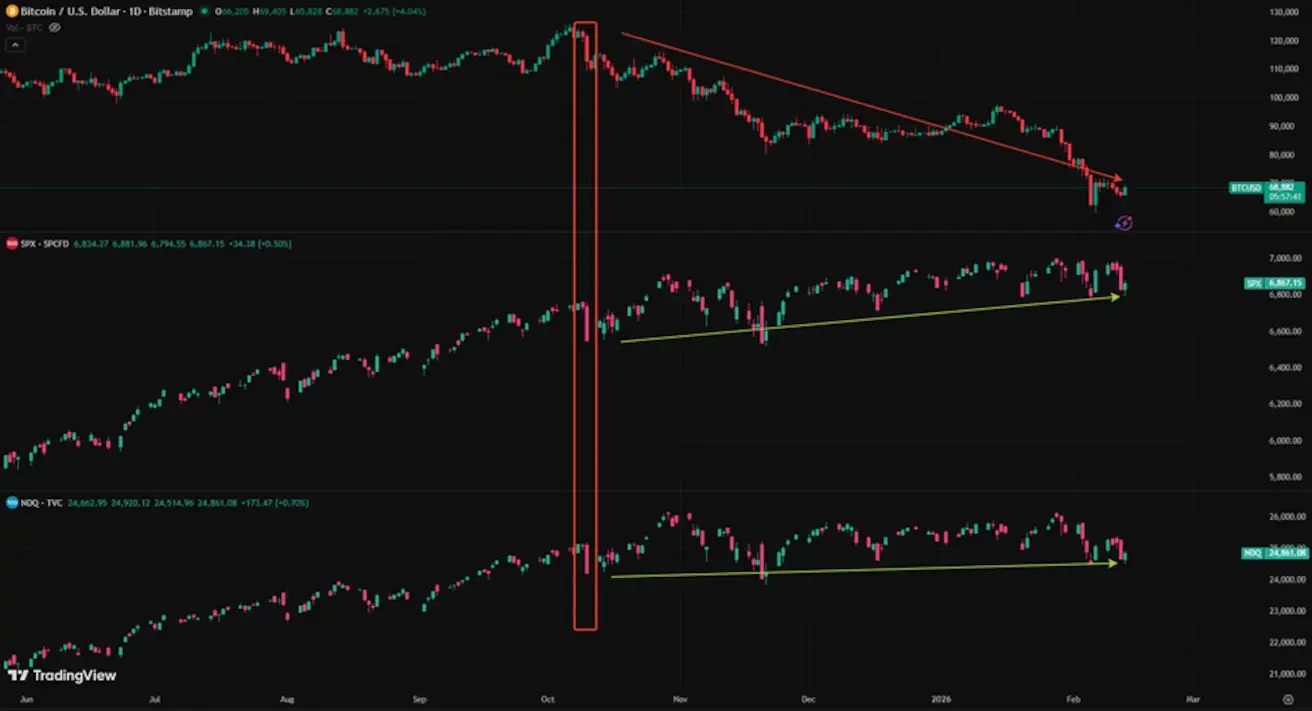
On that day, volatility spiked sharply across digital assets (BTC: –7.42%, ETH: –12.50%) and equity markets (S&P 500: –2.83%, Nasdaq: –3.5%, VIX: +32.60%). A number of Big Tech names also posted significant declines.
This dynamic is a critical signal: the trigger was not crypto-specific, but rather a global geo-economic shock transmitted across asset classes.
The natural question that followed was why equity indices began to rebound relatively quickly, while crypto assets continued to decline.
Shortly after the initial negative market reaction, Trump signaled readiness to meet with Xi Jinping, reducing the perceived probability of further escalation. As geopolitical risk premia eased, the VIX retraced part of its spike.
Public equity markets are structurally deeper and more resilient. They are dominated by large institutional allocators — pension funds, insurance companies, and asset managers — while corporate share buyback programs and persistent inflows into passive funds and ETFs provide continuous structural demand. In other words, the equity market benefits from embedded support mechanisms that help stabilize prices during periods of stress.
Accordingly, once the macro backdrop showed signs of stabilization, institutional capital rotated back into traditional asset classes first. Crypto, by contrast, remained under pressure, as it continues to be perceived as a high-volatility, high-beta segment within the broader risk spectrum.
Crypto Market Analysis (with BTC as the Benchmark)
On October 10, long liquidations in Bitcoin (hereafter, BTC) reached historically extreme levels:
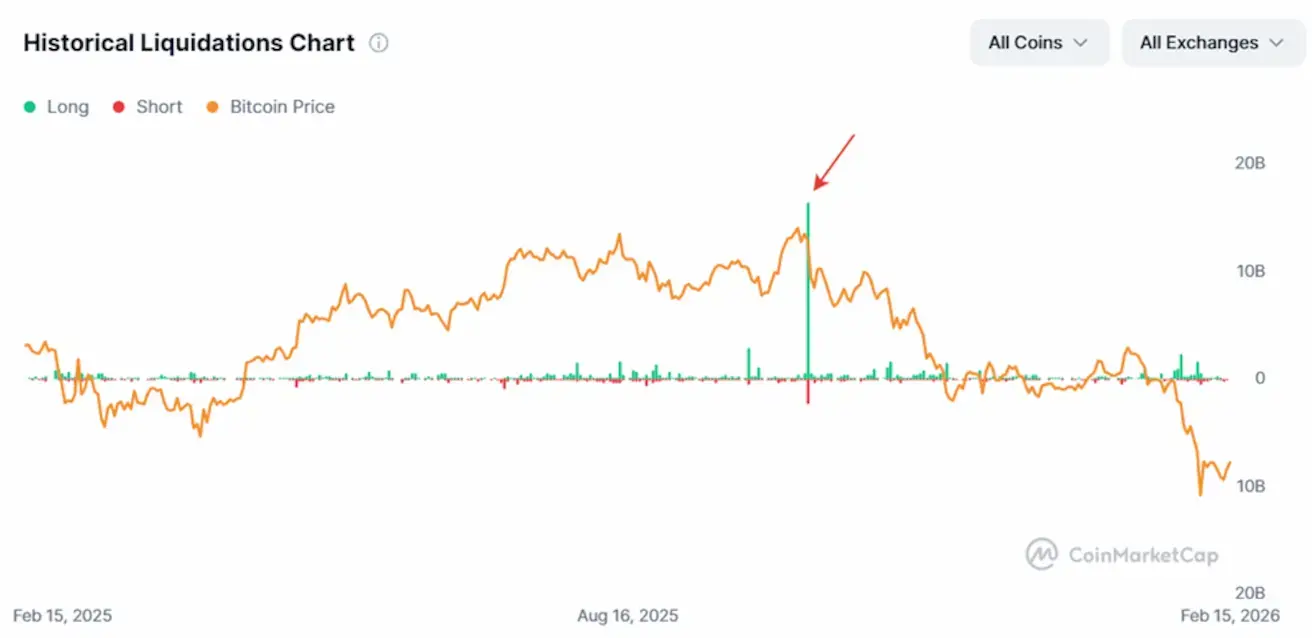
Following the volatility spike, prime brokers tightened margin requirements (initial margin — the minimum capital required to open a position), while risk models (VaR — Value at Risk) were recalibrated to more conservative assumptions. As a result, funds were compelled to reduce gross leverage, even where underlying strategies remained fundamentally profitable.
In such environments, risk management operates mechanically: positions are scaled down, algorithms are triggered, and market liquidity contracts. This pattern is characteristic of all financial markets during periods of stress.
However, in this instance, the crypto market failed to attract incremental offsetting demand. At the same time, positioning was significantly more crowded on the leveraged long side than in traditional asset classes, amplifying the drawdown.
The process unfolded in two distinct phases:
-
Phase One — Liquidation Shock: forced unwinding of leveraged positions.
-
Phase Two — Deleveraging Cycle: gradual reduction of leverage, compression of arbitrage strategies, and systematic reassessment of risk parameters.
All of this occurred against the backdrop of absent fresh capital inflows, which extended the downward momentum. An additional accelerant was the compression of the futures basis, which led to the unwinding of cash-and-carry arbitrage strategies and increased spot-market supply.
The core mechanics of the strategy involve purchasing the underlying spot asset while simultaneously selling futures contracts. The primary return is derived from the futures premium (the spread between futures and spot prices) under contango conditions. Contango refers to a market structure in which futures prices trade above the prevailing spot price.
The effective breakeven threshold of the strategy approximates the risk-free rate (SOFR), adjusted for financing costs and margin requirements.
SOFR (Secured Overnight Financing Rate) is the benchmark short-term U.S. dollar rate reflecting the cost of borrowing collateralized by U.S. Treasuries.
In 2024–2025, the annualized futures basis averaged approximately 20–25%, while SOFR remained near 5%. On a simplified basis — abstracting from transaction costs and funding frictions — the annualized return of the cash-and-carry strategy stood at roughly 13.5% as of October 10.
At present, that return has compressed to approximately 5%, effectively converging toward the risk-free rate and materially reducing the strategy’s relative attractiveness.
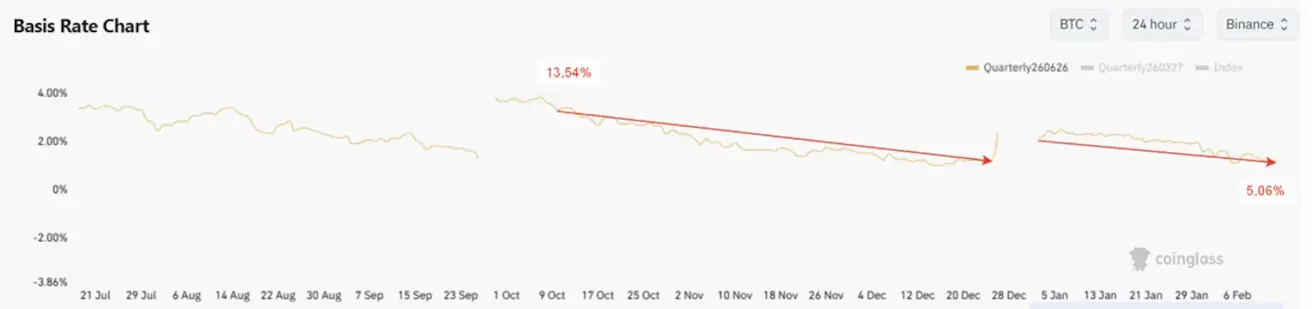
What Drove This Compression?
The spike in volatility and the tightening of margin requirements further impaired the economics of arbitrage strategies. At the same time, demand for leveraged long exposure declined, compressing the futures basis. As the premium narrowed, market participants progressively unwound positions — selling spot and covering short futures. This process was accompanied by a decline in open interest and a broad-based reduction in aggregate market leverage.
Against the backdrop of a persistent risk-off environment and increasing BTC inflows to exchanges — typically a precursor to spot selling — supply remained elevated, reinforcing downward price pressure.
BTC Derivatives Open Interest:
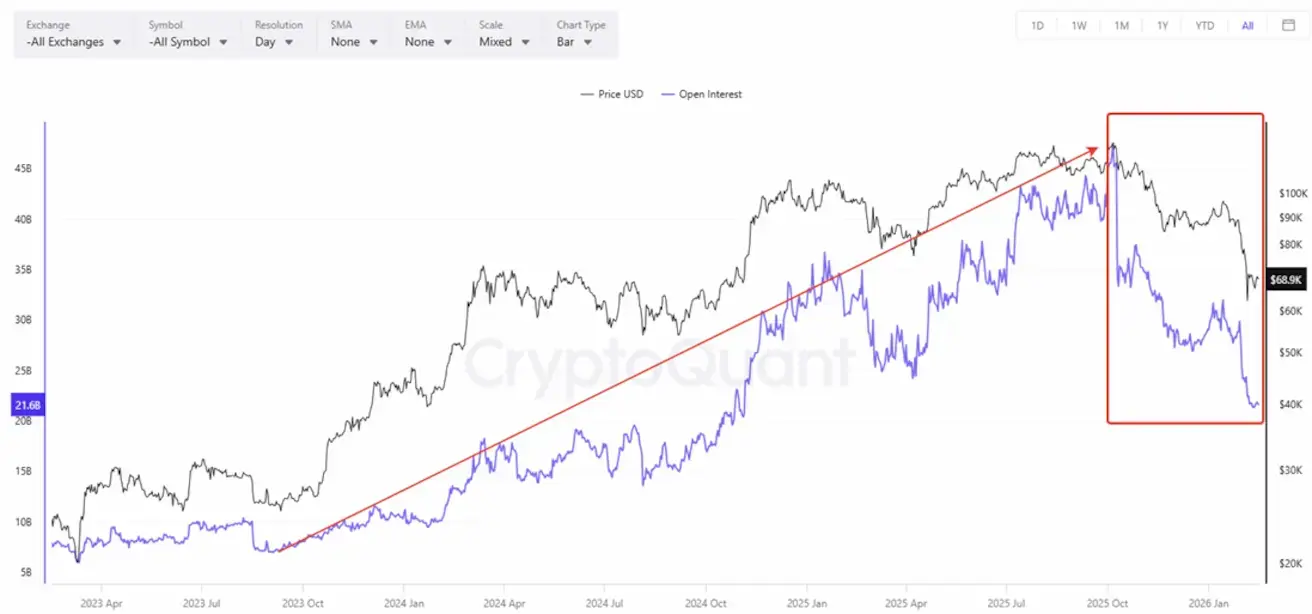
Open interest reflects the total notional value of outstanding futures contracts and serves as a proxy for aggregate market leverage.
From 2023 through mid-2025, Bitcoin derivatives open interest (OI) expanded steadily, peaking at approximately $45 billion — indicative of substantial growth in both speculative and arbitrage positioning. Following October 10, 2025, OI contracted sharply, declining from roughly $45 billion to approximately $22 billion. In effect, the market reverted to levels last observed in November 2024, signaling a large-scale reduction in outstanding positions.
Within the cash-and-carry framework, unwinding arbitrage involves selling spot (including ETF exposure) while repurchasing previously shorted futures to close those positions. The observed decline in OI confirms a contraction in futures exposure and a broader deleveraging cycle.
Importantly, under this configuration, the futures market is not exhibiting renewed position build-up or incremental leveraged demand that could offset spot-driven selling pressure. As a result, the withdrawal of arbitrage capital amplified the existing supply imbalance and reinforced the prevailing downside momentum.
Buyer-to-Seller Ratios Below 1 — Aggressive Selling Dominates:
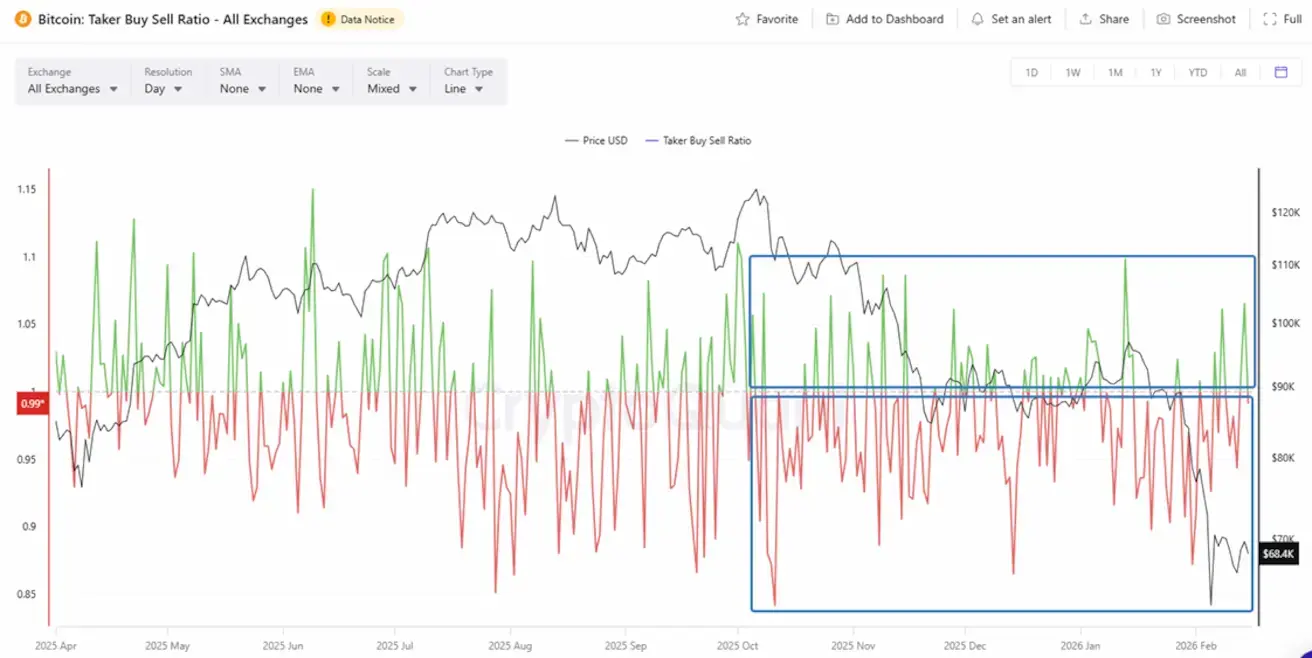
The Taker Buy/Sell Ratio remained predominantly below 1 in the period following October 10, signaling sustained dominance of aggressive market sell orders.
The price decline unfolded amid persistent spot-driven selling pressure, underscoring a structural supply imbalance rather than a purely technical unwind in derivatives markets.
Net ETF Flows:
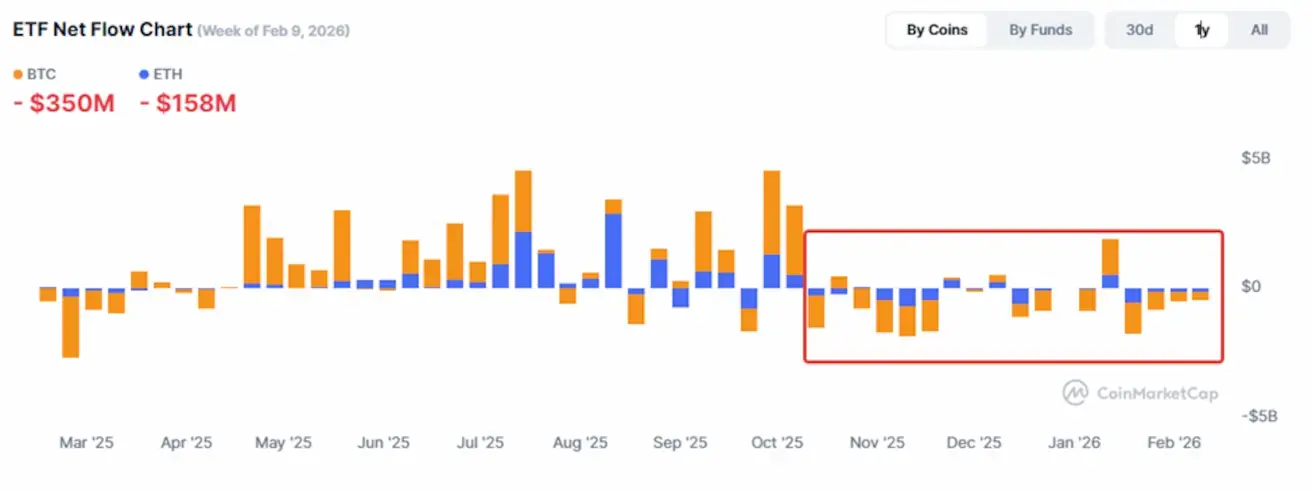
Following October 10, spot Bitcoin ETFs recorded persistent net outflows (Net Flow < 0), indicating that investors were redeeming capital from these vehicles.
ETF outflows imply a reduction in the funds’ underlying Bitcoin holdings, thereby increasing effective spot supply and adding incremental downside pressure to prices.
Funding Rate:
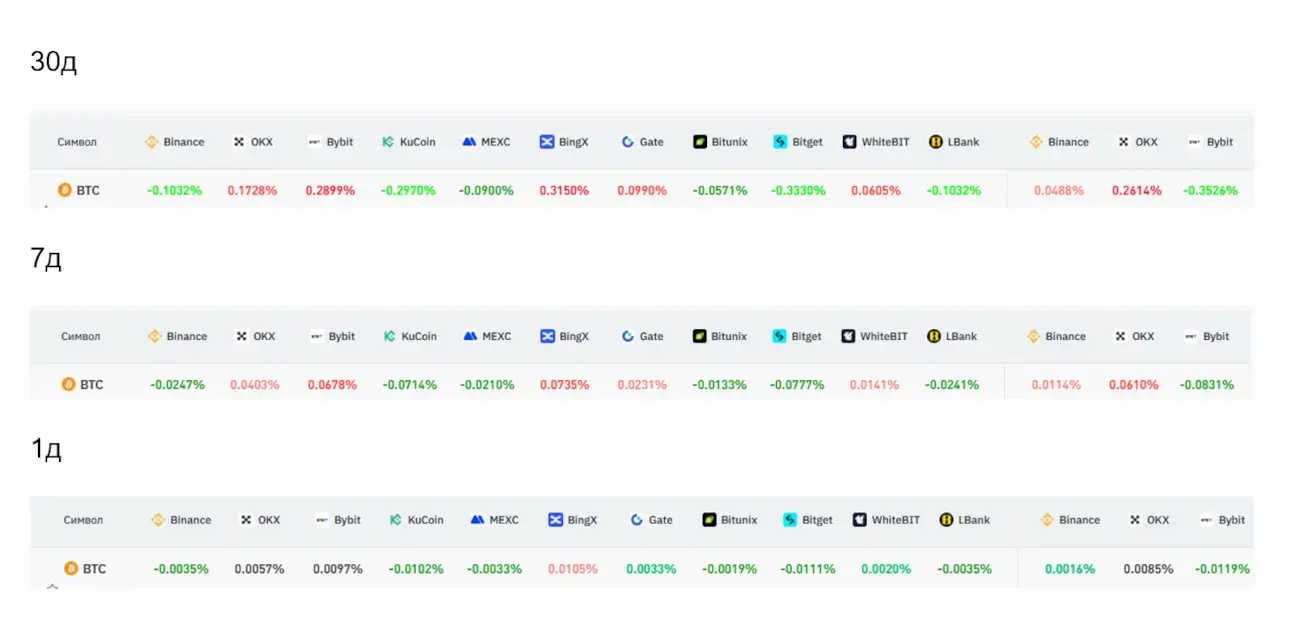
When the funding rate turns negative, short position holders (those positioned for downside) pay longs. This reflects a market skewed toward selling pressure and expectations of further price declines.
Conversely, a positive funding rate implies that long positions are paying shorts, signaling dominant buying interest and more constructive market sentiment.
As the observation window shortened (30 days → 7 days → 1 day), the average negative funding gradually moderated. At present, the rate has turned positive, indicating a reduction in short-side pressure and a gradual normalization of positioning dynamics.
On-Chain Metric: MVRV — Indicator of Spot Holder Conditions (Unrealized P&L)
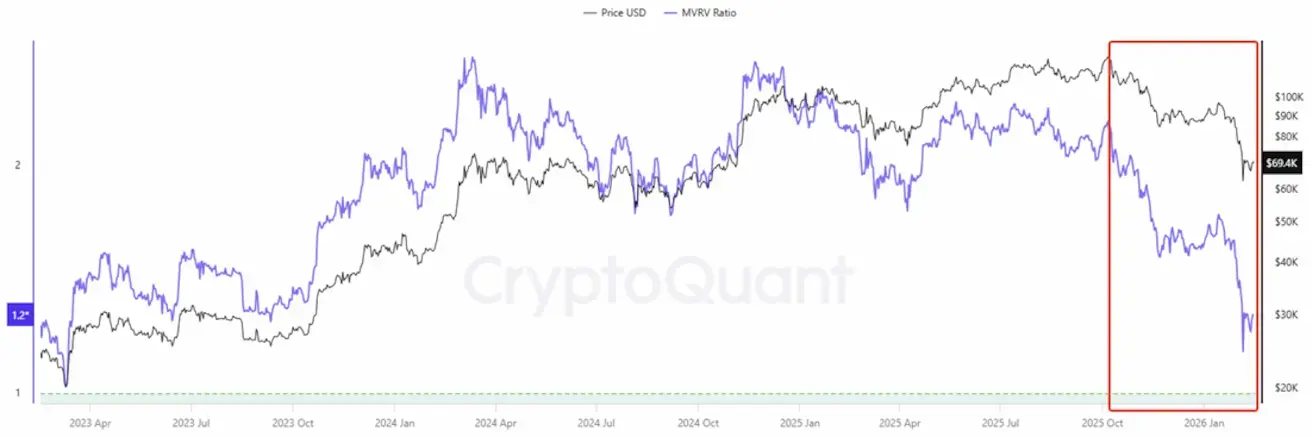
The on-chain MVRV metric compares Bitcoin’s current market capitalization to its “realized capitalization,” which reflects the aggregate value of coins at the price at which they last moved on-chain. This framework provides a proxy for assessing whether holders, on average, are in profit or at a loss.
- MVRV > 1 → holders are, on average, in profit;
- MVRV ≈ 1 → the market is trading near the aggregate cost basis;
- MVRV < 1 → the majority of holders are underwater.
At present, MVRV stands at approximately 1.27, implying that the average investor retains an estimated 27% in unrealized gains.
At cycle peaks, the metric reached 2.5–3.0, levels historically associated with overheated market conditions and elevated profit-taking risk.
The recent compression in MVRV suggests that a substantial portion of unrealized gains has already been absorbed through price corrections, materially reducing incremental selling pressure from profit-taking.
Historically, the 1.0–1.3 range has often coincided with:
- the early phase of accumulation;
- the late stage of a deleveraging cycle; or
- a transition into a consolidation regime.
Importantly, the market is not in a zone of systemic stress for long-term holders (typically characterized by MVRV < 1).
This indicates that the recent pressure has been driven primarily by leverage reduction rather than by broad-based capitulation of the long-term spot holder base.
DVOL Volatility Spikes:
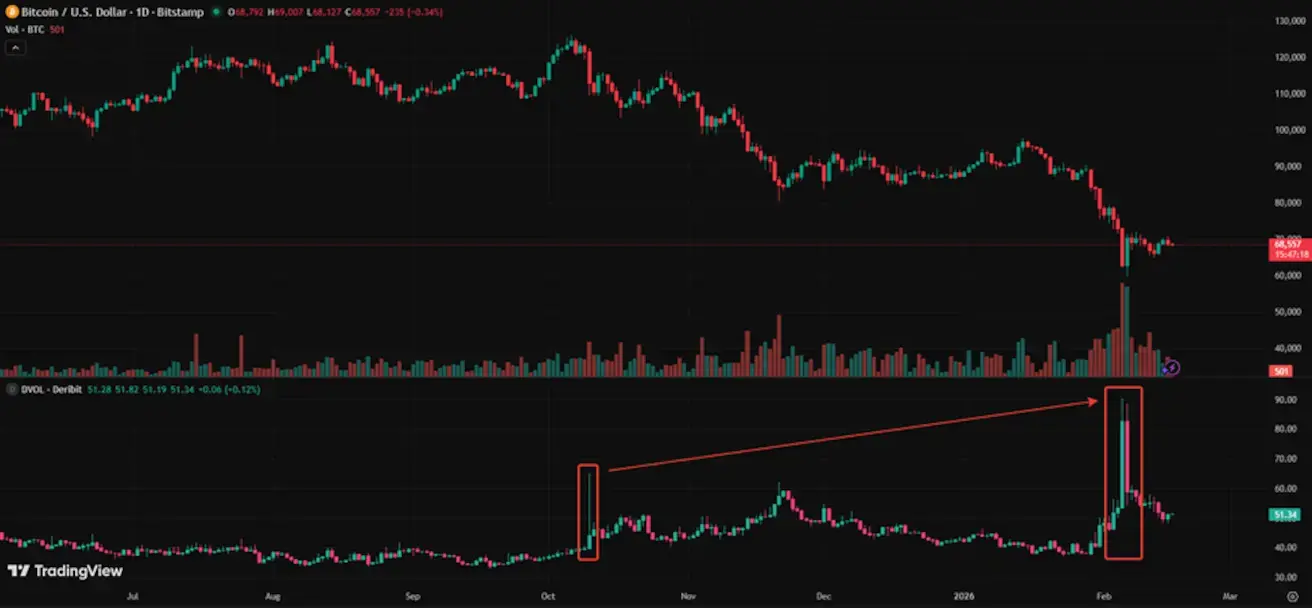
Two pronounced volatility spikes can be identified:
- First — October 10: the initial liquidation shock;
- Second — Early February: a subsequent phase of intensified pressure.
During the February 2–6 episode (right-hand rectangle), exchanges recorded one of the largest BTC inflows of the past ten months. Price action declined amid these inflows, pointing to an active supply surge, likely driven by short-term holders.
Relative to October 10, early February was characterized by materially higher volatility and trading volumes. However, despite the scale of selling, the market did not produce a meaningful breakdown to new lows — indicating that a substantial portion of the incremental supply was absorbed by countervailing demand.
In the days that followed, volumes remained elevated, yet the magnitude of price declines moderated. Candlestick ranges narrowed, and the key local low held. This pattern suggests a waning of seller dominance. The price structure resembles a capitulation event, which has historically often coincided with local or intermediate-term bottoms.
Where the Market Stands Now:
- The market appears to be in a rebalancing phase following a deep correction, rather than in an accelerating downside impulse.
- A significant portion of overheated long exposure, arbitrage leverage, and speculative capital has already been unwound.
- Funding rates have normalized, with no evidence of extreme short-side positioning.
- Spot-driven selling pressure has materially subsided.
These factors do not, in themselves, guarantee a trend reversal. However, in the current configuration, there are no clear signs of an imminent cascading decline. A transition toward a sustained uptrend would likely require new fundamental or macroeconomic catalysts.
The accompanying chart is based on the results of FTI Consulting’s annual/semi-annual Advisor Survey. It presents data points reflecting the distribution of advisory firms — highlighting the percentage that already allocate to crypto, as well as the stated intentions of those that have not yet initiated allocations.
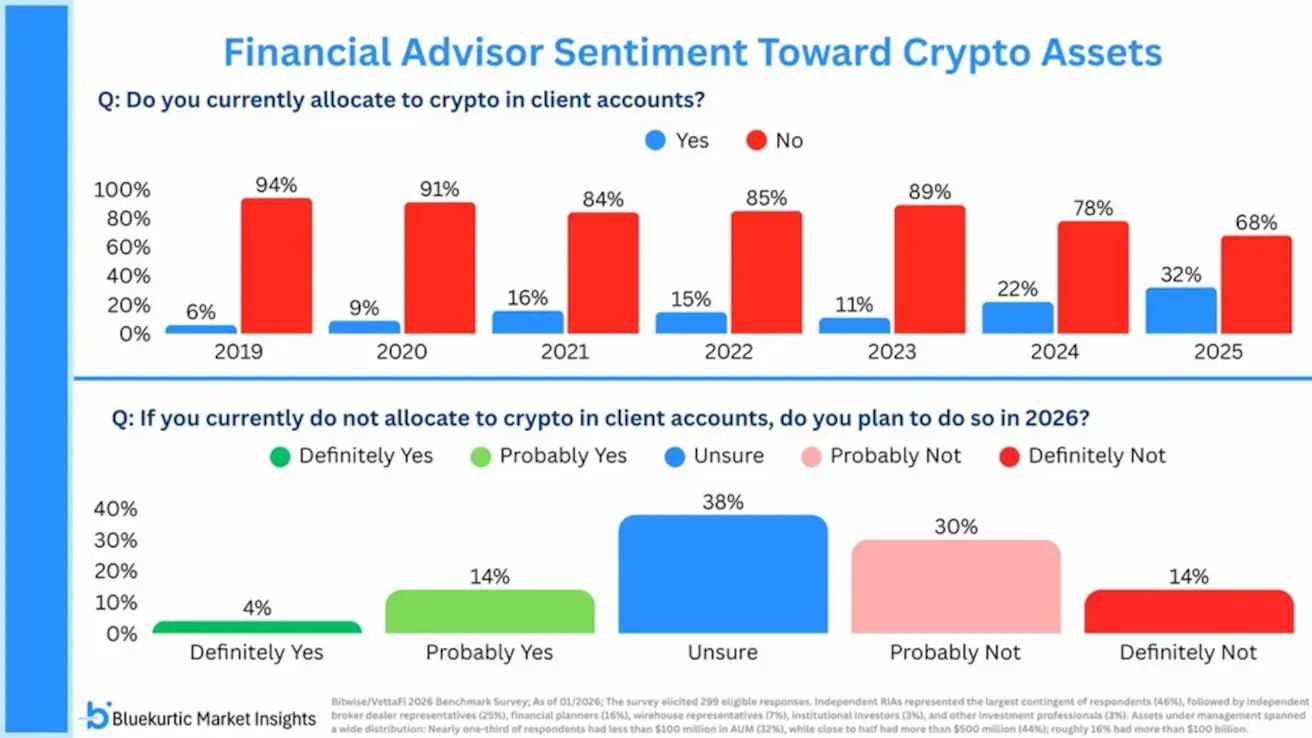
In 2025, the share of portfolio managers who have incorporated crypto assets into client accounts increased to approximately 32%, up from just 6% in 2019, with adoption accelerating notably in 2024–2025.
At the same time, the proportion of financial advisors who explicitly state they do not intend to allocate to crypto has declined to roughly 14%—significantly below the levels observed between 2019 and 2023.
This trend reflects the gradual institutionalization of digital assets as a structural component of diversified portfolios.
However, as the report highlights, regulatory uncertainty remains the principal gating factor for the next phase of adoption. Many advisors directly link their willingness to allocate to the establishment of a clear regulatory framework, including legislation such as the CLARITY Act.
The Digital Asset Market Clarity Act (H.R. 3633) is a landmark U.S. bill that establishes, for the first time, a unified and transparent legal framework for digital assets. It seeks to delineate regulatory jurisdiction between the SEC and the CFTC and to reduce the uncertainty that has historically constrained institutional capital formation in the sector.
Regulatory clarity is widely viewed as a prerequisite for the next wave of institutional inflows.
The bill has already passed the House of Representatives (294–134) but has yet to be approved by the Senate, with debate anticipated in March 2026. As such, the upcoming vote is increasingly regarded as a potential catalyst for renewed institutional engagement.
Core Provisions and Objectives
1. Clear Asset Classification
The bill establishes three distinct legal categories:
- Digital commodities;
- Investment contracts/securities;
- Stablecoins as payment instruments.
This framework eliminates the ambiguity currently resolved through case law and enforcement actions.
2. Delineation of Regulatory Authority
The CLARITY Act explicitly allocates oversight between the two primary U.S. regulators:
- The CFTC assumes jurisdiction over digital commodities (e.g., BTC, ETH);
- The SEC retains authority over investment contracts and securities.
3. Legal Certainty for the Industry
The legislation introduces:
- Clear qualification criteria for digital asset projects;
- Predictable compliance standards for platforms and intermediaries;
- Reserve transparency and audit requirements for stablecoin issuers.
Collectively, these measures aim to materially reduce legal and regulatory risk for operating businesses and institutional investors.
Why This Matters for the Crypto Market
Legal certainty is a prerequisite for sustained trust and capital formation. Regulatory ambiguity has been one of the principal constraints on institutional crypto allocations in the U.S. The CLARITY Act seeks to establish a transparent rulebook that eliminates the need for market participants to infer which regulatory regime applies to specific digital assets.
Market makers, exchanges, and DeFi protocols would operate within clearly defined supervisory boundaries. Companies would be able to structure products and services with clarity regarding the applicable regulator and compliance requirements — particularly critical for tokenized assets, derivatives, and stablecoins.
The legislative backdrop around the bill remains broadly constructive:
- CFTC Chairman Michael Selig has stated that the bill would establish a “gold standard for cryptocurrency markets in the United States.”
- During a White House meeting with industry leaders, President Trump publicly expressed strong support for digital assets, describing himself as “a big fan of cryptocurrencies” and affirming confidence in their long-term future — implying a high likelihood of signing the bill into law should it pass the Senate.
- The Indiana State Senate Committee is advancing HB1042, a bill that would authorize state pension funds to allocate capital to cryptocurrencies.
Conclusion
The market currently appears largely cleansed of excess speculative exposure and is in a rebalancing phase following a sharp correction. Forward price dynamics are likely to depend more on the pace of new capital inflows than on further cascading liquidations or forced deleveraging.
A potential catalyst for renewed structural demand may emerge from legislative progress that enhances regulatory clarity and strengthens the institutional investment case for the asset class.