English
 Lietuvių
 Русский
 Қазақша
2.–8. veebruar 2026: Nädalne majandusülevaade
Peamised turuuudised

Möödunud nädalal olid aktsiaturud surve all, kuid reedel toimus üsna kindel taastumine.
Inflatsiooniootuste andmed näitasid 12 kuu horisondil positiivset langust 3,5 %-ni. Lühiajalised inflatsiooniootused on langenud juba kuuendat kuud järjest. Viie aasta ootused tõusid 0,1 % võrra 3,4 %-ni.
Atlanta Föderaalreservi „praegune“ SKP hinnang (indikaator GDPNow) osutab endiselt tugevale kasvule 4,2 %. Ettevõtlusaktiivsuse indeksid püsivad laienemistsüklit näitaval tasemel.
Esindajatekoda kiitis heaks riigieelarve rahastamise kokkuleppe ja USA valitsuse töö seiskumise ohu lõpp on tõenäoliselt lähedal.
Ameerika Ühendriigid
- Põhointressimäär muutumatult, retoorika ettevaatlik;
- Rahapoliitika hoiak on mõõdukalt piirav → liikumine neutraalse suunas;
- Föderaalreserv säilitab tasakaalu: toetab turge, kuid hoidub kiirete intressikärbete signaalidest;
- USA makromajanduslikud andmed kinnitavad soft‑landing stsenaariumi: majanduskasv püsib potentsiaalist kõrgemal, inflatsioon aeglustub ja tööturg jahtub ilma majanduslanguse tunnusteta.
Makromajandusstatistika
INFLATSIOON: TARBIJAHINNAINDEKS (DETSEMBER):
- Põhiinflatsioon (Core CPI): (k/k) 0,2 % (eelmine: 0,2 %); (a/a) 2,6 % (eelmine: 2,6 %);
- Üldine CPI: (k/k) 0,3 % (eelmine: 0,3 %); (a/a) 2,7 % (eelmine: 2,7 %).
TOOTJAHINNAINDEKS (NOVEMBER):
- PPI (k/k): 0,5 %, eelmine: 0,2 %;
- Põhi-PPI (k/k): 0,7 %, eelmine: 0,3 %.
INFLATSIOONIOOTUSED (MICHIGAN) (DETSEMBER):
- 12 kuu inflatsiooniootus: 3,5 %, eelmine: 4,0 %.
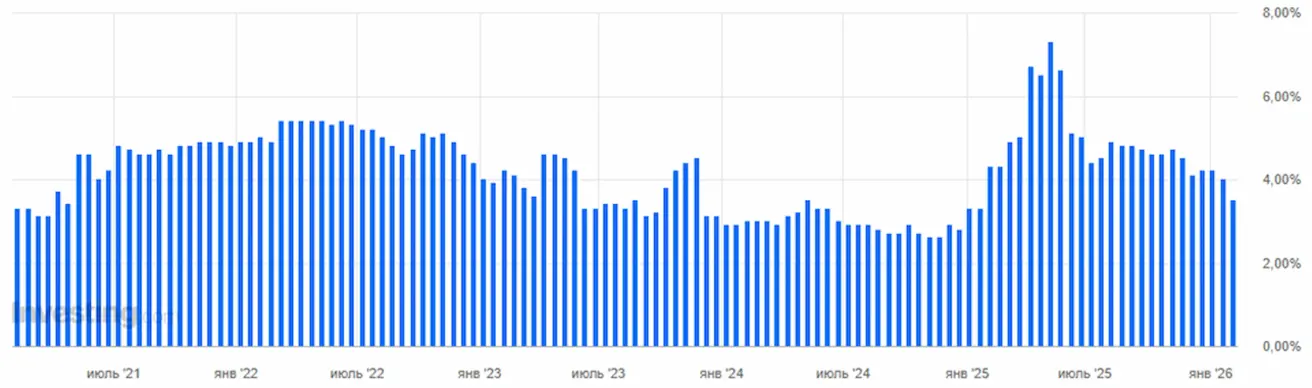
- 5 aasta inflatsiooniootus: 3,4 %, eelmine: 3,3 %.
SKP (USA Majandusanalüüsi Büroo, BEA) (III kv 2025, annualiseeritud, teine hinnang): +4,4 % (II kv 2025: +3,8 %)
Atlanta Föderaalreservi panga GDPNow indikaator (ametliku SKP „praegune“ hinnang enne avaldamist): 4,2 % (eelmine: 4,2 %).
ETTEVÕTLUSAKTIIVSUSE INDEKS (PMI) (DETSEMBER):
(Tase üle 50 viitab laienemisele; alla 50 – kokkutõmbumisele)
- Teenindussektor: 52,7 (eelmine: 52,5);
- Tööstussektor: 52,4 (eelmine: 51,9);
- S&P Global Composite: 53,0 (eelmine: 52,7).
TÖÖTURG (BLS) (Detsember)
- Tööpuuduse määr: 4,4 % (eelmine: 4,6 %);
- USA-s jätkuvate töötuhüvitiste koguarv: 1 844 k (eelmine: 1 819 k);
- Esmased töötuabiraha taotlused: 231 k (eelmine: 209 k, korrigeeritud);
- Palkade arv väljaspool põllumajandust (nonfarm payrolls), muutus: 37 k (eelmine: 64 k);
- Erasektori nonfarm payrolls, muutus: 37 k (eelmine: −69 k);
- Tunnitasu keskmine kasv (a/a): 3,8 % (eelmine: 3,5 %);
- Vabade töökohtade arv (JOLTS): 6,542 mln (eelmine: 6,928 mln).
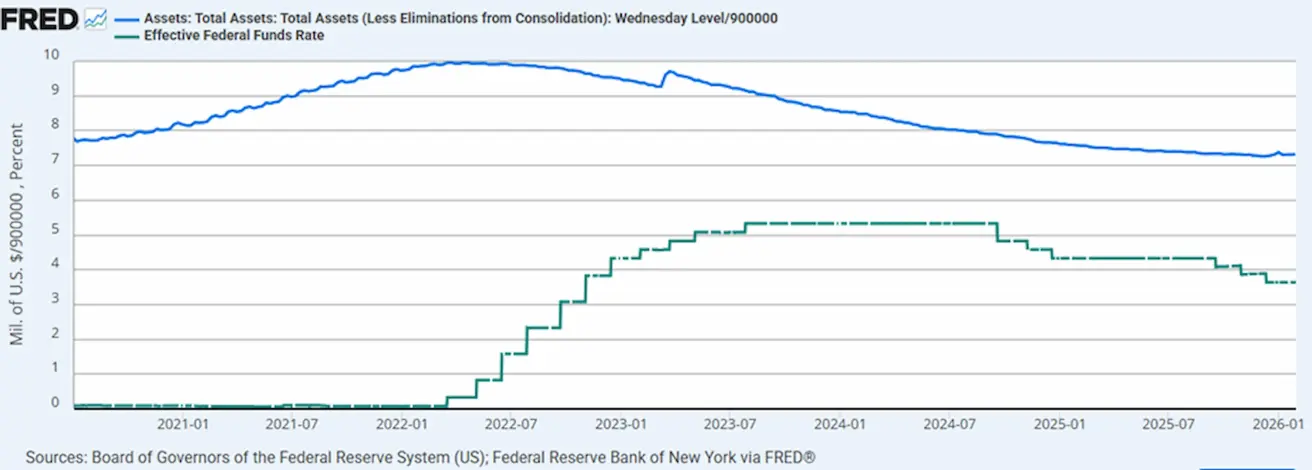
RAHAPOLIITIKA
- Föderaalfondide efektiivne intressimäär (EFFR): 3,50 %–3,75 %;
- Föderaalreservi bilanss: 6,605 triljonit USD, +1,09 % alates QT peatamisest (6,535 triljonit USD).
TURU OOTUSED INTRESSIMÄÄRA KOHTA (FEDWATCH)
Järgmise istungi (18. märts) jaoks on turu hinnanguline tõenäosus 25 baaspunkti suurusele intressikärpele 23,24 % (võrreldes 10,12 %‑ga nädal varem).
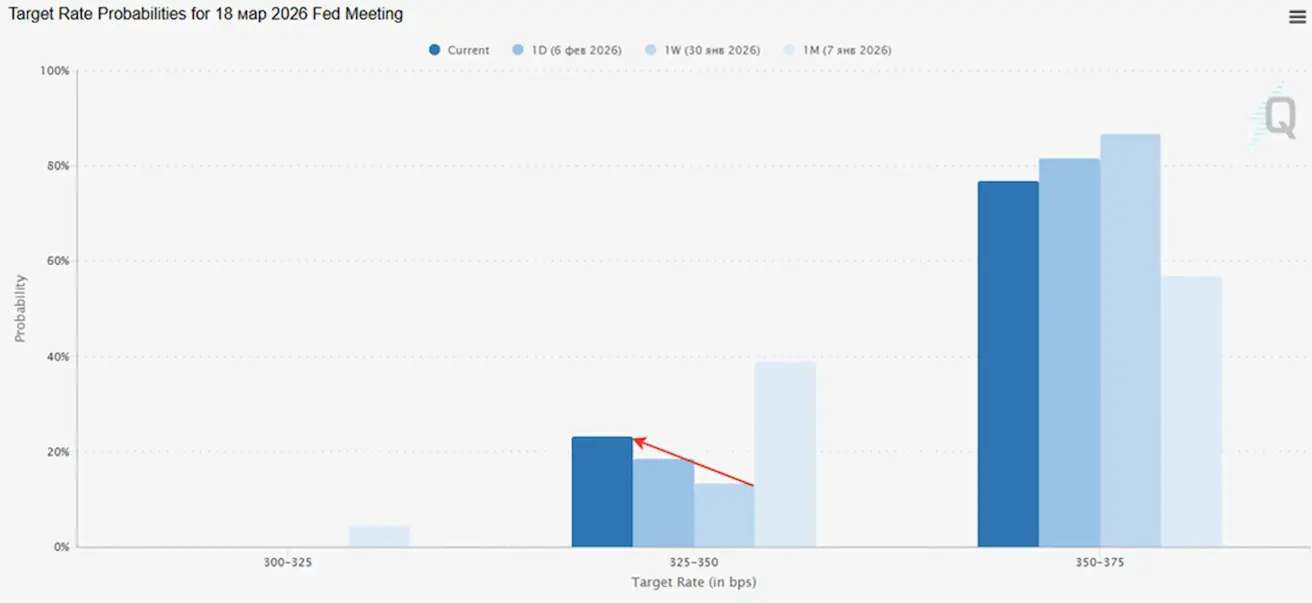
Järgmise 12 kuu jooksul hinnastab turg sisse kaks 25 baaspunkti suurust intressikärbet, tuues baasintressimäära vahemikku 3,00 %–3,25 %. Esimene kärbe on oodatud juunis, pärast kolme istungit.
Täna:
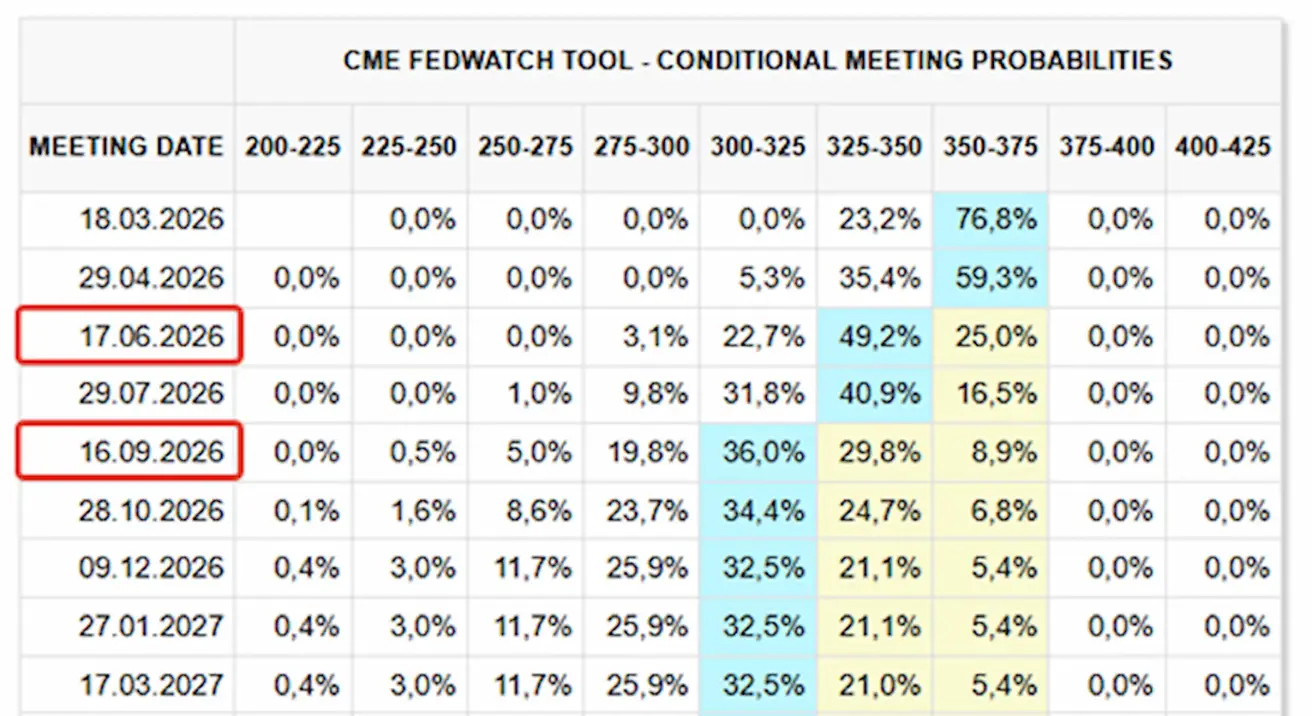
Nädal varem:
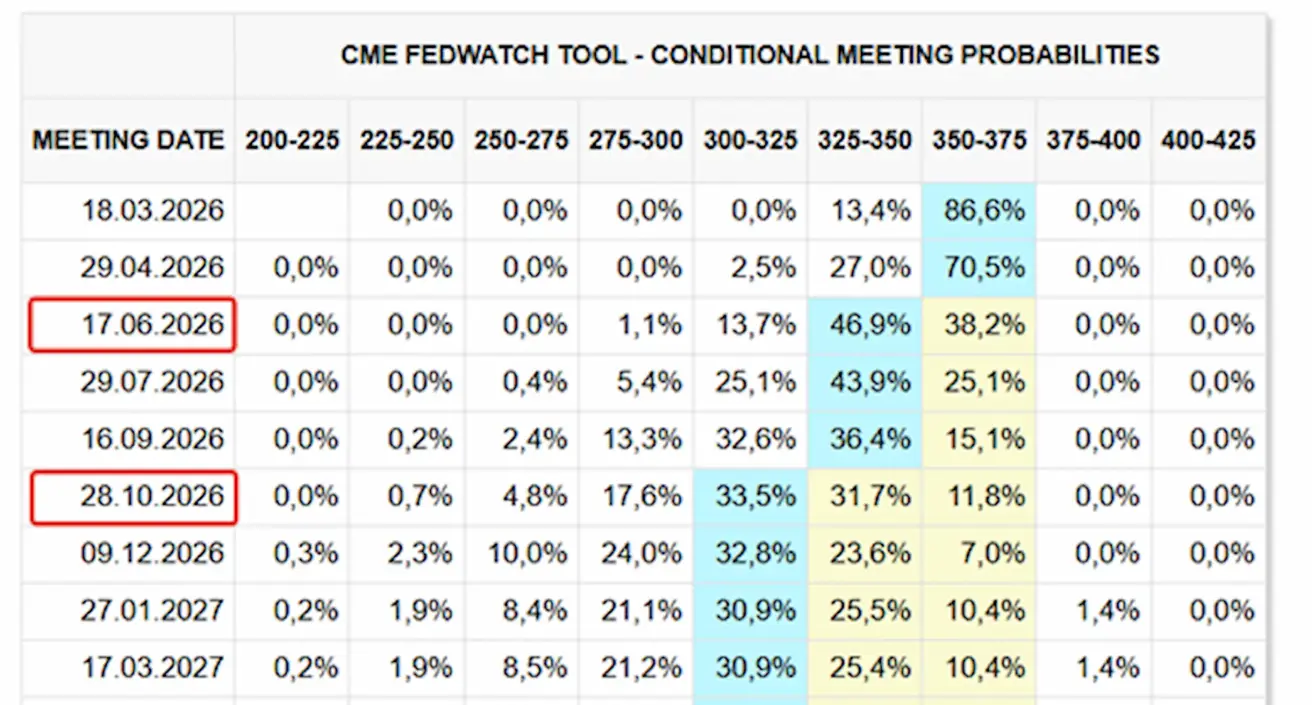
Turg
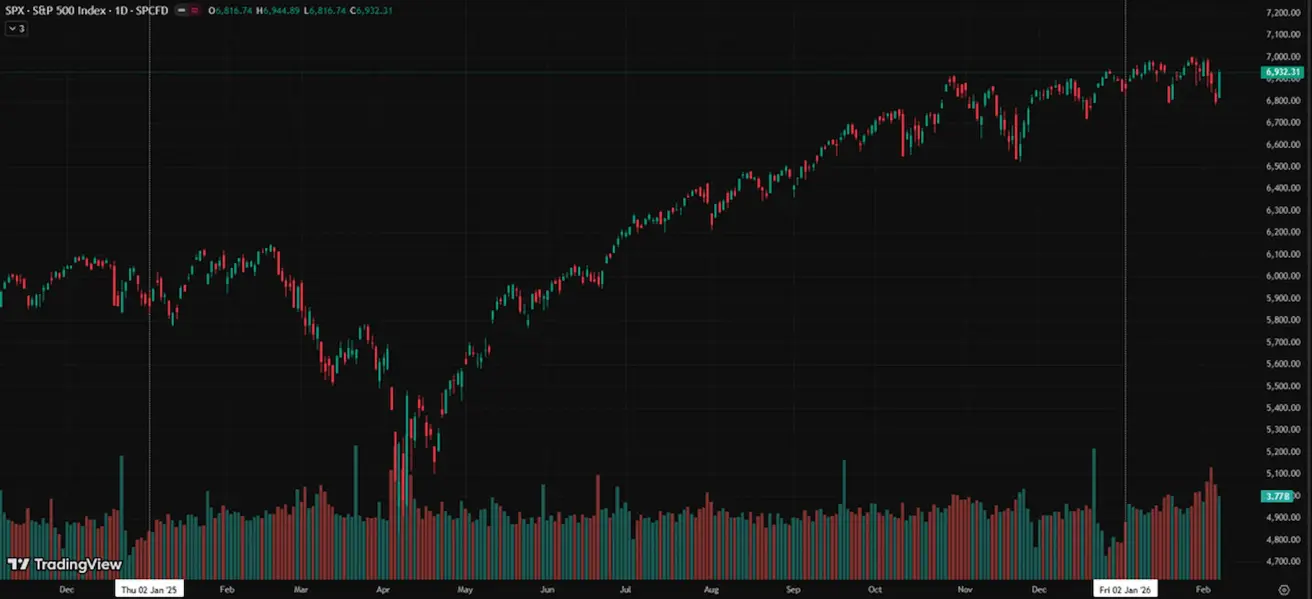
SP500
Nädala tootlus: −0,10 % (nädala lõpu sulgemistase 6 932,31); aasta algusest: +1,27 %.
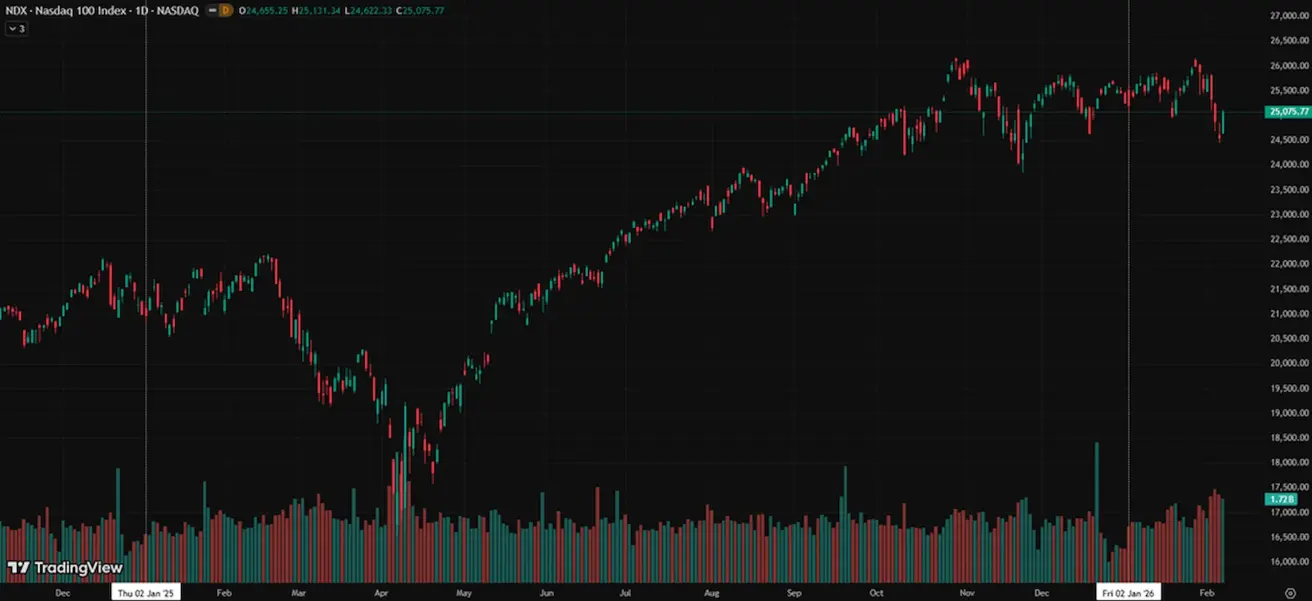
NASDAQ100
Nädala tootlus: −1,87 % (nädala lõpu sulgemistase 25 075,77); aasta algusest: −0,69 %.
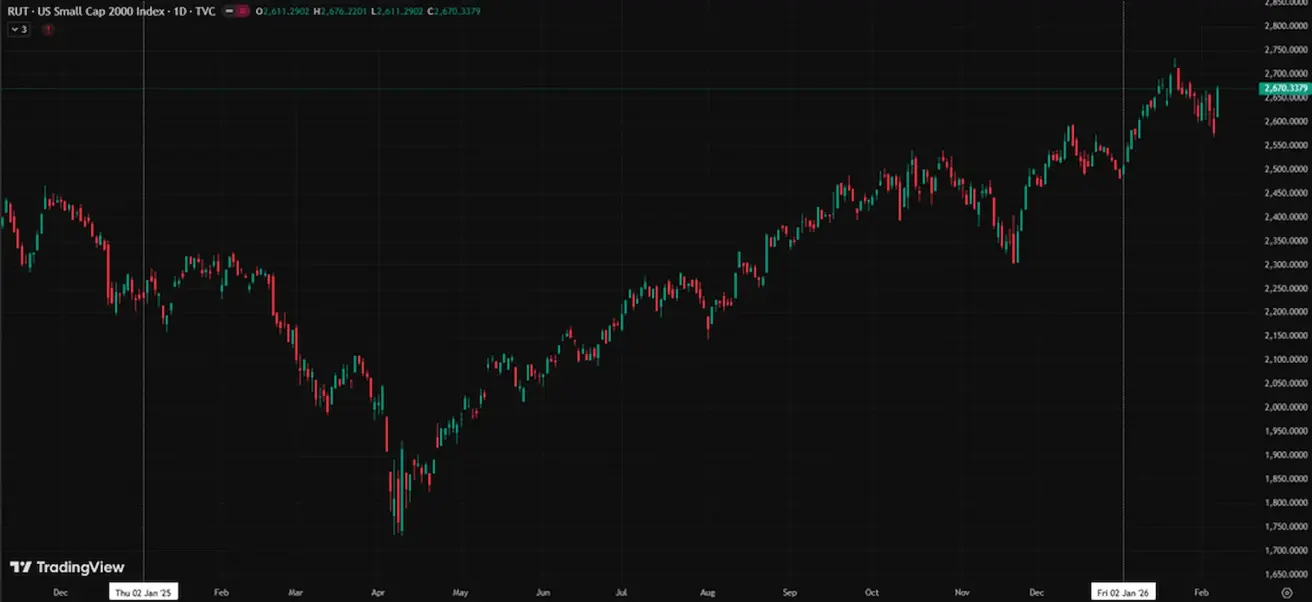
RUSSEL 2000 (RUT)
Nädala tootlus: +2,17 % (nädala lõpu sulgemistase 2 670,33); aasta algusest: +7,59 %.
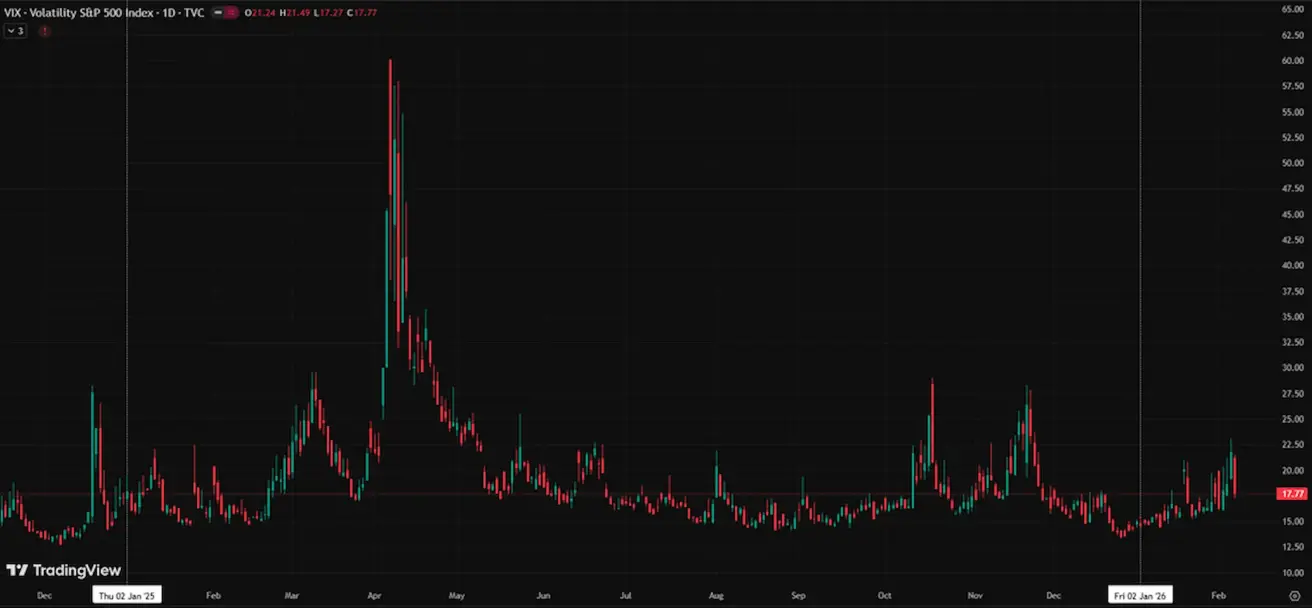
VIX
VIX volatiilsusindeks on 17,17.
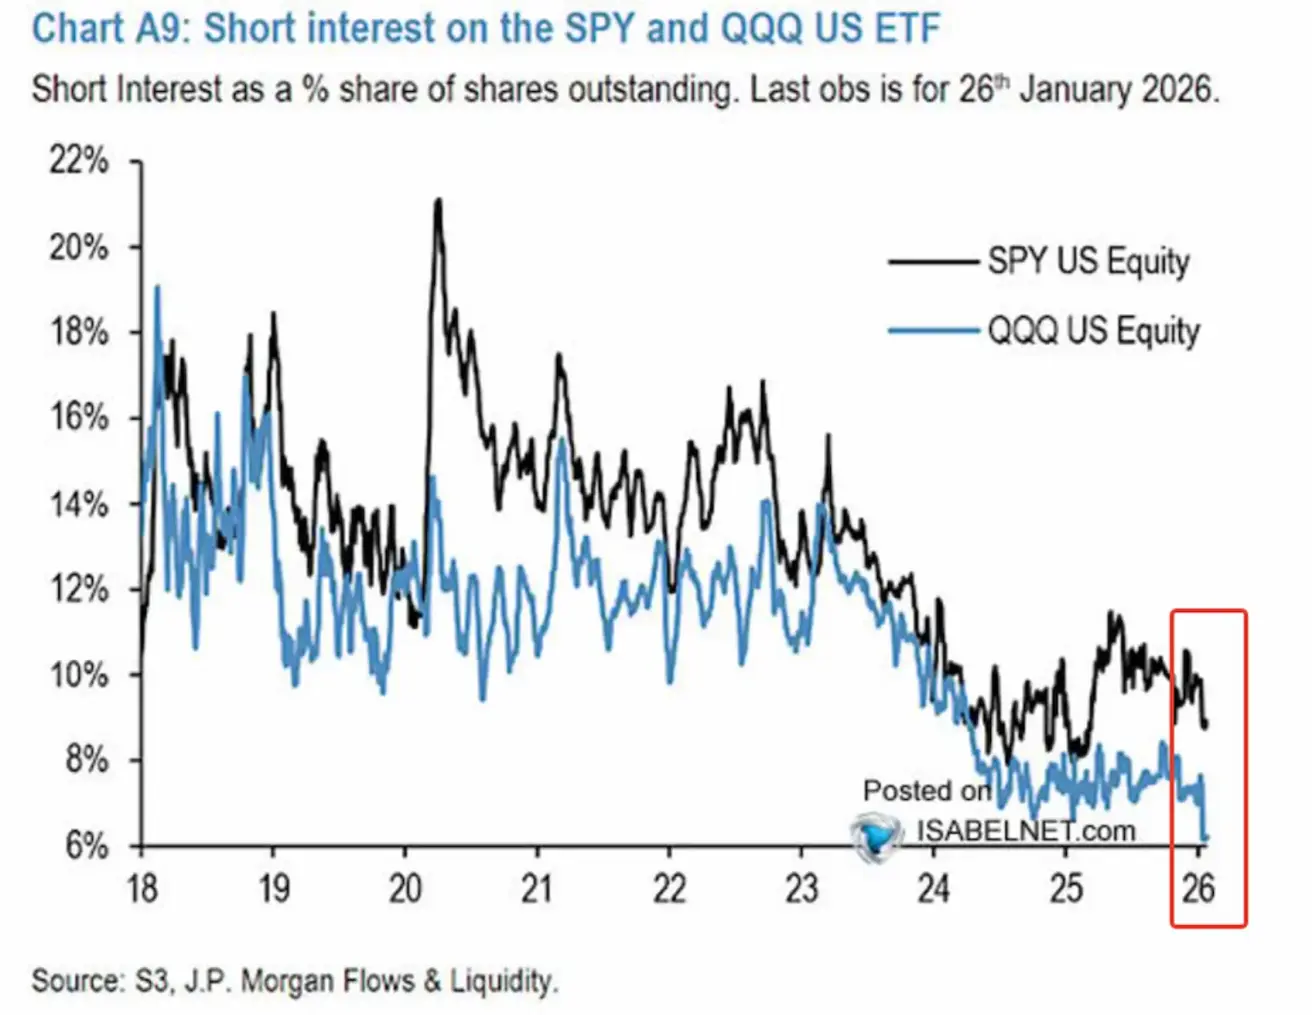
JP Morgani andmed näitavad alates aasta algusest järsku lühikeste positsioonide vähenemist Nasdaq 100 (QQQ) ja S&P 500 (SPY) puhul. Nasdaq 100 puhul on lühikeste positsioonide osakaal langenud ajaloolise miinimumini (short interest näitab lühikeste positsioonide osakaalu kogu vabalt kaubeldavate aktsiate suhtes).
See märgatav langus viitab:
- nii kaitseliste kui ka spekulatiivsete lühikeste positsioonide vähenemisele;
- investorite usalduse kasvule turu vastupidavuse suhtes;
- laialdaste panuste puudumisele aktsiaturu langusele.
Tehnoloogiasektor on lühikeste positsioonide kaudu vähem maandatud, mis viitab stabiilsematele kasumi- ja kasvuootele.
Madala short interest tase ei taga tingimata edasist tõusupotentsiaali, kuid vähendab järskude short‑squeeze liikumiste riski ja viitab rahulikumale positsioneerimisele tervikuna.
Kasumiraportid (valimisperiood: 2.–13. veebruar 2026):
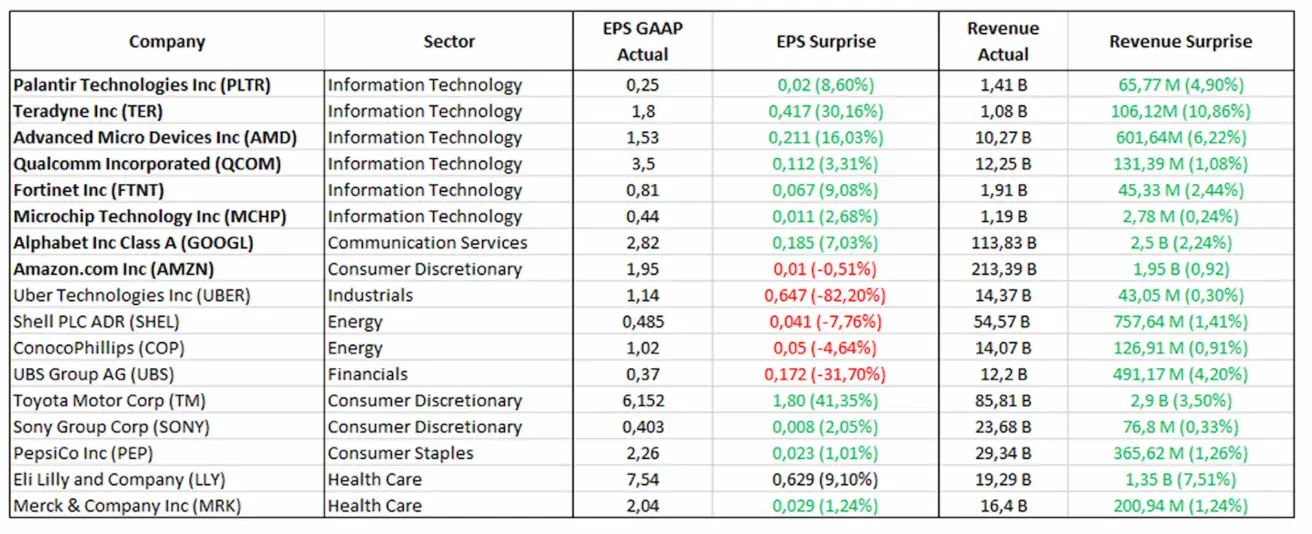
Tehnoloogiasektor jääb peamiseks kasvuveduriks. IT‑ ja sideteenuste ettevõtted (PLTR, AMD, QCOM, GOOGL, MSFT) näitavad tugevaid tulemusi, mis peegeldab tugevat nõudlust digilahenduste järele ning jätkuvaid investeeringuid tehisintellekti ja taristusse.
Mõnes aruandes, eriti tsüklilistes sektorites, on näha EPS‑i langust; siiski jätkavad kogutulud kasvu ja ületavad ootusi.
S&P 500 indeks raporteerib kõrgeimat keskmist puhaskasumi marginaali viimase enam kui 15 aasta jooksul.
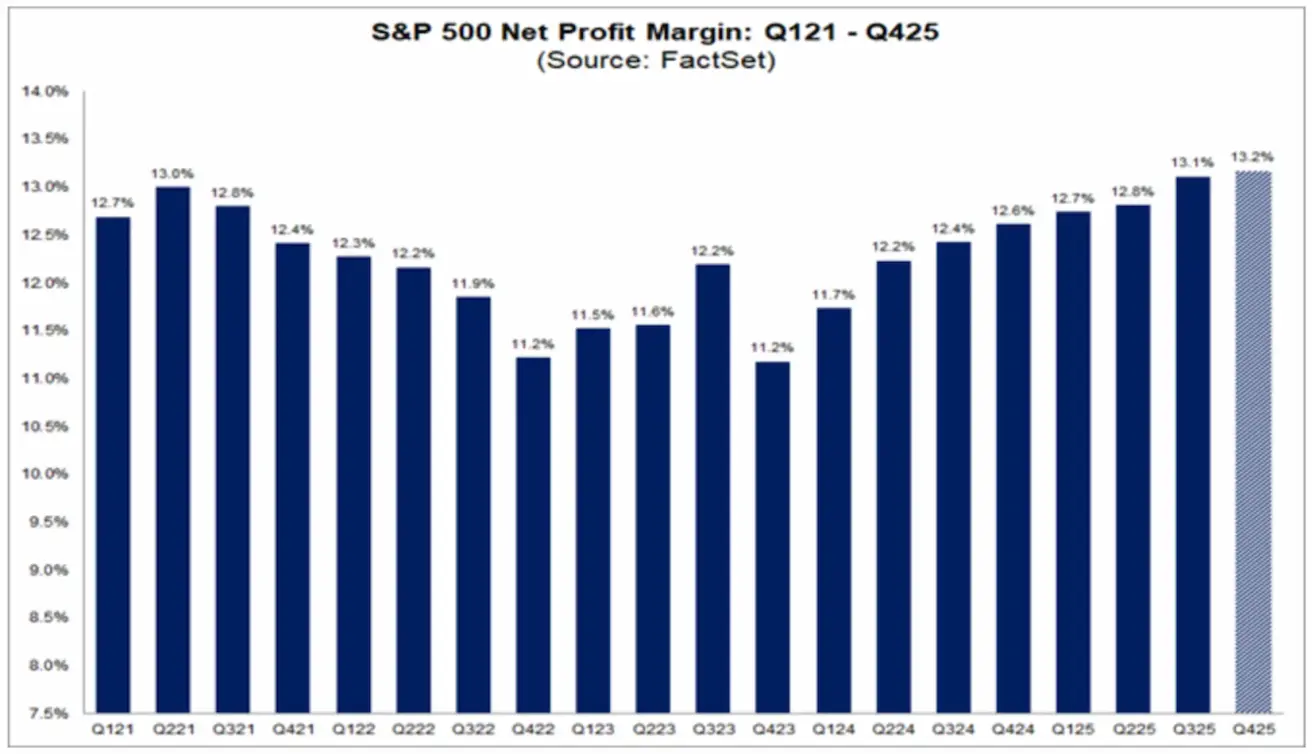
FactSeti graafik näitab S&P 500 ettevõtete puhaskasumi marginaalide püsivat taastumist pärast 2022–2023. aasta langust. 2025. aasta lõpuks ulatus marginaal 13,2 %-ni – kõrgeim tase vähemalt alates 2009. aastast.
See osutab ettevõtete kasumlikkuse struktuursele vastupidavusele ja aitab selgitada, miks aktsiaturud leiavad toetust ka makromajandusliku inertsuse aeglustumise tingimustes.
S&P 500 analüütikud ootavad indeksi ettevõtete puhaskasumimarginaali edasist kasvu 2026. aastal. Seisuga tänane päev on prognoositavad puhaskasumi marginaalid 2026. aasta I–IV kvartalis vastavalt 13,2 %, 13,8 %, 14,2 % ja 14,2 %.
Suured tehnoloogia‑hyperscaler’id plaanivad sel aastal investeerida tehisintellekti kuni 650 miljardit USD.
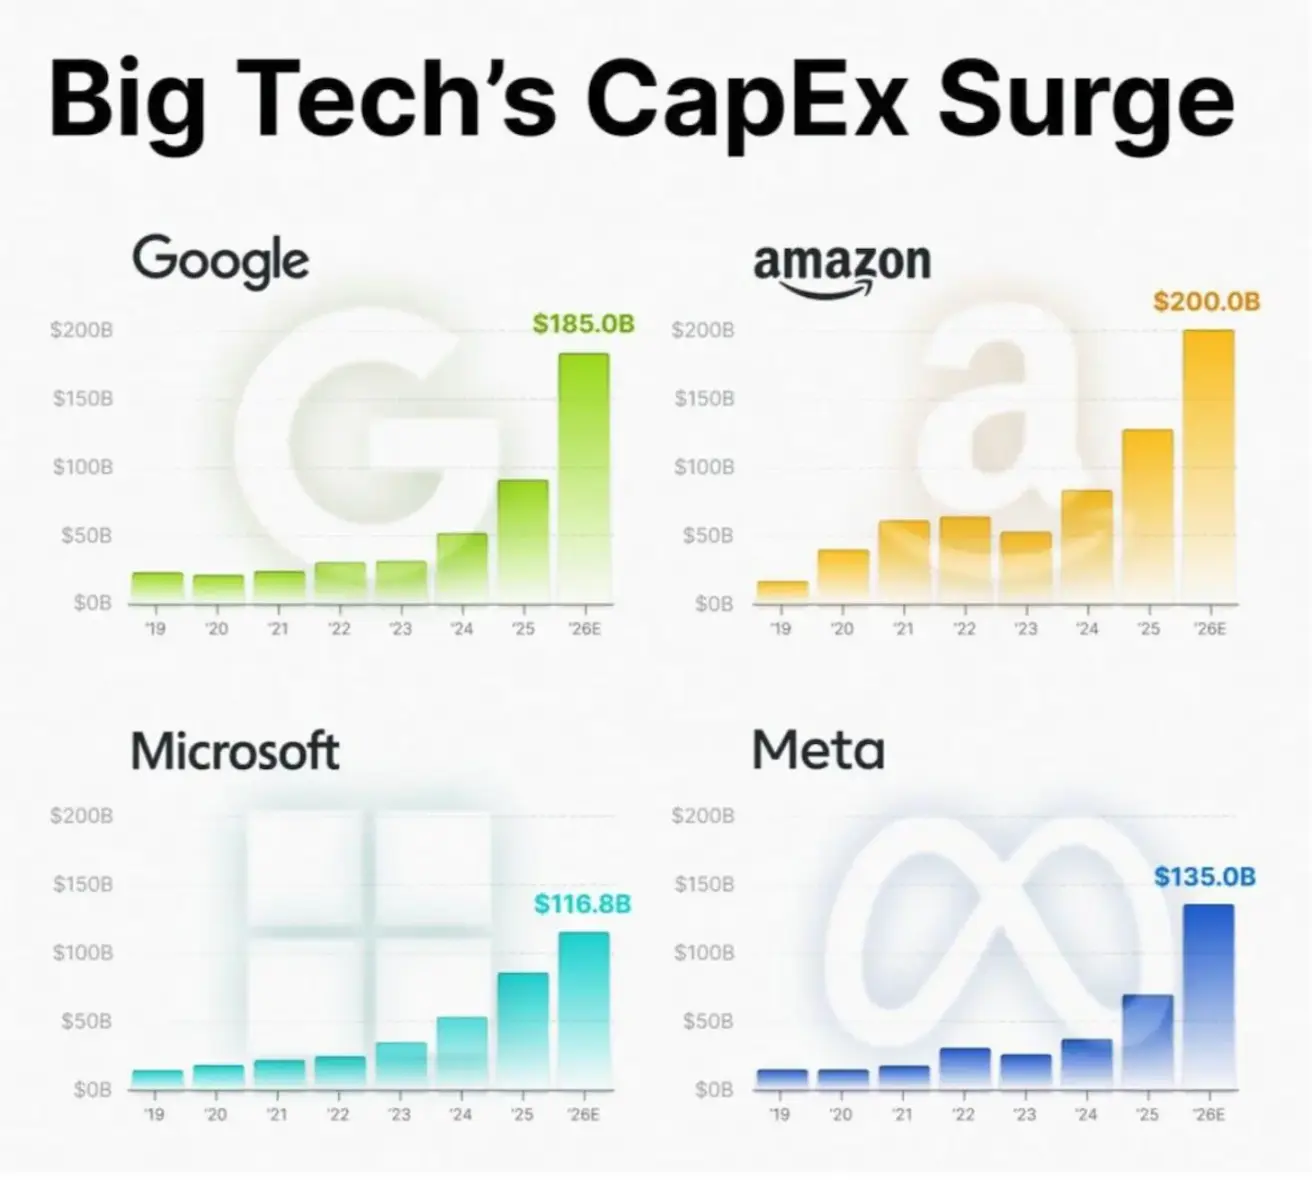
Kapitalikulutuste järsk kasv (andmekeskused, AI‑taristu, pooljuhid, elektrivõrgud) suurendab otseselt SKP investeerimiskomponenti ja toetab majandusaktiivsust Ameerika Ühendriikides.
Big Tech’i investeeringutel on tugevad kõrvalmõjud tööstusele, pooljuhtidele, energiasektorile, ehitusele ja insenerivaldkonnale. Mõju ulatub kaugele väljapoole IT‑hiiglasi, mistõttu jääb kõrge CapEx tõenäoliselt kogu investeerimistsüklit kujundama.
Lühikeses vaates piiravad suured kapitalikulutused vaba rahavoogu, kuid ettevõtted on keskendunud pikaajalisele kasvule ja mastaapsusele.
Euroala
- Põhraintressimäär muutumatult, inflatsioon kontrolli all;
- Rahapoliitika hoiak on neutraalne, riskide tasakaal liigub inflatsiooniriskidelt majandusnõrkuse suunas;
- Kaubanduspingete vaibudes parandas EKP järgmisteks aastateks SKP ja inflatsiooni prognoose;
- Euroopa stabiliseerub, kuid jääb kasvudünaamika poolest USA‑st maha.
Intressimäärad:
- Hoiustamisfaciliteedi intressimäär: 2,0 % (eelmine: 2,0 %);
- Laenufaciliteedi intressimäär: 2,4 % (eelmine: 2,4 %) (määr, millega pangad saavad üleöö regulaatorilt laenata);
- Lühiajaline (peamine poliitiline) määr: 2,15 % (eelmine: 2,15 %).
Inflatsioon: tarbijahinnaindeks (CPI) (jaanuar):
- Põhiinflatsioon (Core CPI, a/a): 2,2 % (eelmine: 2,3 %);
- Üldine CPI (k/k): −0,5 % (eelmine: 0,2 %, korrigeeritud); CPI (a/a): 1,7 % (eelmine: 2,0 %).
EKP ametnike retoorika viitab nihkele leebema rahapoliitika suunas.
- Martin Kocher: Kui euro veelgi tugevneb, võib regulaator kaaluda põhiintressimäära kärpe ajastuse varasemaks toomist;
- Madis Müller: Euroopa praegune kasvudünaamika ja majandusväljavaade on rahulolematust tekitavad.
SKP (IV kv, lõplik): k/k: 0,3 % (eelmine: 0,3 %); a/a: 1,3 % (eelmine: 1,4 %).
Tööpuuduse määr (detsember): 6,20 % (eelmine: 6,23 %).
Ostujuhtide indeks (PMI) (jaanuar):
- Teenindussektor: 51,6 (eelmine: 52,4);
- Tööstussektor: 49,4 (eelmine: 48,8);
- S&P Global Composite: 51,3 (eelmine: 51,5).
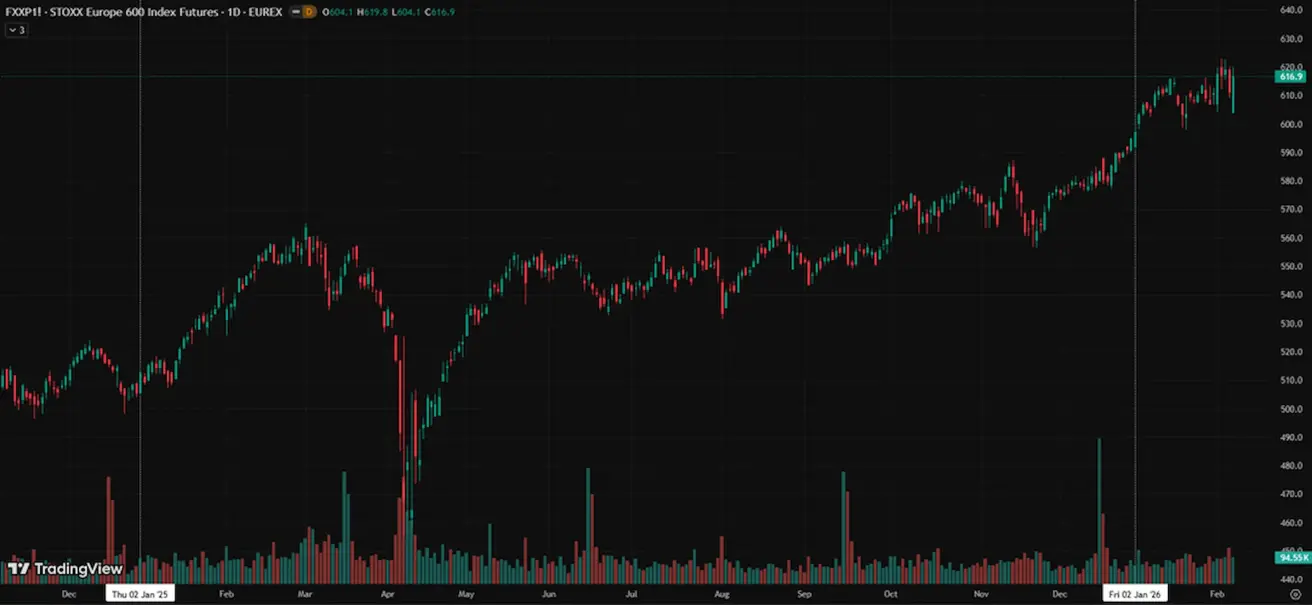
EURO STOXX 600 (FXXP1!)
Nädala tootlus: +1,02 % (nädala lõpu sulgemistase: 616,90); jaanuari tootlus: +3,86 %.
Hiina Majandus stabiliseerub ekspordi toel, samal ajal kui sisenõudlus ja investeeringud püsivad nõrgad; stimuleerivad meetmed on jätkuvalt sihitud ja ettevaatlikud.
- Põhointressimäärad muutumatud;
- Rahapoliitika hoiak on jätkuvalt leebe;
- Hiina teatas oma 2026. aasta plaani raames fiskaalse toetuse jätkamisest majanduskasvule (sisenõudluse toetamine, maksusoodustuste ja subsiidiumide optimeerimine, tööstuse moderniseerimine).
Intressimäärad:
- 1 aasta laenuvõrdlusmäär (Loan Prime Rate, keskmise tähtajaga laenamine): 3,00 %;
- 5 aasta laenuvõrdlusmäär (elanikkonna eluasemelaenudele mõjuv määr): 3,50 %.
Inflatsiooninäitajad (detsember):
- Tarbijahinnaindeks (CPI) (k/k): 0,2 % (eelmine: −0,1 %); (a/a): 0,8 % (eelmine: 0,7 %);
- Tootjahinnaindeks (PPI) (a/a): −1,9 % (eelmine: −2,2 %).
SKP (IV kv, lõplik): k/k: 1,2 % (eelmine: 1,1 %); a/a: 4,5 % (eelmine: 4,8 %).
Tööpuuduse määr (detsember): 5,1 % (eelmine: 5,1 %).
Tööstustoodang (detsember, a/a): 5,9 % (eelmine: 4,8 %).
Püsivarainvesteeringud (detsember, a/a): −3,8 % (eelmine: −2,6 %).
Jaemüük (detsember, a/a): 0,9 % (eelmine: 1,3 %).
Import (detsember, a/a): 5,7 % (eelmine: 1,9 %); eksport (detsember, a/a): 6,6 % (eelmine: 5,9 %).
Kaubandusbilanss (USD) (detsember): 114,30 miljardit USD (eelmine: 111,68 miljardit USD).
Ostujuhtide indeksid (PMI) (november):
- Tööstussektor: 49,3 (eelmine: 49,2);
- Teenuste väline (mitte‑tööstuslik) sektor: 49,4 (eelmine: 49,0);
- Komposiitindeks: 50,7 (eelmine: 49,1).
Hiina president Xi Jinping sõnastas eesmärgi: „Yuan peab muutuma globaalseks reservvaluutaks. Riigil on vaja ‘strong currency’t, mida kasutatakse laialdaselt rahvusvahelises kaubanduses, investeeringutes ja valuutaturgudel.“
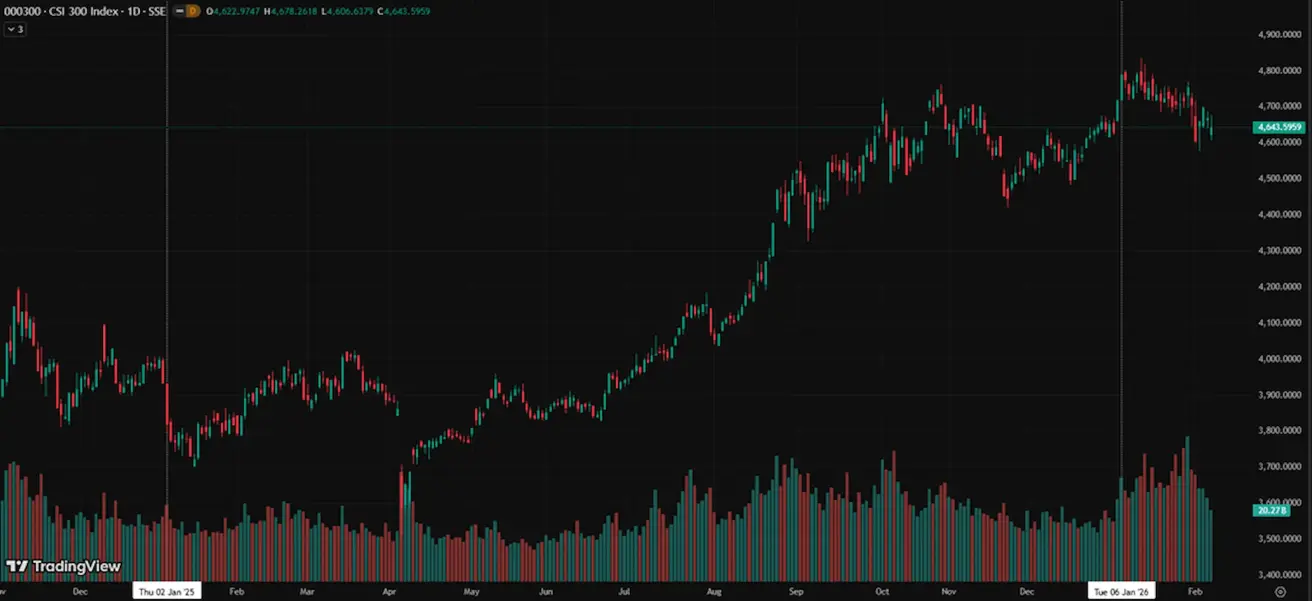
CSI 300 INDEKS (000300.HK)
Nädala tootlus: −1,33 % (nädala lõpu sulgemistase 4 653,59); aasta algusest: +0,29 %.
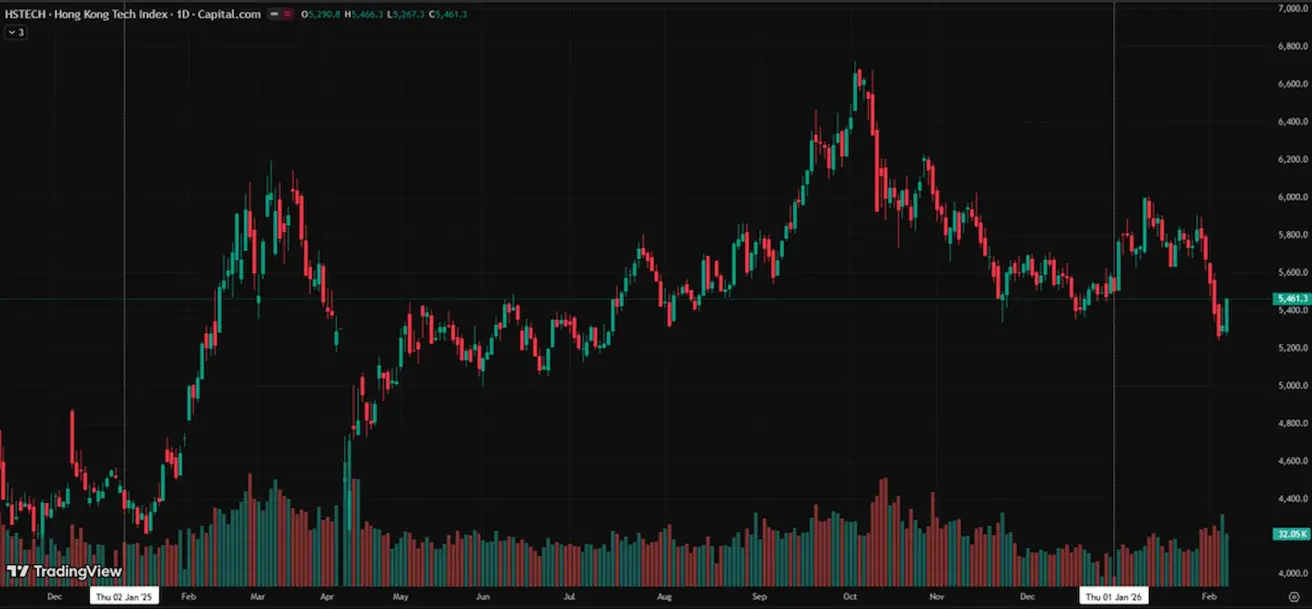
Hang Seng TECH Index (HTI1!)
Nädala tootlus: −4,84 % (nädala lõpu sulgemistase: 5 461,3); aasta algusest: −0,78 %.
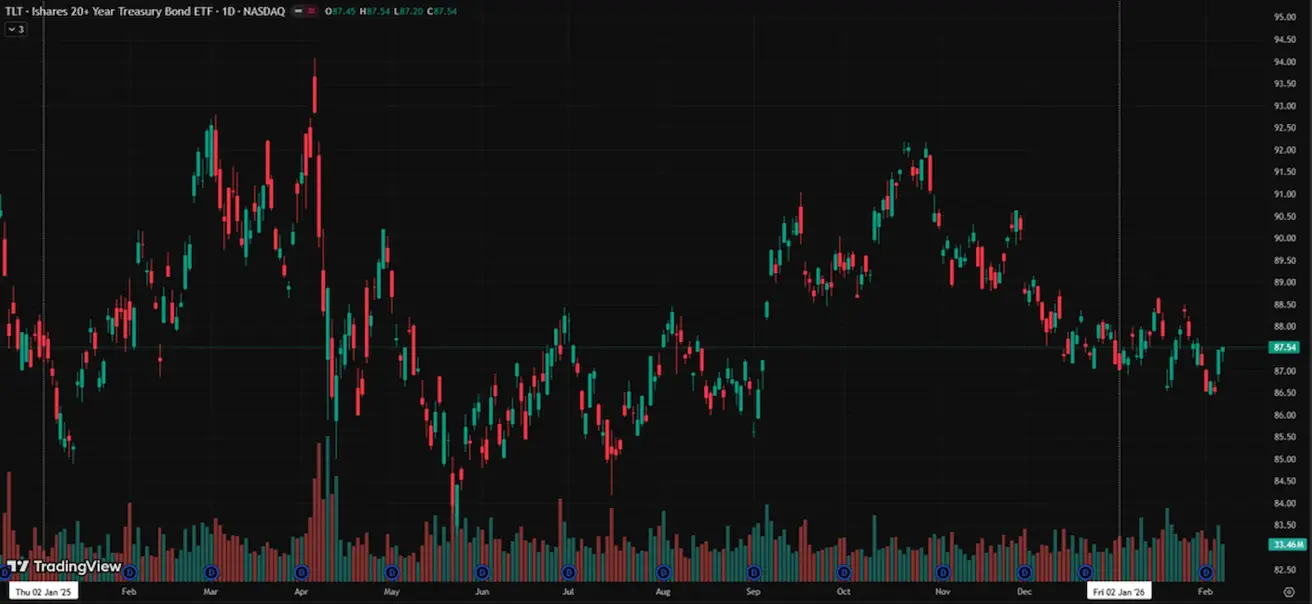
VÕLAKIRJATURG
USA võlakirjaturg ei näita sügava majanduslanguse ega süsteemse riski märke. USA riigivõlakirjad 20+ (ETF TLT): nädala tootlus +0,47 % (nädala lõpu sulgemistase: 87,54); aasta algusest: +0,44 %.
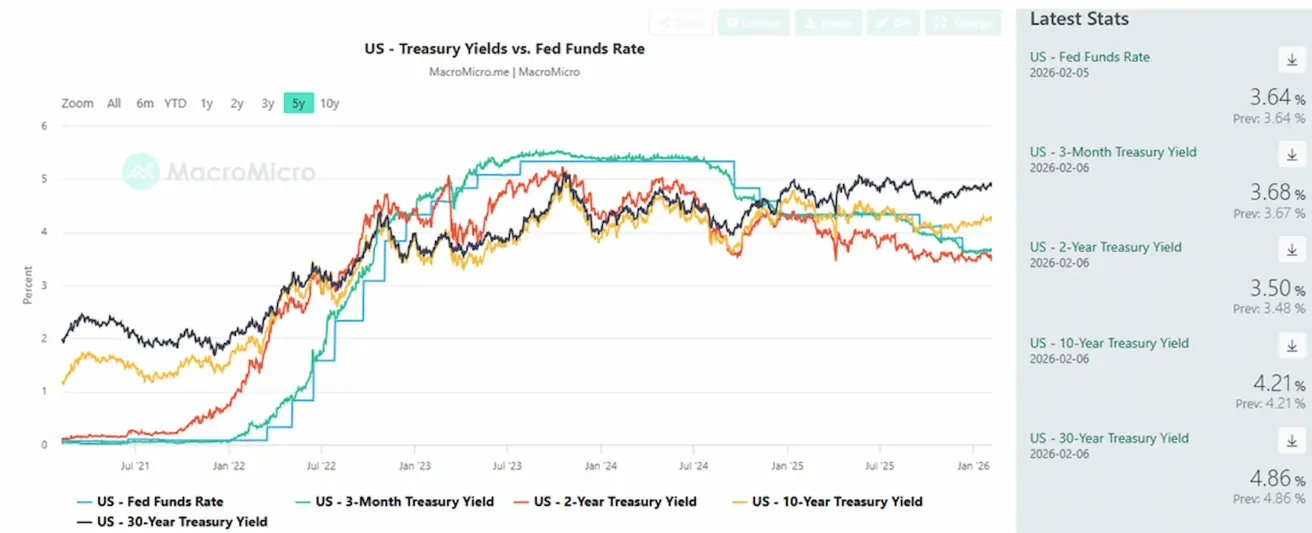
TOOTLUSED JA SPREAD’ID
USA 10‑aastaste riigivõlakirjade tulusus (Market Yield at 10‑Year Constant Maturity): 4,21 % (eelmine: 4,24 %);
- 2‑aastaste riigivõlakirjade tulusus: 3,50 % (eelmine: 3,53 %);
- ICE BofA BBB USA ettevõtete võlakirjaindeksi efektiivne tulusus: 5,00 % (eelmine: 5,03 %);
- 10‑ ja 2‑aastaste USA riigivõlakirjade tulususte vahe: 71 baaspunkti (eelmine: 71);
- 10‑aastaste ja 3‑kuuliste USA riigivõlakirjade tulususte vahe: 53 baaspunkti (eelmine: 58).
USA 5‑aastase krediidiriski vahetustehingu (CDS) spread (maksejõuetuskindlustus): 31,02 baaspunkti (vs 28,33 baaspunkti nädal varem).
KULLAFUTUURID (GC)
Nädala tootlus +0,20 % (nädala lõpu sulgemistase: 4 979,8 USD untsi kohta); aasta algusest: +14,95 %.
Reuters: Hiina keskpank pikendas jaanuaris oma kullavarude suurendamise programmi juba viieteistkümnendat kuud järjest. Hiina Rahvapanga andmetel tõusis kullareservide väärtus eelmise kuu lõpus 369,58 miljardi USD‑ni, võrreldes kuu varasema 319,45 miljardi USD‑ga.
Pank mitmekesistab reserve ja toetab bullish sentiment’i kullaturul.
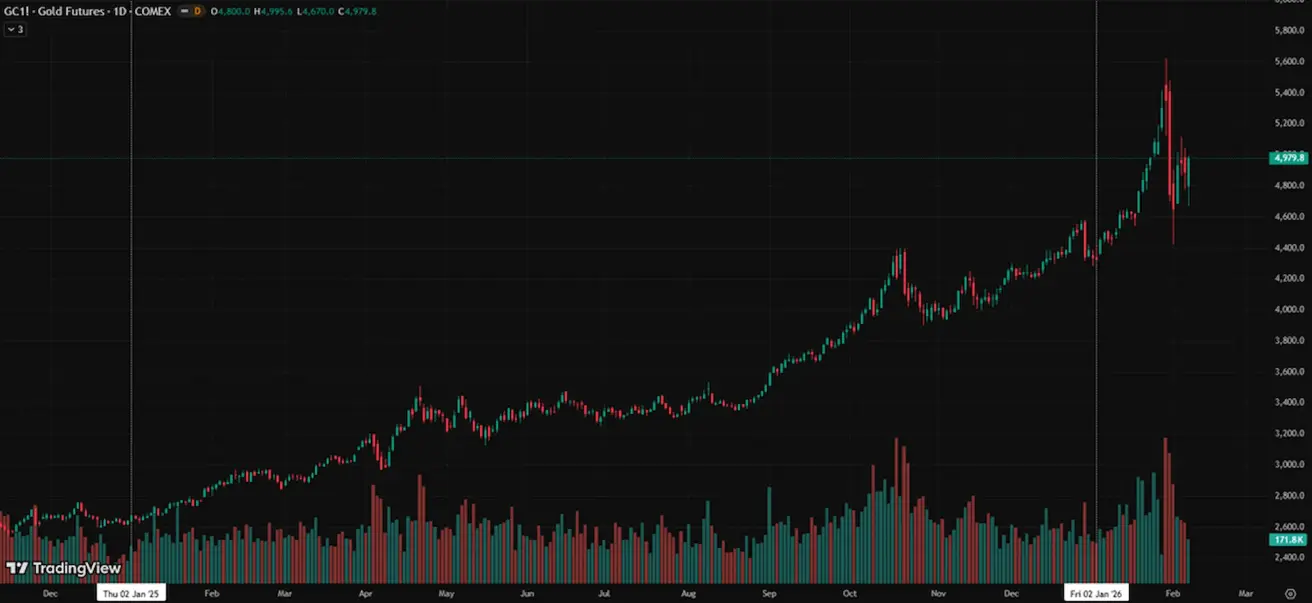
Kasvuvedurid:
- Geopoliitilised riskid ja poliitiline ebakindlus seoses Trumpiga;
- Keskpankade ja kullaga tagatud ETF‑ide tugev ostuaktiivsus;
- Suurte erainvestorite sissevool, sealhulgas Tether, mis väidetavalt hoiab ligikaudu 140 tonni kulda.
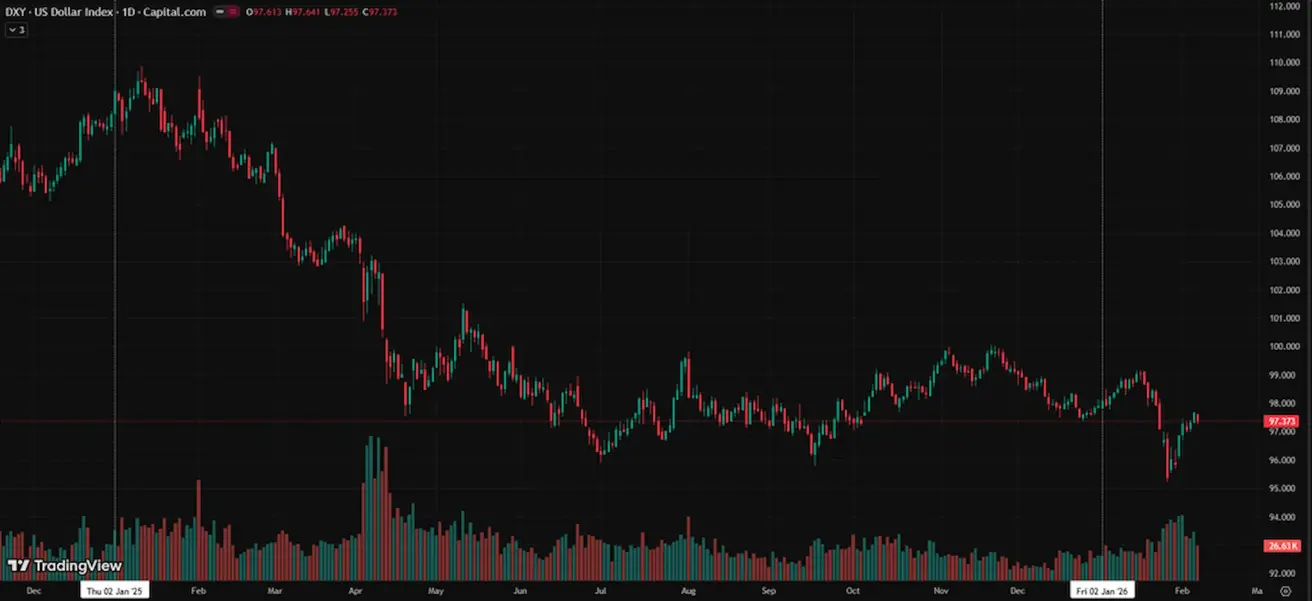
DOLLARIINDEKSI FUTUURID (DX)
USA dollarindeksi futuurid (DX): nädala tootlus +0,52 % (nädala lõpu sulgemistase: 97,373); aasta algusest: −0,63 %.
Pärast 2025. aasta lõpu langust on dollar sisenenud stabiliseerumise ja osalise taastumise faasi. Ootused neutraalsema Föderaalreservi poliitika suhtes piiravad tõusupotentsiaali, kuid ei tekita USA dollari suhtes püsivat langussurvet.
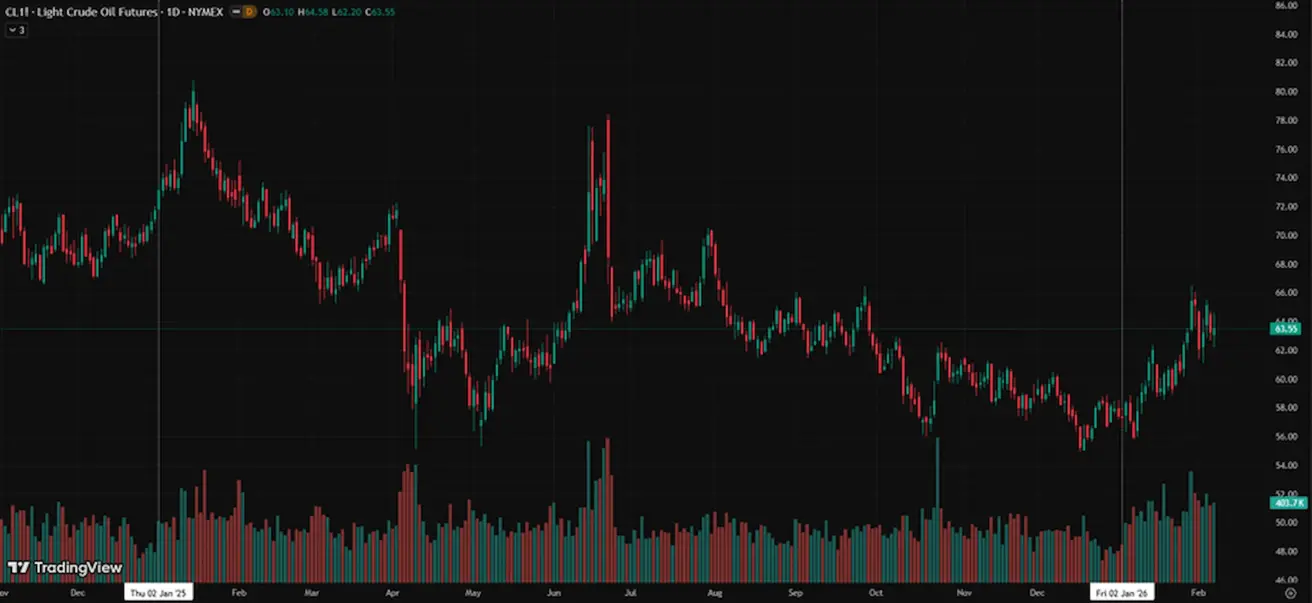
NAFTAFUTUURID
Nädala tootlus −2,55 % (nädala lõpu sulgemistase: 63,55 USD barreli kohta); aasta algusest: +10,70 %.
- Ootused naftapakkumise kasvule püsivad;
- OPEC+ plaanib peatada edasised tootmise suurendamised;
- Geopoliitilised riskid Lähis‑Idas – protestid ja pingete kasv Iraanis – suurendavad muret pakkumishäirete pärast.
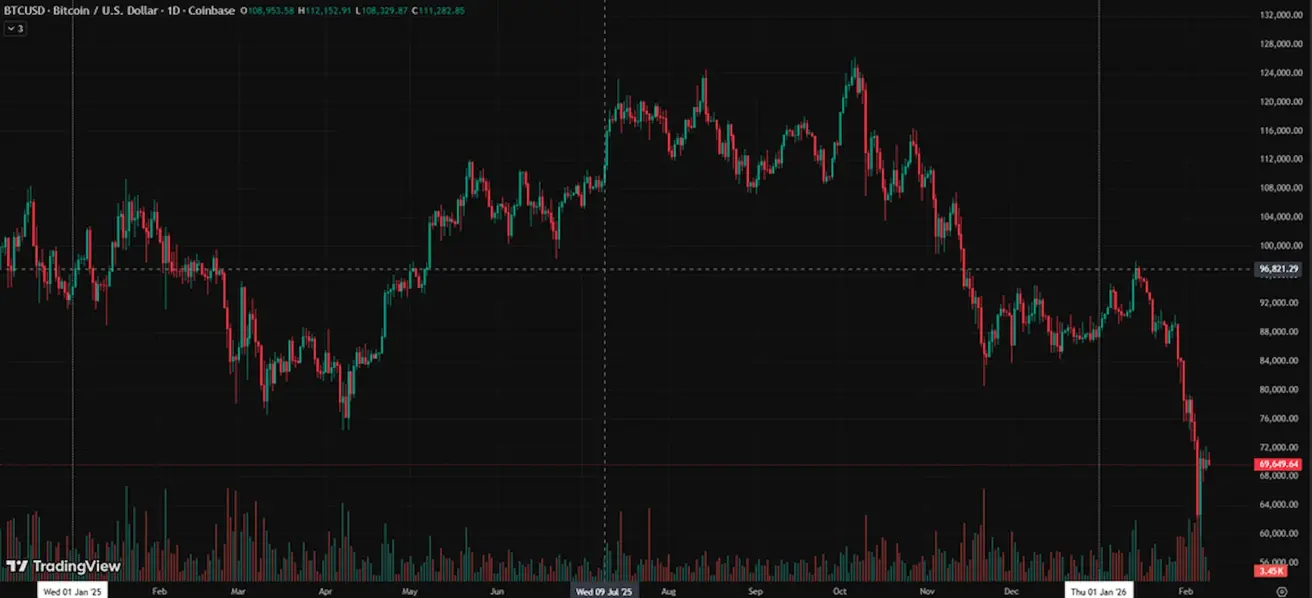
BTC FUTUURID
Nädala tootlus −8,70 % (nädala lõpu sulgemistase: 70 279,33 USD); aasta algusest: −19,88 %.
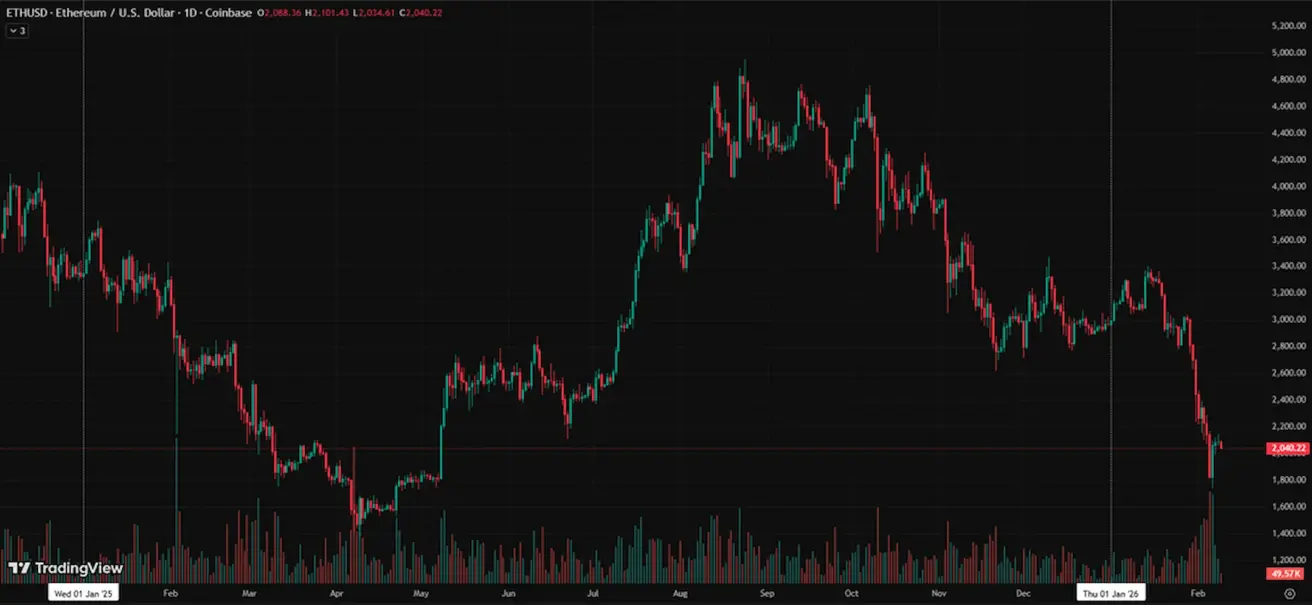
ETH FUTUURID
Nädala tootlus −9,02 % (nädala lõpu sulgemistase: 2 064,96 USD); aasta algusest: −30,56 %.
CFTC laiendab oma stablecoin’ide regulatiivset raamistikku, lubades riiklikel usalduspankadel (national trust banks) emiteerida USA dollariga seotud tokeneid GENIUS Act’i alusel.
CLARITY Act – seaduseelnõu, mille eesmärk on luua USA‑s terviklik krüptoturu struktuur – on oodata hääletusele märtsis.
KOGU KRÜPTOVALUUTA TURUKAPITALISATSIOON
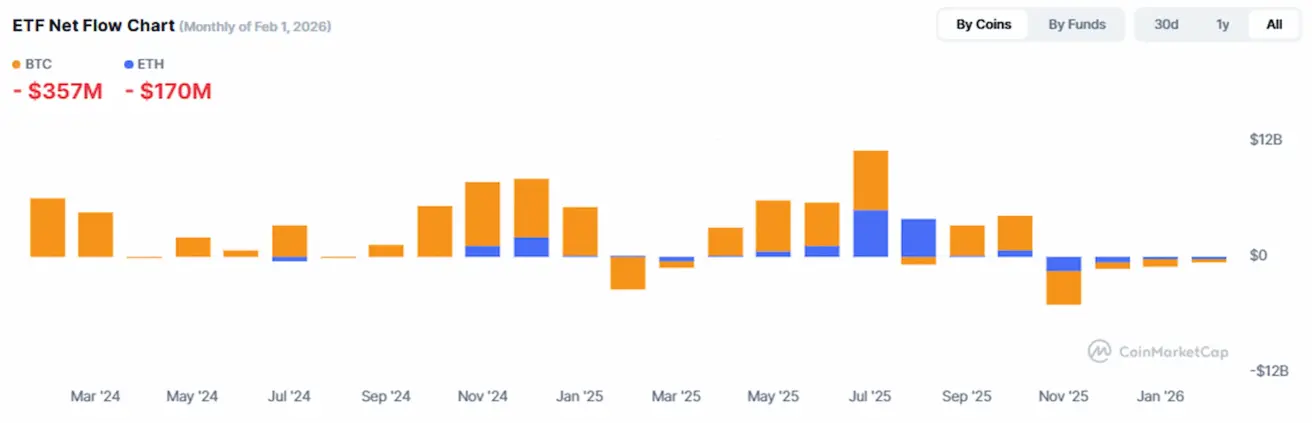
Kogu krüptovaluutade turukapitalisatsioon: 2,36 triljonit USD (vs 3,23 triljonit USD nädal varem) (coinmarketcap.com).
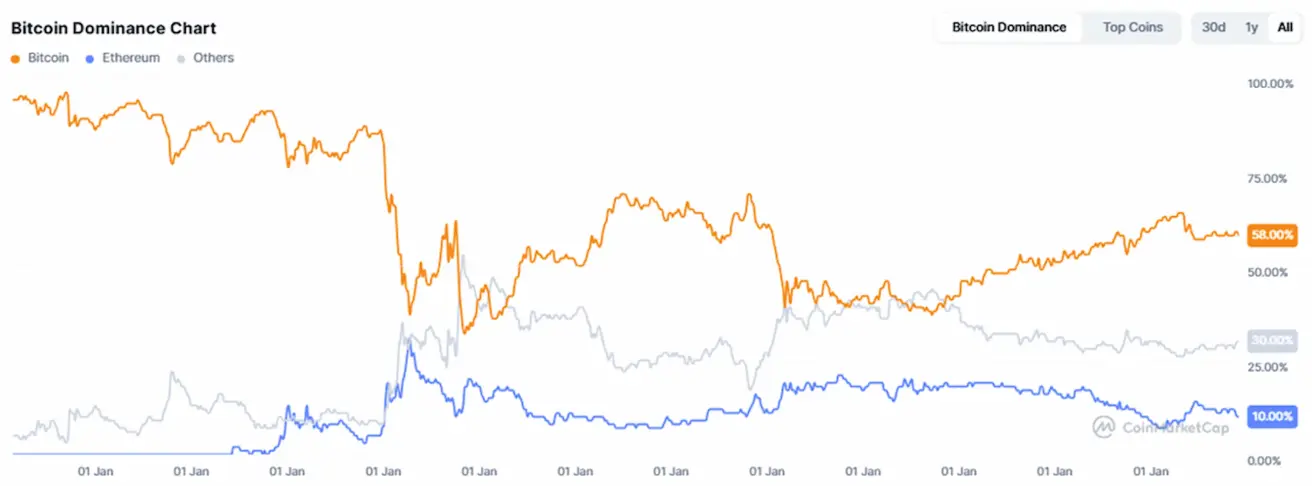
Krüptovarade osakaalud
- Bitcoin: 58,5 % (58,9 %);
- Ethereum: 10,4 % (12,5 %);
- muud: 31,1 % (28,6 %).
ETF‑ide netovood (ETF Net Flows) graafik: