English
 Lietuvių
 Русский
 Eesti
Eesti15–21 желтоқсан 2025 ж.: Апталық экономикалық шолу
Негізгі нарықтық жаңартулар

Өткен аптада нарықтық көңіл-күй жалпы алғанда біршама оң болып қалды. АҚШ-тың соңғы макроэкономикалық деректері soft-landing сценарийін қолдауды жалғастыруда: инфляцияның қарқыны баяулап келеді (тұтыну бағалары индексі бойынша күтуден айтарлықтай төмен көрсеткіш тіркелді), еңбек нарығы біртіндеп салқындауда, ал экономикалық өсім орнықтылығын сақтап отыр.
Еңбек нарығы
BLS бірден екі айды – қазан мен қарашаны – қамтитын жұмыспен қамту деректерін жариялады. Қарашада еңбек нарығы әлсіз қазан айынан кейін біршама қалпына келді. Жалпы алғанда, деректер төраға Пауэллдің еңбек нарығы жағдайларының салқындап келе жатқаны туралы бағасын қуаттайды. Ауыл шаруашылығынан тыс сектордағы жұмыспен қамту өсімі баяулап, жұмыссыздық бойынша жәрдемақы алуға өтінімдер саны өсуде, ал жұмыссыздық деңгейі 4,6%-ға дейін көтерілді.
Сонымен қатар, Атланта ФРЖ ағымдағы ЖІӨ өсімін шамамен 3,5% деңгейінде бағалайды.
Ақша-кредит саясаты
- Негізгі мөлшерлеме өзгеріссіз қалды; коммуникация сақтық сипатында.
- Позициясы: біршама шектеуші → біртіндеп бейтарап деңгейге өту.
- ФРЖ тепе-теңдікті сақтауды жалғастыруда: қаржы нарықтарын қолдай отырып, мөлшерлемелерді жуық арада немесе агрессивті төмендету циклы туралы тікелей сигнал беруден аулақ.
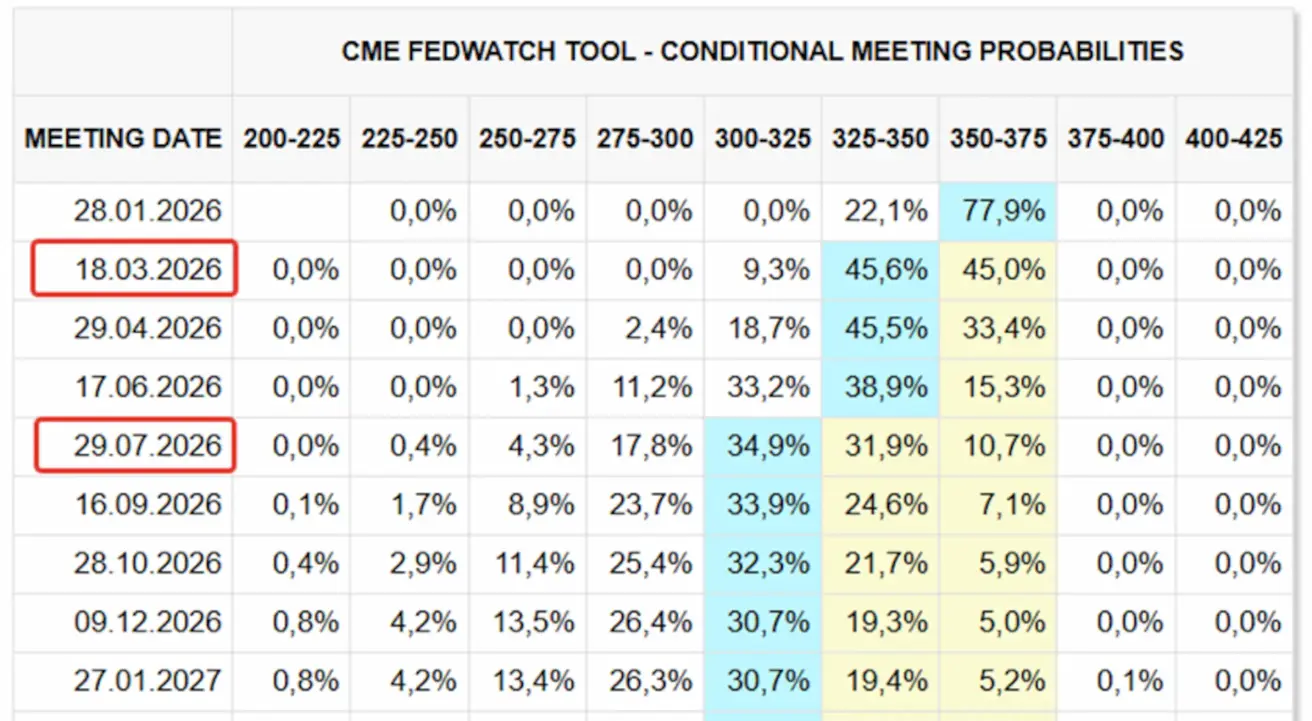
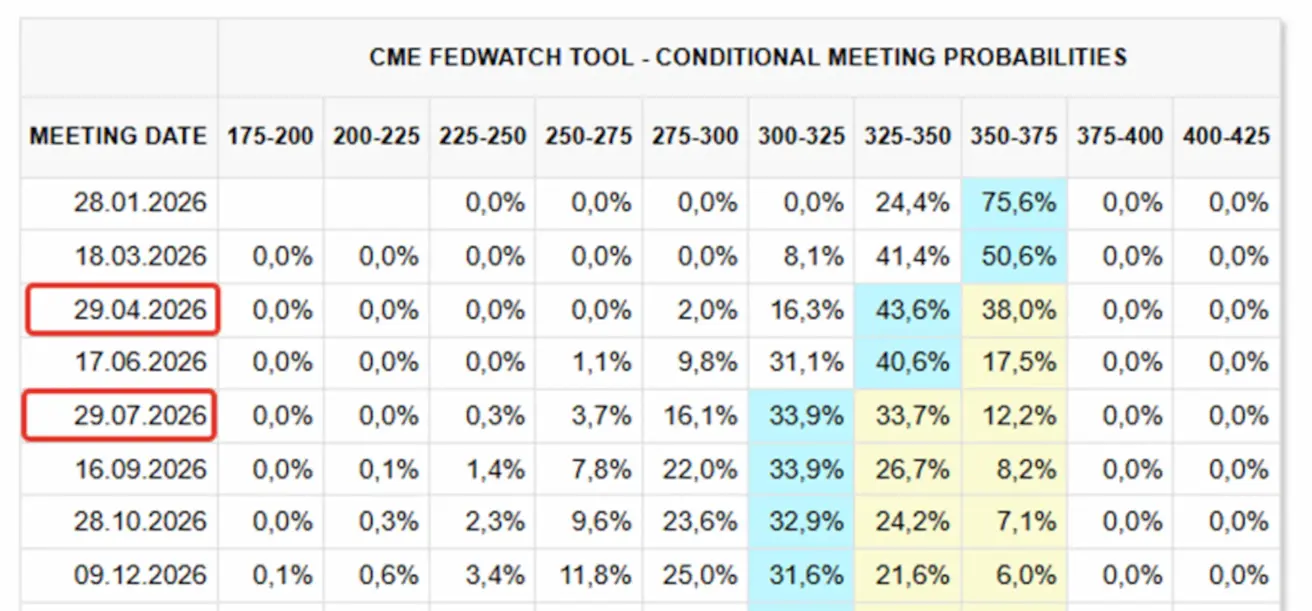
Своптар нарығы (FedWatch) регулятордан оқ бойы озық жүру әдетін сақтап, 2026 жылы екі рет мөлшерлемені төмендетуді бағалап отыр, бірінші төмендету енді наурыздағы отырысқа ыстырылды.
Макроэкономикалық статистика
ИНФЛЯЦИЯ (қыркүйек)
- Негізгі тұтыну бағалары индексі (Core CPI) (m/m): 0,2% (бұрын: 0.3%)
- Тұтыну бағалары индексі (CPI) (m/m): 0.3% (бұрын: 0.4%)
- Негізгі CPI (y/y): 2.6% (бұрын: 3.0%)
- CPI (y/y): 2.7% (бұрын: 3.0%)
Өндіруші бағалар индексі (қыркүйек):
- PPI (m/m): 0.3% (бұрын: -0.1%)
- Негізгі PPI (m/m): 0.1% (бұрын: -0.1%)
ИНФЛЯЦИЯЛЫҚ КҮТІНІМДЕР (MICHIGAN)
- 12 айлық күтілетін инфляция (желтоқсан): 4.1% (бұрын: 4.5%)
- 5 жылдық күтілетін инфляция (желтоқсан): 3.2% (бұрын: 3.4%)
Негізгі жеке тұтыну шығыстарының баға индексі (Core PCE, қыркүйек) — Федералдық резервтің базалық инфляцияның негізгі көрсеткіші ретінде қарайтын индикаторы:
- m/m: 0.2% (бұрын: 0.2%)
- y/y: 2.8% (бұрын: 2.9%)
ЖІӨ (АҚШ Экономикалық талдау бюросы, BEA) — 2025 ж. 2-тоқсан, жылдық есепте, үшінші бағалау: +3.8% (екінші бағалау: +3.30%; 2024 ж. 1-тоқсан: –0.5%). Атланта ФРЖ-ның GDPNow бағалауы (4-тоқсан): 3.5% (3.9%-бен салыстырғанда).
(GDPNow болжамдық моделі ресми ЖІӨ көрсеткіші жарияланғанға дейін, АҚШ Экономикалық талдау бюросының әдістемесіне жалпы сәйкес келетін тәсілді пайдалана отырып, «real-time» прокси-көрсеткіш ұсынады.)
Бизнес белсенділік индексі (PMI) (желтоқсан):
(50-ден жоғары мән – кеңеюді, 50-ден төмен – қысқаруды білдіреді)
- Қызметтер секторы: 52.9 (бұрын: 54.1)
- Өңдеу өнеркәсібі: 51.8 (бұрын: 52.2)
- S&P Global Composite: 53.0 (бұрын: 54.2)
ЕҢБЕК НАРЫҒЫ (қараша)
Еңбек нарығына қатысты деректер бірнеше индикатор бойынша күтуден жоғары болды:
- Жұмыссыздық деңгейі: 4.6% (бұрын: 4.4%)
- АҚШ-та жұмыссыздық бойынша жәрдемақы алатын адамдардың жалпы саны: 1 897K (1 830K-мен салыстырғанда)
- Алғашқы жұмыссыздық талаптары: 224K (қайта қаралған 237K-мен салыстырғанда)
- ADP бойынша ауыл шаруашылығынан тыс сектордағы жұмыспен қамту өзгерісі: 64K (бұрын: -105K)
- Жеке ауыл шаруашылығынан тыс сектордағы жұмыспен қамту өзгерісі (ADP): 69K (бұрын: 52K)
- Орташа сағаттық жалақы (y/y): 3.5% (бұрын: 3.7%)
- JOLTS бойынша бос жұмыс орындары: — (7.227M-мен салыстырғанда)
АҚША-КРЕДИТ САЯСАТЫ
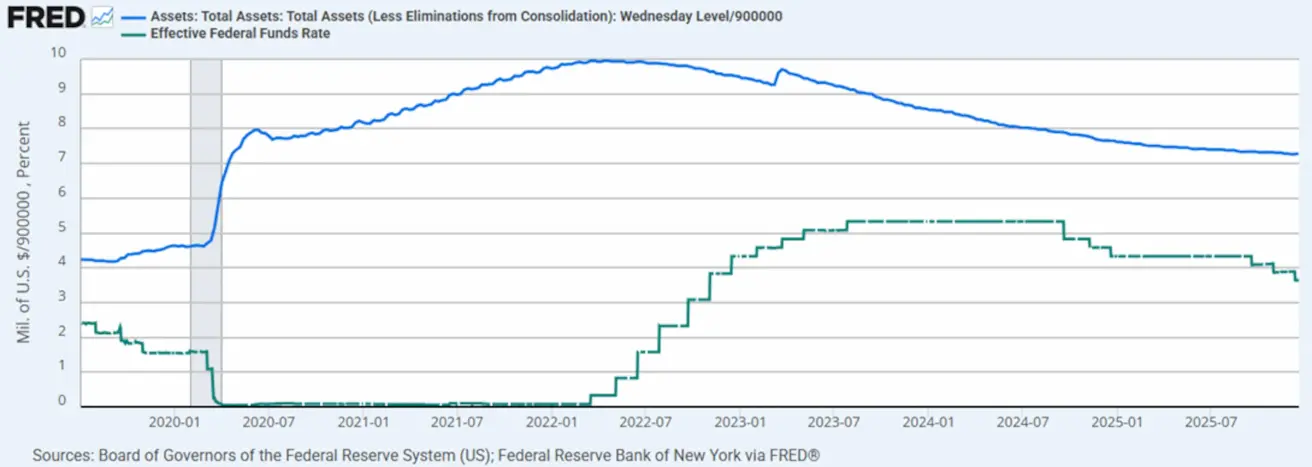
- Федералдық қорлар бойынша тиімді мөлшерлеме (EFFR): 3.50%–3.75%
- Федералдық резерв балансы ұлғайды: $6,556T (сандық қатаңдату тоқтатылған сәттегі $6,535T-мен салыстырғанда).
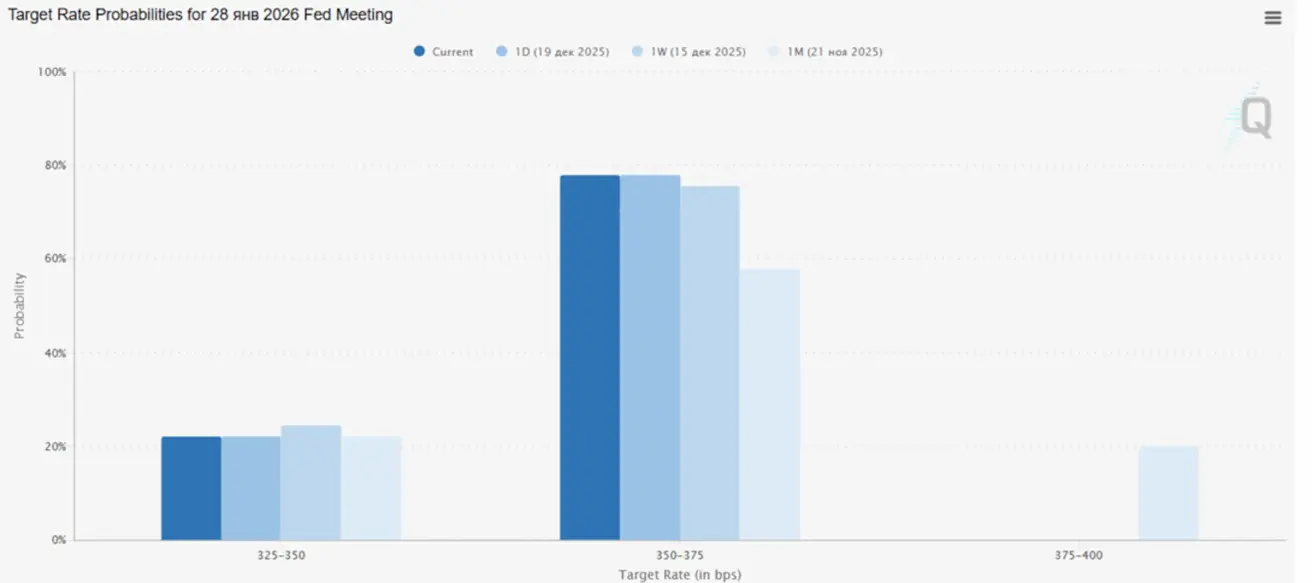
НАРЫҚТЫҢ МӨЛШЕРЛЕМЕ БОЙЫНША КҮТІНІМДЕРІ (FEDWATCH)
- Келесі отырыс (28 қаңтар): 0.25% мөлшерлеме төмендету ықтималдығы 22.1%, ал өзгеріссіз қалу ықтималдығы 77.9% деңгейінде бағалануда.
- Келесі 12 ай ішінде: екі рет 0.25% мөлшерлеме төмендету күтілуде, бұл мақсатты дәлізді 3.00–3.25% деңгейіне дейін түсіреді.
Бүгін:
Бір апта бұрын:
Нарық
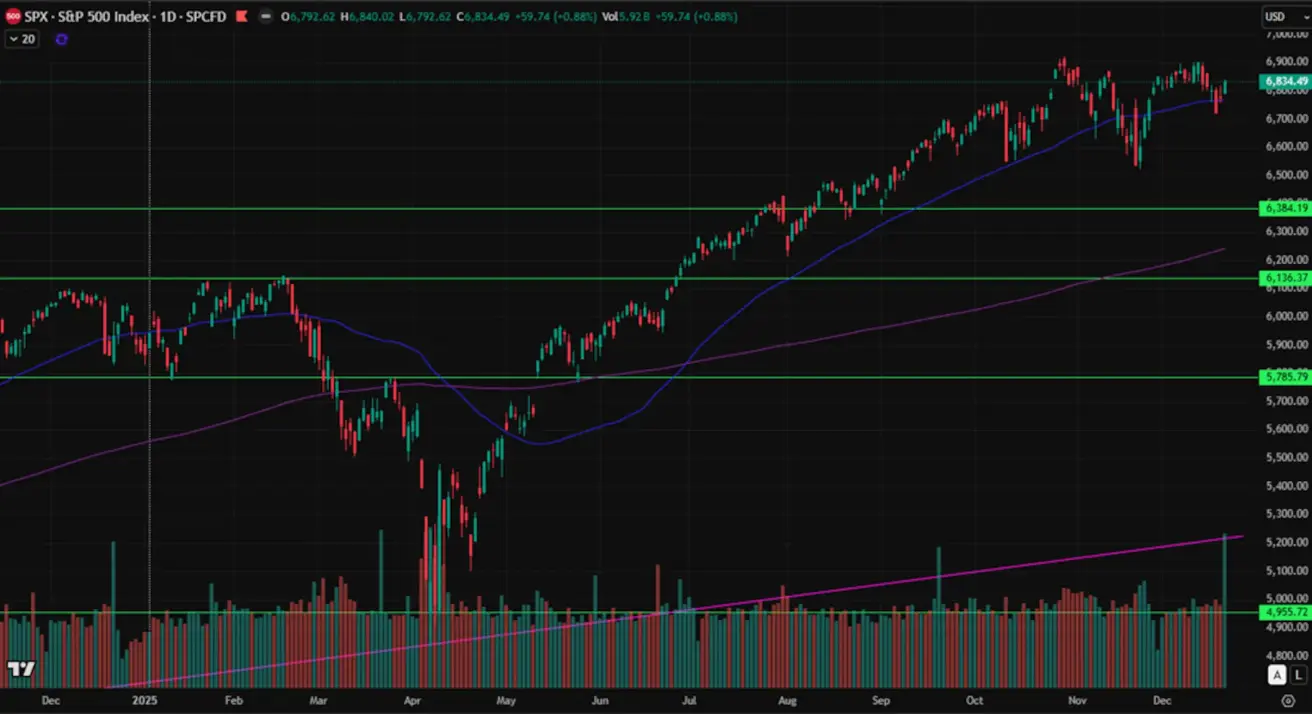
SP500
Апталық нәтиже: +0.10% (апта соңындағы жабылу: 6,834.49). 2025 ж. басынан бері: +15.77%.
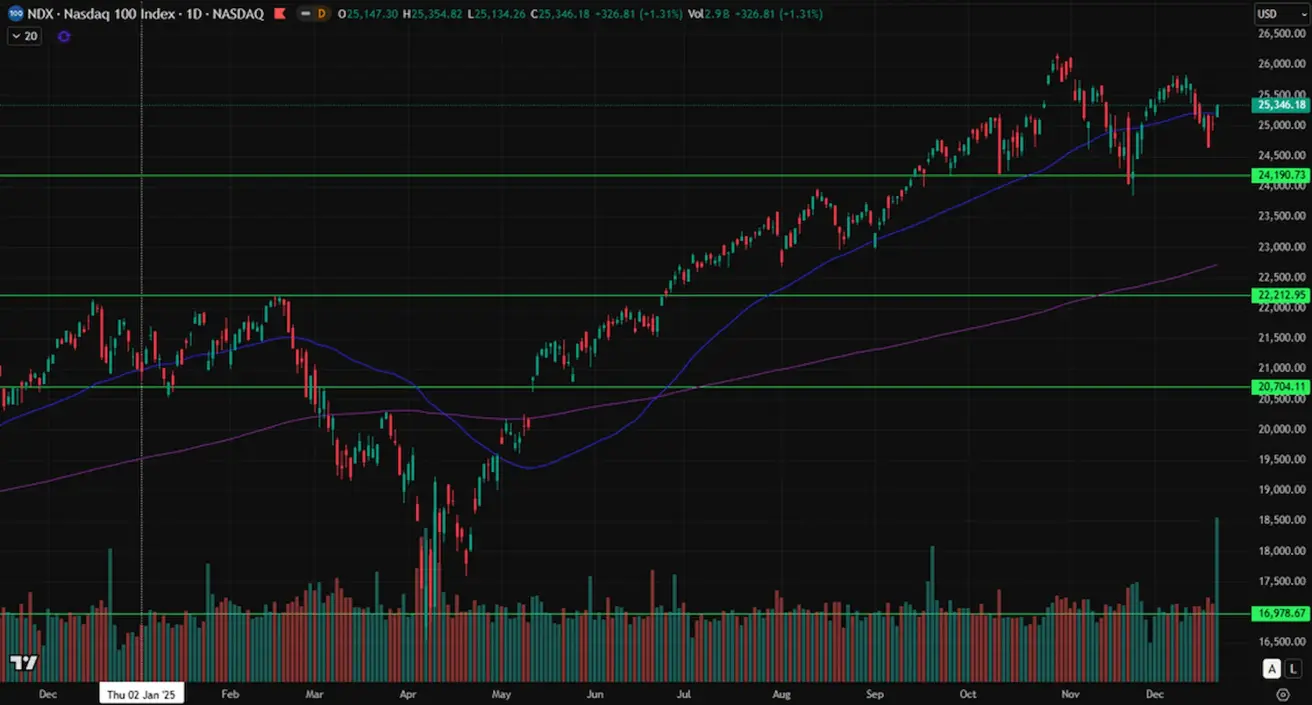
NASDAQ100
Апталық нәтиже: +0.59% (апта соңындағы жабылу: 25,346.18). Жыл басынан бергі табыстылық: +20.01%.
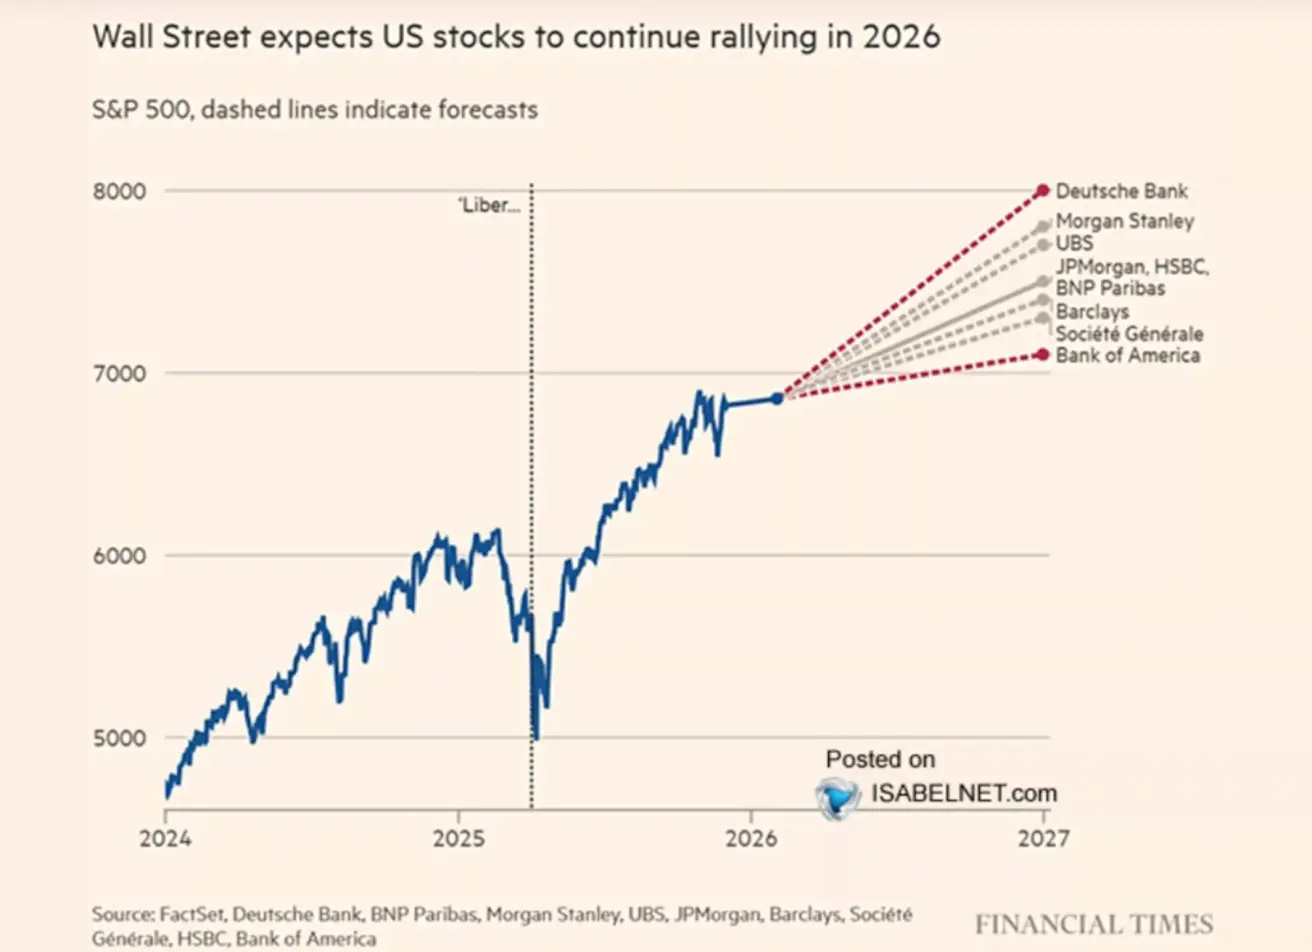
Ірі банктердің болжамына сәйкес, 2026 жылдың соңына қарай S&P 500 индексінің орташа деңгейі 7 500 тармаққа жетеді. Ең оптимистік болжам Deutsche Bank тарапынан – 8 000 тармақ.
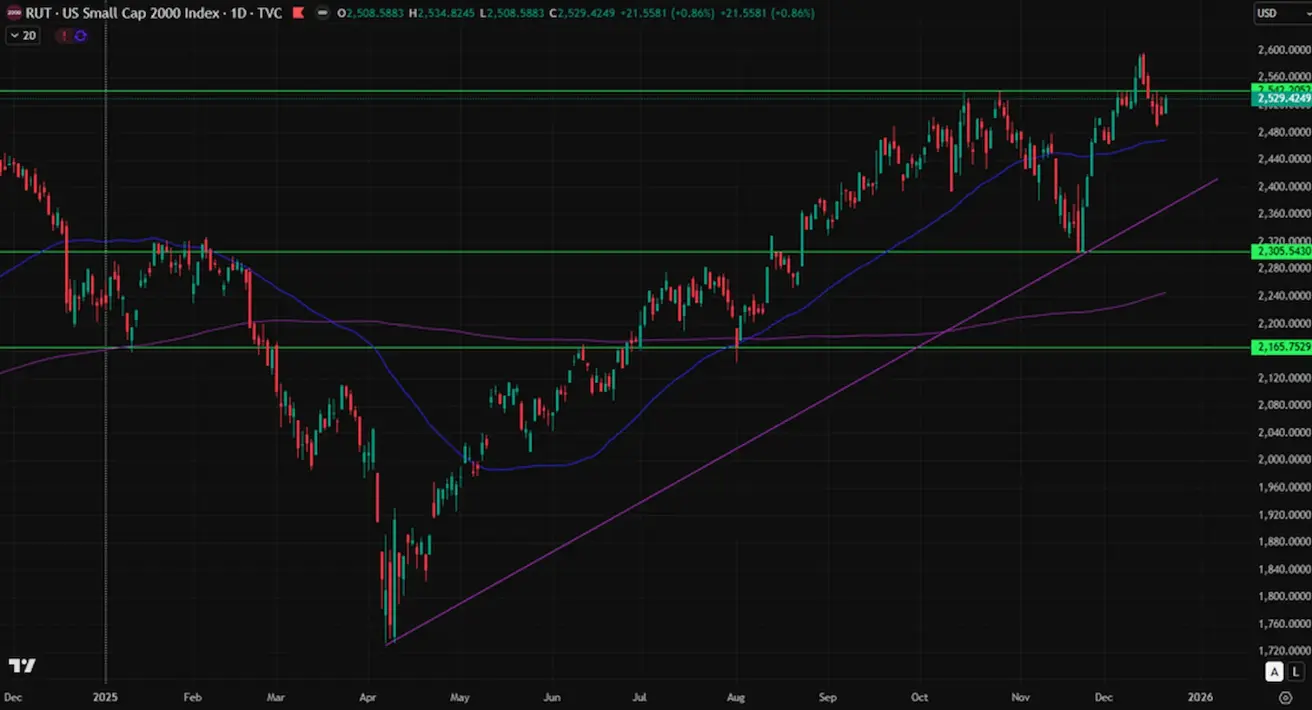
Russel 2000 (RUT)
Апталық нәтиже: -0,86% (апталық жабылу: 2529,42). Жыл басынан бергі нәтиже: +12,86%.
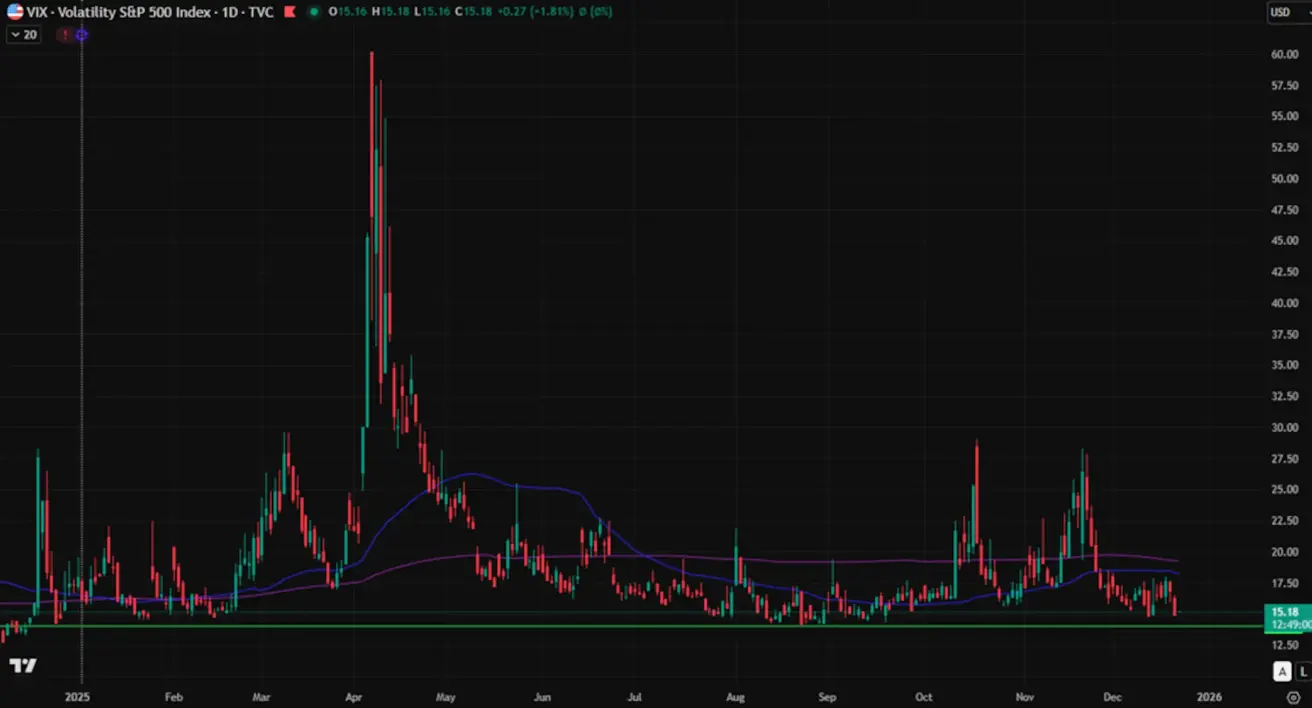
VIX
VIX төмен құбылмалылық режимінде қалып отыр, апта соңында 15.18 деңгейінде жабылды.
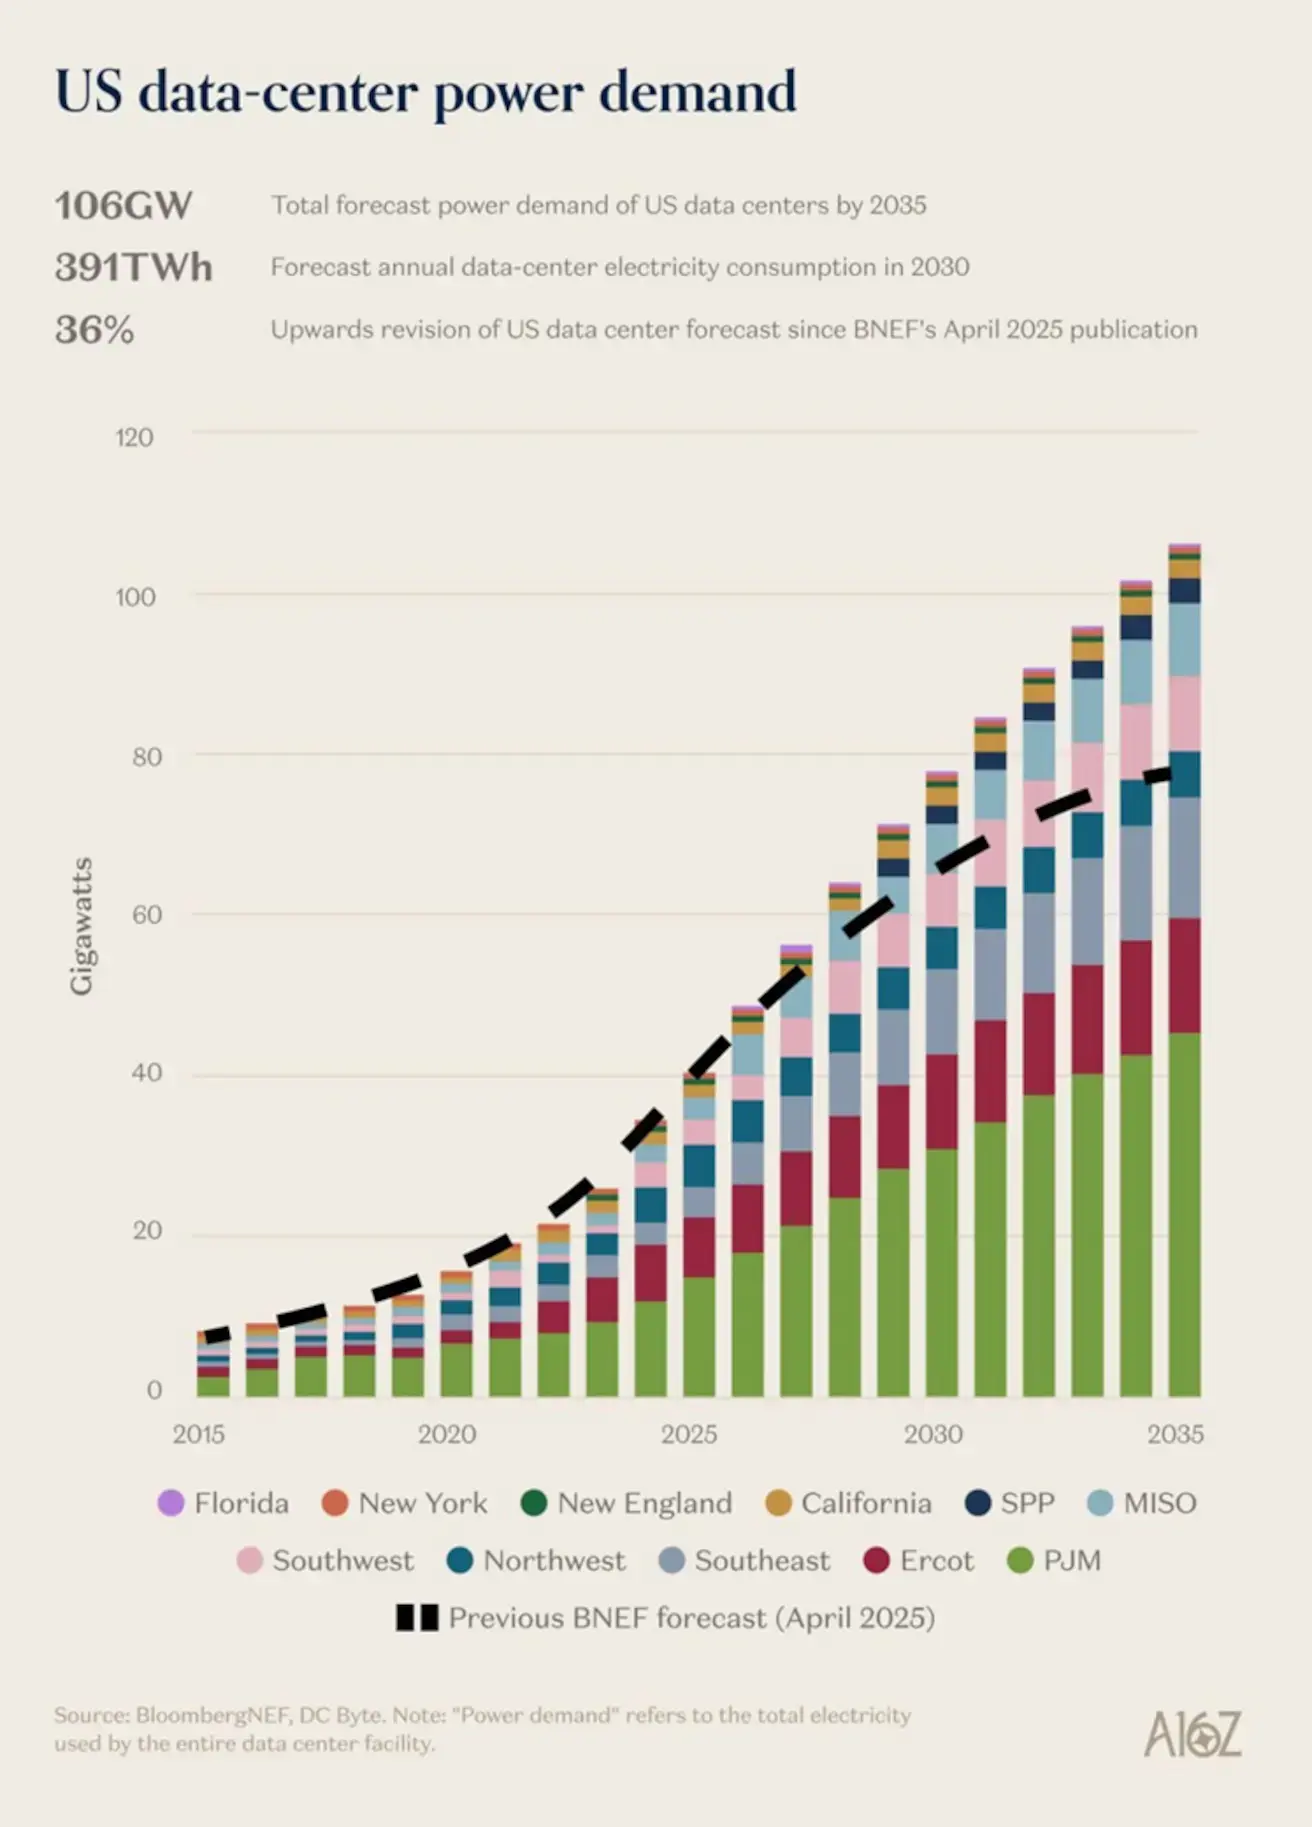
Диаграммада АҚШ-тағы деректер орталықтарының электр энергиясын тұтынуының 2015–2035 жылдар аралығындағы болжамды өсуі өңірлік энергетикалық жүйелер бөлінісінде көрсетілген.
Деректер орталықтарының электр энергиясына деген физикалық сұранысының өсуі қысқа мерзімді AI-driven әңгімесінен гөрі құрылымдық трендті білдіреді.
Негізгі қорытынды — сұраныс бағалаулары жоғары қарай қайта қарала беруде.
- 106 ГВт — 2035 жылға қарай АҚШ-та деректер орталықтарының орнатылған қуаттылығының күтілетін деңгейі
- 391 ТВтсағ — 2030 жылға қарай деректер орталықтарының жылдық болжамды электр тұтынуы
- +36% — алдыңғы бағалаумен салыстырғандағы жоғары қарай қайта қарау, BloombergNEF (2025 ж. сәуір)
Қара сызықша (пунктир) BloombergNEF-тің алдыңғы болжамын көрсетеді, ол 2025 жылдан кейінгі кезеңде ағымдағы бағандардан айтарлықтай төмен және күтілімдердің жоғары қарай қайта қаралу ауқымын айқын көрсетеді.
Консервативті сценарийлердің өзінде электр желілеріне, генерация қуаттарына және беру инфрақұрылымына түсетін жүктеме едәуір артады.
Елдер бойынша өнімділіктің тарихи трендтері:
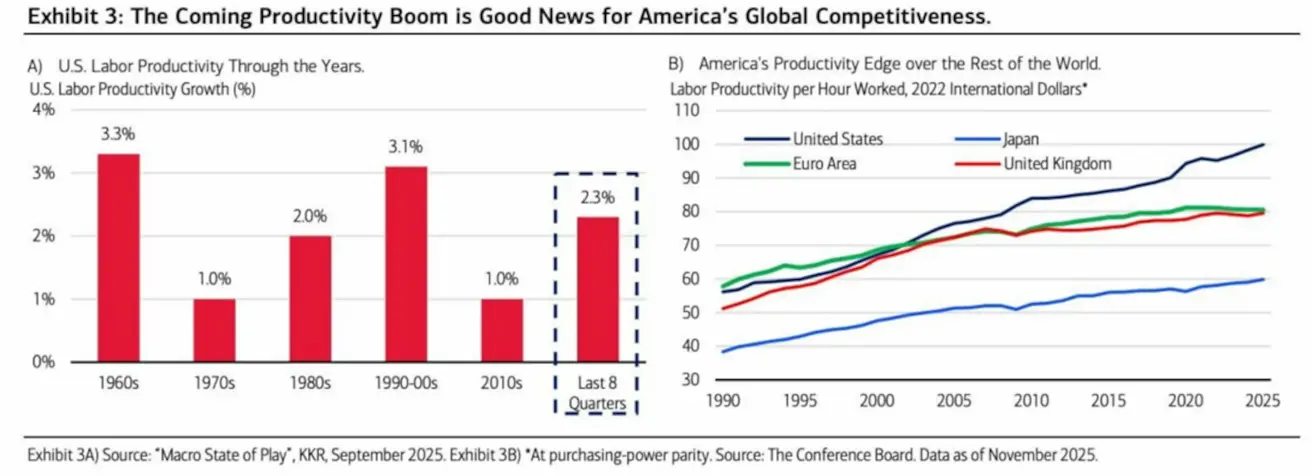
Сағаттық еңбек өнімділігі (САТТ, PPP) 1990 жылдан 2025 жылға дейінгі кезең бойынша көрсетілген:
- АҚШ — тұрақты және үдей түскен өсім, айқын жаһандық лидер
- Еуроаймақ пен Ұлыбритания — оң динамика, бірақ айтарлықтай әлсіз
- Жапония — айтарлықтай артта қалуда
АҚШ пен Еуропа мен Жапония арасындағы өнімділік алшақтығы тарылудың орнына ұлғаюда.
Өнімділіктің өсу салдары:
- Инфляциялық қысымның төмендеуі;
- Нақты ЖІӨ өсіміне қолдау;
- Экономика «қызып кетпей» кеңейе алады.
АҚШ өнімділік өсімінің жаңа циклына қадам басуда, бұл оның жаһандық бәсекелік артықшылығын күшейтеді. Бұл АҚШ экономикасы мен АҚШ активтері үшін базалық қолдау болып табылады.
Еуроаймақ
ЕОБ отырысы өтті, онда регулятор пайыздық мөлшерлемелерді өзгеріссіз қалдырып, алдағы екі жылға арналған ЖІӨ өсімі бойынша болжамдарын жоғары қарай қайта қарады.
Ақша-кредит саясаты
- Негізгі мөлшерлеме өзгеріссіз; инфляция бақылауда;
- Позициясы: бейтарап деңгейге жақын;
- ЕОБ біртіндеп инфляциядан экономикалық әлсіздік белгілеріне көбірек назар аудара бастады.
Пайыздық мөлшерлемелер:
- Депозиттік мөлшерлеме: 2.0% (бұрын: 2.0%);
- Маржалық кредиттеу мөлшерлемесі: 2.4% (бұрын: 2.4%) — банктердің орталық банктен бір түнге қарыз алу мөлшерлемесі;
- Қысқа мерзімді (саясаттық) мөлшерлеме: 2.15% (бұрын: 2.15%).
Инфляция: тұтыну бағалары индексі (CPI), қараша:
- Негізгі CPI (y/y): 2.4% (бұрын: 2.4%);
- CPI (m/m): −0.3% (бұрын: 0.2%);
- CPI (y/y): 2.1% (бұрын: 2.2%).
ЕОБ-тың инфляция бойынша болжамдары:
- 2025: 2.1%
- 2026: 1.9%
- 2027: 1.8%
- 2028: 2.0%
ЖІӨ, 3-тоқсан (қорытынды бағалау):
- q/q: 0.3% (бұрын: 0.1%);
- y/y: 1.4% (бұрын: 1.5%).
ЕОБ-тың ЖІӨ өсімі бойынша болжамдары:
- 2025 ж. ЖІӨ өсімі: 1.4%
- 2026 ж. ЖІӨ өсімі: 1.2%
- 2027 ж. ЖІӨ өсімі: 1.4%
- 2028 ж. ЖІӨ өсімі: 1.4%
Жұмыссыздық деңгейі (қазан): 6.4% (бұрын: 6.3%).
Сатып алу менеджерлерінің индексі (PMI), желтоқсан:
- Қызметтер: 52.6 (бұрын: 53.6);
- Өңдеу өнеркәсібі: 49.2 (бұрын: 49.6);
- S&P Global Composite: 51.9 (бұрын: 52.8).
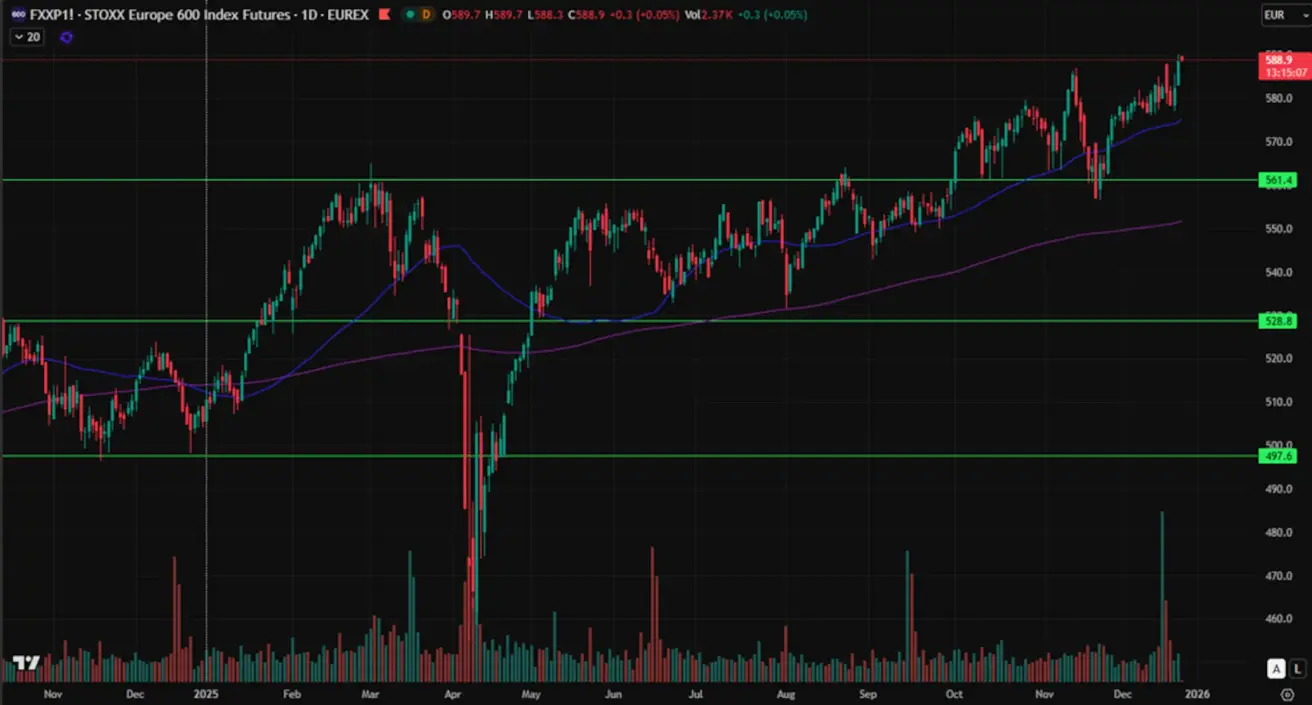
Euro Stoxx 600
Euro Stoxx 600 жұма күні жаңа тарихи максимумға жетті. Апталық нәтиже: +0.45% (апта соңындағы жабылу: 583.3). Жыл басынан бергі өсім: +15.37%.
Қытай:
Экономика экспорт есебінен тұрақтанып келеді, ал ішкі сұраныс пен инвестициялар әлсіз күйде; саясаттық қолдау нысаналы әрі сақ болып қалуда.
Ақша-кредит саясаты
- Негізгі мөлшерлемелер өзгеріссіз;
- Позициясы: ынталандырушы, бірақ нысаналы;
- Қытай экономикаға қолдау көрсетіп отыр, бірақ ауқымды ынталандыру пакетін әлі іске қосқан жоқ.
Пайыздық мөлшерлемелер:
- 1Y Loan Prime Rate (орта мерзімді кредиттеу): 3.50%;
- 5Y Loan Prime Rate (ипотекаға ықпал ететін бес жылдық мөлшерлеме): 3.50%.
Инфляциялық индикаторлар (қазан):
-
Тұтыну бағалары индексі (CPI, m/m): −0.1% (бұрын: 0.2%);
-
CPI (y/y): 0.7% (бұрын: 0.2%).
-
Өндіруші бағалар индексі (PPI, y/y): −2.2% (бұрын: -2.1%).
-
Жұмыссыздық деңгейі (қараша): 5.1% (бұрын: 5.1%);
-
Өнеркәсіптік өндіріс (қараша, y/y): 4.8% (4.9%-бен салыстырғанда);
-
Негізгі капиталға инвестициялар (қараша, y/y): −2.6% (−1.7%-мен салыстырғанда);
-
Бөлшек сауда (қараша, y/y): 1.3% (2.9%-бен салыстырғанда).
-
Импорт (желтоқсан, y/y): 1.9% (1.0%-мен салыстырғанда);
-
Экспорт (желтоқсан, y/y): 5.9% (−1.1%-мен салыстырғанда);
-
Сауда балансы (АҚШ доллары, желтоқсан): 111.68 млрд АҚШ долл. (90.7 млрд АҚШ долл.-мен салыстырғанда).
Сатып алу менеджерлерінің индекстері (PMI), қараша:
- Өңдеу өнеркәсібі: 49.2 (бұрын: 49.0);
- Өңдеуден тыс сектор: 49.0 (бұрын: 49.0);
- Композиттік PMI: 49.5 (бұрын: 50.1).
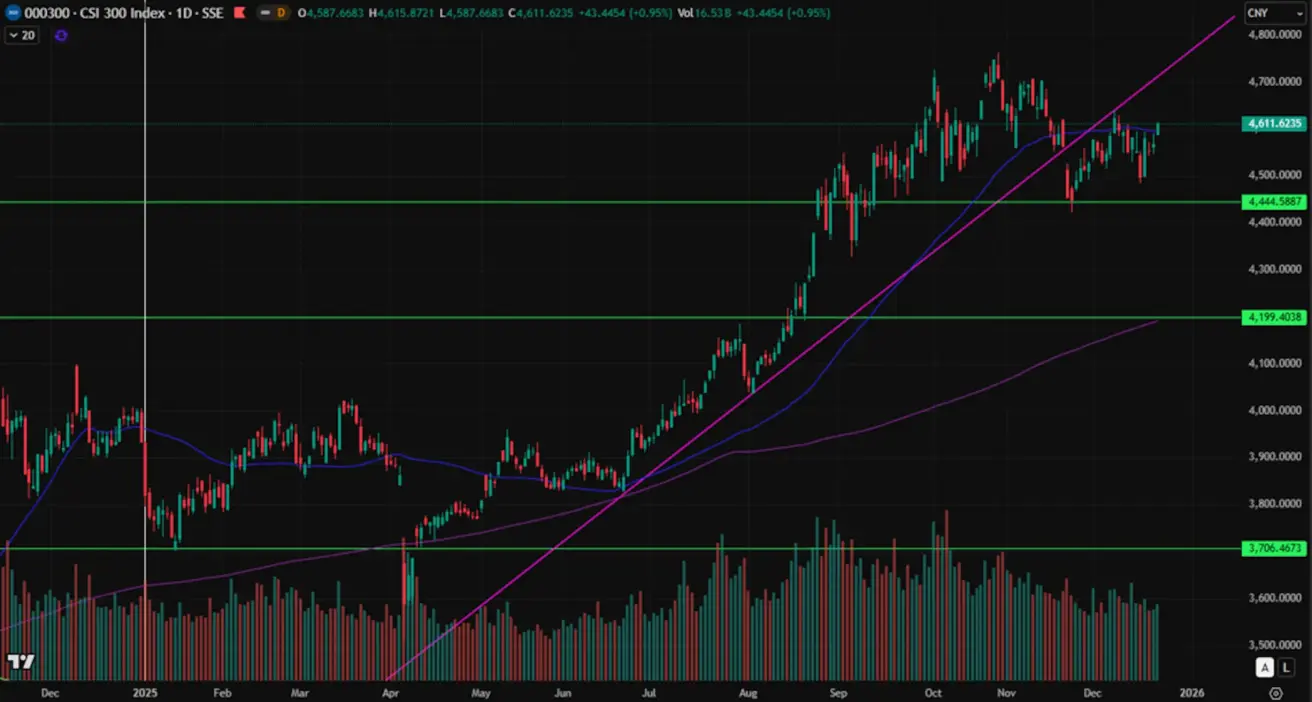
CSI 300 индексі
Апталық нәтиже: −0.28% (апталық жабылу: 4,568.17); жыл басынан бергі нәтиже: +16.21%.
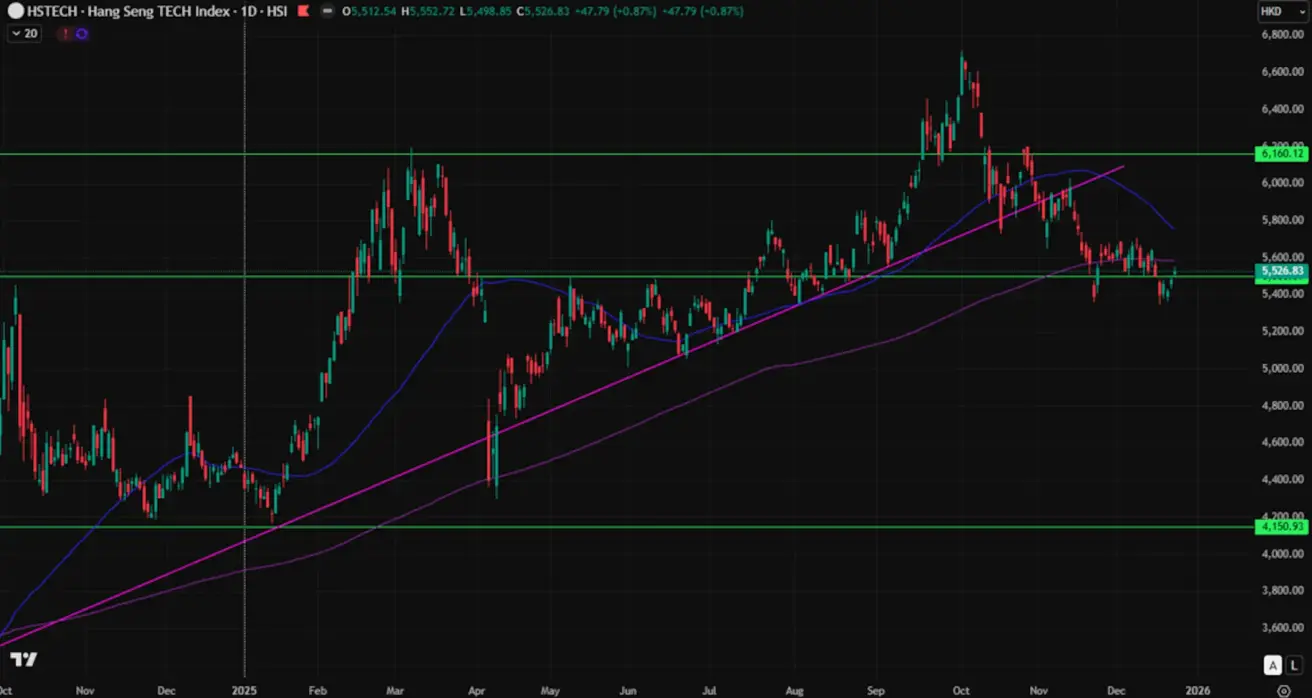
Hang Seng TECH Index HSTECH.HK
Апталық нәтиже: −2.82% (апталық жабылу: 5,479.04); жыл басынан бергі нәтиже: +23.49%.
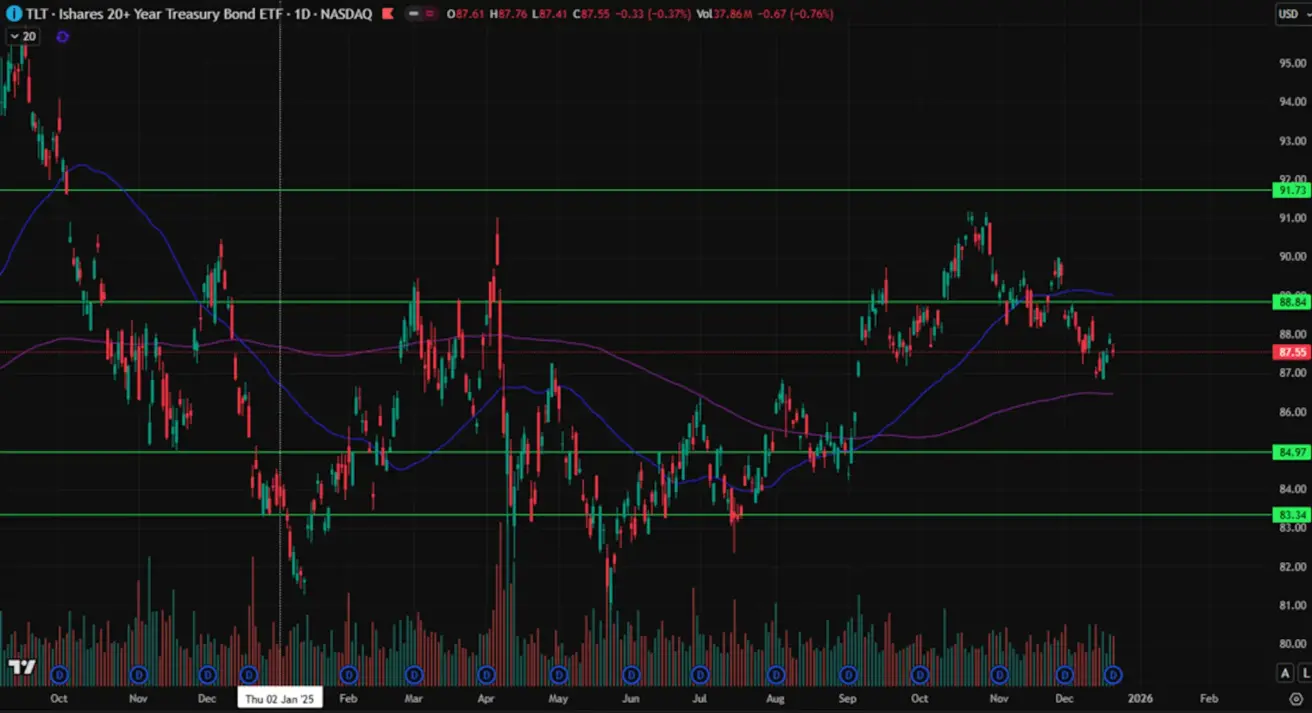
ОБЛИГАЦИЯЛАР НАРЫҒЫ – дерлік бейтарап динамика
20+ жылдық АҚШ қазынашылық облигациялары (ETF TLT): апта бойынша: +0.24% (апталық жабылу: 87.55). 2025 жыл үшін: −0.28%.
Өнімділік және спредтер
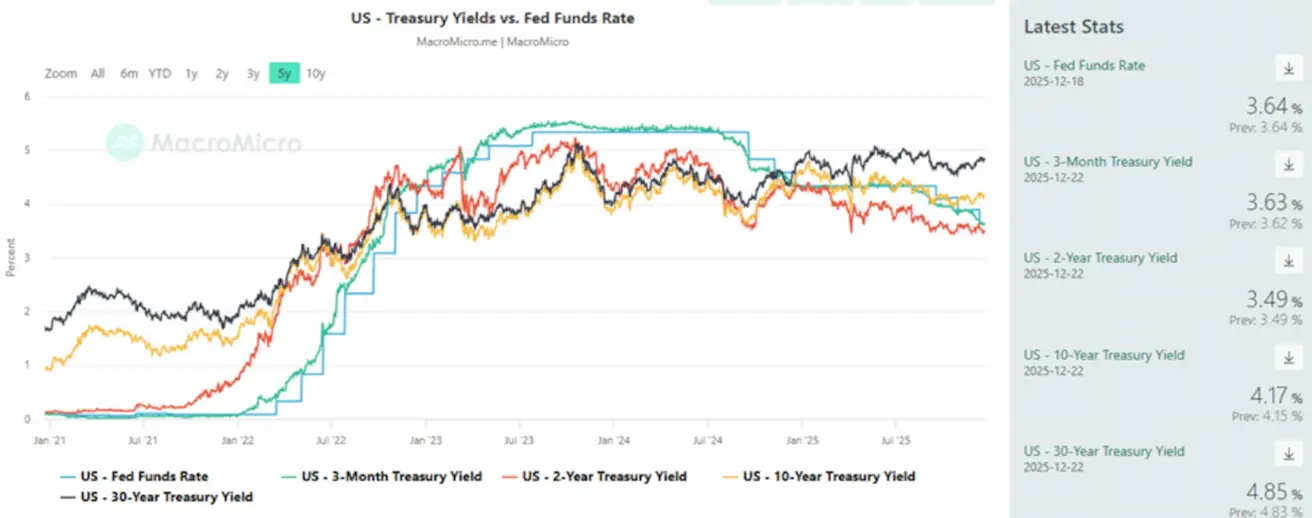
- 10 жылдық АҚШ қазынашылық облигацияларының тұрақты өтеу мерзімі бар (constant maturity) нарықтық кірістілігі: 4.17% (4.18%-мен салыстырғанда);
- 2 жылдық қазынашылық облигациялар кірістілігі: 3.63% (3.51%-мен салыстырғанда);
- ICE BofA BBB U.S. Corporate Index Effective Yield: 5.00% (5.02%-мен салыстырғанда).
- 10 жылдық және 2 жылдық АҚШ қазынашылық облигациялары кірістіліктері арасындағы спрэд: 68 б.п. (67 б.п.-мен салыстырғанда);
- 10 жылдық және 3 айлық АҚШ қазынашылық облигациялары кірістіліктері арасындағы спрэд: 54 б.п. (54 б.п.-мен салыстырғанда).
Дефолт тәуекелін сақтандыру құралы болып табылатын 5 жылдық АҚШ кредиттік дефолт свопының (CDS) құны 26.99 б.п. деңгейінде (өткен аптадағы 27.88 б.п.-пен салыстырғанда).
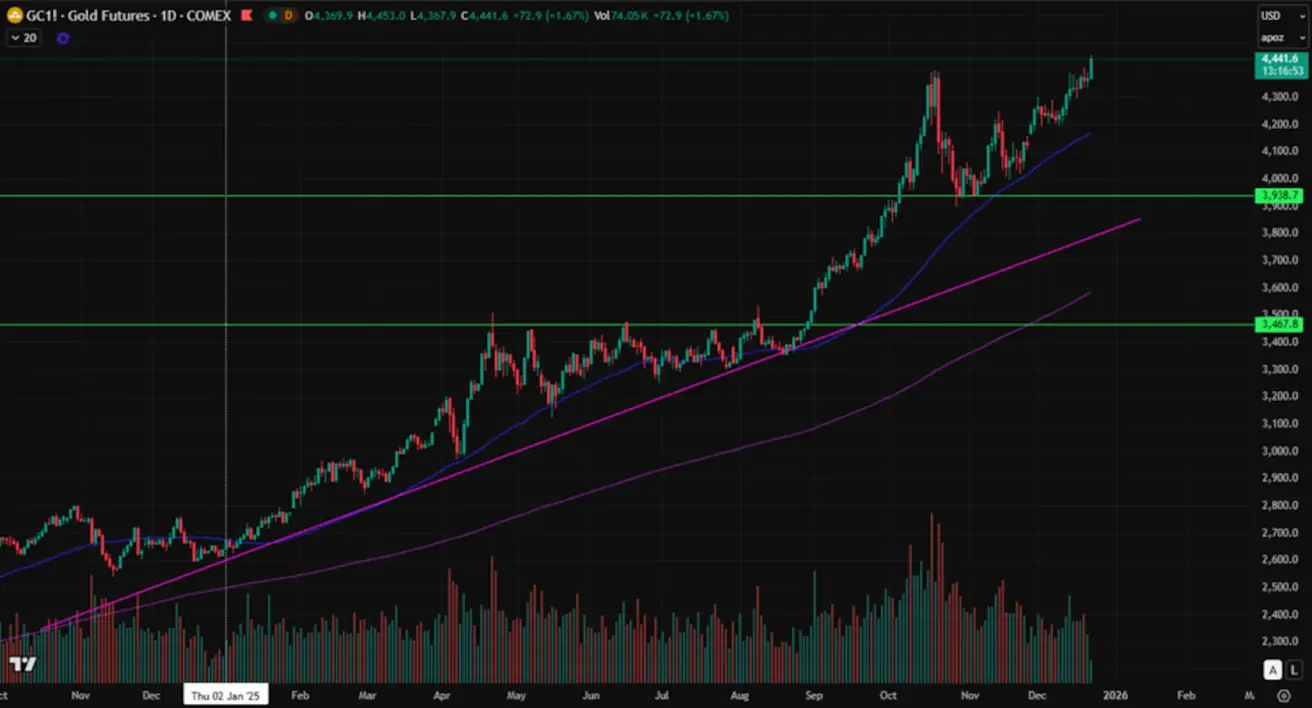
АЛТЫН ФЬЮЧЕРСТЕРІ (GC)
Апталық нәтиже: +0.90% (апталық жабылу: 4,368.07 АҚШ долл./трой унция). Жыл басынан бергі өсім: +65.42%.
Жаһандық қарыздың өсуі алтын бағасының жоғарылауына ықпал етуде. Алтын бағасы мен қарызға қызмет көрсету шығындарының өсуі арасында күшті корреляция бар: 2022 жылдан бері пайыздық шығыстар 40%-ға (+1,7 трлн АҚШ долл.) артты, ал алтын бағасы 142%-ға өсті.
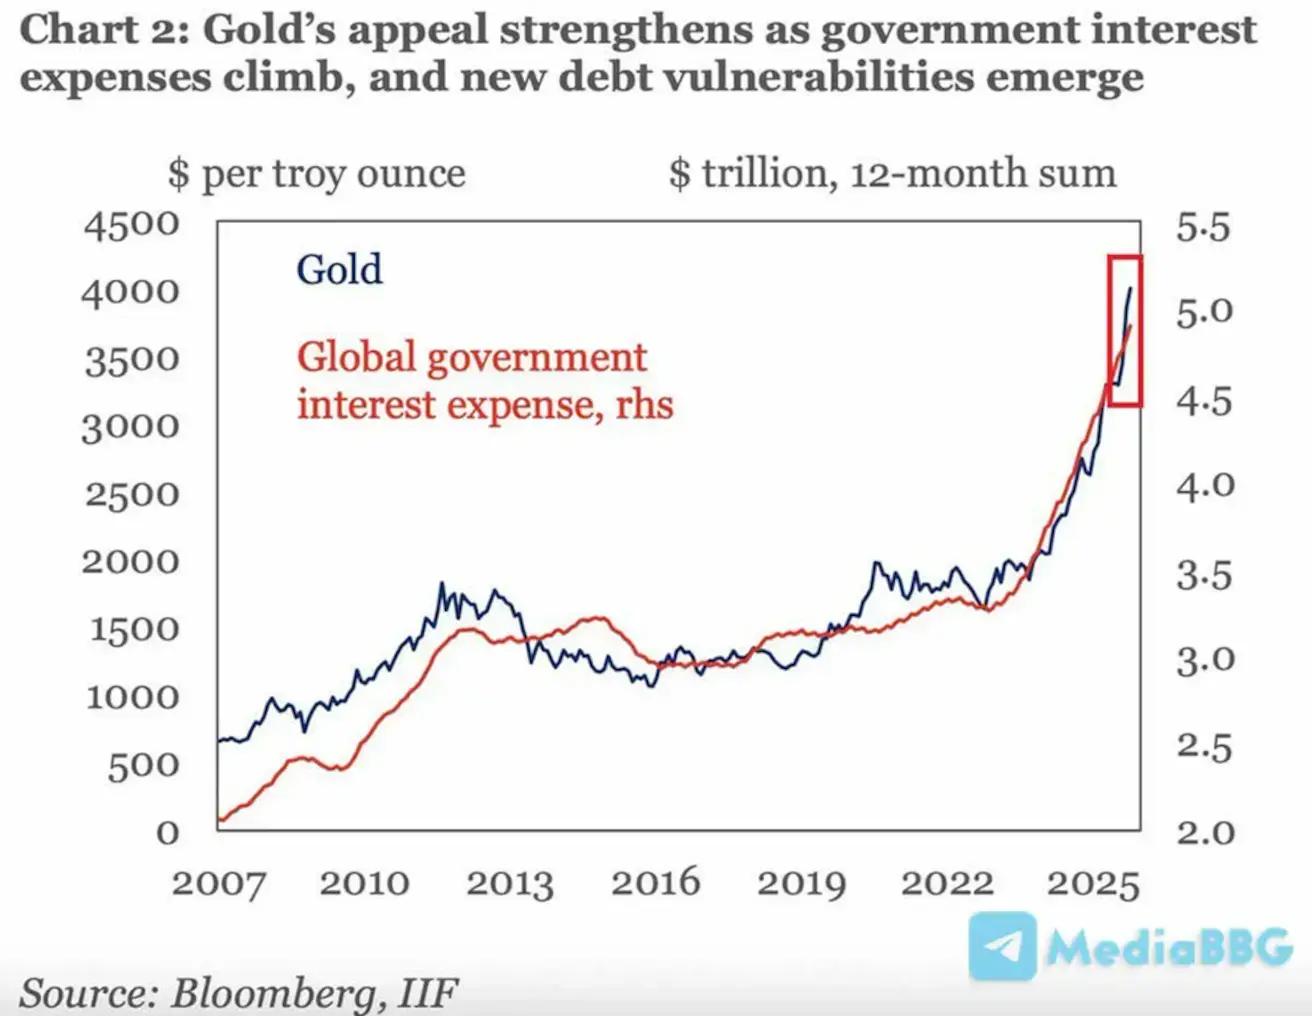
Goldman Sachs-тың соңғы болжамдары:
- Орталық банктердің сұранысы жоғары деңгейде қалуда: қазанда сатып алулар 49 тонна болды, бұл 2022 жылға дейінгі орташа 17 тоннамен салыстырғанда; негізгі сатып алушылар — Катар (20 тонна) және Қытай (15 тонна), бұл геосаяси тәуекелдерді хеджирлеудің жалғасып жатқанын көрсетеді.
- Алтын бағасы бойынша мақсатты деңгей: GS алтын бағасы 2026 жылға қарай 4 900 АҚШ долл./унция деңгейіне дейін өседі деп күтеді, оған орталық банктердің сатып алулары және Федералдық резерв саясатының жұмсаруы драйвер болады.
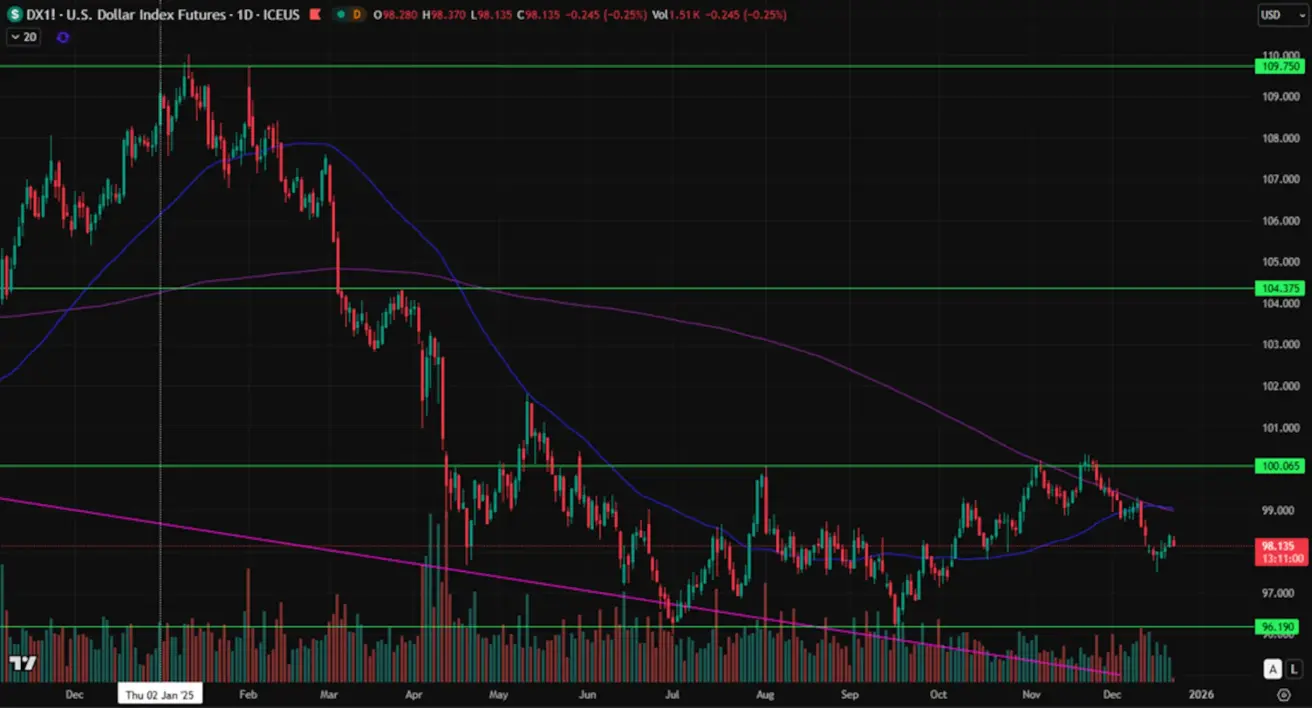
ДОЛЛАР ИНДЕКСІ ФЬЮЧЕРСТЕРІ (DX)
Апталық нәтиже: +0.37%; апталық жабылу: 98.38; 2025 жыл үшін: −9.18%.
МҰНАЙ ФЬЮЧЕРСТЕРІ
Апталық нәтиже: -1.72% (апталық жабылу: $56.54/баррель). Жыл басынан бергі нәтиже: −21.31%.
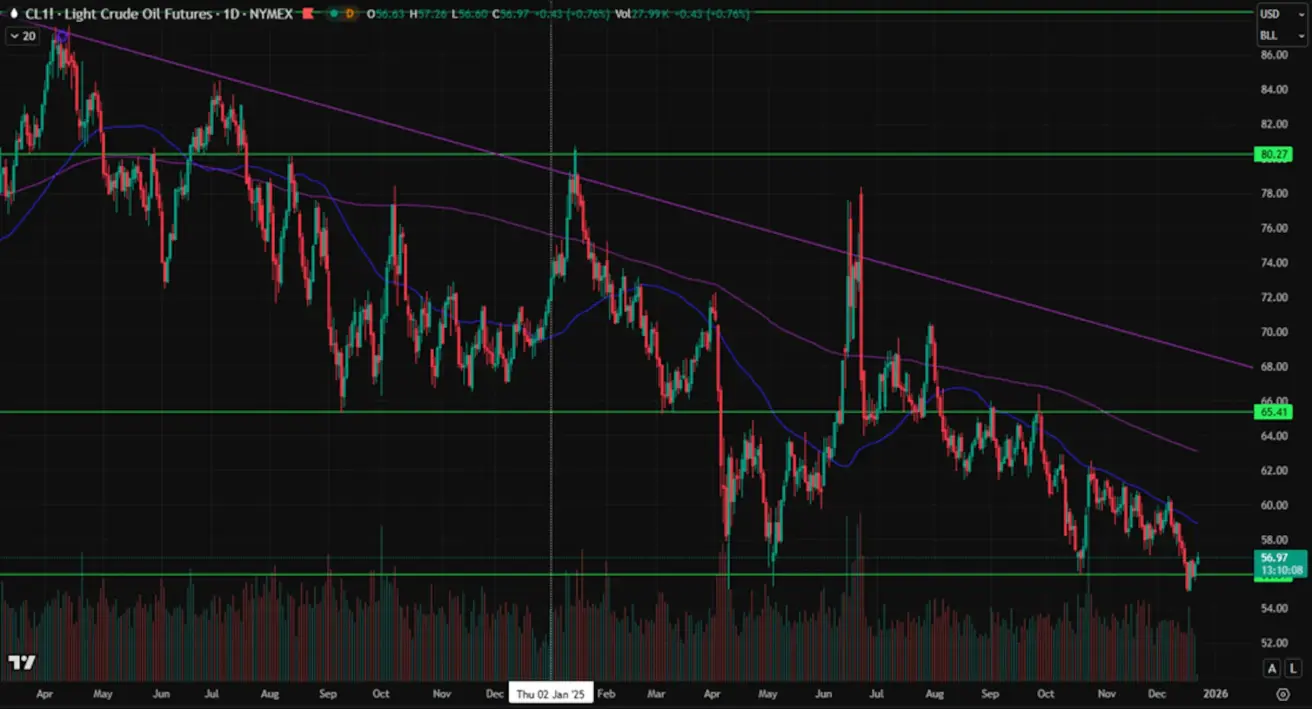
Мұнай бағасы геосаяси тәуекелдік сыйлықақының бір бөлігінің жойылуы күтуіне, жаһандық ұсыныс профициті перспективасына және Қытайдан келіп түскен әлсіз макродеректерге байланысты төмендеуде.
Криптовалюталар
Ағымдағы жағдайда криптовалюталар жаһандық өтімділік пен тәуекелге тәбеттің жағдайын көрсетеді: нарық барған сайын институционалдық сипат алуда, алыпсатарлық «қызып кетудің» белгілері жоқ.
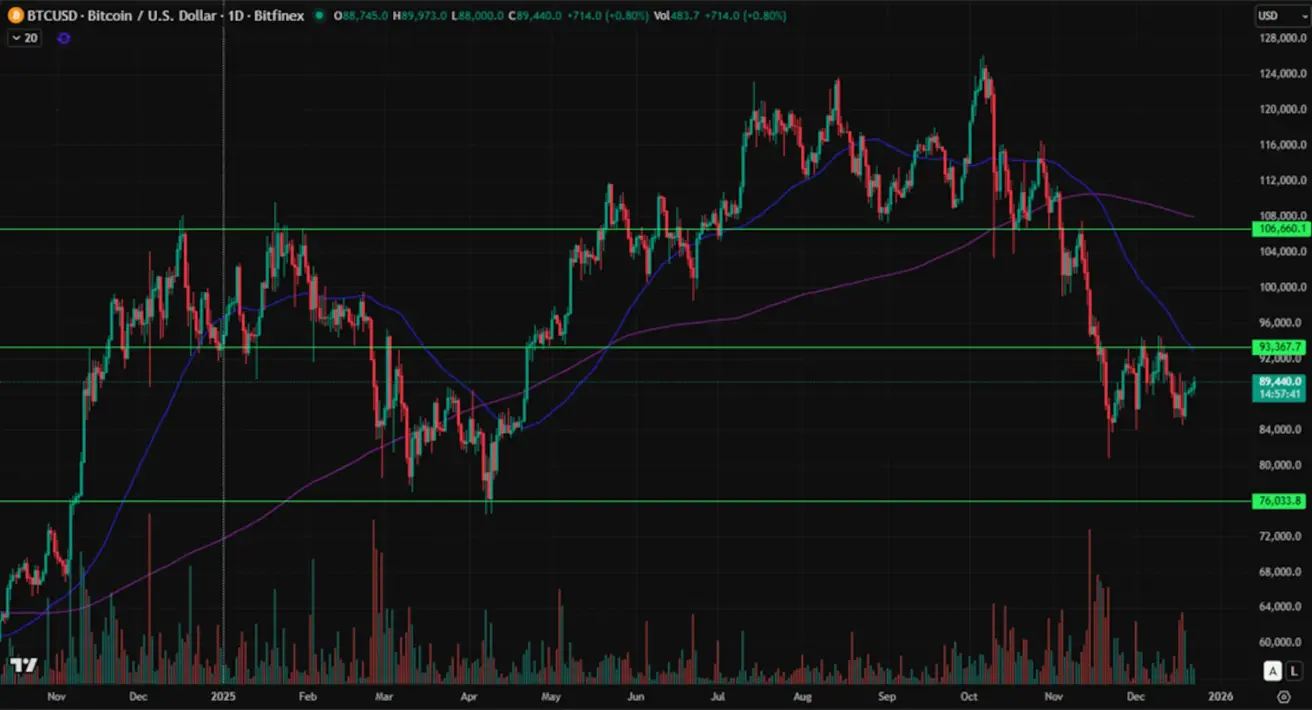
BTC ФЬЮЧЕРСТЕРІ
Апталық нәтиже: +0.62% (апталық жабылу: 88 726 АҚШ долл.). Жыл басынан бергі нәтиже: −5.37%.
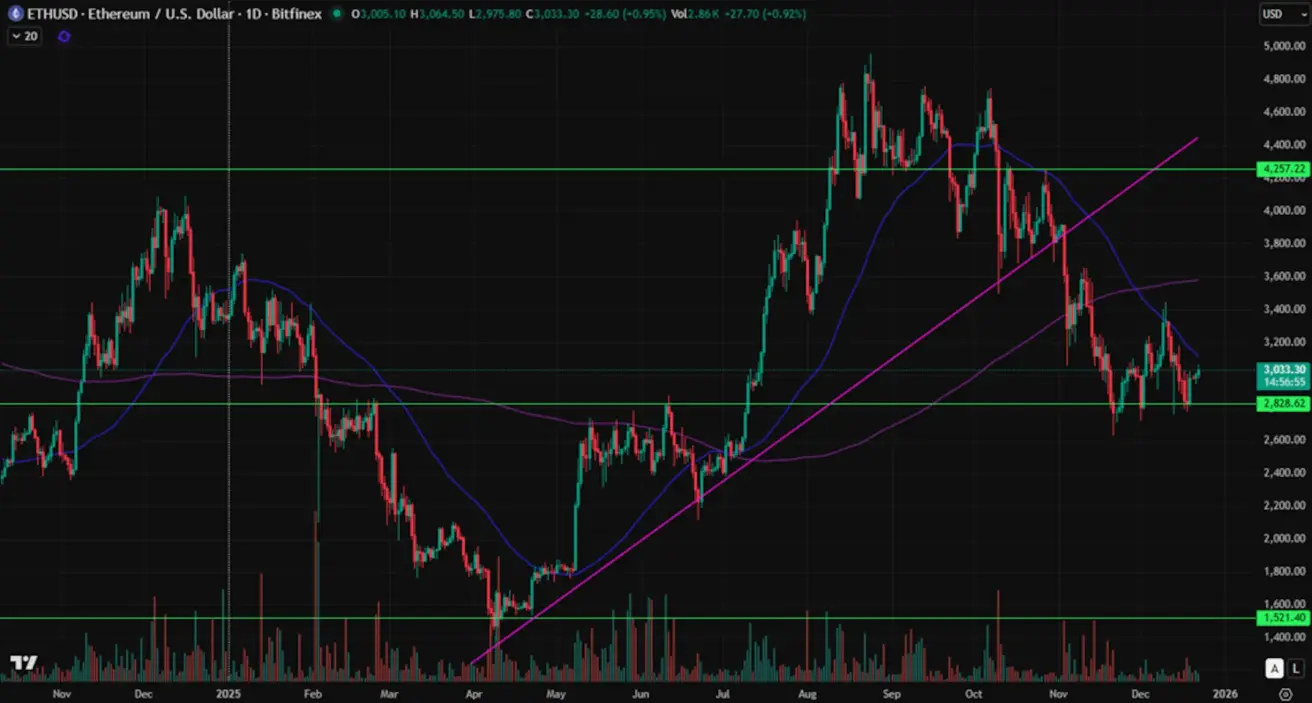
ETH ФЬЮЧЕРСТЕРІ
Апталық нәтиже: -1.88% (апталық жабылу: 3 004.7 АҚШ долл.). Жыл басынан бергі нәтиже: −10.15%.
Жалпы криптовалюта нарығының капитализациясы CoinMarketCap деректері бойынша 3.02 трлн АҚШ долларын құрайды (бір апта бұрын: 3.06 трлн АҚШ долл.).
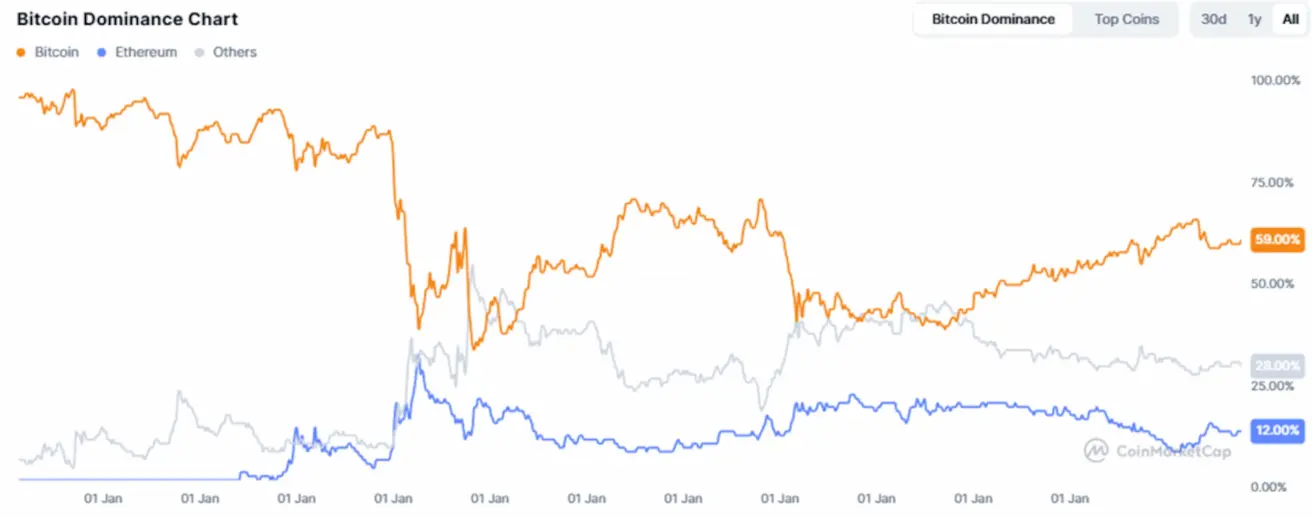
Криптонарықтағы үлестер:
- Bitcoin: 59.1% (58.6%);
- Ethereum: 12.1% (12.4%);
- Басқалары: 28.8% (29.0%).
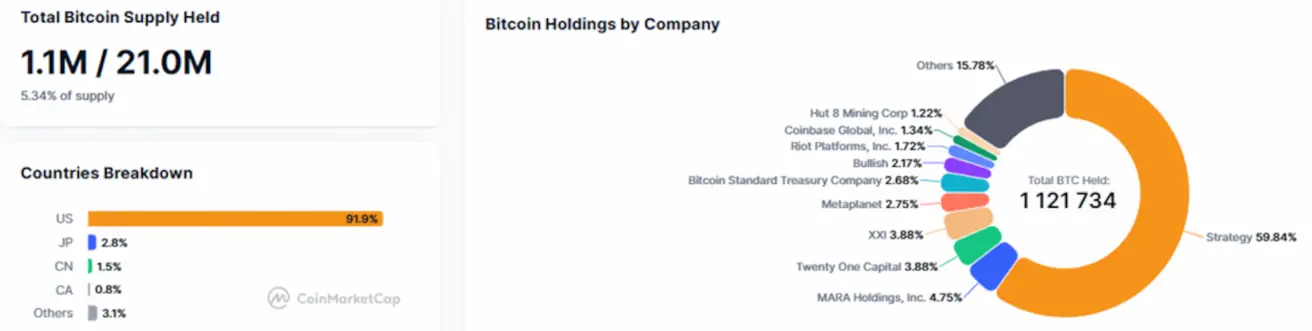
Қоғамдық компаниялар Bitcoin-ді қазынашылық стратегиясының бөлігі ретінде пайдалануда. Корпоративтік баланстарда ұсталған биткоиндердің үлесі жалпы Bitcoin ұсынысының 5.34%-ын құрайды (өткен аптадағы 5.30%-ға қарсы):
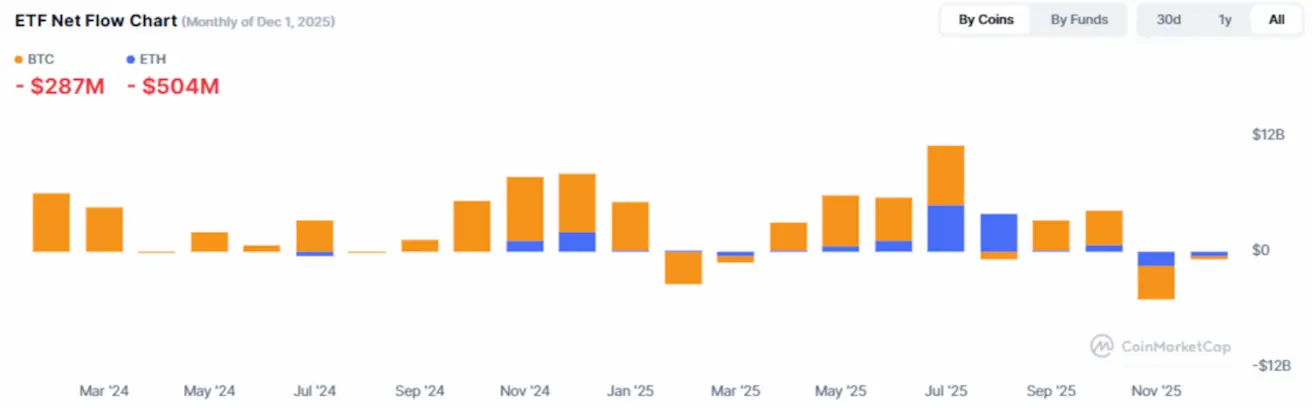
ETF-тер бойынша нетто-құйылымдар диаграммасы: