English
 Lietuvių
 Русский
 Eesti
Eesti2026 жылғы 23–28 ақпан: Апталық экономикалық шолу
Негізгі нарық жаңалықтары
Әскери қақтығыс АҚШ, Израиль және Иран арасында басты назарда қалып отыр. Алайда, қақтығысқа тағы да басқа елдер тартылуда. Трамп келіссөздерді бастауға ашық екенін мәлімдеді, ал Иран өкілдері әзірге келіссөздерге түбегейлі қарсы. Акция индекстері төмендеумен ашылды. АҚШ-та өндіруші бағаларының инфляциясы (PPI) күрт өсуде. Еуроаймақта тұтыну инфляциясының (CPI) төмендеуі жалғасуда. Дүйсенбі күні мұнай мен алтын бағасы күрт өсті. Криптовалюталар бейтарап реакция танытты.
АҚШ (негізгі тармақтар)
- Ставка өзгеріссіз қалды, риторика сақтықпен жүргізілуде;
- Ақша-несие саясаты қалыпты шектеулі → бейтарапқа жақындауда;
- Федералдық резерв нарықтарды қолдай отырып, ставкаларды жедел төмендету туралы белгі бермей, тепе-теңдікті сақтауда;
- АҚШ макроэкономикалық деректері жұмсақ қону сценарийін растайды: экономикалық өсім әлеуеттен жоғары, инфляция баяулап келеді, еңбек нарығы рецессия белгілерінсіз баяу салқындауда.
ИНФЛЯЦИЯ: ТҰТЫНУ БАҒАЛАРЫ ИНДЕКСІ (ҚАҢТАР):
- Негізгі CPI: (ай/ай) 0,2% (бұрын: 0,2%); (жыл/жыл) 2,6% (бұрын: 2,6%).
- CPI: (ай/ай) 0,3% (бұрын: 0,3%); (жыл/жыл) 2,7% (бұрын: 2,7%).
ӨНДІРУШІ БАҒАЛАР ИНДЕКСІ (ҚАҢТАР):
- PPI (ай/ай): 0,5%, бұрын: 0,2%.
- Негізгі PPI (ай/ай): 0,7%, бұрын: 0,0% (қайта қаралған):
Ауқымы бойынша, бұл соңғы бір жылдағы ең күшті айлық өсімдердің бірі, 2021–2022 жылдардағы секірістерден кейін. Өндіруші инфляциясы тарихи тұрғыда инфляцияның алдыңғы көрсеткіші болып табылады, бірақ бұл жаңа инфляциялық трендтің басталуы деп айтуға әлі ерте. Нарық мұны құбылмалылық ретінде қабылдайды. Тұтыну инфляциясы индекстері, тұтынушылық шығындар және инфляциялық күтулер жалпы төмендеуде, ал PPI өсіп жатқанда, олардың алдағы жарияланымдары назарда болады.
ИНФЛЯЦИЯЛЫҚ КҮТУЛЕР (МИЧИГАН) (АҚПАН):
- 12 айлық инфляциялық күтулер: 3,4%, бұрын: 4,0%.
- 5 жылдық инфляциялық күтулер: 3,3%, бұрын: 3,3%.
ЖІӨ (АҚШ Экономикалық талдау бюросы, BEA) (4-тоқсан 25, жылдық, екінші бағалау): +4,4% (2-тоқсан 25: +3,8%)
Атланта Федералдық резерв банкінің GDPNow индикаторы (ресми көрсеткіштің жариялануына дейінгі "ағымдағы" бағалау): 3,1% (бұрын: 3,0%).
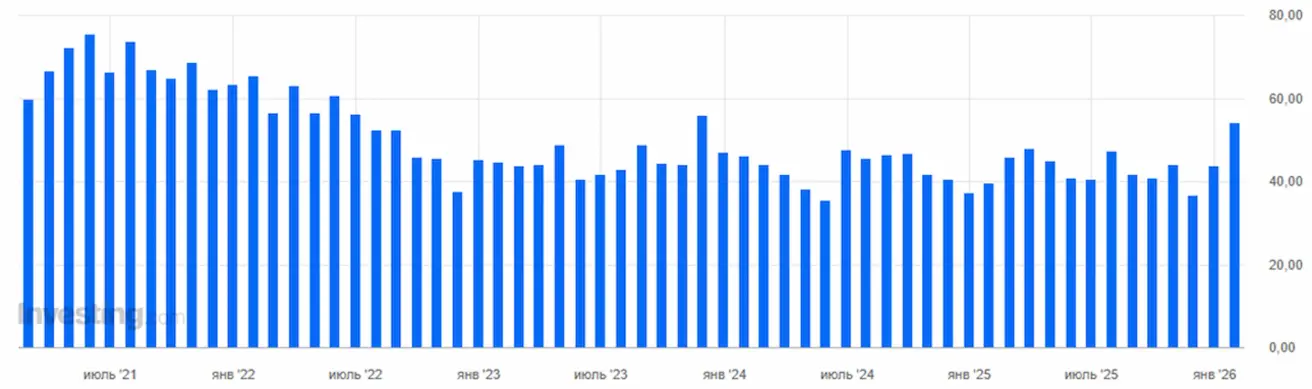
Чикаго іскерлік белсенділік индексі (PMI), АҚШ: 54,0 (бұрын: 42,7):
ІСКЕРЛІК БЕЛСЕНДІЛІК ИНДЕКСІ (PMI) (АҚПАН):
(50-ден жоғары – кеңею, 50-ден төмен – қысқару)
- Қызмет көрсету секторы: 52,3 (бұрын: 52,7);
- Өндірістік сектор: 51,2 (бұрын: 52,4);
- S&P Global Composite: 52,3 (бұрын: 53,0).
ЕҢБЕК НАРЫҒЫ (BLS) (АҚПАН)
- Жұмыссыздық деңгейі: 4,3% (бұрын: 4,4%);
- АҚШ-тағы жұмыссыздық бойынша тұрақты жәрдемақы алушылардың жалпы саны: 1 833 мың (бұрын: 1 869 мың);
- Алғашқы жұмыссыздық өтінімдері: 212 мың (бұрын: 208 мың, қайта қаралған);
- Еңбекпен қамтылғандар санының ауыл шаруашылығынан тыс өзгерісі: 130 мың (бұрын: 48 мың);
- Жеке сектордағы ауыл шаруашылығынан тыс еңбекпен қамтылғандар санының өзгерісі: 172 мың (бұрын: −64 мың);
- Орташа сағаттық жалақы (жыл/жыл): 3,7% (бұрын: 3,8%);
- JOLTS бос жұмыс орындары: 6,542 млн (бұрын: 6,928 млн).
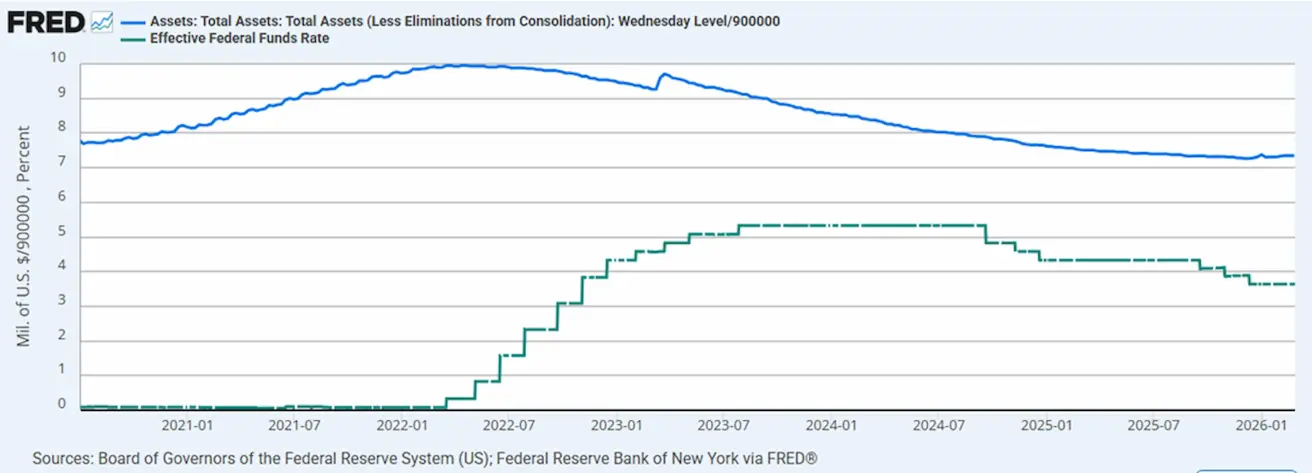
АҚША-НЕСИЕ САЯСАТЫ
- Федералдық қорлар бойынша тиімді мөлшерлеме (EFFR): 3,50%–3,75%;
- Федералдық резерв балансы: $6,613 трлн, сандық қатаңдатуды (QT) тоқтатқаннан бері 1,19% өсті ($6,535 трлн).
FRED: Овернайт репо операциялары (уақытша ашық нарық операциялары) — Федералдық резервтің қазынашылық бағалы қағаздарын репо арқылы сатып алуы:
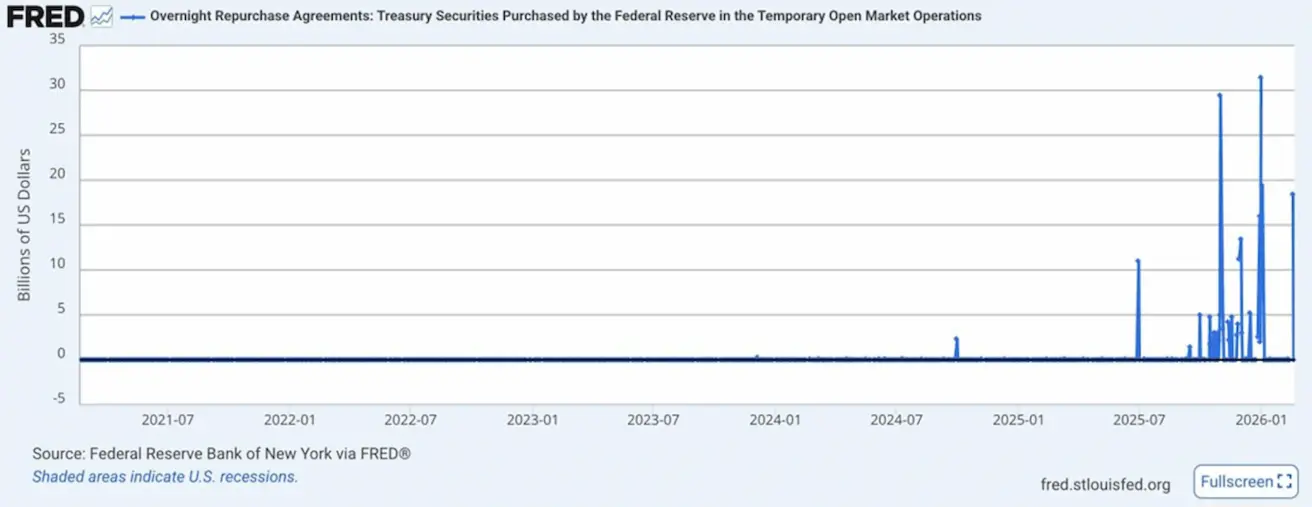
2025 жылдың соңында және 2026 жылдың басында репо көлемінің күрт әрі жиі секірістері байқалады (30 млрд долларға дейін). Бұл Федералдық резервтің нарыққа қысқа мерзімді өтімділікті репо операциялары арқылы мезгіл-мезгіл беретінін білдіреді. Қарапайым тілмен айтқанда, репо — бұл Федералдық резерв:
- банктерден қазынашылық бағалы қағаздарды сатып алады,
- оларға қолма-қол ақша береді,
- және қысқа мерзімнен кейін бағалы қағаздар қайтарылады. Бұл уақытша өтімділік енгізу, толыққанды сандық жұмсарту (QE) емес. Репо операциялары көлемінің өсуі ақша нарығындағы мезгілдік күйзеліс эпизодтарын көрсетеді, оларды Федералдық резерв уақытша өтімділікпен жұмсартады. Бұл техникалық сипатта және әзірге ақша-несие саясатының бағытының өзгеруін білдірмейді.
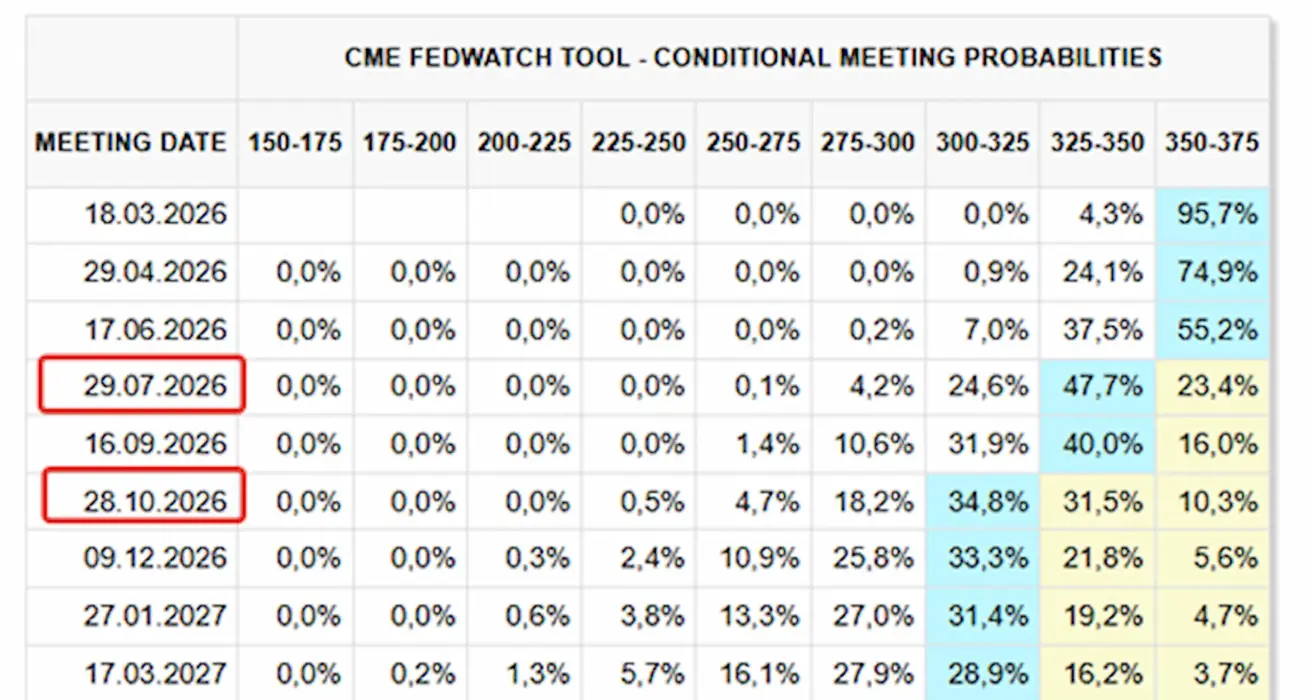
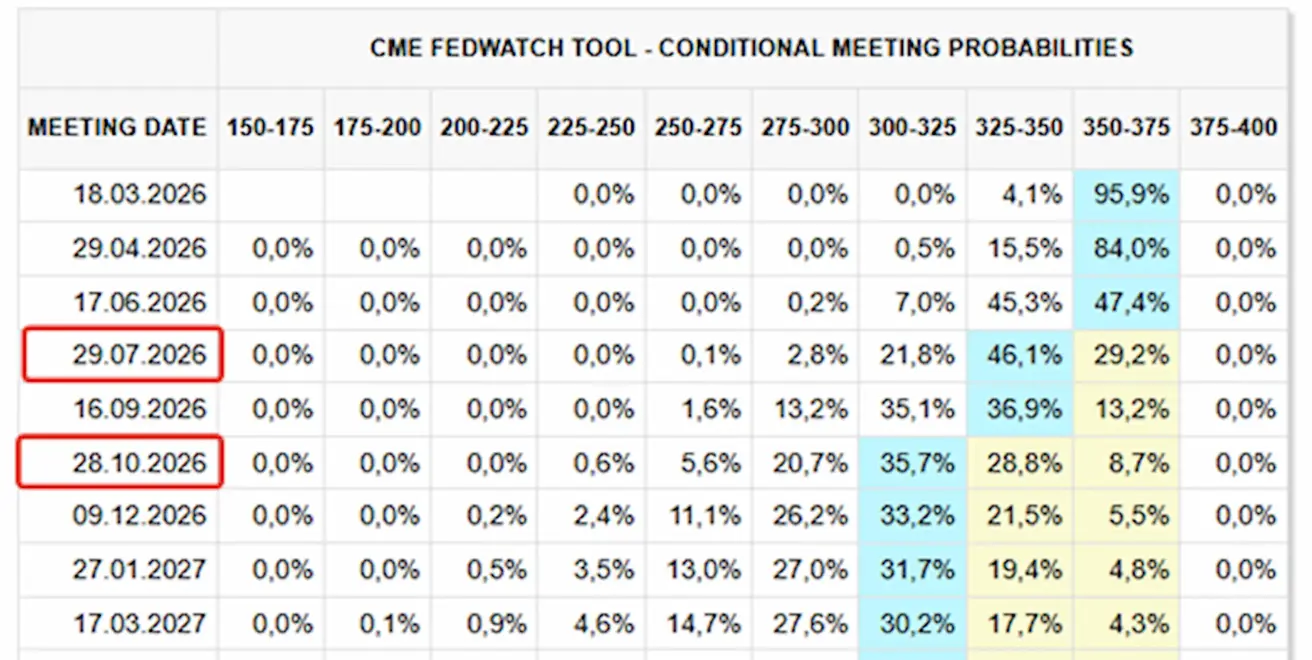
СТАВКА БОЙЫНША НАРЫҚ БОЛЖАМЫ (FEDWATCH)
Келесі отырыста (18 наурыз): 0,25% ставканы төмендету ықтималдығы 4,28%:
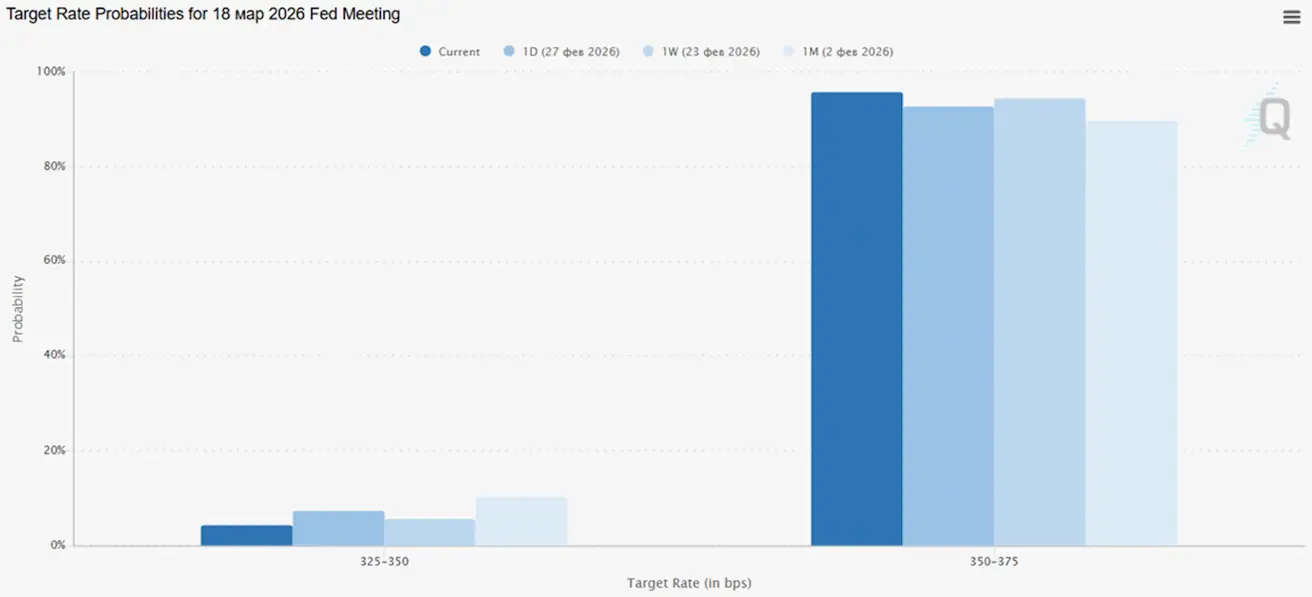
Алдағы 12 айда: екі рет 0,25% төмендету, диапазон 3,00–3,25%. Бірінші қадам шілде отырысында күтіледі:
Бүгін:
Бір апта бұрын:
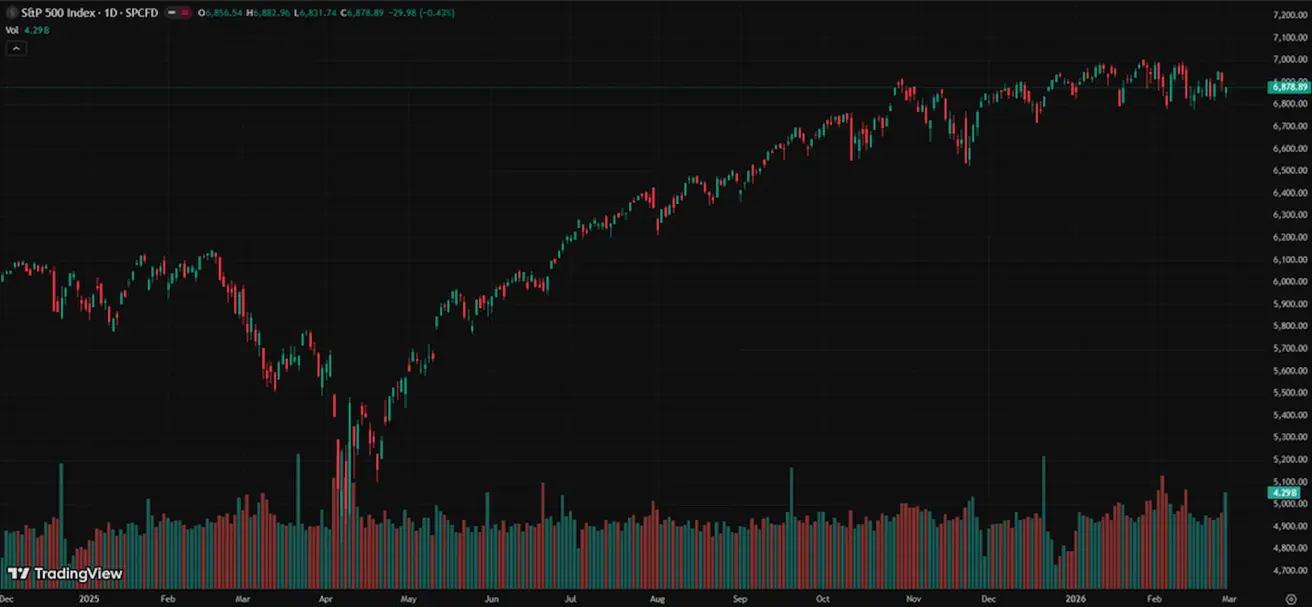
SP500
Апталық өзгеріс: -0,44% (апта соңындағы жабылу: 6878,89); жыл басынан бері: +0,49%. Бүгін ашылуда: -1,43%
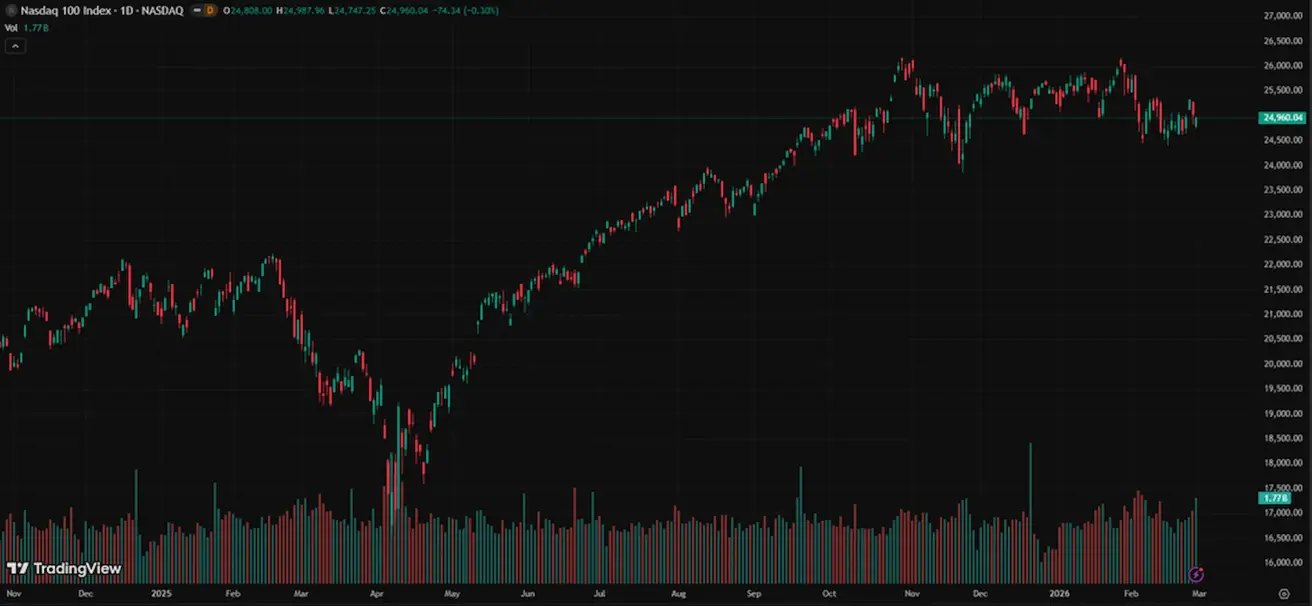
NASDAQ100
Апталық өзгеріс: 0,21% (апта соңындағы жабылу: 24960,04); жыл басынан бері: -1,15%.
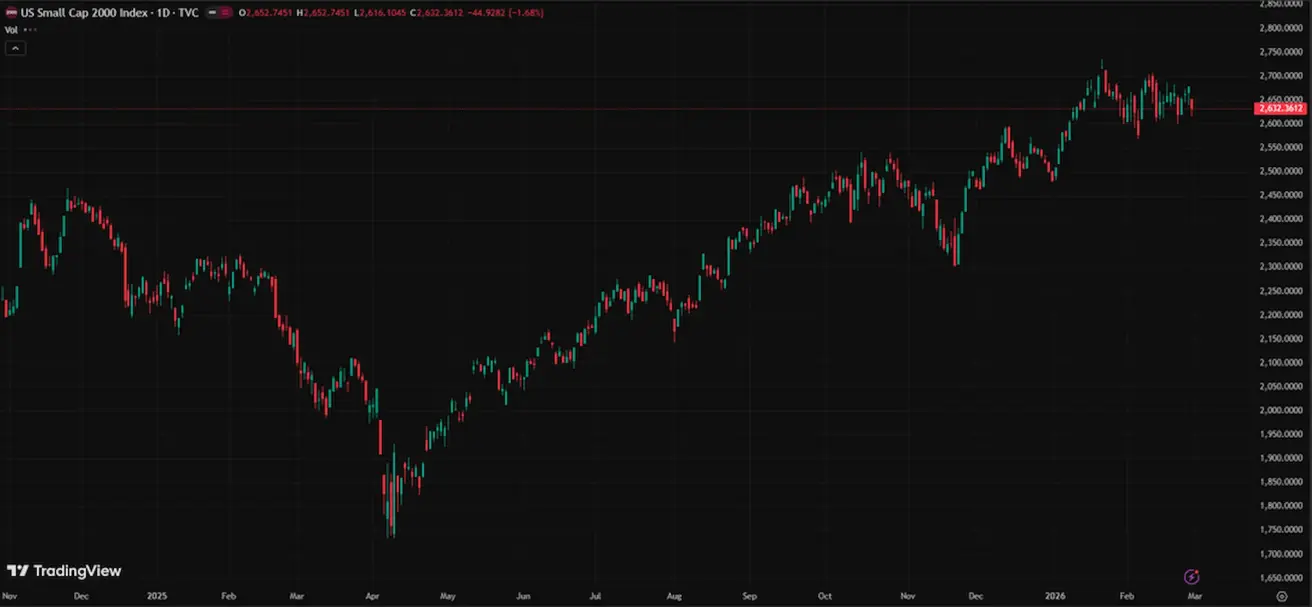
RUSSEL 2000 (RUT)
Апталық өзгеріс: -1,18% (апта соңындағы жабылу: 2632,36); жыл басынан бері: +6,06%.
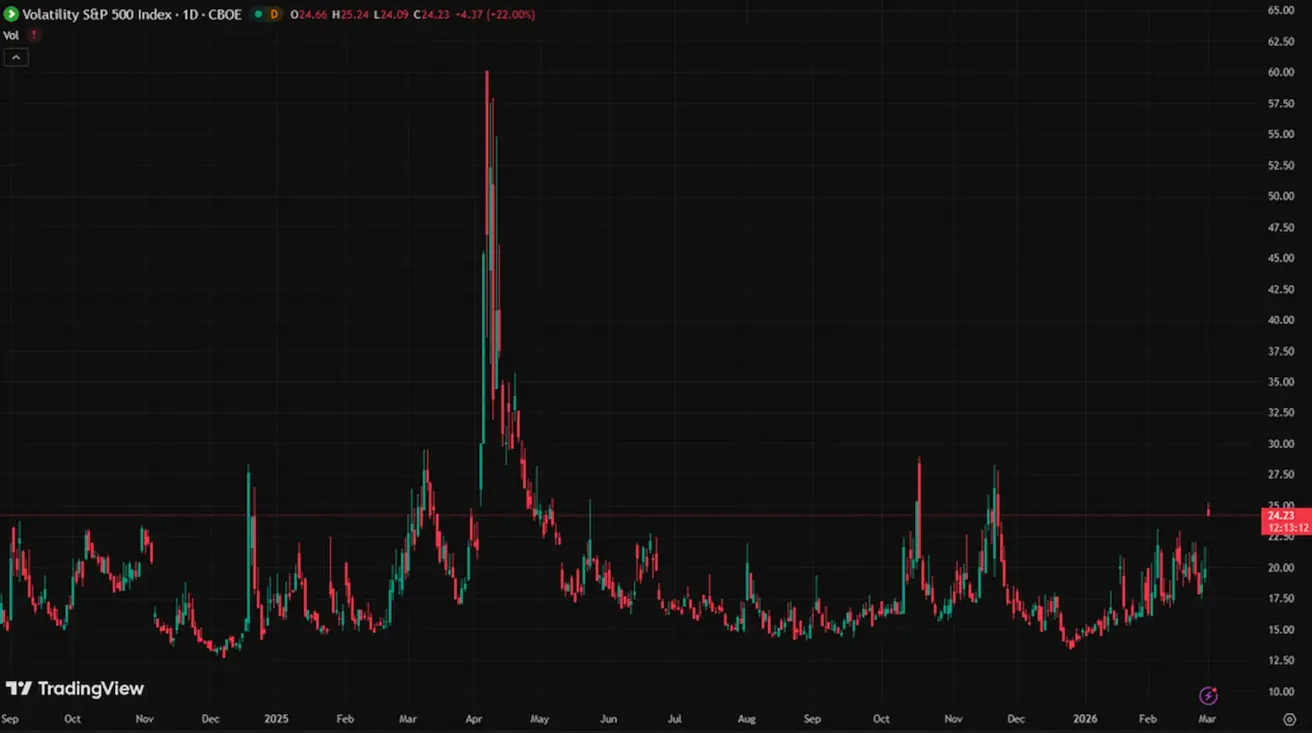
VIX
VIX құбылмалылық индексі: 24,25.
Есеп беру маусымы (мысал: 2026 жылғы 23–28 ақпан):
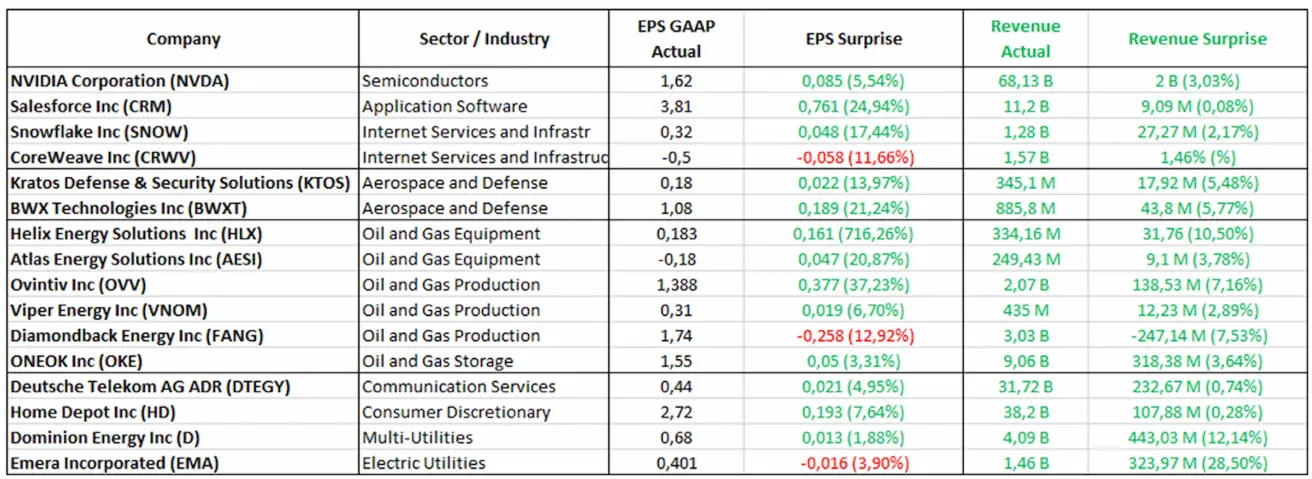
Технологиялық сектор табыстың тұрақты өсуін көрсетуді жалғастыруда, бұл нарық күтулерінен асып түсіп, IT шешімдері мен инфрақұрылымына тұрақты жоғары сұранысты растайды. Қорғаныс компаниялары да болжамнан жоғары табыс көрсетті, бұл тұрақты тапсырыс портфелі мен бюджетке тәуелді сұраныстың жалғасуын көрсетеді. Энергетика секторы, мұнай бағасының төмен кезеңіне қарамастан, мықты қаржылық нәтижелер мен маржа тұрақтылығын көрсетуде. S&P Global АҚШ-та алдағы 12 айда рецессия ықтималдығын 20–25% деп бағалайды, бұл қыркүйектегі 30%-дан төмен, яғни макроэкономикалық күтулердің қалыпты жақсарғанын білдіреді.
Еуроаймақ
- Ставка өзгеріссіз, инфляция бақылауда;
- Ақша-несие саясаты бейтарап — тәуекелдер балансы инфляциядан экономикалық әлсіздікке ауысты;
- Сауда шиеленістері бәсеңдеген соң, ЕОБ алдағы жылдарға ЖІӨ мен инфляция болжамдарын жоғары көтерді;
- Еуропа тұрақтанып келеді, бірақ өсу қарқыны бойынша АҚШ-тан артта.
Ставкалар:
- Депозиттік мекеме ставкасы: 2,0% (бұрын: 2,0%);
- Маржиналдық кредит беру ставкасы: 2,4% (бұрын: 2,4%) (банктердің реттеушіден овернайт кредит алу ставкасы);
- Қысқа мерзімді (негізгі) ставка: 2,15% (бұрын: 2,15%):
Инфляция: Тұтыну бағалары индексі (CPI) (қаңтар) — қазіргі уақытта Еуроаймақта инфляция мәселесі жоқ.
Негізгі CPI (жыл/жыл): 2,2% (бұрын: 2,3%):
CPI (ай/ай): -0,6% (бұрын: 0,2%, қайта қаралған); CPI (жыл/жыл): 1,7% (бұрын: 1,7%)
ЖІӨ 4-тоқсан (қорытынды): тоқсан/тоқсан: 0,3% (бұрын: 0,3%); жыл/жыл: 1,3% (бұрын: 1,4%). Жұмыссыздық деңгейі (желтоқсан): 6,20% (бұрын: 6,23%).
Іскерлік белсенділік индексі (PMI) (ақпан):
- Қызмет көрсету секторы: 51,8 (бұрын: 51,6);
- Өндірістік сектор: 50,8 (бұрын: 49,4);
- S&P Global Composite: 51,9 (бұрын: 51,3).
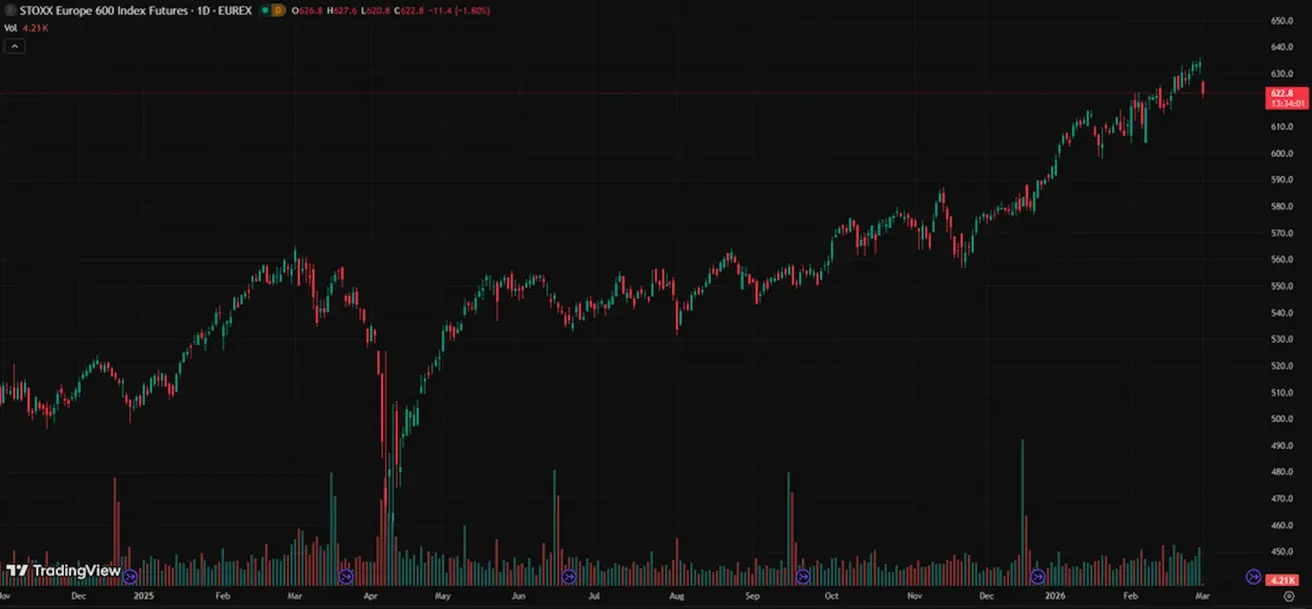
EURO STOXX 600 (FXXP1!)
Апталық өзгеріс: +0,89% (апта соңындағы жабылу: 634,2); қаңтардағы өзгеріс: +6,77%. Бүгін ашылуда: -1,64%
Қытай
Экономика экспорт есебінен тұрақтануда, ал ішкі сұраныс пен инвестициялар әлсіз күйде; ынталандыру шаралары мақсатты және сақтықпен жүргізілуде.
- Ставкалар өзгеріссіз;
- Ақша-несие саясаты ынталандырушы сипатта;
- Қытай 2026 жылғы жоспары аясында экономикалық өсімді қолдау үшін фискалдық ынталандыруды жалғастыратынын жариялады (ішкі сұранысты ынталандыру, салықтық жеңілдіктер мен субсидияларды оңтайландыру, өнеркәсіпті жаңғырту).
Ставкалар:
- 1 жылдық негізгі несие ставкасы (орта мерзімді кредиттеу): 3,00%;
- 5 жылдық ставка (ипотекаға әсер ететін бесжылдық): 3,50%.
Инфляция көрсеткіштері (қаңтар):
-
Тұтыну бағалары индексі (CPI) (ай/ай): 0,2% (бұрын: 0,2%); (жыл/жыл): 0,2% (бұрын: 0,8%);
-
Өндіруші бағалары индексі (PPI) (жыл/жыл): -1,4% (бұрын: -1,9%).
-
ЖІӨ 4-тоқсан (қорытынды): тоқсан/тоқсан: 1,2% (бұрын: 1,1%); жыл/жыл: 4,5% (бұрын: 4,8%).
-
Жұмыссыздық деңгейі (қаңтар): 5,1% (бұрын: 5,1%).
-
Өнеркәсіптік өндіріс (қаңтар), (жыл/жыл): 5,9% (бұрын: 4,8%).
-
Негізгі капиталға инвестициялар (қаңтар), (жыл/жыл): -3,8% (бұрын: -2,6%).
-
Бөлшек сауда (қаңтар), (жыл/жыл): 0,9% (бұрын: 1,3%).
-
Импорт көлемі (қаңтар), (жыл/жыл): 5,7% (бұрын: 1,9%).
-
Экспорт көлемі (қаңтар), (жыл/жыл): 6,6% (бұрын: 5,9%).
-
Сауда балансы (АҚШ доллары) (қаңтар): $114,30 млрд (бұрын: $111,68 млрд).
Іскерлік белсенділік индекстері (PMI) (қаңтар):
- Өндірістік сектор: 49,3 (бұрын: 49,2);
- Өндірістік емес сектор: 49,4 (бұрын: 49,0);
- Композиттік индекс: 50,7 (бұрын: 49,1).
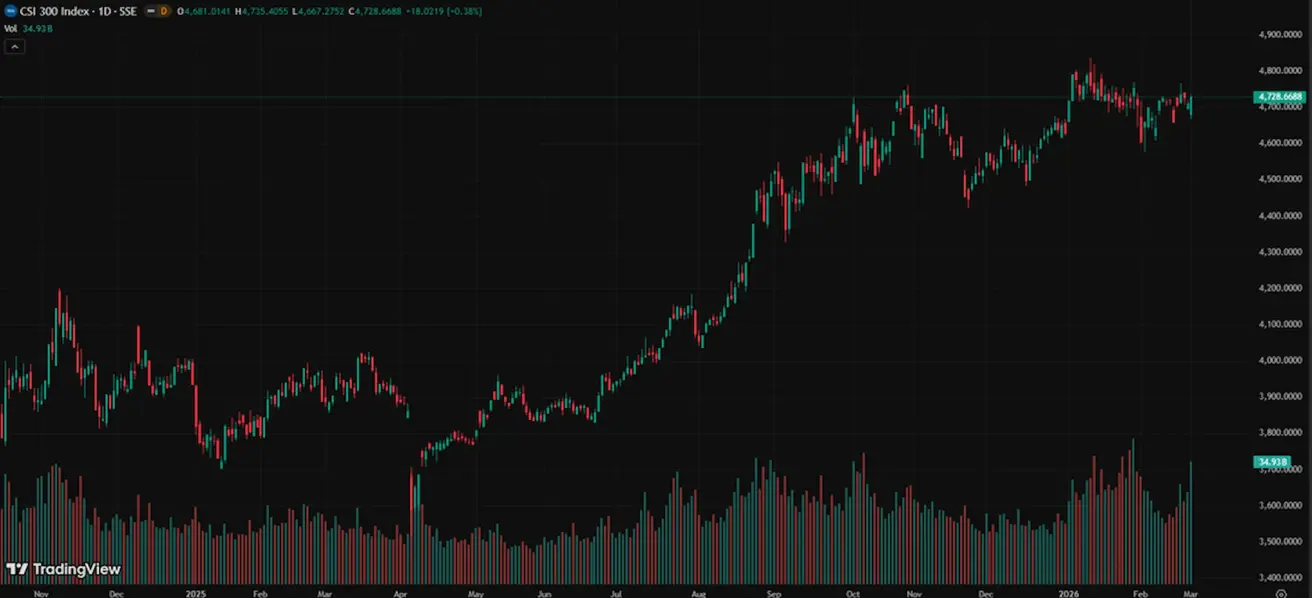
CSI 300 INDEX (000300.HK)
Апталық өзгеріс: +1,46% (апта соңындағы жабылу: 4728,67); жыл басынан бері: +2,13%.
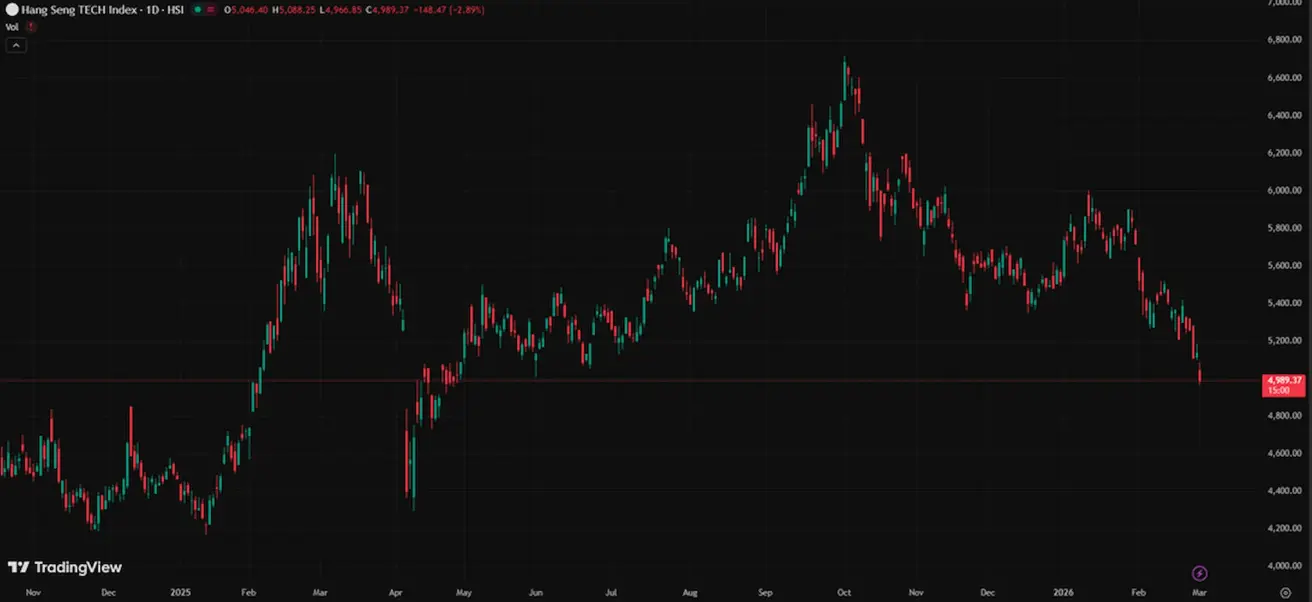
Қытайдың технологиялық секторы төмендеуді жалғастыруда: Hang Seng TECH Index негізгі компаниялары Батыс әріптестерімен салыстырғанда әлсіз нәтижелер көрсетті.
Hang Seng TECH Index (HSTECH)
Апталық өзгеріс: -4,60% (апта соңындағы жабылу: 513,84); жыл басынан бері: -6,67%.
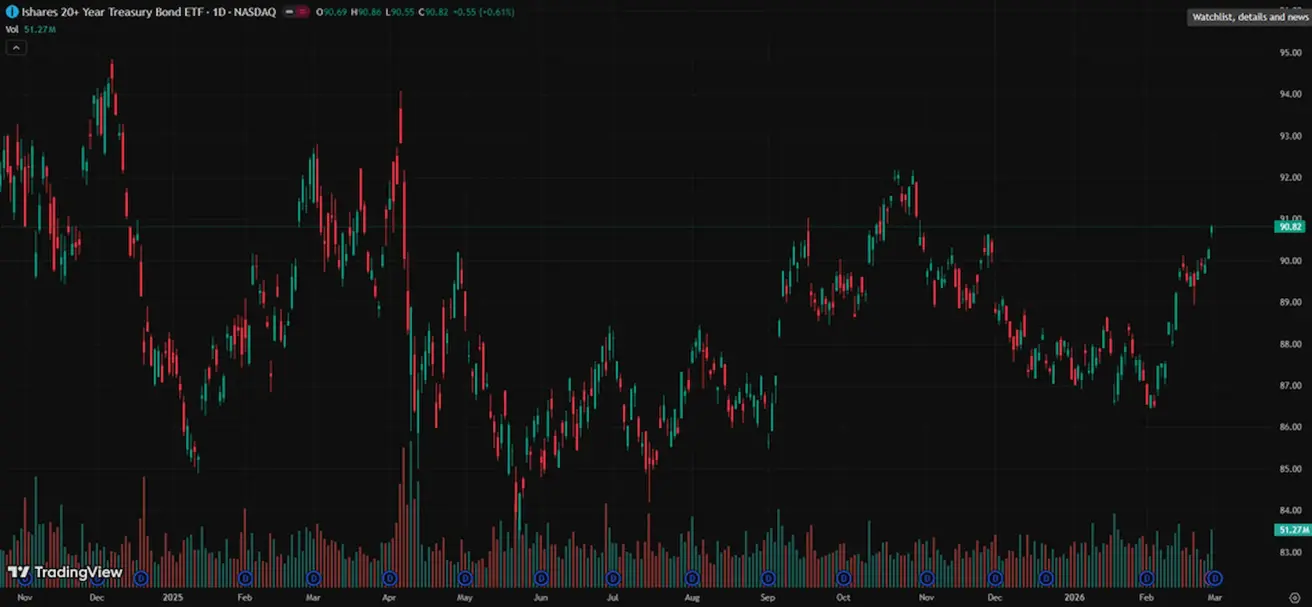
ОБЛИГАЦИЯЛАР НАРЫҒЫ
АҚШ қарыз нарығы терең рецессия немесе жүйелік тәуекел сценарийін көрсетпейді. АҚШ-тың 20 жылдан астам мерзімді қазынашылық облигациялары (ETF TLT): Апталық өзгеріс: +1,58% (апта соңындағы жабылу: 90,82); жыл басынан бері: +4,20%.
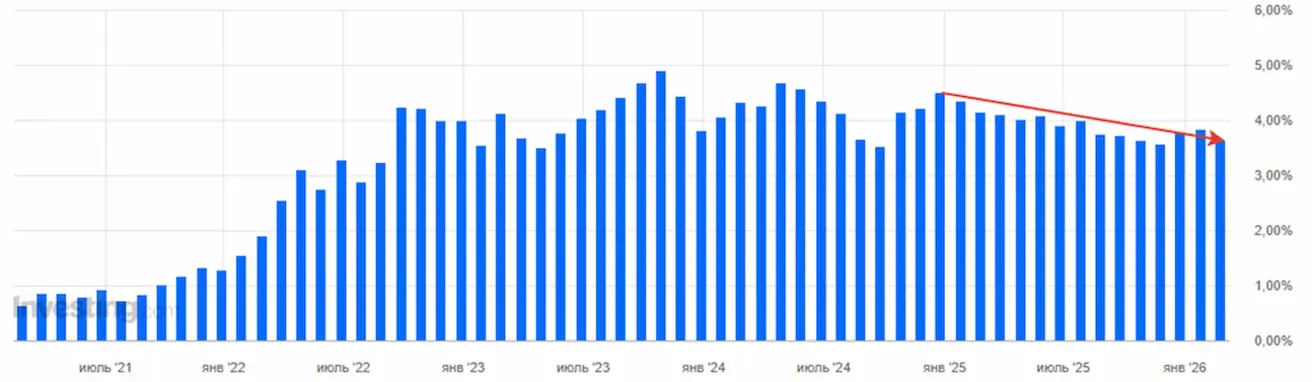
АҚШ-тың 5 жылдық қазынашылық ноталарының аукционы: 3,615% (жыл басында: 4,478%):
АҚШ-тың 7 жылдық қазынашылық ноталарының аукционы: 3,790% (жыл басында: 4,532%):
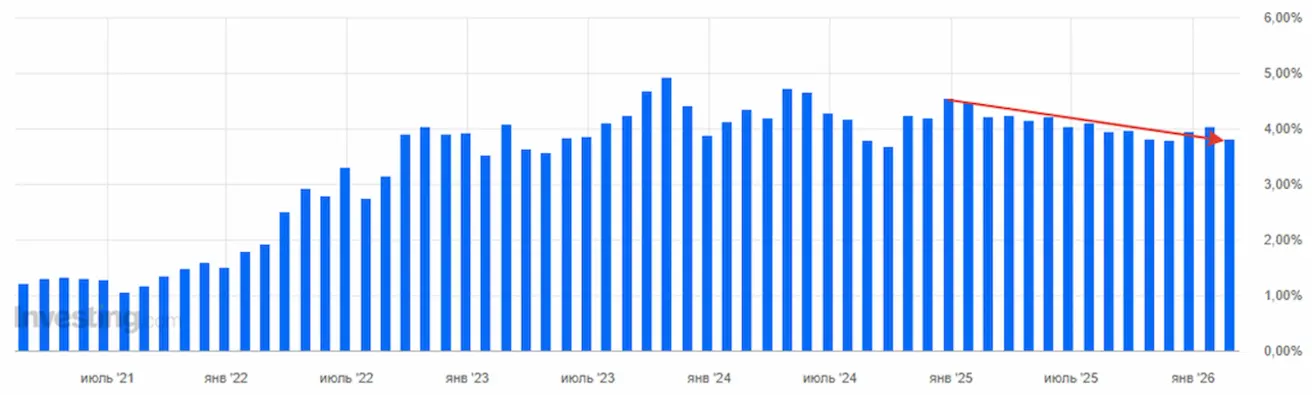
Федералдық резерв қаңтардағы отырыста ставканы өзгеріссіз қалдырғанымен, АҚШ-тың орта мерзімді қазынашылық облигациялары бойынша аукцион графиктері биылдың басынан бері кірістіліктің тұрақты төмендеуін көрсетеді, бұл 2023–2024 жылдардағы шыңдардан кейінгі құлдырау. Бұл инвесторлардың тұрақты инфляциялық қысымды күтпейтінін көрсетеді.
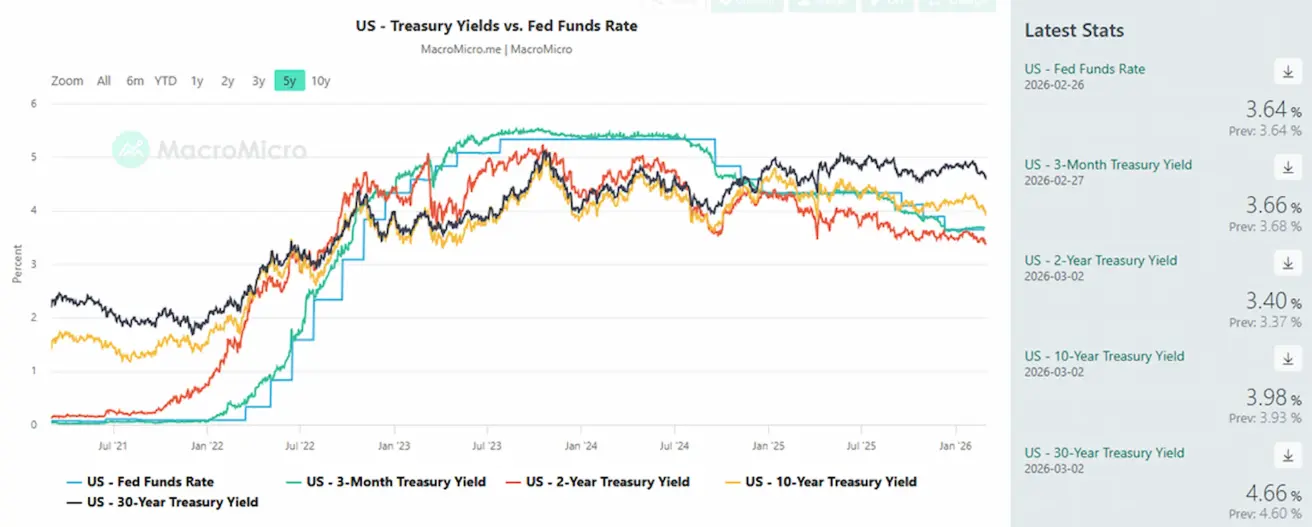
КІРІСТІЛІКТЕР ЖӘНЕ СПРЕДТЕР
АҚШ-тың 10 жылдық қазынашылық облигацияларының нарықтық кірістілігі: 3,98% (бұрын: 4,09%); 2 жылдық облигациялар кірістілігі: 3,40% (бұрын: 3,48%);
-
ICE BofA BBB АҚШ корпоративтік индексінің тиімді кірістілігі: 4,91% (бұрын: 4,94%).
-
10 жылдық пен 2 жылдық АҚШ қазынашылық облигациялары арасындағы кірістілік спрэді 58 базистік пункт (бұрын: 61);
-
10 жылдық пен 3 айлық АҚШ қазынашылық облигациялары арасындағы кірістілік спрэді 32 базистік пункт (бұрын: 40).
-
АҚШ-тың 5 жылдық кредиттік дефолт свопының (CDS) құны (дефолттан сақтандыру): 31,03 б.п. (өткен аптада да 31,03 б.п.).
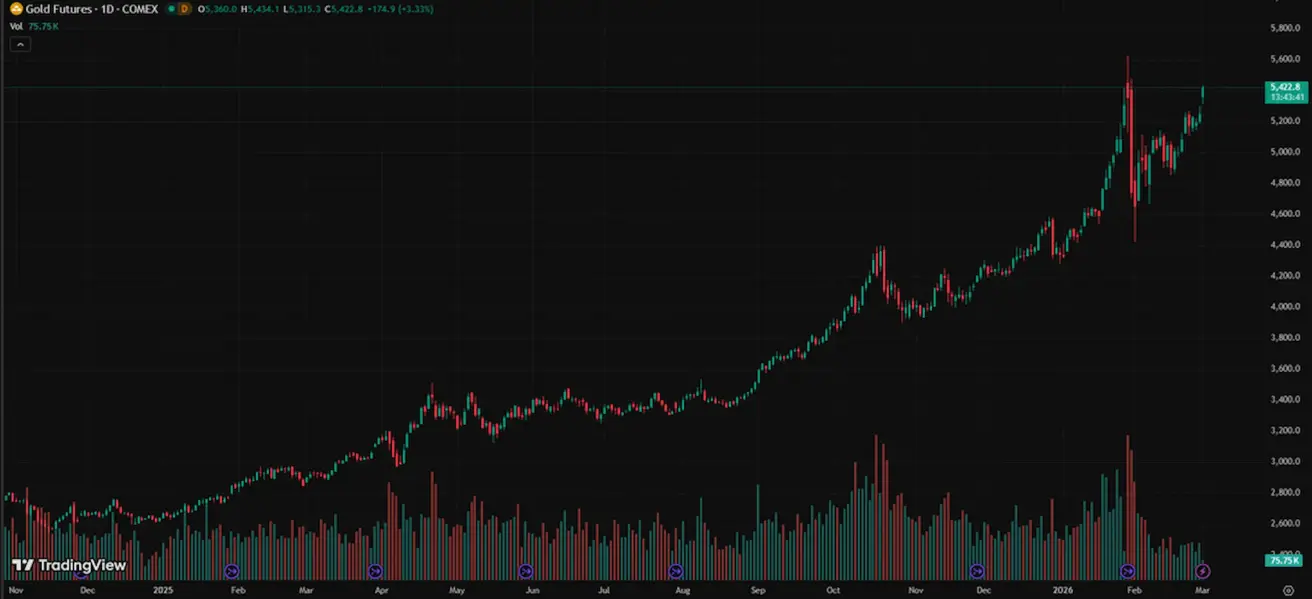
АЛТЫН ФЬЮЧЕРСТЕРІ (GC)
Геосаяси оқиғалар аясында алтын фьючерстері тарихи максимумдарға жақындауда. Апталық өзгеріс: +1,91% (апта соңындағы жабылу: $5 247,7 унция үшін); жыл басынан бері: +21,14%. Алтын бағасының өсуі орталық банктер тарапынан тұрақты сұраныс, жаһандық қарыздың жылдам өсуі және жалғасып жатқан геосаяси әрі макроэкономикалық белгісіздік аясында жалғасуда.
МҰНАЙ ФЬЮЧЕРСТЕРІ
Апталық өзгеріс: +2,10% (апта соңындағы жабылу: $67,02 баррель үшін). Жыл басынан бері: +16,74%. Бүгін: +8,87%, күн ішінде максимум $75 баррельге жетті. OPEC+ тәулігіне 206 млн баррельге (әлемдік ұсыныстың 0,2%) жеткізуді арттырды; Таяу Шығыстағы геосаяси тәуекелдер.
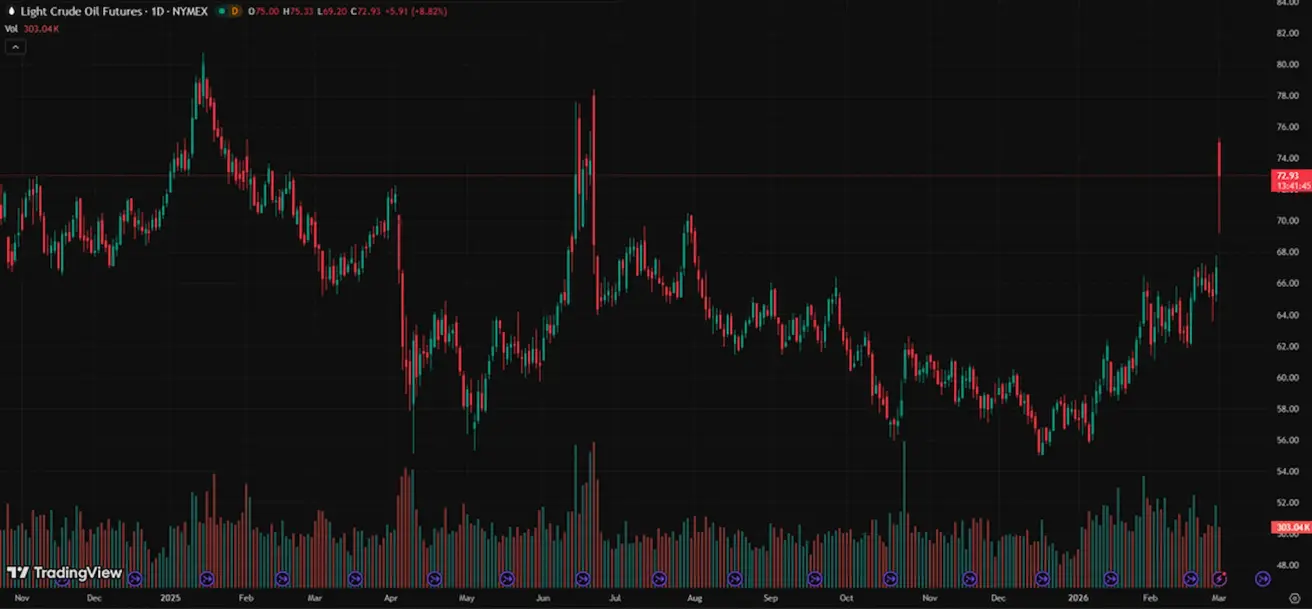
Иран Ормуз бұғазын жауып тастады, ол арқылы тәулігіне 20–21 млн баррель мұнай өтеді, бұл әлемдік мұнай жеткізілімінің шамамен 20%-ын құрайды. Wall Street сарапшылары Brent маркалы мұнайының бағасы физикалық жеткізілім 5 млн баррельге дейін қысқарса, $90-ға дейін өсуі мүмкін деп күтуде. OPEC+ мұнай өндірісін тәулігіне 206 мың баррельге арттырды. Таяу Шығыстағы кең ауқымды қақтығыс жаһандық инфляция мен нарық құбылмалылығын күшейтуі мүмкін.
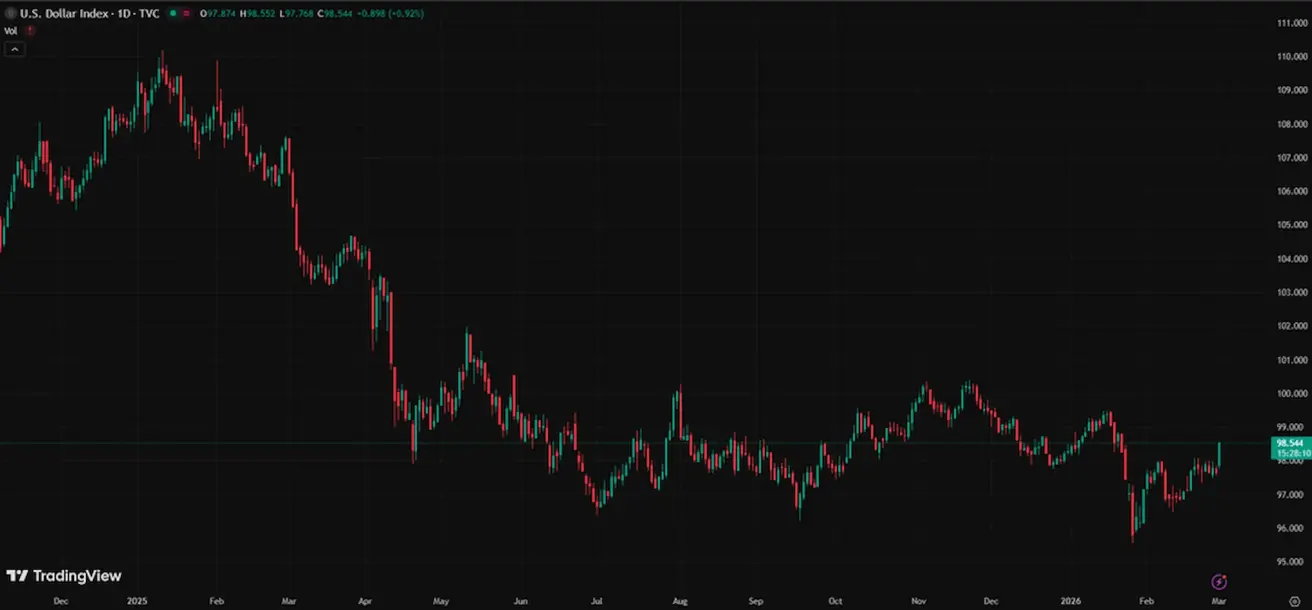
ДОЛЛАР ИНДЕКСІ ФЬЮЧЕРСТЕРІ (DX)
Апталық өзгеріс: +0,09% (апта соңындағы жабылу: 97,646). Жыл басынан бері: –0,36%. Бүгін +0,75%. 2025 жылдың соңындағы құлдыраудан кейін доллар 96–99 диапазонында саудалануда; Федералдық резерв саясатының бейтарапқа жақындауы өсу әлеуетін шектейді, бірақ USD-ға тұрақты төмендеу қысымын тудырмайды.
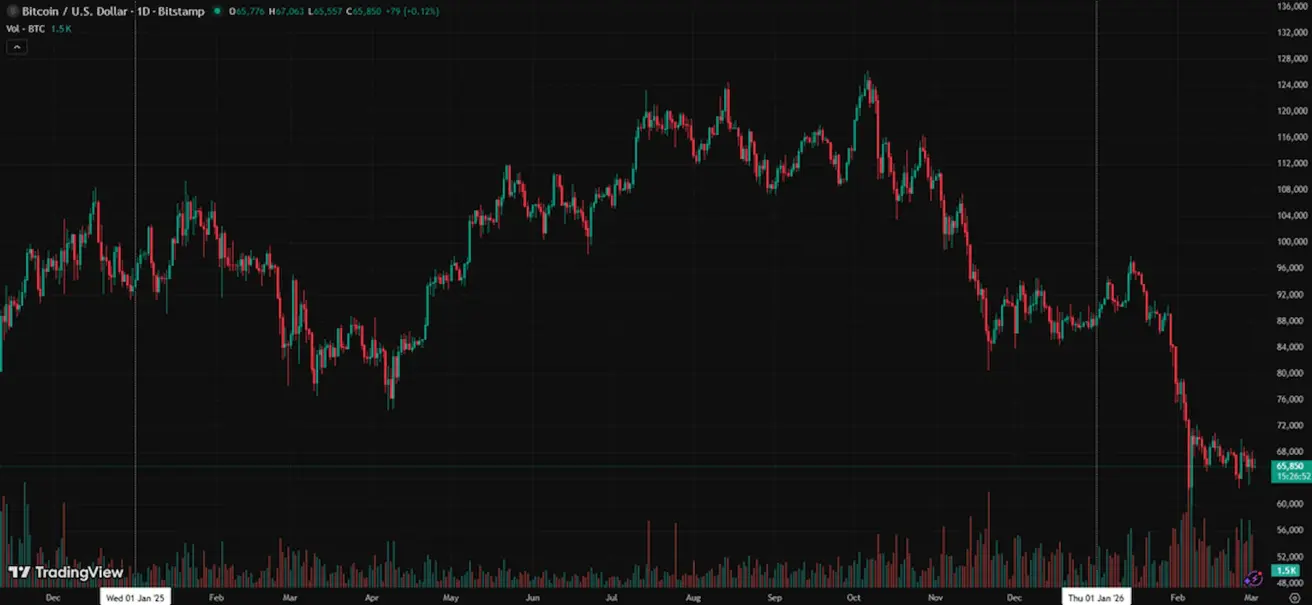
BTC ФЬЮЧЕРСТЕРІ
Апталық өзгеріс +0,38% (апта соңындағы жабылу: $65864); жыл басынан бері: -24,92%.
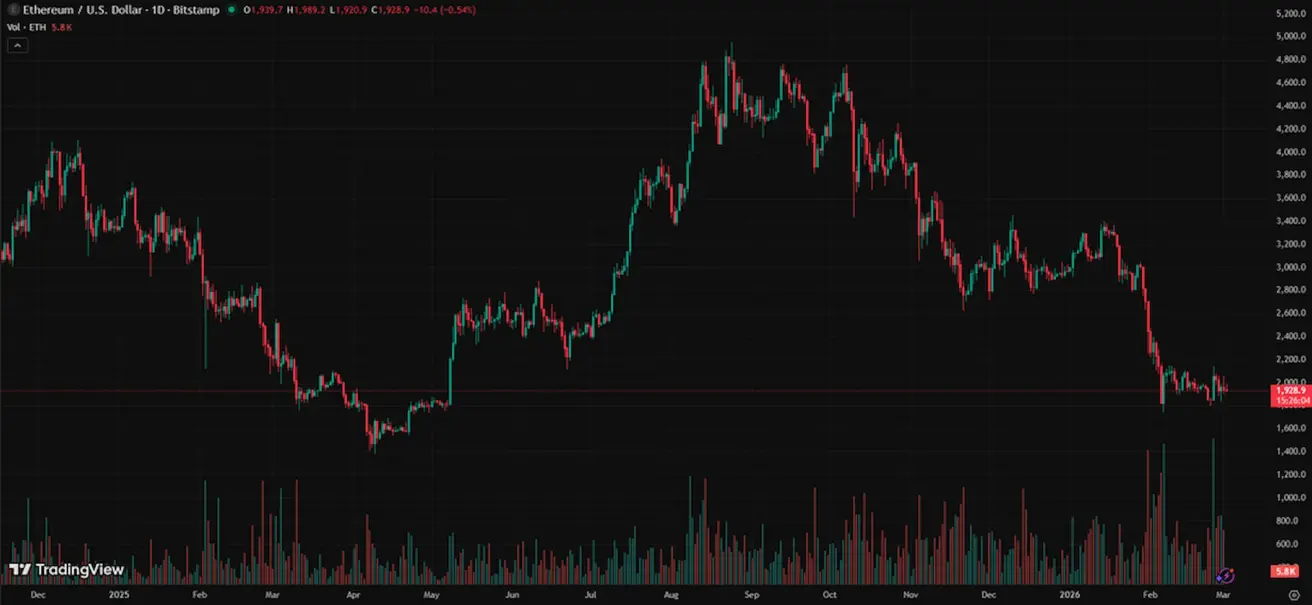
ETH ФЬЮЧЕРСТЕРІ
Апталық өзгеріс +3,23% (апта соңындағы жабылу: $1939,3); жыл басынан бері: -34,79%.
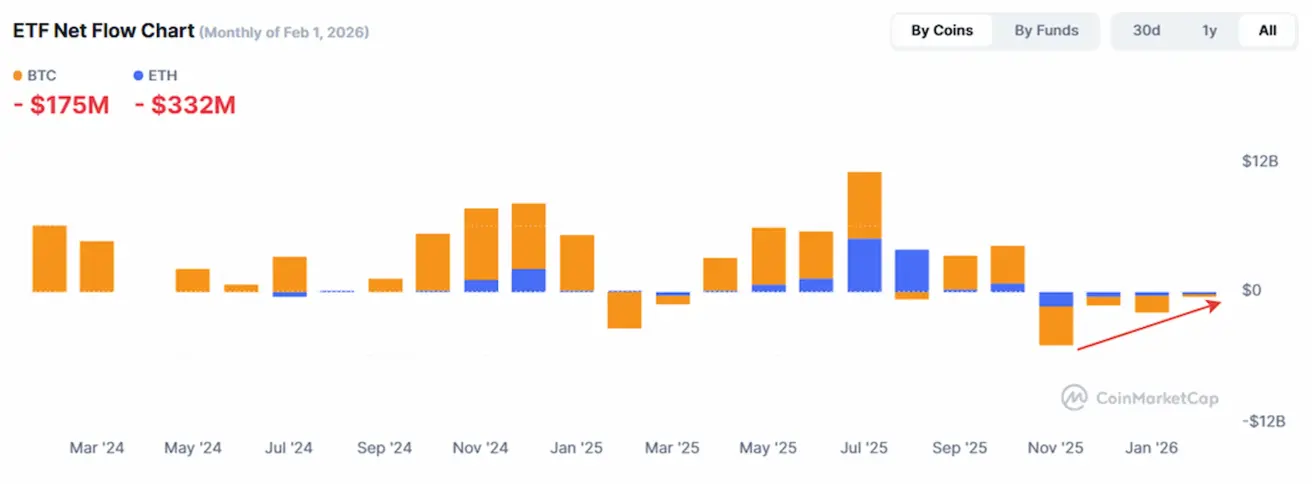
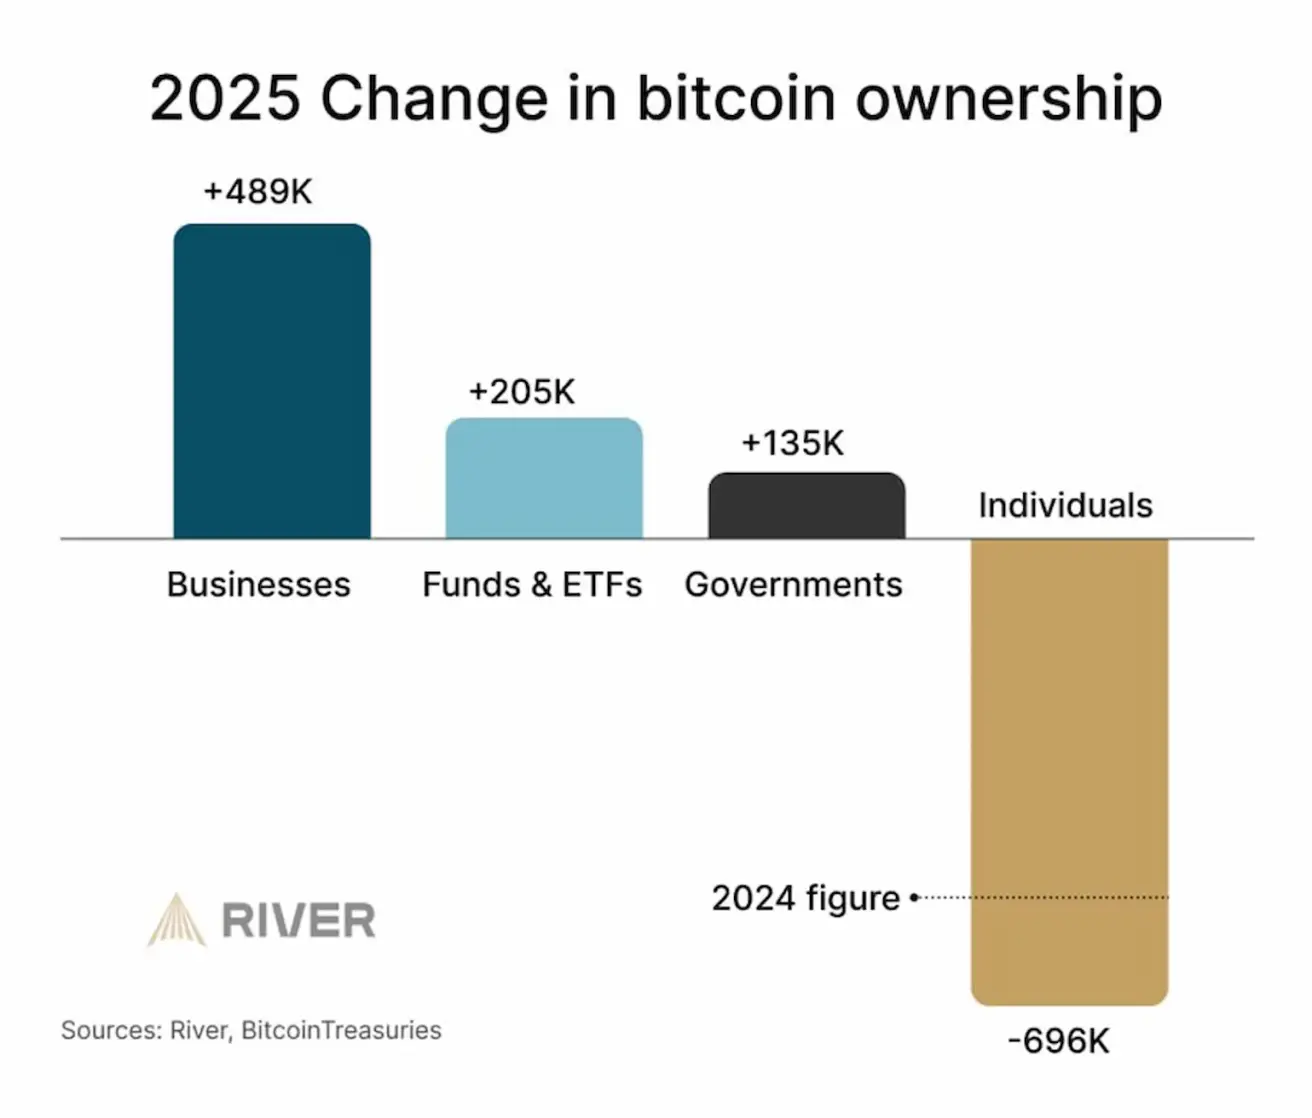
2025 жылы Bitcoin иеленушілер құрылымында өзгерістер байқалуда. Институционалдық сегменттен айқын ағын байқалады. Bitcoin бөлшек инвесторлардан институционалдық және корпоративтік қатысушыларға өтуде. Тарихи тұрғыда мұндай процесс нарықтың жетілу кезеңдеріне тән, актив біртіндеп алғашқы жеке иелерден ірі, жүйелік қатысушыларға өтеді:
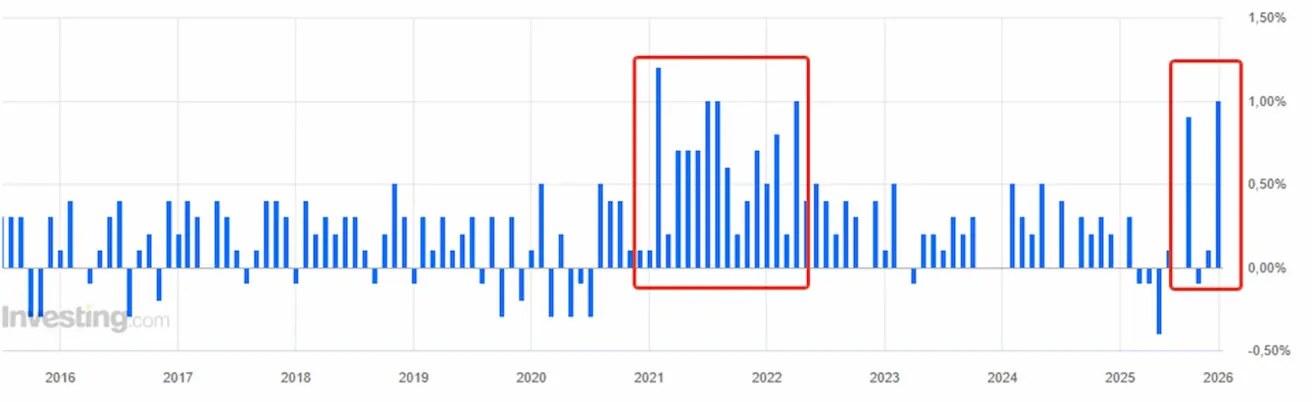
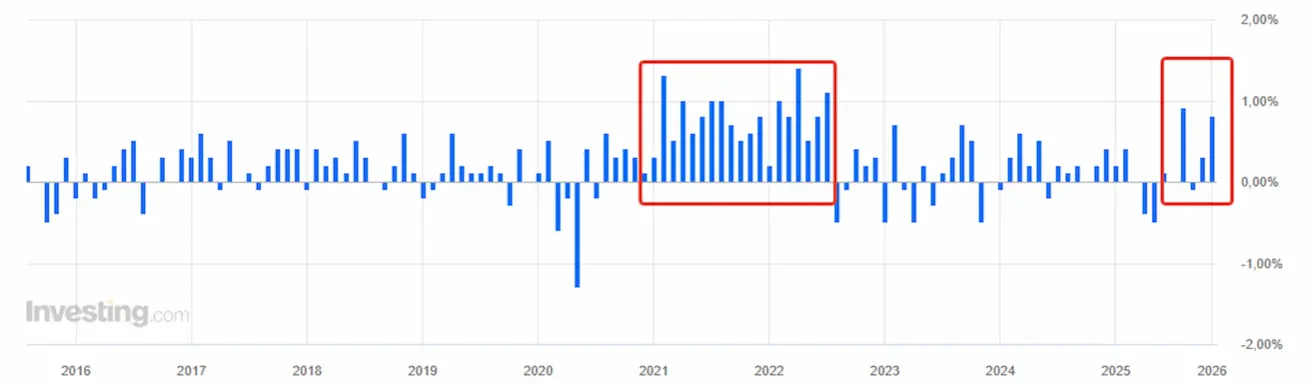
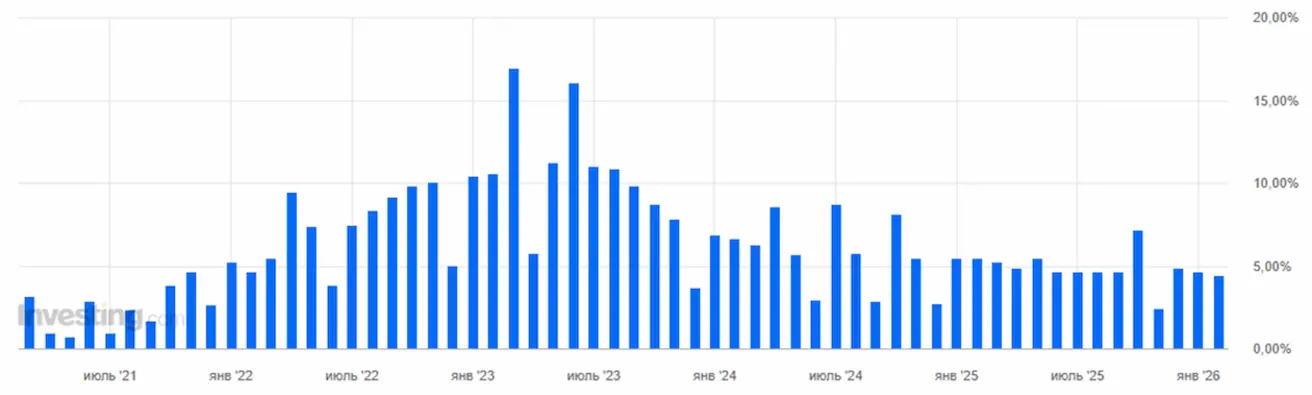
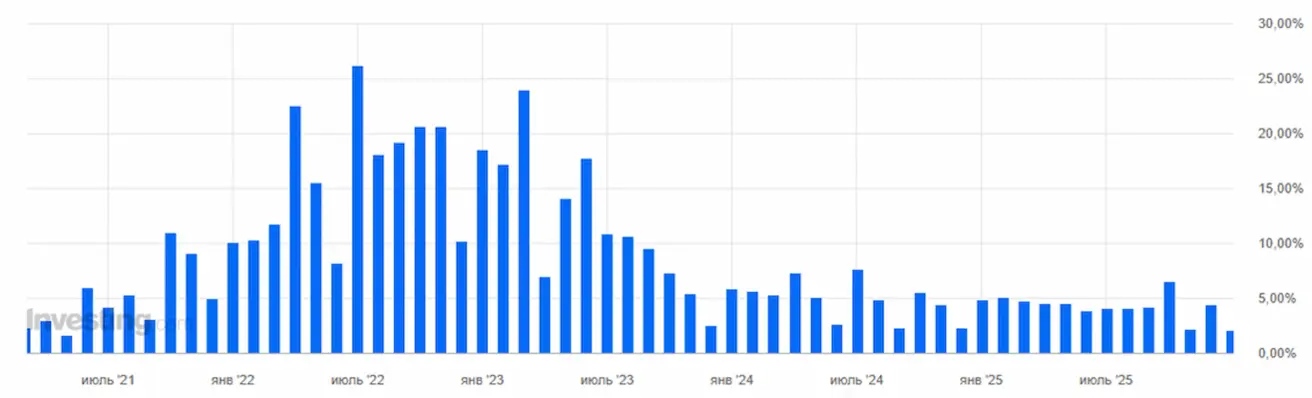
ETH: Аккумуляция мекенжайларына түсімдер (CryptoQuant) — Ether-дің аккумуляция мекенжайларына түсуі.
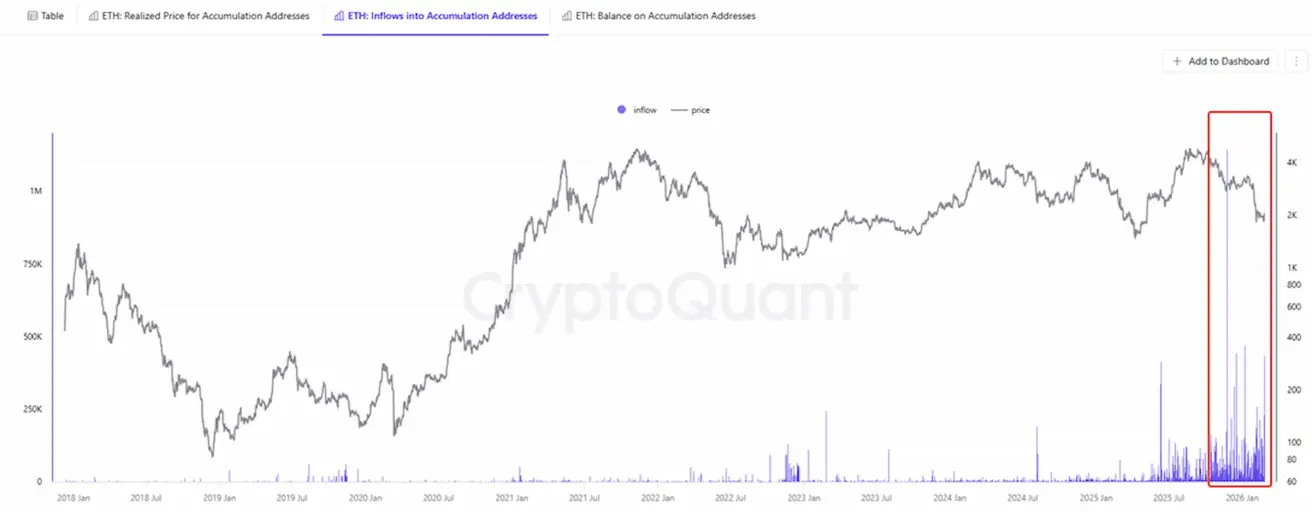
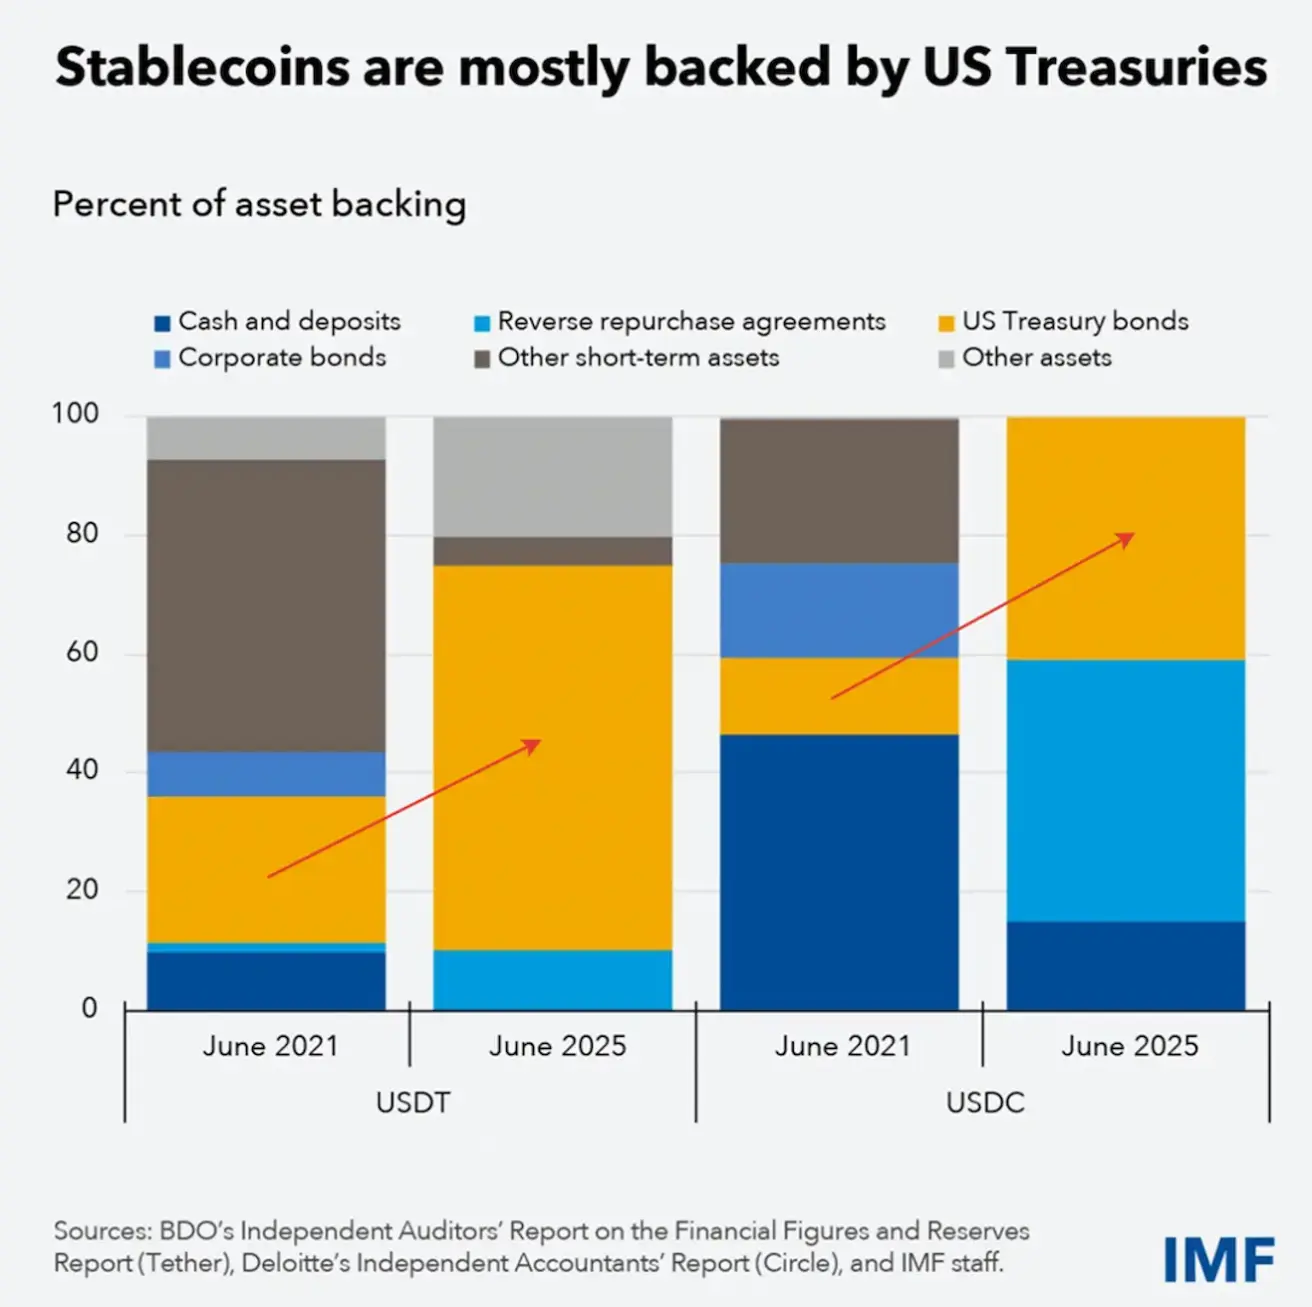
Көк бағандар — монеталарын жұмсамайтын (аккумуляциялайтын) мекенжайларға түсетін ETH көлемін көрсетеді. Бөлектелген аймақта (2025 жылдың соңы – 2026 жылдың басы) түсімдердің күрт секірісі байқалады — бүкіл бақылау кезеңіндегі ең жоғары деңгейлердің бірі. Бұл ірі иелердің ETH-ті биржаларға емес, "суық" сақтау орындарына жинап жатқанын көрсетеді. Бұл монеталардың өтімді ұсынысын азайтады. Мұндай мінез-құлық стратегиялық аккумуляцияға ұқсайды, алыпсатарлық қызып кетуге емес. Тарихи тұрғыда мұндай секірістер көбіне орта мерзімді түбінің қалыптасу кезеңінде немесе жаңа өсу импульсінің ерте сатысында байқалған. 2021 жылы резервтер "әртараптандырылған" болатын. 2025 жылға қарай USDT және USDC дерлік толықтай АҚШ қазынашылық облигацияларымен және репо келісімдерімен қамтамасыз етілді. Корпоративтік облигациялар мен басқа активтердің үлесі күрт азайды. Бұл стейблкоиндардың іс жүзінде квази–ақша нарығы қорларына айналғанын білдіреді. Олардың өсуі T-bills-ге сұраныстың артуына тең. Криптоэкожүйе АҚШ-тың қысқа мерзімді мемлекеттік қарыз нарығымен барған сайын тығыз байланысуда.
ProShares жаңа ақша нарығы ETF-ын іске қосты, ол стейблкоиндарға бағытталған. ProShares GENIUS Money Market ETF (тикер: IQMM US) — алғашқы сауда күнінде $17,56 млрд, бұл доллармен номинирленген ончейн өтімділікпен байланысты құралдарға институционалдық сұраныстың жоғары екенін көрсетеді. Инвесторлар стейблкоиндарға реттелетін қолжетімділік алады.
ЖАЛПЫ КРИПТОВАЛЮТА НАРЫҒЫНЫҢ КАПИТАЛИЗАЦИЯСЫ
Жалпы криптовалюта нарығының капитализациясы: $2,28 трлн (бір апта бұрын $2,35 трлн) (coinmarketcap.com).
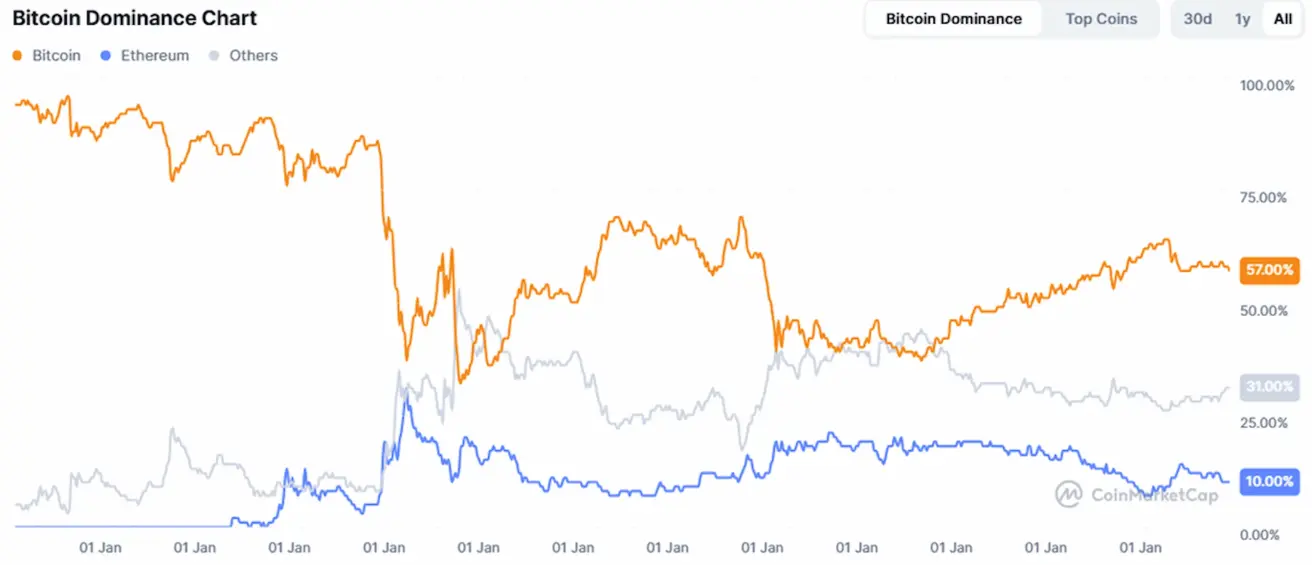
Криптоактивтер үлесі
- Bitcoin: 58,1% (58,2%);
- Ethereum: 10,3% (10,1%);
- басқалары: 37,1% (31,7%).
ETF таза ағындары диаграммасы: