English
 Lietuvių
 Русский
 Eesti
Eesti2026 жылғы 23–29 наурыз: Апталық экономикалық шолу
Негізгі нарық жаңалықтары

Таяу Шығыстағы қақтығыс әлі де шешімін тапқан жоқ; келіссөздердегі ұстанымдар екі тарапқа да қолайсыз болып отыр. Осыған байланысты өткен аптада акция индекстеріне қысым сақталды.
Алайда осы аптаның басында АҚШ, Еуропа және Азия нарықтары біртіндеп өсуде, ал АҚШ қазынашылық облигацияларының кірістілігі төмендеуде. Мұнай фьючерстері жоғары бағамен ашылды, бірақ қазір төмендеуде.
Орталық банктердің риторикасы нашарлап барады.
Америка Құрама Штаттары (негізгі тармақтар)
- Базалық мөлшерлеме өзгеріссіз қалды; риторика сақтықпен сипатталады;
- Ақша-кредит саясаты қалыпты түрде қатаң күйде;
- АҚШ-тың макроэкономикалық деректері жұмсақ баяулау сценарийін қолдайды: инфляциялық тәуекелдер артып келеді, еңбек нарығы баяулап жатыр, бірақ рецессия белгілері жоқ, және осы кезеңде мөлшерлемені төмендетуге негіз жоқ.
ИНФЛЯЦИЯ: ТҰТЫНУШЫЛАР БАҒА ИНДЕКСІ (АҚПАН):
- Негізгі ТБИ: (айлық) 0,2% (бұрын: 0,3%); (жылдық) 2,5% (бұрын: 2,5%).
- ТБИ: (айлық) 0,3% (бұрын: 0,2%); (жылдық) 2,4% (бұрын: 2,4%).
ӨНДІРУШІЛЕР БАҒА ИНДЕКСІ (АҚПАН):
- ӨБИ (айлық): 0,7%, бұрын: 0,5%.
- Негізгі ӨБИ (айлық): 0,5%, бұрын: 0,8% (түзетілген):
ИНФЛЯЦИЯ КҮТІЛІМДЕРІ (МИЧИГАН) (АҚПАН):
- 12 айлық инфляция күтімі: 3,8%, бұрын: 3,4%.
- 5 жылдық инфляция күтімі: 3,2%, бұрын: 3,3%.
ЖІӨ (АҚШ Экономикалық талдау бюросы, BEA) (2025 ж. 4-тоқсан, жылдық, екінші бағалау): +0,7% (2025 ж. 3-тоқсан: +4,4%):
GDPNow көрсеткіші (Атланта Федералдық резерв банкі әзірлеген ресми ЖІӨ-нің «нақты уақыттағы» бағасы): 2,3% (бұрын: 2,2%).
ІСКЕРЛІК БЕЛСЕНДІЛІК ИНДЕКСІ (PMI) (НАУРЫЗ, АЛҒАШҚЫ ДЕРЕКТЕР):
(50-ден жоғары – өсу, 50-ден төмен – қысқару)
- Қызмет көрсету секторы: 51,1 (бұрын: 51,7);
- Өндірістік сектор: 52,4 (бұрын: 51,6);
- S&P Global Composite: 51,4 (бұрын: 51,9).
ЕҢБЕК НАРЫҒЫ (BLS) (АҚПАН)
- Жұмыссыздық деңгейі: 4,3% (бұрын: 4,4%);
- АҚШ-тағы жалғасып жатқан жұмыссыздық бойынша талаптар саны: 1 819 мың (бұрын: 1 851 мың);
- Алғашқы жұмыссыздық бойынша талаптар: 210 мың (бұрын: 205 мың);
- Еңбек нарығындағы ауыл шаруашылығынан тыс жұмыс орындарының өзгерісі: 130 мың (бұрын: 48 мың);
- Жеке сектордағы ауыл шаруашылығынан тыс жұмыс орындарының өзгерісі: 172 мың (бұрын: −64 мың);
- Орташа сағаттық жалақы (жылдық): 3,7% (бұрын: 3,8%);
- JOLTS бос жұмыс орындары: 6,542 млн (бұрын: 6,928 млн).
АҚША-КРЕДИТ САЯСАТЫ
Өткен аптада Федералдық резерв өкілдері мөлшерлемені төмендету циклі аяқталуы мүмкін екенін мәлімдеді (WSJ).
АҚШ Сенатының банк комитетінде Кевин Уорштың (Трамптың үміткері) Федералдық резерв төрағасы қызметіне тағайындалуын растау бойынша тыңдаулар сәуірдің ортасына жоспарланған; Пауэллдің өкілеттігі мамырда аяқталады. Жаңа төраға тағайындалса, Ормуз бұғазы маңындағы жағдай тұрақталса, ФРЖ мөлшерлемені төмендетуі мүмкін.
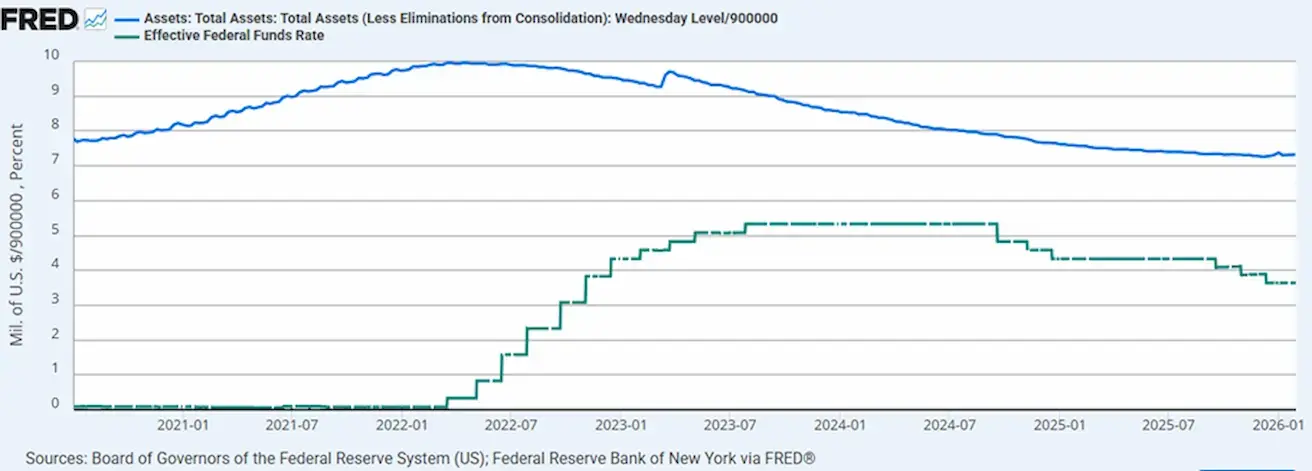
- Эффективті федералдық қорлар мөлшерлемесі (EFFR): 3,50%–3,75%;
- Федералдық резервтің балансы $6,657 трлн, QT тоқтатылғаннан бері 1,87% өсті ($6,535 трлн):
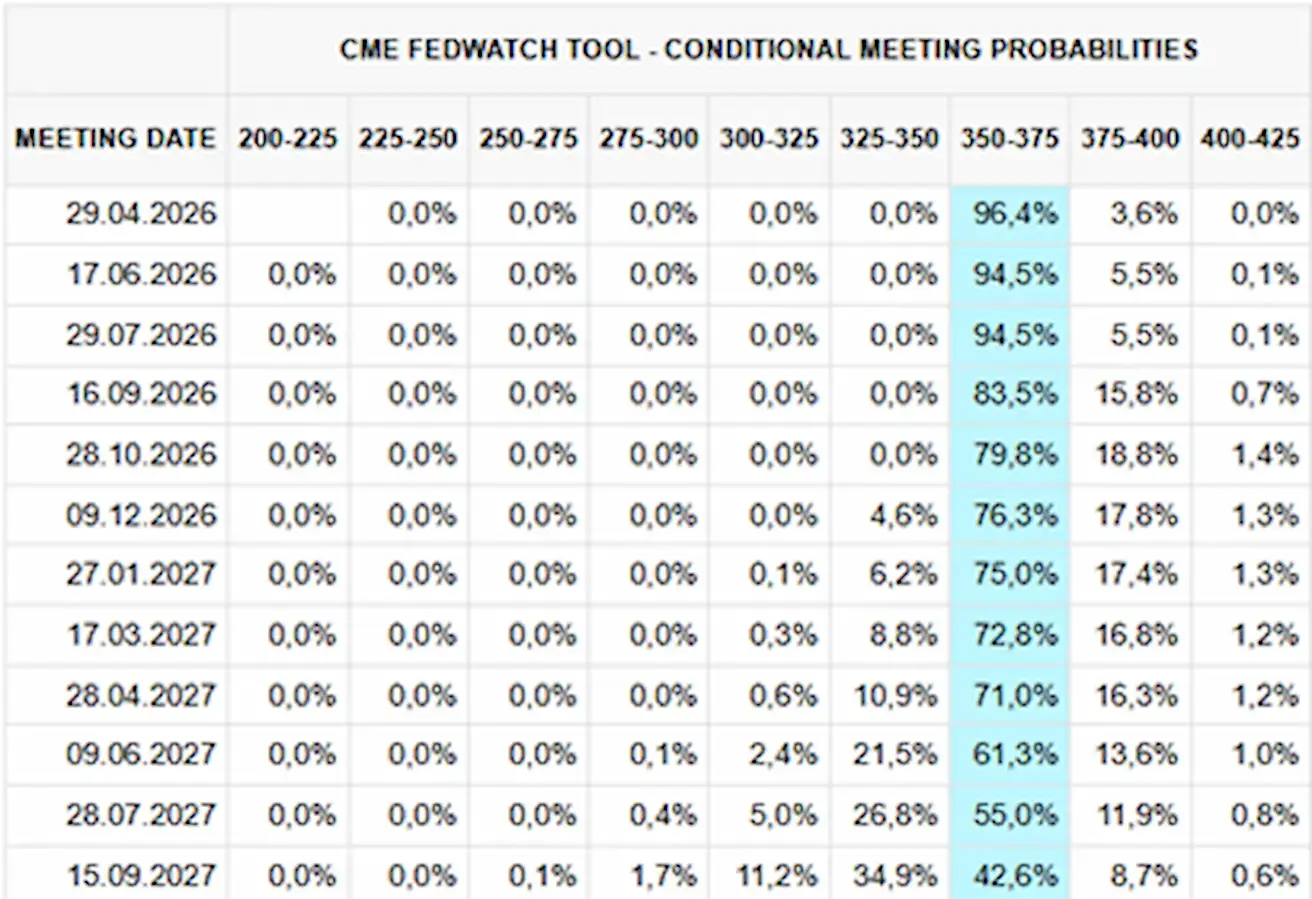
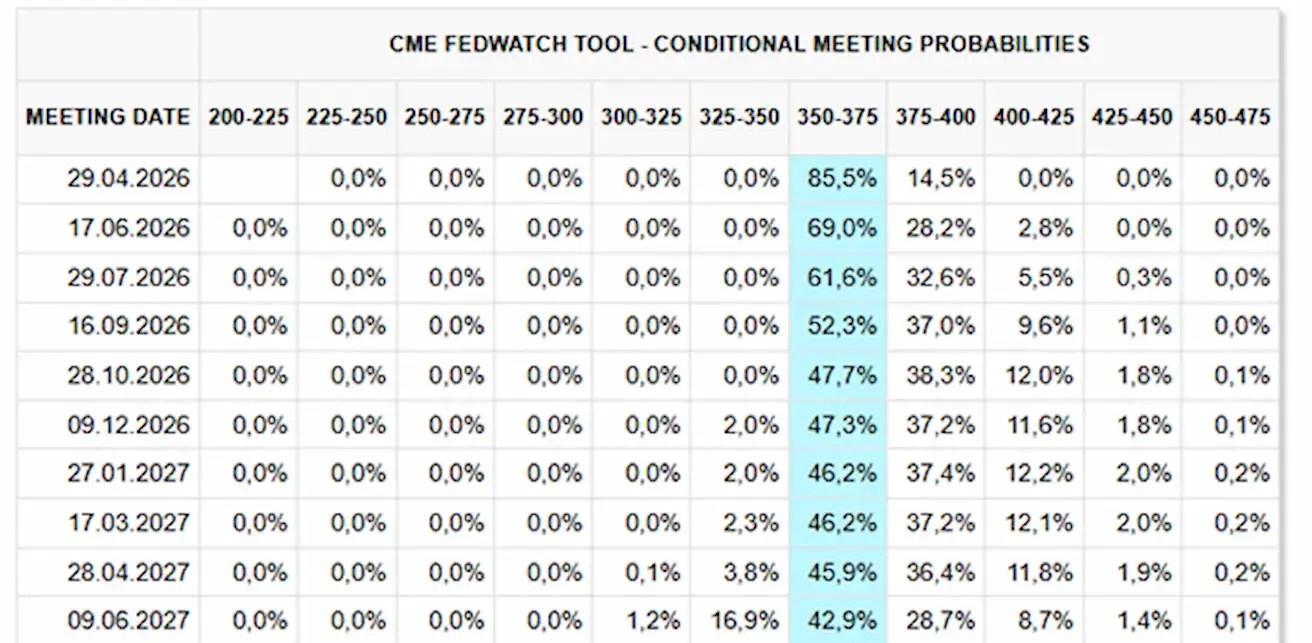
МӨЛШЕРЛЕМЕ БОЙЫНША НАРЫҚ БОЛЖАМЫ (FEDWATCH)
Келесі отырысқа (29 сәуір): мөлшерлеме өзгеріссіз қалады деген ықтималдық – 96,38%; өседі – 3,62%; төмендейді – 0%.
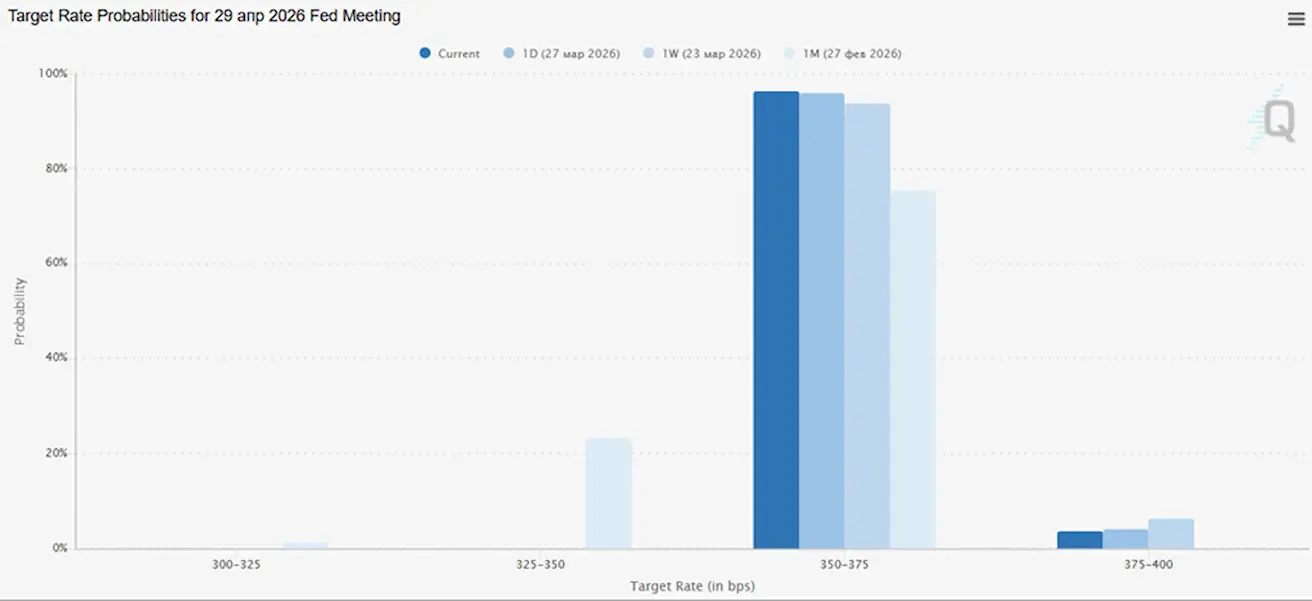
Алдағы 12 айда нарық мөлшерлеменің төмендеуін күтпейді:
Бүгін:
Бір апта бұрын:
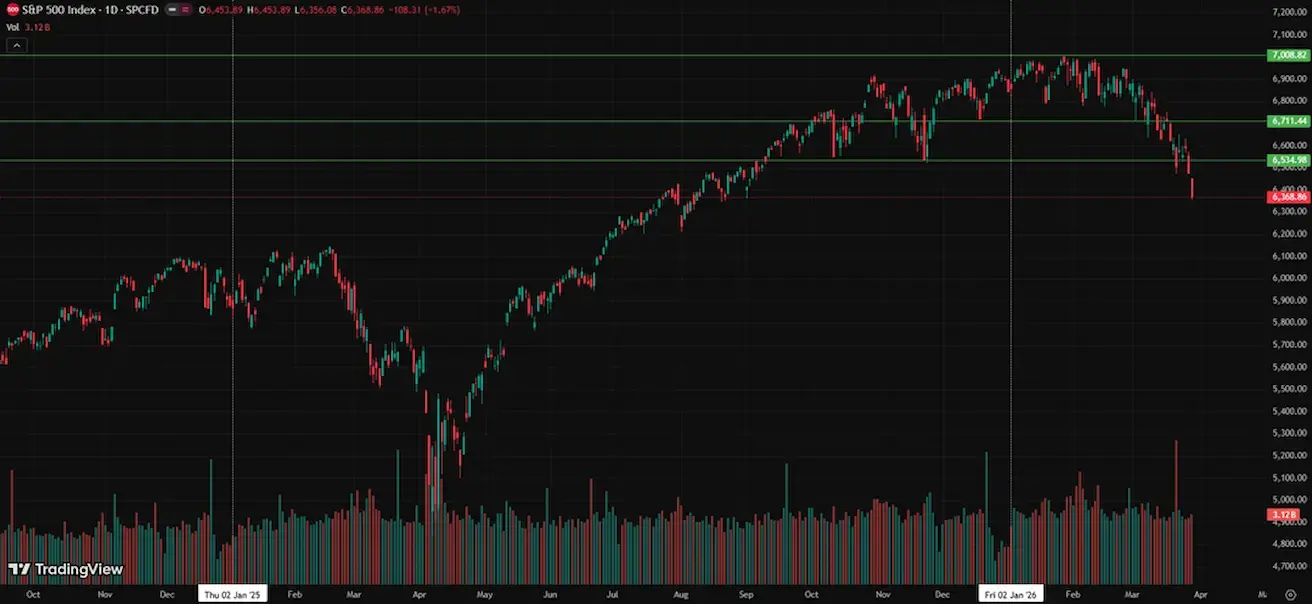
SP500
Апталық өзгеріс: –2,12% (апта соңындағы жабылу – 6368,86); жыл басынан бері: -6,96%.
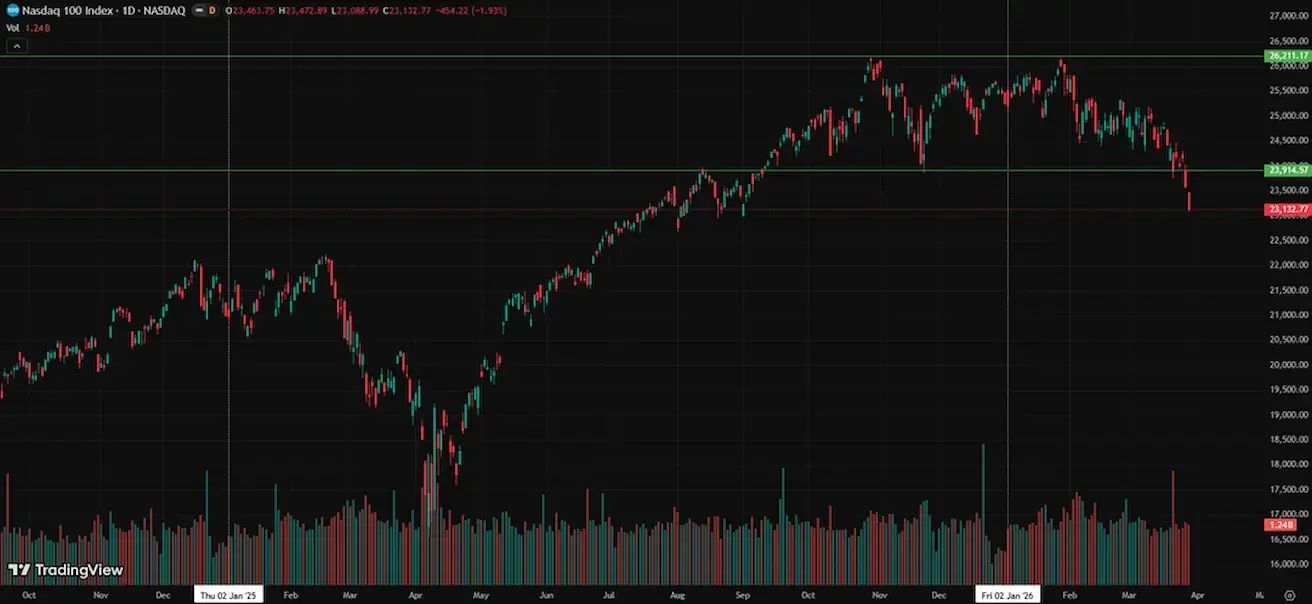
NASDAQ100
- Апталық өзгеріс: -3,20% (апта соңындағы жабылу – 23132,77); жыл басынан бері: -8,38%.
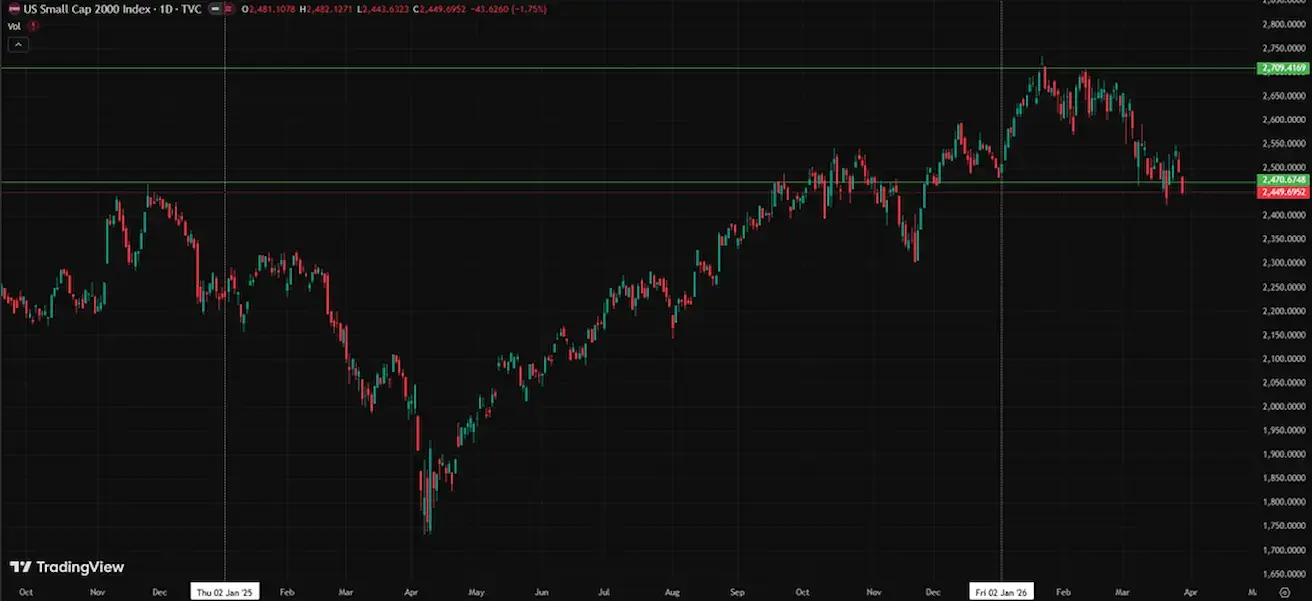
RUSSEL 2000 (RUT)
- Апталық өзгеріс: +0,46% (апта соңындағы жабылу – 2449,69); жыл басынан бері: -1,30%.
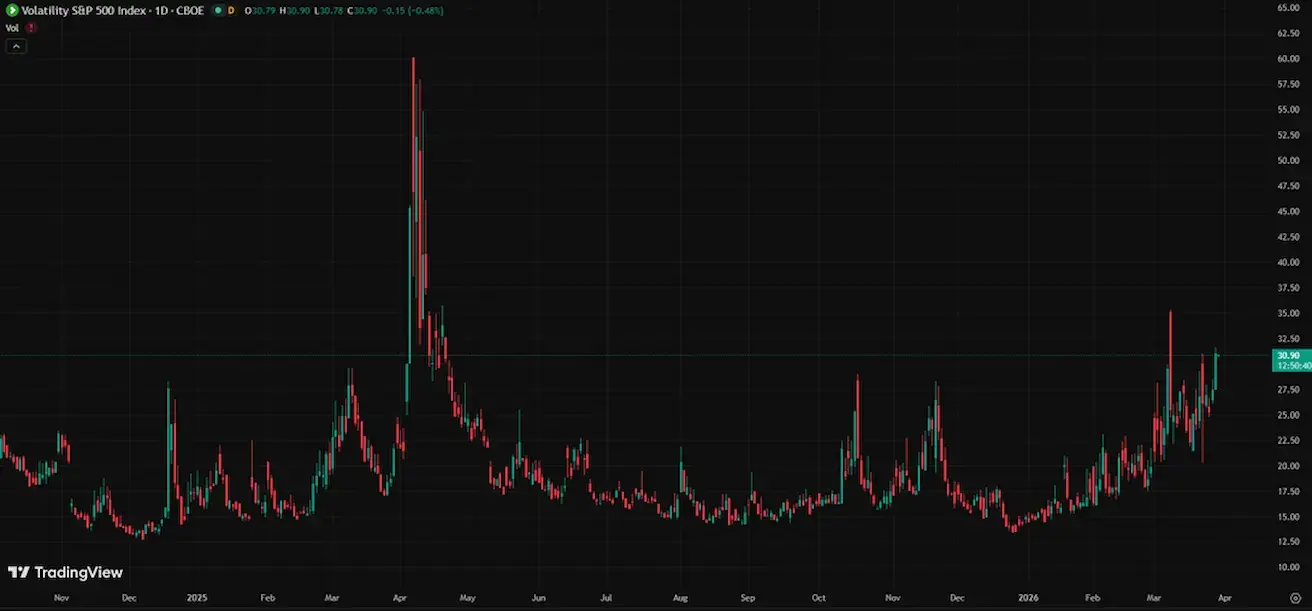
VIX
- VIX (құбылмалылық индексі): 30,89
Еуроаймақ
- Базалық мөлшерлеме әзірге өзгеріссіз, бірақ инфляциялық тәуекелдер артып келеді;
- Ақша-кредит саясаты бейтарап, бірақ тәуекелдер балансы инфляцияға қарай ауысты;
- Таяу Шығыстағы қақтығыс шиеленіскен сайын, ЕОБ ЖІӨ болжамын төмендетіп, алдағы жылдарға инфляция болжамын көтерді.
Мөлшерлемелер:
- Депозиттік мекеме мөлшерлемесі: 2,0% (бұрын: 2,0%);
- Маржиналдық кредиттеу мөлшерлемесі: 2,4% (бұрын: 2,4%) (банктердің реттеушіден бір түнге қарыз алу мөлшерлемесі);
- Негізгі қайта қаржыландыру мөлшерлемесі: 2,15% (бұрын: 2,15%).
Инфляция: Тұтынушылар бағасы индексі (ТБИ) (ақпан):
- Негізгі ТБИ (жылдық): 2,4% (бұрын: 2,2%);
- ТБИ (айлық): 0,6% (бұрын: -0,6%, түзетілген);
- ТБИ (жылдық): 1,9% (бұрын: 1,7%).
ЖІӨ 4-тоқсан (қорытынды): тоқсандық: 0,3% (бұрын: 0,3%); жылдық: 1,3% (бұрын: 1,4%).
Жұмыссыздық деңгейі (ақпан): 6,10% (бұрын: 6,20%).
Сатып алушылар менеджерлерінің индексі (PMI) (наурыз):
- Қызмет көрсету: 50,1 (бұрын: 51,9);
- Өндіріс: 51,4 (бұрын: 50,8);
- S&P Global Composite: 50,5 (бұрын: 51,9).
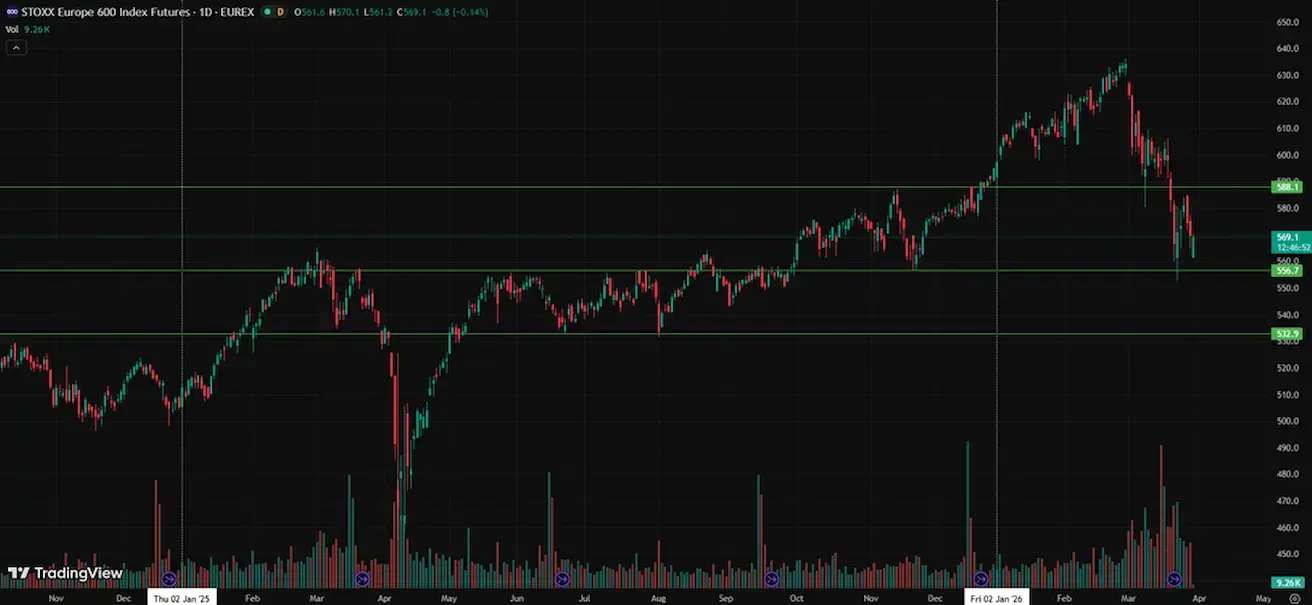
EURO STOXX 600 (FXXP1!)
- Апталық өзгеріс: +0,55% (апта соңындағы жабылу: 569,9); жыл басынан бері: -4,06%.
Қытай
Экономика экспорттың арқасында тұрақтанып келеді, бірақ ішкі сұраныс пен инвестиция әлсіз; ынталандыру шаралары нысаналы және сақтықпен жүргізілуде.
- Мөлшерлемелер өзгеріссіз қалды;
- Ақша-кредит саясаты ынталандырушы сипатта;
- Қытай 2026 жылғы жоспары аясында экономикалық өсуді қолдау үшін бюджеттік ынталандыруды жалғастыратынын растады (ішкі сұранысты ынталандыру, салықтық жеңілдіктер мен субсидияларды оңтайландыру, өнеркәсіпті жаңғырту).
Мөлшерлемелер:
- 1 жылдық негізгі несие мөлшерлемесі (орта мерзімді кредиттеу): 3,00%;
- 5 жылдық мөлшерлеме (ипотекаға әсер етеді): 3,50%.
Инфляциялық көрсеткіштер (ақпан):
- Тұтынушылар бағасы индексі (ТБИ) (айлық): 0,1% (бұрын: 0,2%); 1,3% (бұрын: 0,2%);
- Өндірушілер бағасы индексі (ӨБИ) (жылдық): -0,9% (бұрын: -1,4%).
ЖІӨ 4-тоқсан (қорытынды): тоқсандық: 1,2% (бұрын: 1,1%); жылдық: 4,5% (бұрын: 4,8%).
Жұмыссыздық деңгейі (ақпан): 5,3% (бұрын: 5,1%).
Өнеркәсіптік өндіріс (ақпан, жылдық): 6,3% (бұрын: 5,9%).
Негізгі капиталға инвестиция (қаңтар, жылдық): -3,8% (бұрын: -2,6%).
Бөлшек сауда (қаңтар, жылдық): 0,9% (бұрын: 1,3%).
Импорт (ақпан, жылдық): 19,8% (бұрын: 5,7%).
Экспорт (ақпан, жылдық): 21,8% (бұрын: 6,6%).
Сауда балансы (АҚШ доллары) (ақпан): 213,62 млрд (бұрын: 114,11 млрд).
Сатып алушылар менеджерлерінің индексі (PMI) (ақпан):
- Өндіріс: 49,0 (бұрын: 49,3);
- Өндірістен тыс: 49,5 (бұрын: 49,4);
- Композит: 49,5 (бұрын: 49,8).
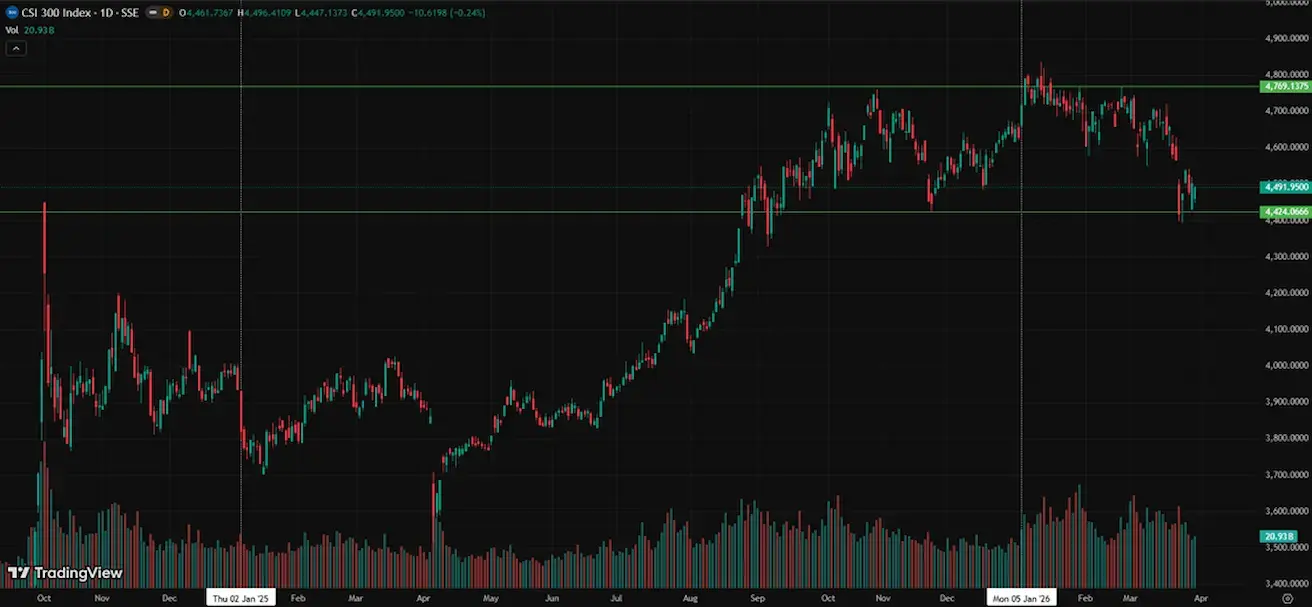
CSI 300 INDEX (000300.HK)
Апталық өзгеріс: -1,41% (апта соңындағы жабылу – 4502,5698); жыл басынан бері: -3,41%.
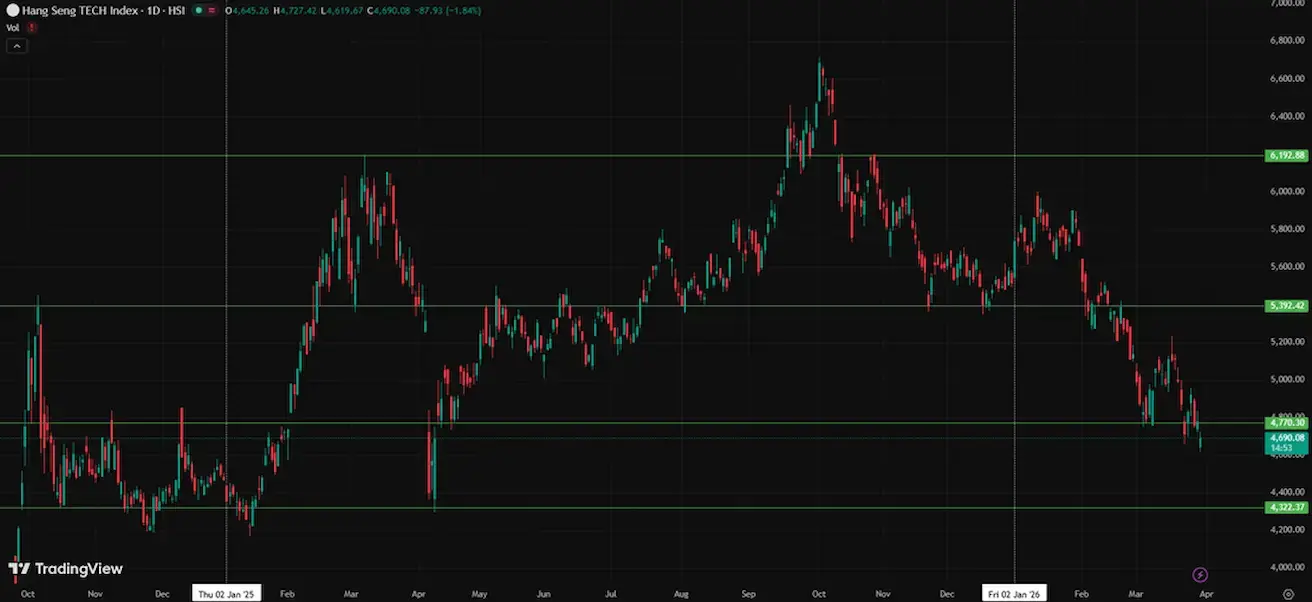
Hang Seng TECH Index (HSTECH)
Апталық өзгеріс: -1,94% (апта соңындағы жабылу: 4778,01); жыл басынан бері: -13,20%.
ОБЛИГАЦИЯ НАРЫҒЫ
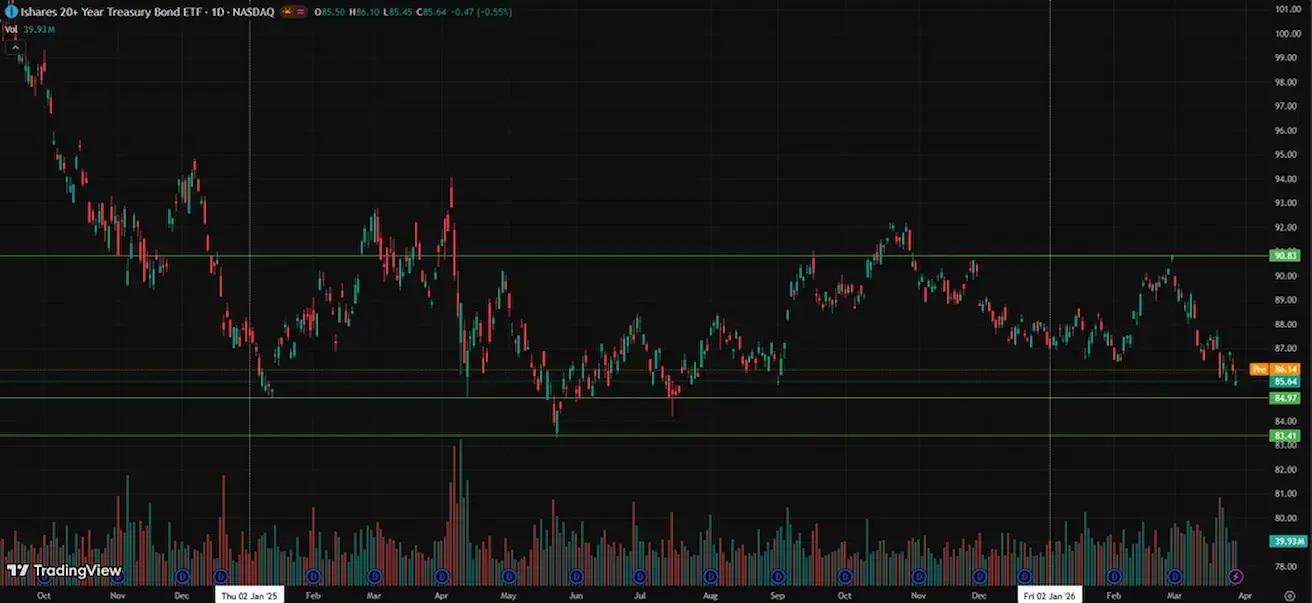
АҚШ-тың 20 жылдан астам қазынашылық облигациялары (ETF TLT): апталық өзгеріс: -0,22% (апта соңындағы жабылу: 85,64); жыл басынан бері: -1,74%.
КІРІСТІЛІКТЕР ЖӘНЕ СПРЕДТЕР
Қақтығыс басталғалы бері кірістілік бүкіл қисық бойында, әсіресе ұзақ мерзімді сегментте, өсуде – бұл инфляциялық күтулердің артып келе жатқанын көрсетеді:
Диаграммада АҚШ-тың 2 жылдық қазынашылық облигациялары бойынша аукцион нәтижелері tail/through метрикасы бойынша көрсетілген:
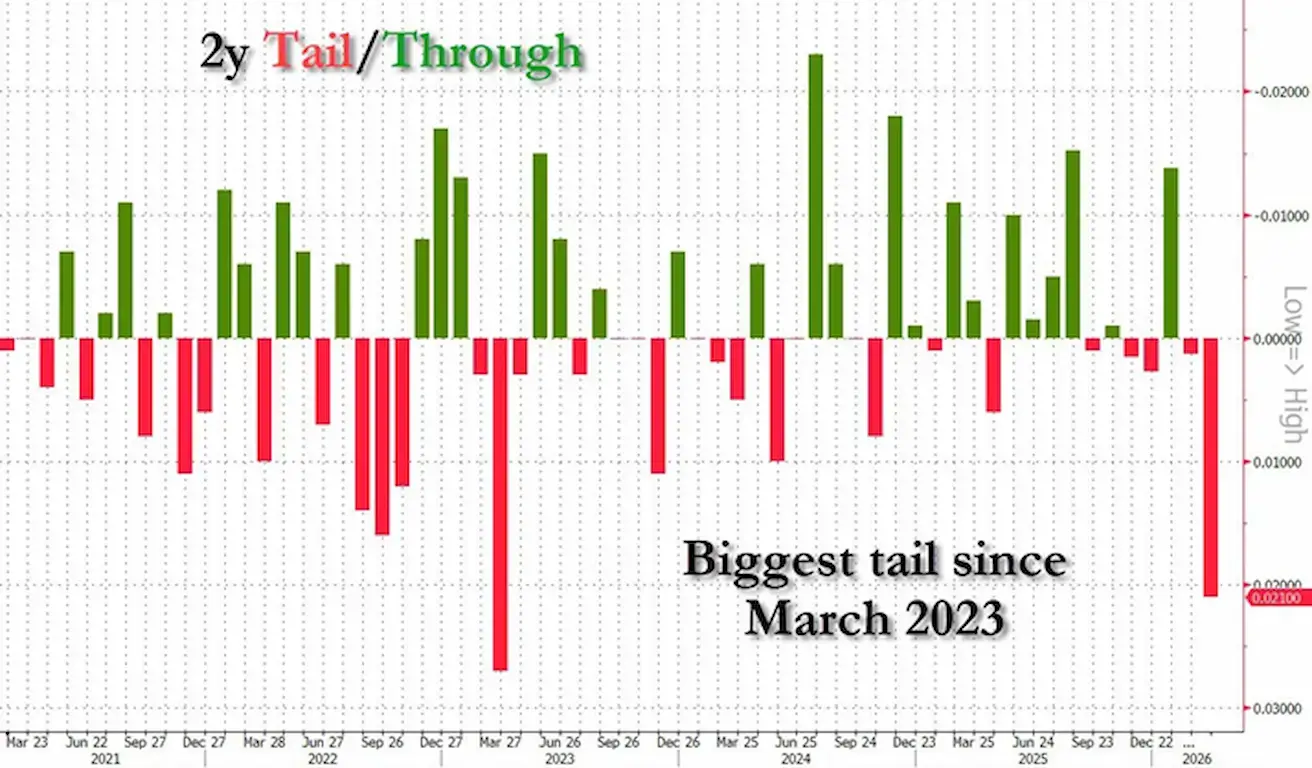
- Жасыл бағандар (through) — сұраныс жоғары (аукцион күткеннен жақсы өтеді, шығарылымдағы кірістілік төмен);
- Қызыл бағандар (tail) — сұраныс төмен (аукцион күткеннен нашар өтеді, шығарылымдағы кірістілік жоғары).
Соңғы аукцион 2023 жылғы наурыздан бері 2 жылдық облигацияларға сұраныстың ең төмен деңгейін көрсетті.
Бұл ақша нарығы үшін маңызды белгі — қисықтың қысқа ұшы бірінші болып «бұзылады», себебі 2 жылдық кірістілік ФРЖ мөлшерлемесіне қатысты күтулерді көрсетеді.
- АҚШ-тың 10 жылдық қазынашылық облигацияларының нарықтық кірістілігі: 4,39% (бұрын: 4,41%);
- 2 жылдық кірістілік: 3,88% (бұрын: 3,94%);
- ICE BofA BBB АҚШ корпоративтік индексінің тиімді кірістілігі: 5,0% (бұрын: 5,29%);
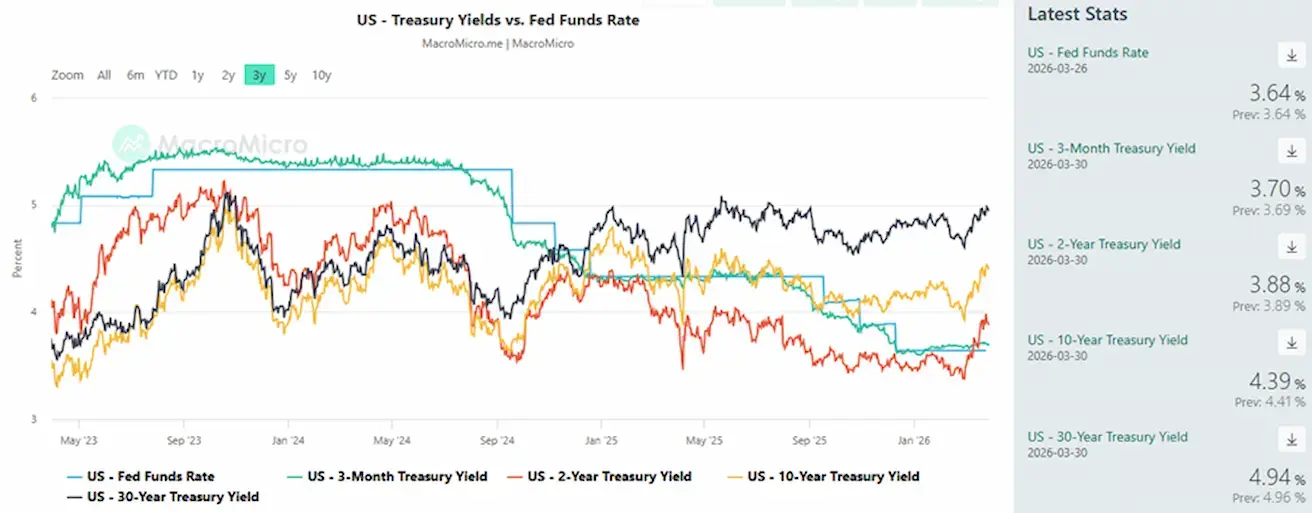
- 10 жылдық және 2 жылдық АҚШ қазынашылық облигациялары арасындағы кірістілік спрэді – 51 базистік пункт (бұрын: 47);
- 10 жылдық және 3 айлық АҚШ қазынашылық облигациялары арасындағы кірістілік спрэді – 69 базистік пункт (бұрын: 70).
5 жылдық АҚШ кредиттік дефолт свопының (CDS) құны (дефолтқа қарсы сақтандыру): 37,81 б.п. (өткен аптада 35,35 б.п.).
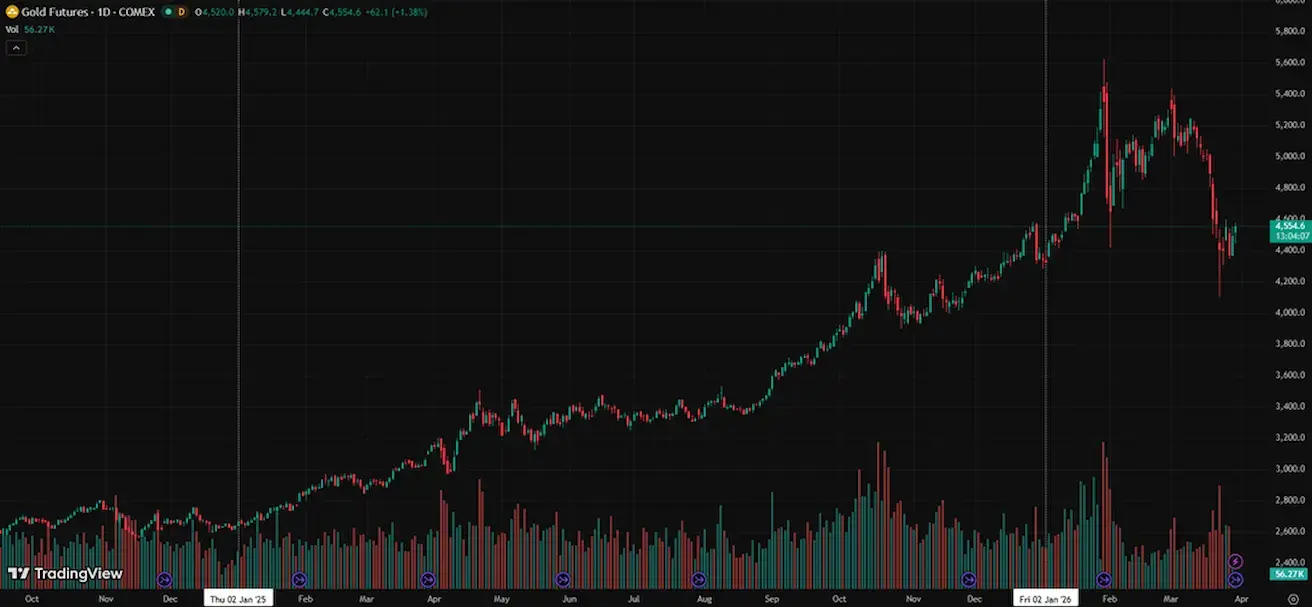
АЛТЫН ФЬЮЧЕРСТЕРІ (GC)
Апталық өзгеріс: -1,80% (апта соңындағы жабылу: $4492,5 трой унциясына); жыл басынан бері: +3,70. Көптеген орталық банктер алтын резервтерін ұлғайтуды жалғастырады.
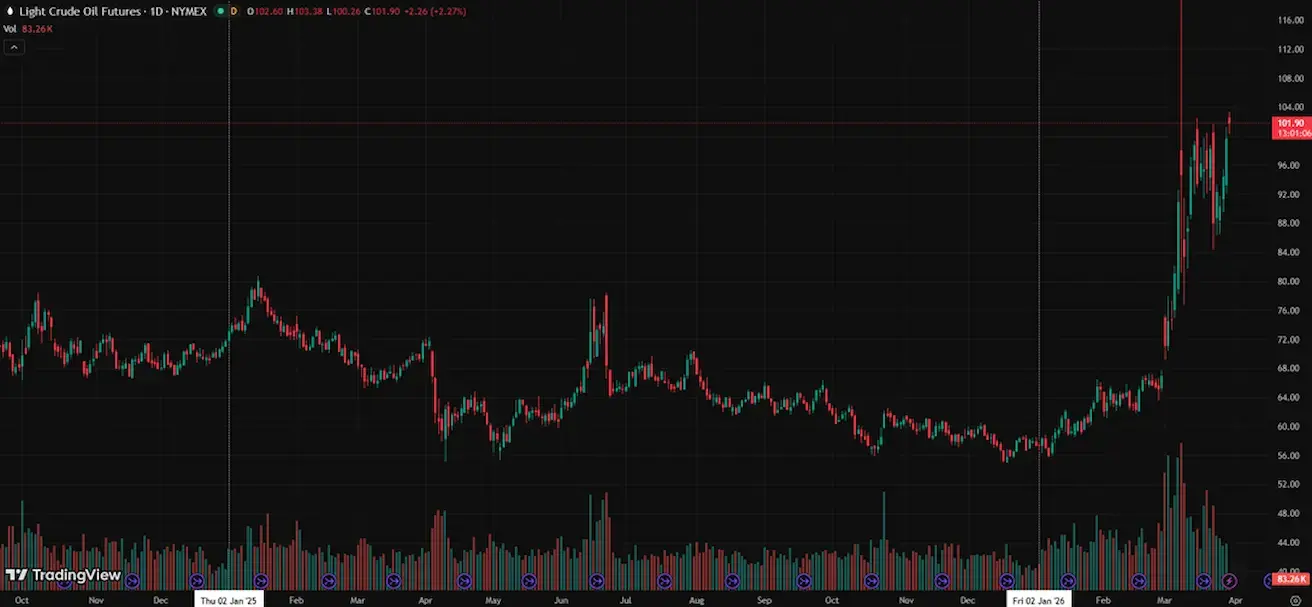
МҰНАЙ ФЬЮЧЕРСТЕРІ
Апталық өзгеріс: +1,45% (апта соңындағы жабылу: $99,65 баррельге). Жыл басынан бері: +73,58%
- ХЭА-ға мүше елдер резервтерін пайдалана бастады.
- Таяу Шығыстағы геосаяси тәуекелдер ұзақ мерзімді сипат алуы мүмкін.
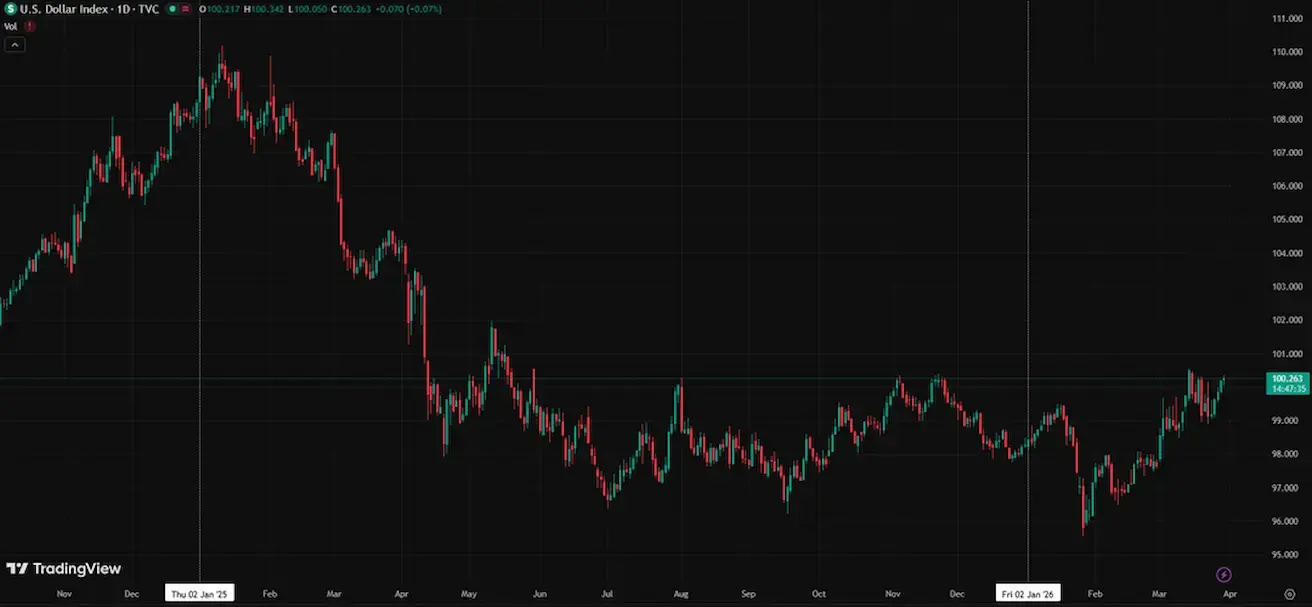
ДОЛЛАР ИНДЕКСІ ФЬЮЧЕРСТЕРІ (DX)
Апталық өзгеріс: +0,69% (апта соңындағы жабылу: 100,193). Жыл басынан бері: 2,24%.
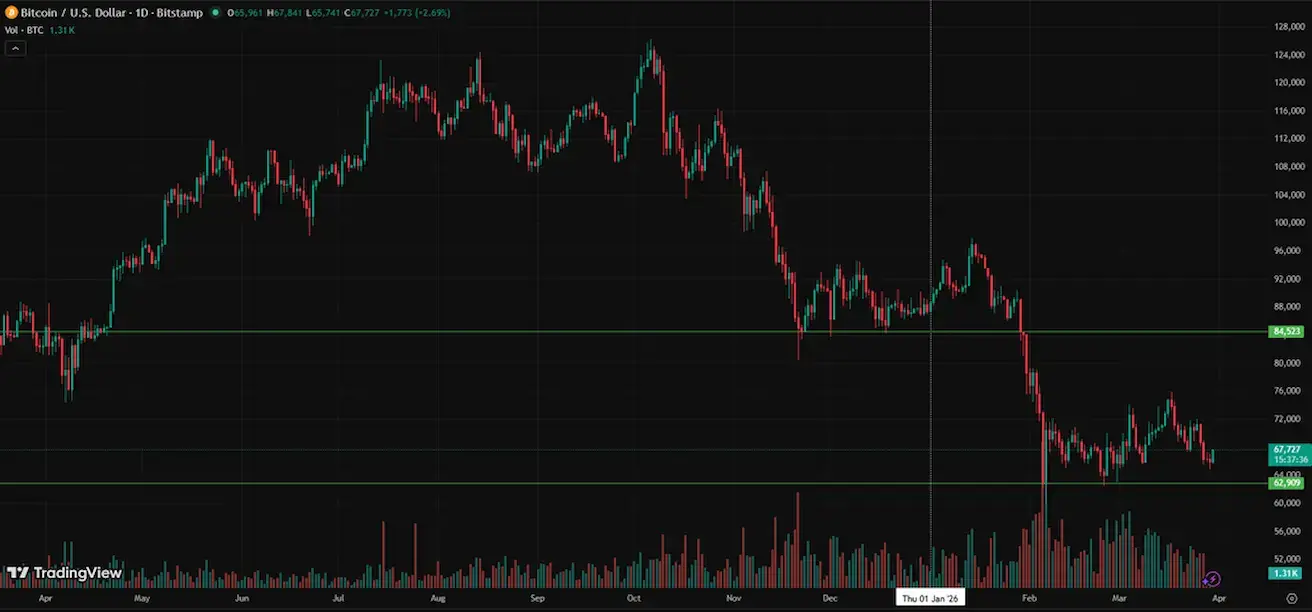
BTC ФЬЮЧЕРСТЕРІ
Апталық өзгеріс -2,81% (апта соңындағы жабылу: $65954); жыл басынан бері: -24,81%.
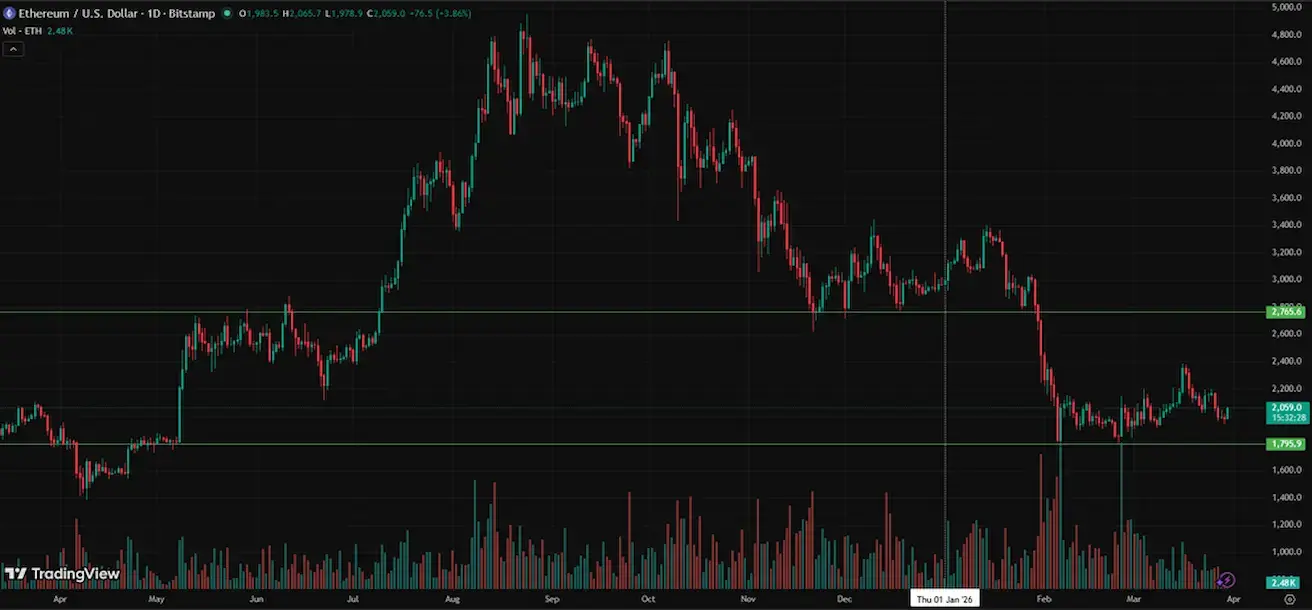
ETH ФЬЮЧЕРСТЕРІ
Апталық өзгеріс -3,43% (апта соңындағы жабылу: $1982,5); жыл басынан бері: -33,34%.
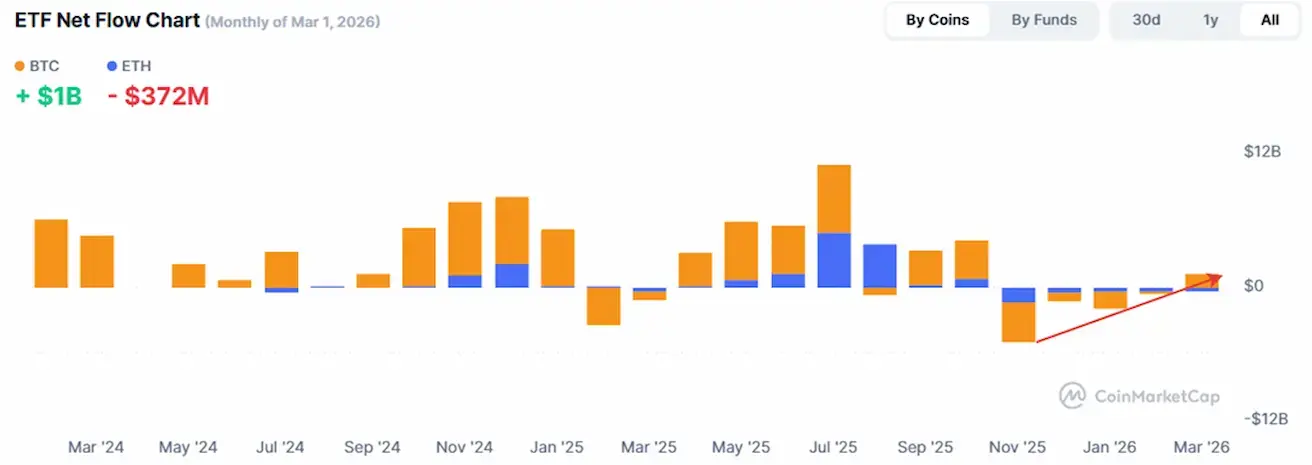
BTC — нетто-ағындар бір айға жуық теріс күйде:
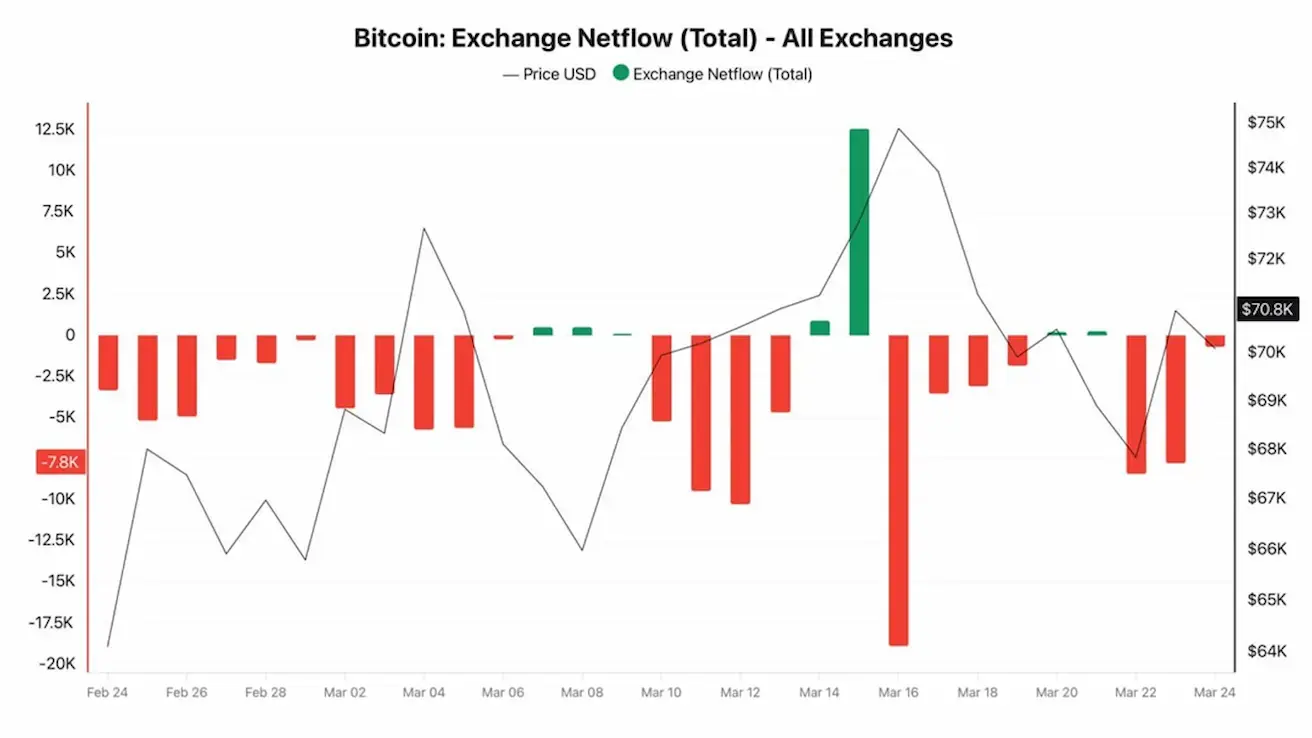
Бұл тұрақты кету инвесторлардың BTC-ны сатып алып, биржалық платформалардан шығарып жатқанын көрсетеді.
Сұраныс әлі де өсу трендін қайта бастауға жеткіліксіз, бірақ жинақтау жалғасып жатқанын көрсетеді және бұл соңғы екі айдағы диапазондық қозғалыстың себептерінің бірі болуы мүмкін.
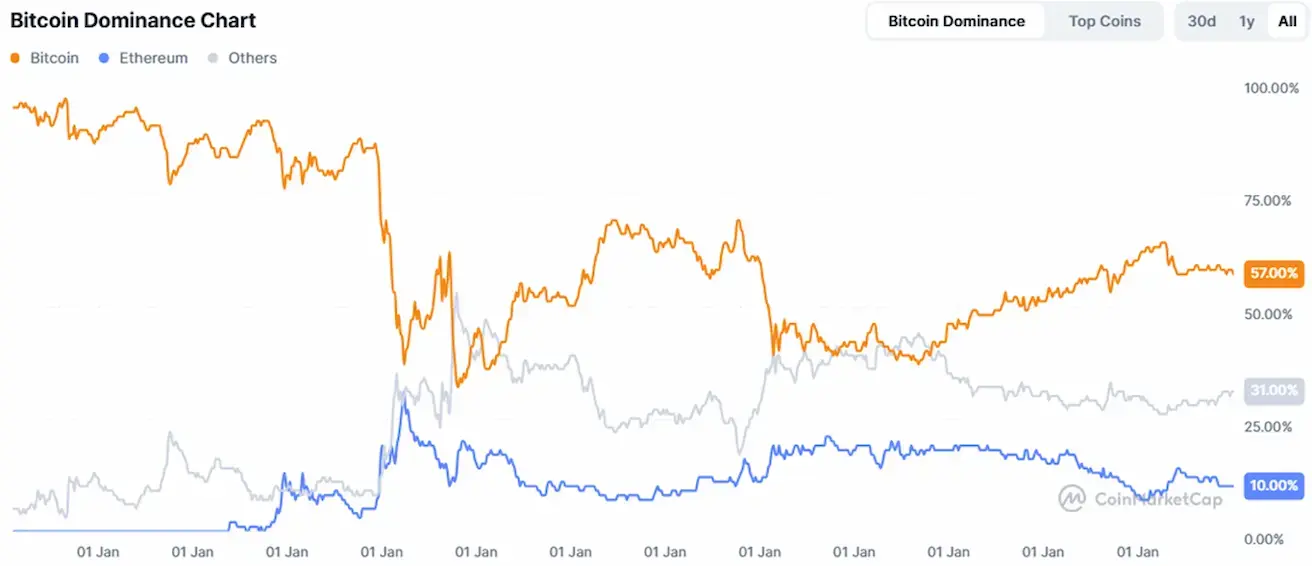
ЖАЛПЫ КРИПТОВАЛЮТА НАРЫҒЫНЫҢ КАПИТАЛИЗАЦИЯСЫ
Жалпы крипто нарығының капитализациясы: $2,33 трлн (бір апта бұрын $2,34 трлн) (coinmarketcap.com).
Крипто активтер нарығындағы үлестер:
- Bitcoin: 58,0% (58,3%)
- Ethereum: 10,6% (10,6%)
- Басқалары: 31,3% (31,2%).
ETF нетто-ағындар диаграммасы: