English
 Lietuvių
 Русский
 Eesti
Eesti2026 жылғы 9–15 наурыз: Апталық экономикалық шолу
Негізгі нарық жаңалықтары

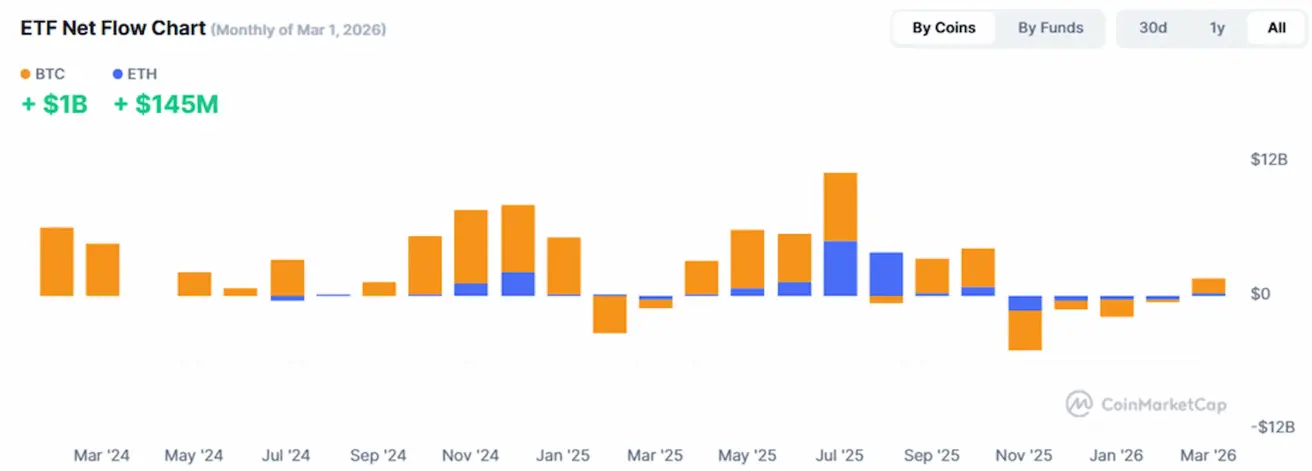
АҚШ-та тұтыну инфляциясы ақпан айында өткен көрсеткіштермен салыстырғанда жылдық есепте өзгеріссіз қалды. Негізгі индекс 2,5%-ға өсті, ал жалпы инфляция 2,4% деңгейінде болды. Осылайша, соңғы оқиғалар бұл жарияланымға әсер еткен жоқ.
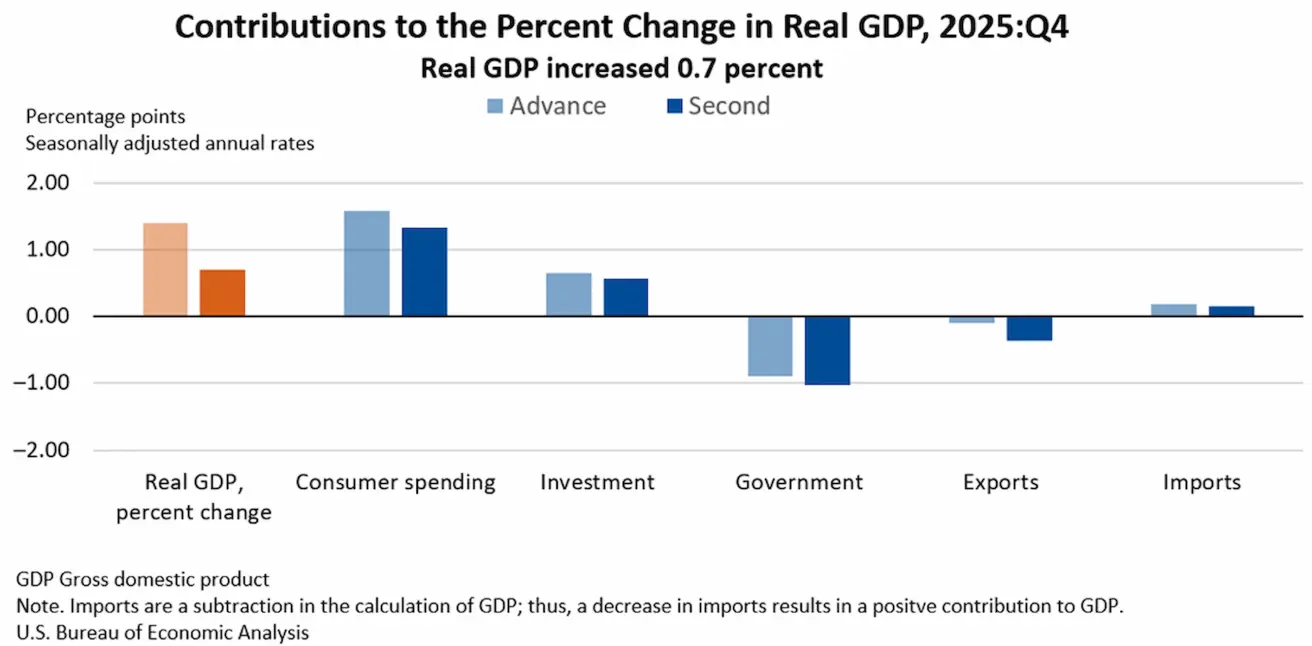
ЖІӨ деректері АҚШ экономикасының айтарлықтай баяулағанын көрсетті. Төртінші тоқсандағы өсім небәрі 0,7%-ды құрады (үшінші тоқсан: 4,4%). Барлық негізгі құрамдастарда – экспорт, тұтынушылық шығындар, мемлекеттік шығыстар және инвестициялар – төмендеу байқалды.
Осы жағдай аясында нарық пайыздық мөлшерлемелерді төмендету бойынша күтулерін (FedWatch) азайтты. Қазір тек бір рет 0,25% төмендету болжануда, бұл диапазонды 3,25–3,50%-ға жеткізеді және ол тек желтоқсандағы отырыста күтіледі. Енді назар алдағы Федералдық резерв жүйесінің отырысына ауысты, онда Пауэлл реттеушінің болашақ саясатының бағытын айқындауы тиіс.
Еуроаймақта ЕОБ өкілдерінің риторикасы мөлшерлемелерді қазіргі деңгейде ұзақ уақыт ұстауға қарай өзгеруде, әзірге өсім туралы сигналдар жоқ. Дегенмен, пайыздық мөлшерлеме нарықтары ЕОБ-ның келесі қадамы мөлшерлемені көтеру болуы мүмкін екенін бағамдап отыр.
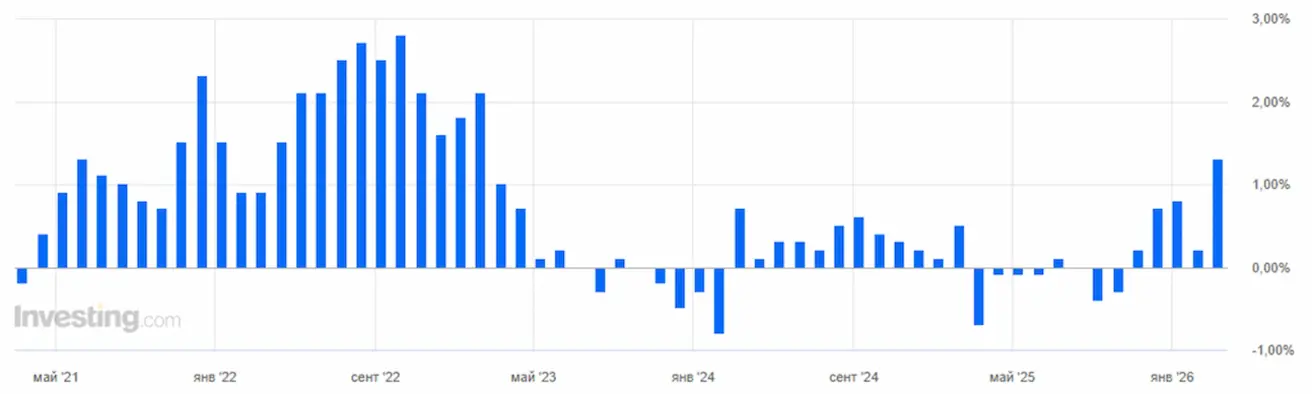
Қытайда макроэкономикалық деректер салыстырмалы түрде оң, бұл экономиканың қалпына келе бастағанын көрсетеді. Ішкі сұраныс, жылдық есепте тұтыну бағалары индексі (CPI) бойынша өлшенген, 1,3%-ға өсті – бұл 2023 жылғы сәуірден бергі ең жоғары көрсеткіш. Импорт көлемі — ішкі сұраныстың негізгі көрсеткіші — ақпанда үш есеге артып, 19,8%-ға жетті (бұрын: 5,7%). Өндіруші бағалар индексіндегі дефляция баяулап, бейтарап деңгейге жақындауда.
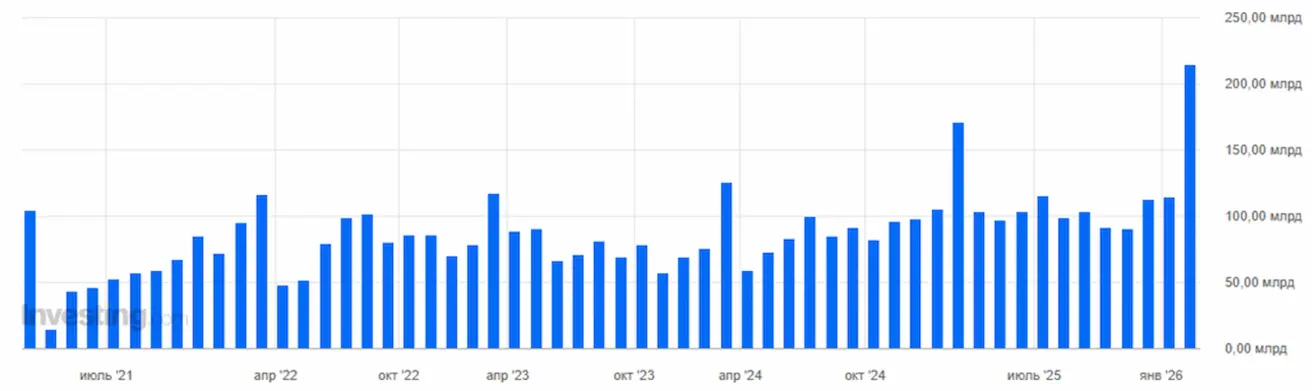
Сауда деректері де күшті өсімді көрсетті: ақпанда экспорт көлемі жылдық есепте 6,6%-дан 21,8%-ға дейін өсті. Сауда балансының профициті күрт өсіп, $213,6 млрд-қа жетті.
Мұнай нарығындағы шиеленіс сақталуда, келіссөздерге қатысты айтарлықтай ілгерілеу жоқ; тараптардың риторикасы әлі де қатаң.
Ақ үй Ормуз бұғазы арқылы транзит қауіпсіздігін қамтамасыз ету бойынша нақты жоспар жоқ екенін мәлімдеді. Трамп НАТО мен барлық мүдделі елдерді бұл мәселені шешуге шақырды. Жауап ретінде оптимизм аз, өйткені қақтығысқа араласуға ниеттілер аз.
Қарыз нарықтарындағы кірістілік қақтығыс басталғалы бері өсуде. Алтын арзандауда, ал негізгі криптовалюталар айтарлықтай өсім көрсетуде.
Макроэкономикалық статистика. АҚШ (Негізгі қорытындылар)
- Пайыздық мөлшерлемелер өзгеріссіз қалды; риторика сақтықпен сипатталады.
- Ақша-несие саясатының бағыты қалыпты шектеулі күйде, біртіндеп бейтарапқа жақындауда.
- Федералдық резерв жүйесі нарықтарды қолдауды жалғастыра отырып, мөлшерлемелерді жылдам төмендету туралы сигнал беруден аулақ.
- АҚШ ЖІӨ деректері экономикалық белсенділіктің айтарлықтай баяулағанын көрсетеді.
ИНФЛЯЦИЯ: ТҰТЫНУ БАҒАЛАРЫ ИНДЕКСІ (АҚПАН):
Негізгі CPI: (айлық) 0,2% (бұрын: 0,3%); (жылдық) 2,5% (бұрын: 2,5%).
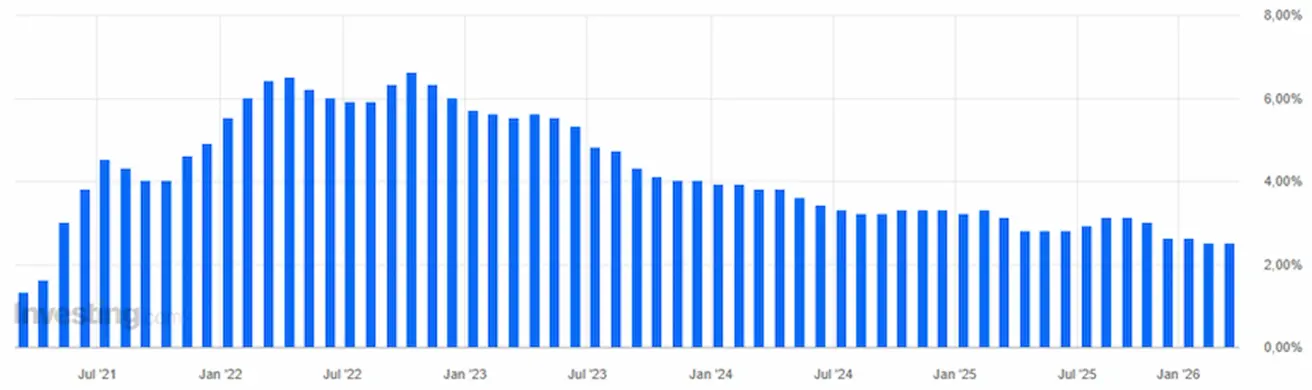
CPI: (айлық) 0,3% (бұрын: 0,2%); (жылдық) 2,4% (бұрын: 2,4%).
ӨНДІРУШІ БАҒАЛАР ИНДЕКСІ (ҚАҢТАР):
PPI (айлық): 0,5%, бұрын: 0,2%. Негізгі PPI (айлық): 0,7%, бұрын: 0,0% (қайта қаралған):
ИНФЛЯЦИЯ КҮТУЛЕРІ (МИЧИГАН) (АҚПАН):
- 12 айлық инфляция күтулері: 3,4%, бұрын: 4,0%.
- 5 жылдық инфляция күтулері: 3,3%, бұрын: 3,3%.
АҚШ ЖІӨ дефляторы (тоқсандық): 3,8% (бұрын: 3,7%) АҚШ ЖІӨ (Экономикалық талдау бюросы, BEA) — 2025 жылғы 4-тоқсан, жылдық есепте (екінші бағалау): +0,7% (2025 жылғы 3-тоқсан: +4,4%).
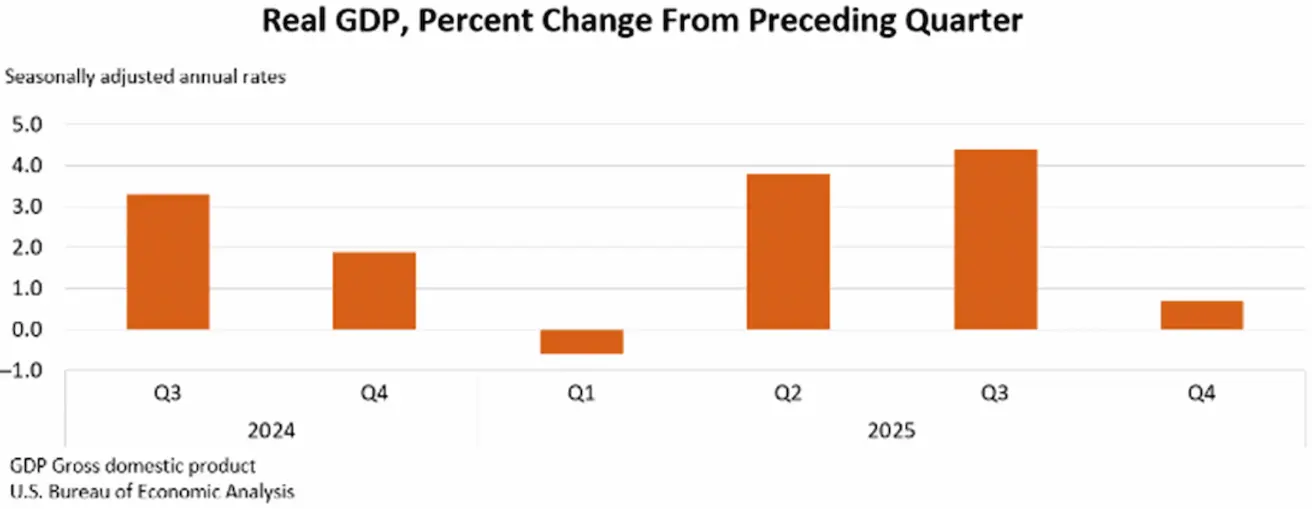
Екінші бағалау экспорт, тұтынушылық шығындар, мемлекеттік шығыстар және инвестициялардың төмендеуін көрсетеді. Импорт бұрын күтілгеннен аз қысқарды.
Атланта Федералдық резерв жүйесінің GDPNow индикаторы (ресми ЖІӨ жариялануына дейінгі «нақты уақыттағы» бағалау): 2,7% (бұрын: 2,1%).
ІСКЕРЛІК БЕЛСЕНДІЛІК ИНДЕКСІ (PMI) (АҚПАН):
(50-ден жоғары – кеңею, 50-ден төмен – қысқару)
- Қызмет көрсету секторы: 51,7 (бұрын: 52,7);
- Өндірістік сектор: 51,2 (бұрын: 52,4);
- S&P Global Composite: 51,9 (бұрын: 53,0).
ЕҢБЕК НАРЫҒЫ (BLS) (АҚПАН)
- Жұмыссыздық деңгейі: 4,3% (бұрын: 4,4%);
- АҚШ-тағы жалғасып жатқан жұмыссыздық бойынша өтініштер саны: 1 850 мың (бұрын: 1 871 мың);
- Алғашқы жұмыссыздық бойынша өтініштер: 213 мың (бұрын: 214 мың);
- АҚШ-тағы ауыл шаруашылығынан тыс жұмыс орындарының өзгерісі: 130 мың (бұрын: 48 мың);
- АҚШ-тағы жеке сектордағы ауыл шаруашылығынан тыс жұмыс орындарының өзгерісі: 172 мың (бұрын: −64 мың);
- Орташа сағаттық жалақы (жылдық): 3,7% (бұрын: 3,8%);
- JOLTS бос жұмыс орындары: 6,542 млн (бұрын: 6,928 млн).
АҚША-НЕСИЕ САЯСАТЫ
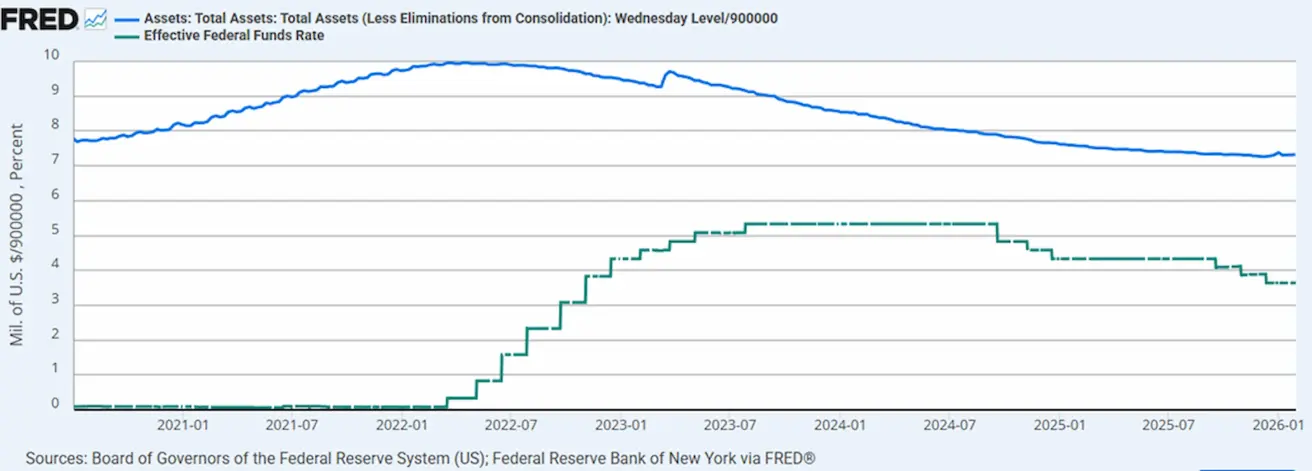
- Федералдық қорлар мөлшерлемесінің тиімді диапазоны (EFFR): 3,50%–3,75%;
- Федералдық резерв жүйесінің балансы: $6,646 трлн, QT тоқтатылғаннан бері +1,70% ($6,535 трлн).
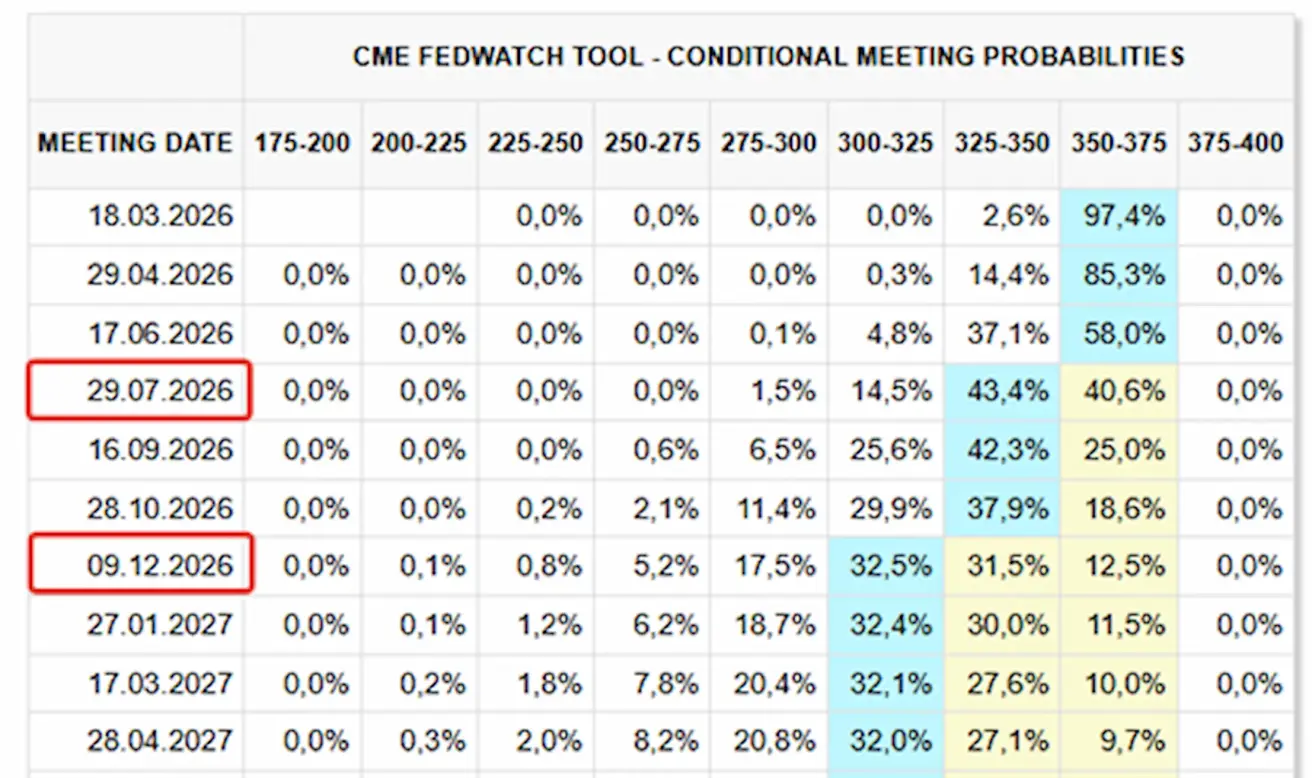
МӨЛШЕРЛЕМЕ БОЙЫНША НАРЫҚ БОЛЖАМЫ (FEDWATCH)
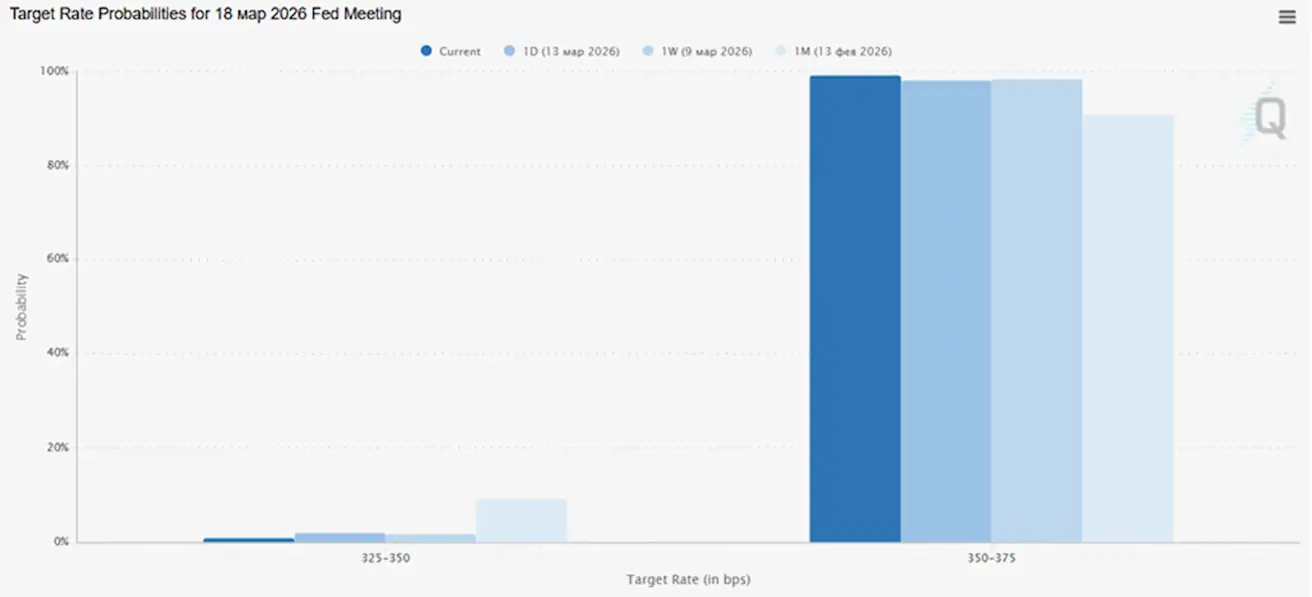
Алдағы отырысқа (18 наурыз) қатысты мөлшерлеме өзгеріссіз қалады деген ықтималдық 99,21%.
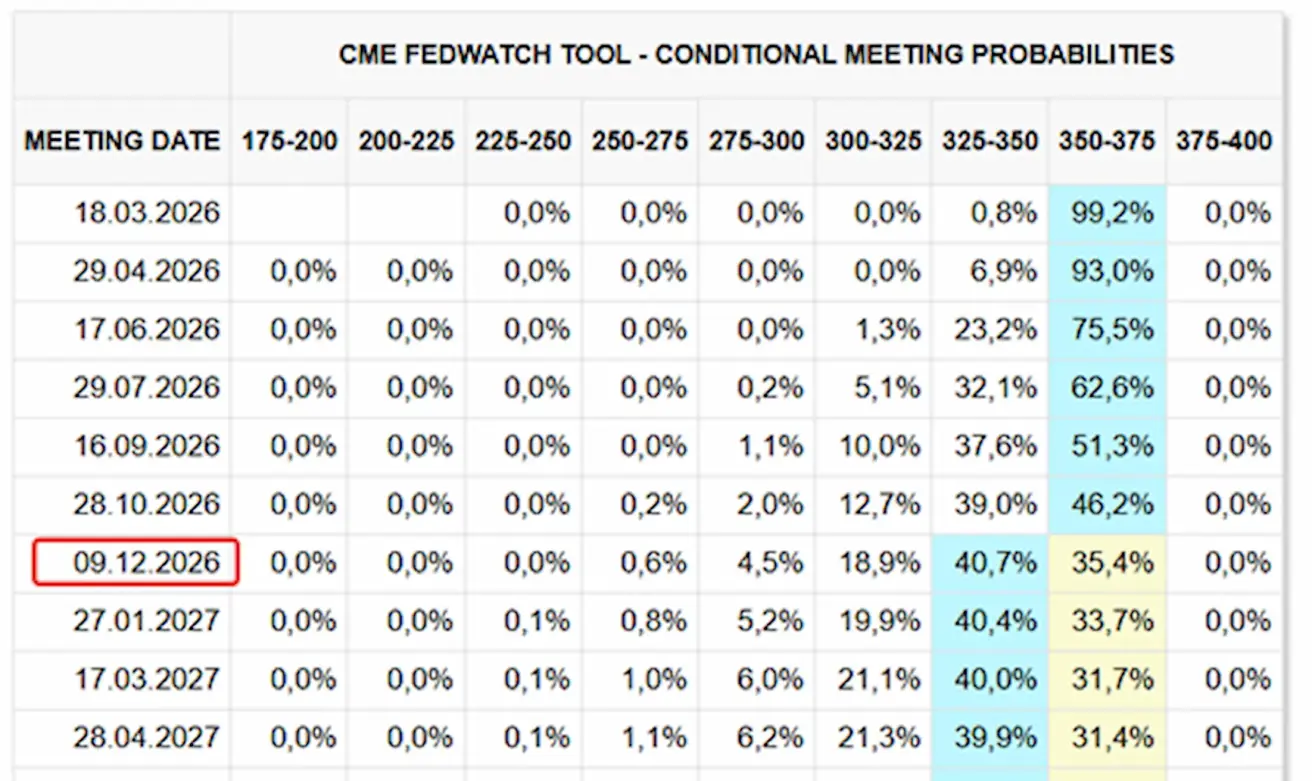
Алдағы 12 айда нарық 0,25%-ға бір рет төмендетуді күтеді, бұл диапазонды 3,25–3,50%-ға жеткізеді, желтоқсандағы отырыста күтілгендей.
Бүгін:
Бір апта бұрын:
Goldman Sachs пайыздық мөлшерлеме болжамы
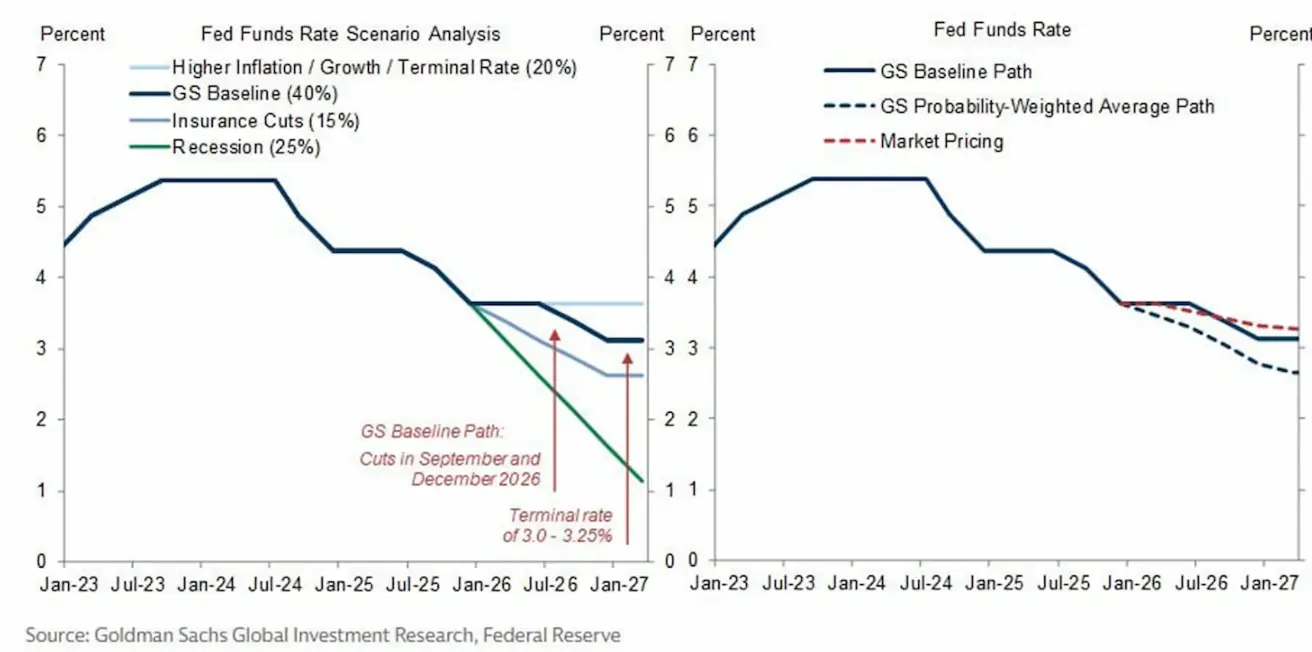
Goldman Sachs Федералдық резерв жүйесінің мөлшерлеме траекториясы бойынша бірнеше сценарий ұсынады. Базалық сценарийге сәйкес, алғашқы төмендету 2026 жылғы қыркүйекте, келесісі желтоқсанда болады, содан кейін мөлшерлеме 3,0–3,25% диапазонында тұрақталады деп күтіледі. Трамп Пауэллге мөлшерлемені келесі FOMC отырысын күтпей-ақ дереу төмендетуді талап етті. Инвесторлар қазір алдағы FOMC отырысына назар аударуда. Бір жағынан, төртінші тоқсанның ЖІӨ деректері мөлшерлемені төмендету циклінің жалғасу ықтималдығын арттырады. Екінші жағынан, инфляция мақсатты деңгейге жеткен жоқ, ал егер инфляция тұрақты болып қалса, мөлшерлемелер ұзақ уақыт бойы қазіргі деңгейде сақталуы мүмкін.
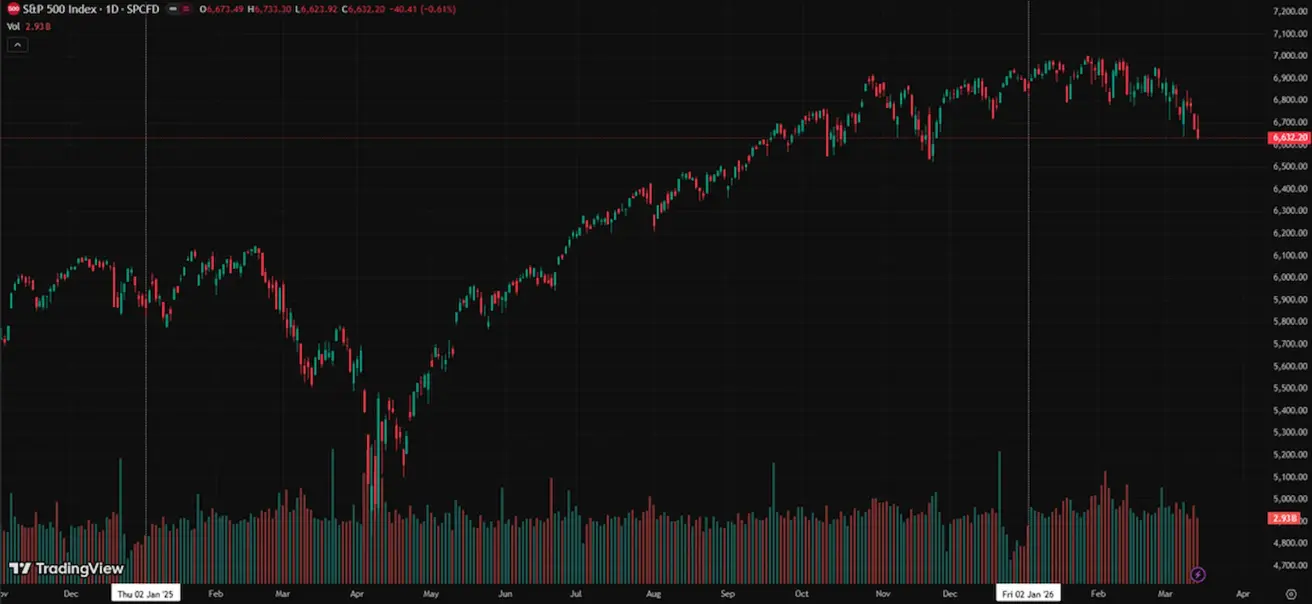
SP500
Апталық өзгеріс: –1,20% (апта соңындағы жабылу: 6632,20); жыл басынан бері: -3,12%.
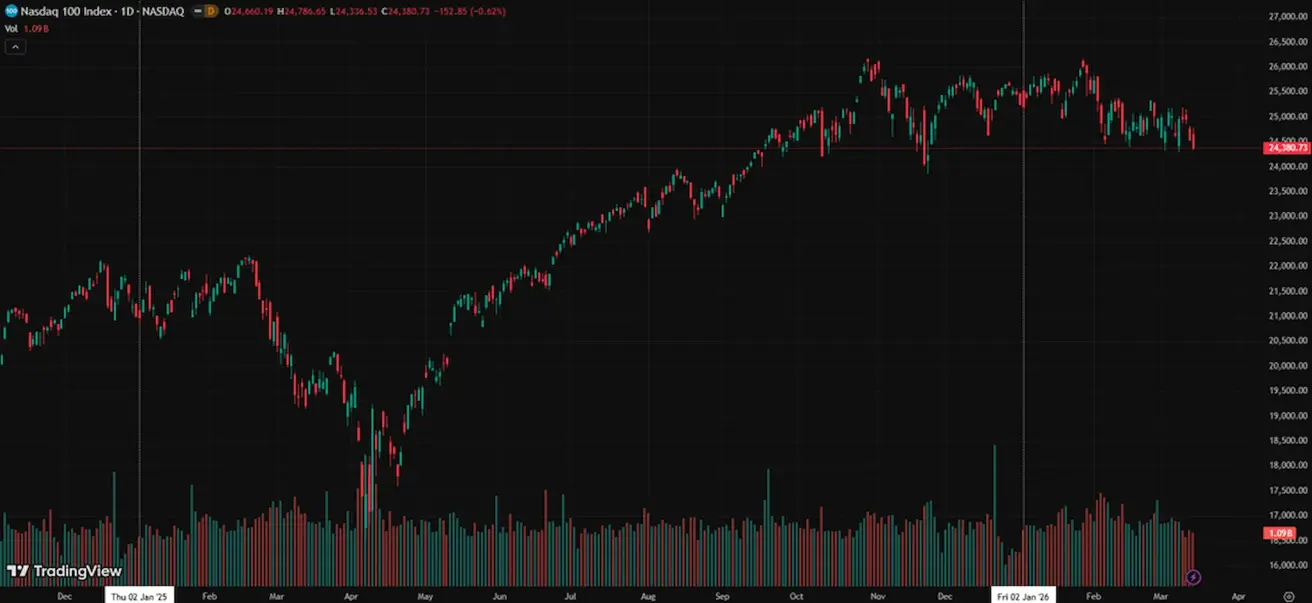
NASDAQ100
Апталық өзгеріс: -1,06% (апта соңындағы жабылу: 24380,73); жыл басынан бері: -3,44%.
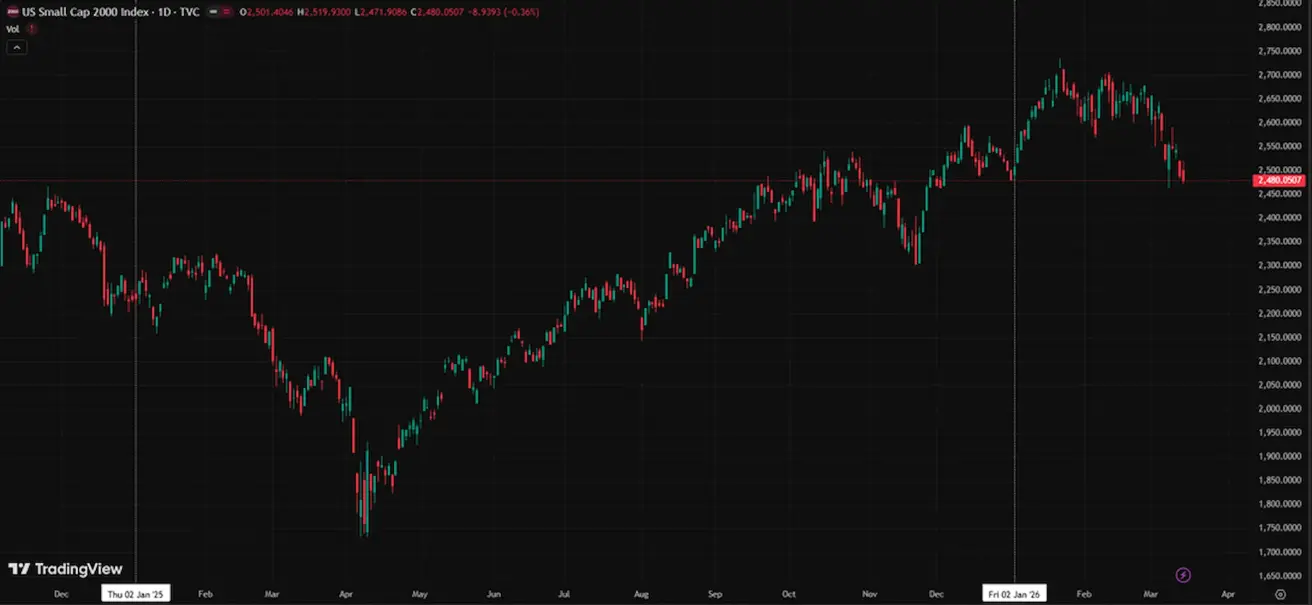
RUSSEL 2000 (RUT)
Апталық өзгеріс: -1,79% (апта соңындағы жабылу: 2480,0507); жыл басынан бері: -0,07%.
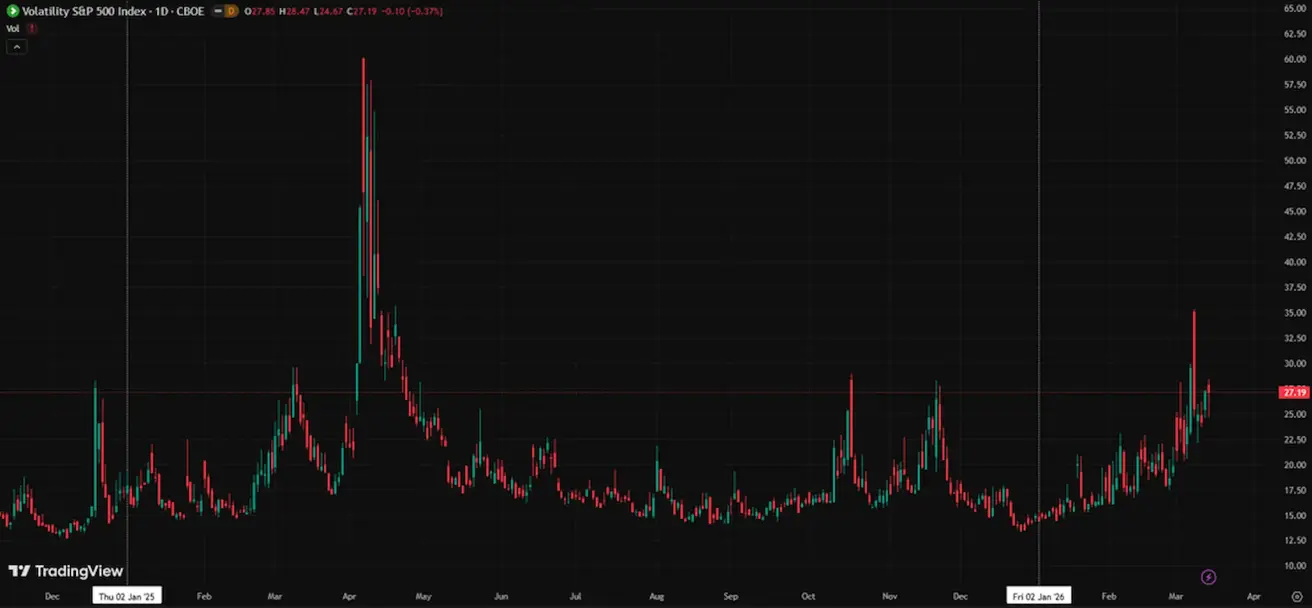
VIX
VIX (құбылмалылық индексі): 27,19 деңгейінде жоғары болып тұр.
Еуроаймақ
- Пайыздық мөлшерлемелер өзгеріссіз, бірақ инфляциялық тәуекелдер артуда.
- Ақша-несие саясаты бейтарап, тәуекелдер балансы инфляциядан экономикалық әлсіздікке қарай ауысуда.
- Сауда шиеленістері бәсеңдеген соң, ЕОБ алдағы жылдарға арналған ЖІӨ мен инфляция болжамдарын жоғары қарай қайта қарады.
- Еуропа тұрақтануда, бірақ өсім қарқыны бойынша АҚШ-тан артта қалып отыр.
Пайыздық мөлшерлемелер
- Депозиттік операциялар мөлшерлемесі: 2,0% (бұрын: 2,0%)
- Маржиналдық кредиттеу мөлшерлемесі: 2,4% (бұрын: 2,4%) — банктер реттеушіден түнгі қарыз ала алатын мөлшерлеме
- Негізгі қайта қаржыландыру (саяси) мөлшерлемесі: 2,15% (бұрын: 2,15%)
Инфляция — Тұтыну бағалары индексі (CPI) (ақпан)
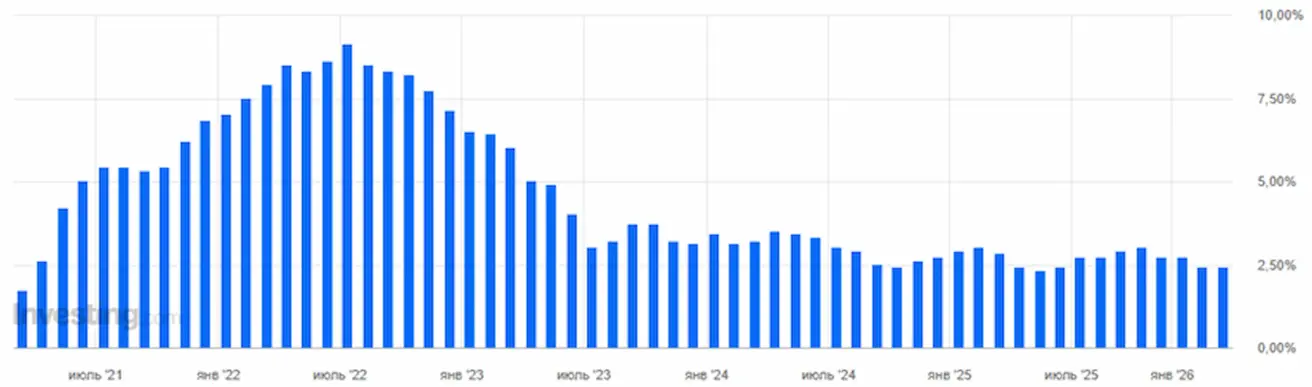
- Негізгі CPI (жылдық): 2,4% (бұрын: 2,2%)
- CPI (айлық): 0,7% (бұрын: -0,6%, қайта қаралған)
- CPI (жылдық): 1,9% (бұрын: 1,7%, қайта қаралған)
ЖІӨ 4-тоқсан (соңғы бағалау)
- Тоқсандық: 0,3% (бұрын: 0,3%)
- Жылдық: 1,3% (бұрын: 1,4%)
Жұмыссыздық деңгейі (ақпан)
- 6,10% (бұрын: 6,20%)
Сатып алушылар менеджерлерінің индексі (PMI) (ақпан)
- Қызмет көрсету секторы: 51,9 (бұрын: 51,8)
- Өндірістік сектор: 49,5 (бұрын: 49,4)
- S&P Global Composite: 51,9 (бұрын: 51,9)
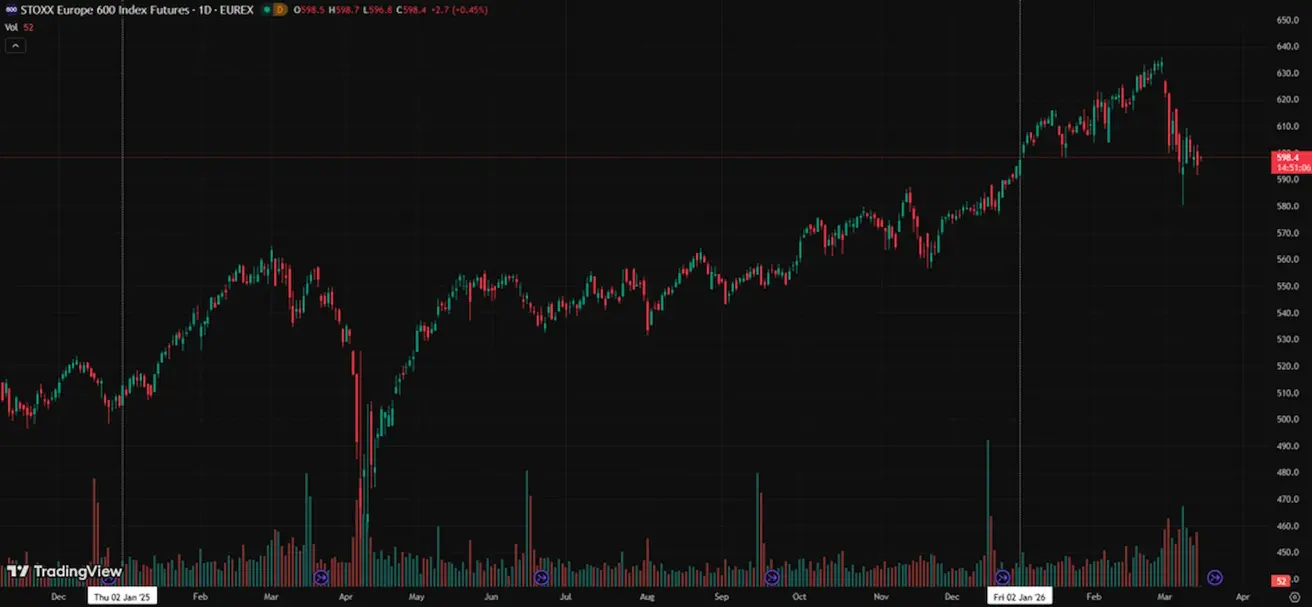
EURO STOXX 600 (FXXP1!)
Апталық өзгеріс: -0,23% (апта соңындағы жабылу: 595,7); жыл басынан бері: +0,29%.
Қытай
Экономика тұрақтанып келеді, экспорттың жоғары деңгейімен қатар ішкі сұраныс қалпына келе бастады. Ынталандыру шаралары мақсатты және сақтықпен жүргізілуде.
- Пайыздық мөлшерлемелер өзгеріссіз.
- Ақша-несие саясаты ынталандырушы күйде.
- Қытай 2026 жылғы саяси шеңберінде экономикалық өсімді қолдау үшін бюджеттік ынталандыруды жалғастыратынын растады, оған ішкі сұранысты ынталандыру, салықтық жеңілдіктер мен субсидияларды оңтайландыру және өнеркәсіпті жаңғырту шаралары кіреді.
Пайыздық мөлшерлемелер
- 1 жылдық негізгі қарыз мөлшерлемесі (орта мерзімді несиелеу): 3,00%
- 5 жылдық негізгі қарыз мөлшерлемесі (ипотекалық несиелеуге әсер етеді): 3,50%
Инфляциялық көрсеткіштер (ақпан)
Тұтыну бағалары индексі (CPI)
- Айлық: 0,1% (бұрын: 0,2%)
- Жылдық: 1,3% (бұрын: 0,2%)
Өндіруші бағалар индексі (PPI) (жылдық): -0,9% (бұрын: -1,4%).
ЖІӨ 4-тоқсан (соңғы бағалау):
- Тоқсандық: 1,2% (бұрын: 1,1%)
- Жылдық: 4,5% (бұрын: 4,8%)
Экономикалық көрсеткіштер
- Жұмыссыздық деңгейі (қаңтар): 5,1% (бұрын: 5,1%)
- Өнеркәсіптік өндіріс (қаңтар, жылдық): 5,9% (бұрын: 4,8%)
- Негізгі капиталға инвестициялар (қаңтар, жылдық): -3,8% (бұрын: -2,6%)
- Бөлшек сауда (қаңтар, жылдық): 0,9% (бұрын: 1,3%)
- Импорт көлемі (ақпан, жылдық): 19,8% (бұрын: 5,7%)
- Экспорт көлемі (ақпан, жылдық): 21,8% (бұрын: 6,6%)
- Сауда балансы (АҚШ доллары, ақпан): $213,62 млрд (бұрын: $114,11 млрд).
Сатып алушылар менеджерлерінің индексі (PMI) (ақпан):
- Өндірістік сектор: 49,0 (бұрын: 49,3)
- Өндірістік емес сектор: 49,5 (бұрын: 49,4)
- Композиттік PMI: 49,5 (бұрын: 49,8)
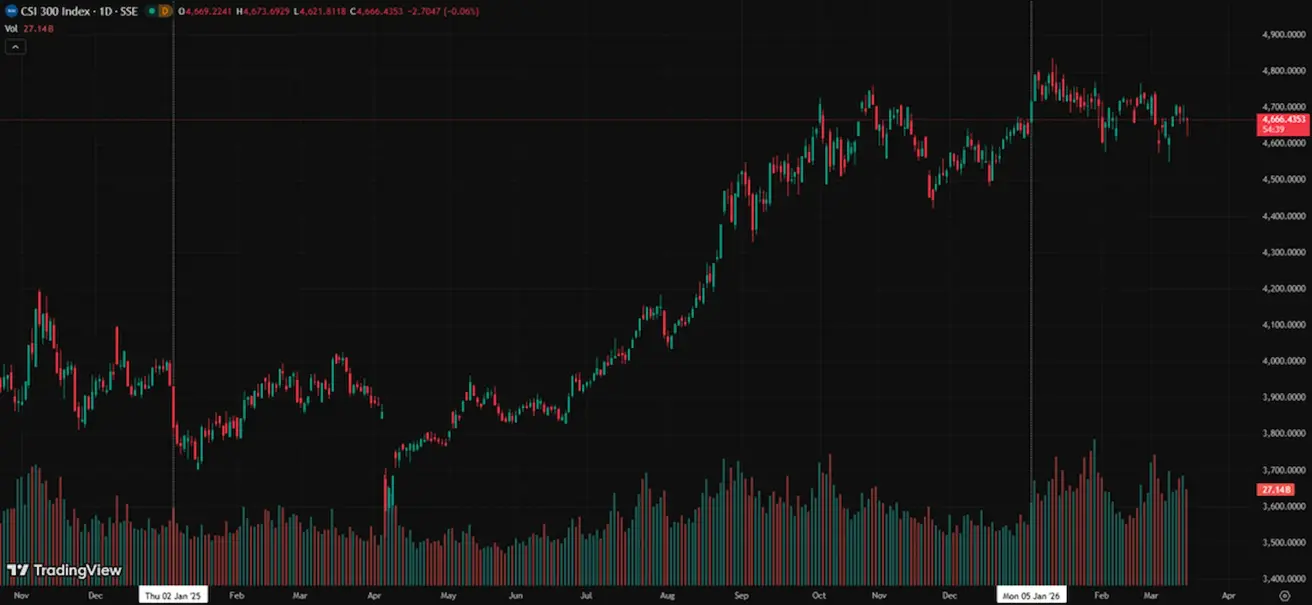
CSI 300 INDEX (000300.HK)
Апталық өзгеріс: +0,19 % (апта соңындағы жабылу: 4669,14); жыл басынан бері: +0,85%.
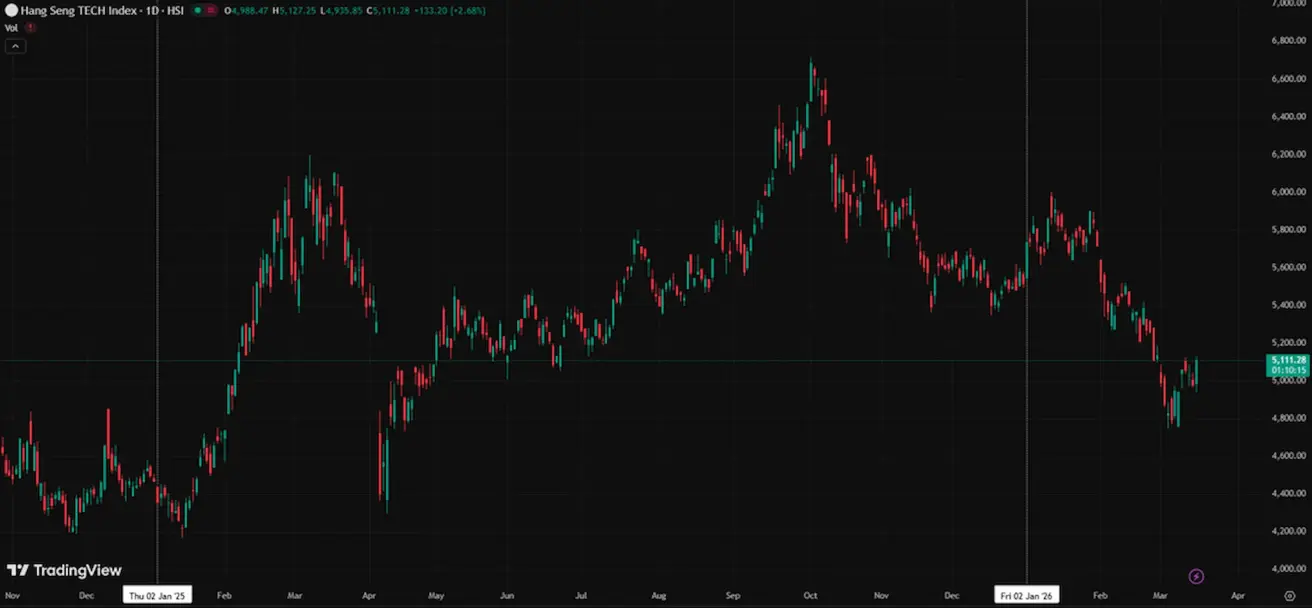
Hang Seng TECH Index (HSTECH)
Апталық өзгеріс: +0,62% (апта соңындағы жабылу: 4978,08); жыл басынан бері: -9,56%.
ОБЛИГАЦИЯ НАРЫҒЫ
Қақтығыс басталғалы бері кірістілік бүкіл қисық бойында, әсіресе ұзақ мерзімді сегментте өсуде, бұл инфляциялық күтулердің артқанын көрсетеді.
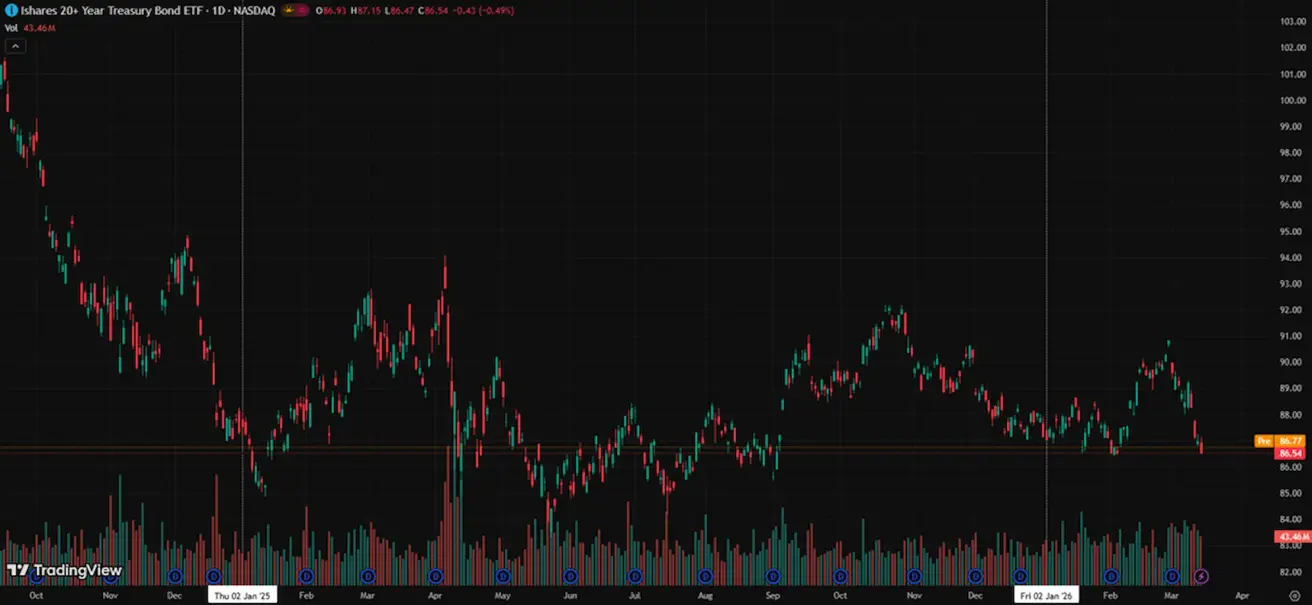
АҚШ қазынашылық облигациялары 20+ (ETF TLT):
- Апталық өзгеріс: -2,17% (апта соңындағы жабылу: 86,54)
- Жыл басынан бері: -0,71%.
КІРІСТІЛІКТЕР ЖӘНЕ СПРЕДТЕР
АҚШ-тың 10 жылдық қазынашылық облигацияларының нарықтық кірістілігі: 4,26% (бұрын: 4,12%); 2 жылдық облигациялар кірістілігі: 3,70% (бұрын: 3,57%)
- ICE BofA BBB АҚШ корпоративтік индексінің тиімді кірістілігі: 5,28% (бұрын: 5,09%).
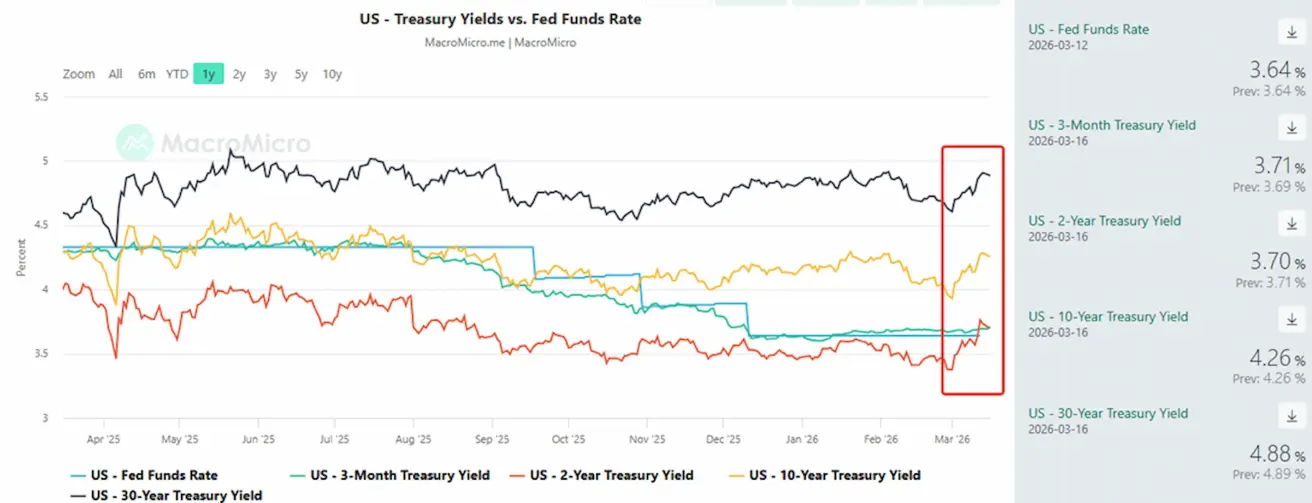
- АҚШ-тың 10 жылдық және 2 жылдық қазынашылық облигациялары арасындағы кірістілік спреді 56 базистік пункт (бұрын: 55).
- АҚШ-тың 10 жылдық және 3 айлық қазынашылық облигациялары арасындағы кірістілік спреді 55 базистік пункт (бұрын: 43).
АҚШ-тың 5 жылдық кредиттік дефолт свопы (CDS) — АҚШ-тың егемендік дефолтына қарсы сақтандыру құны — 35,99 б.п. (өткен аптада: 33,30 б.п.).
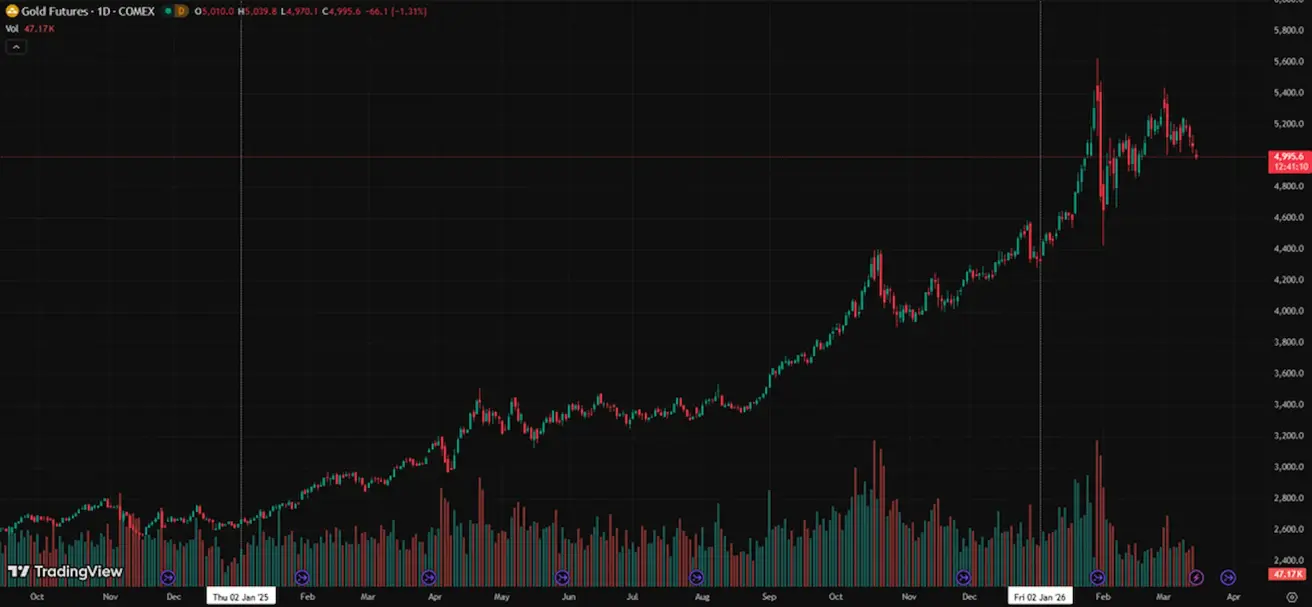
АЛТЫН ФЬЮЧЕРСТЕРІ (GC)
Апталық өзгеріс: -1,88% (апта соңындағы жабылу: $5061,7 трой унциясына); жыл басынан бері: +16,84.
Графикте Таяу Шығыстағы мұнай экспорттаушы елдер қатысқан ірі әскери қақтығыстарға дейін және кейінгі алтын бағасының динамикасы көрсетілген.
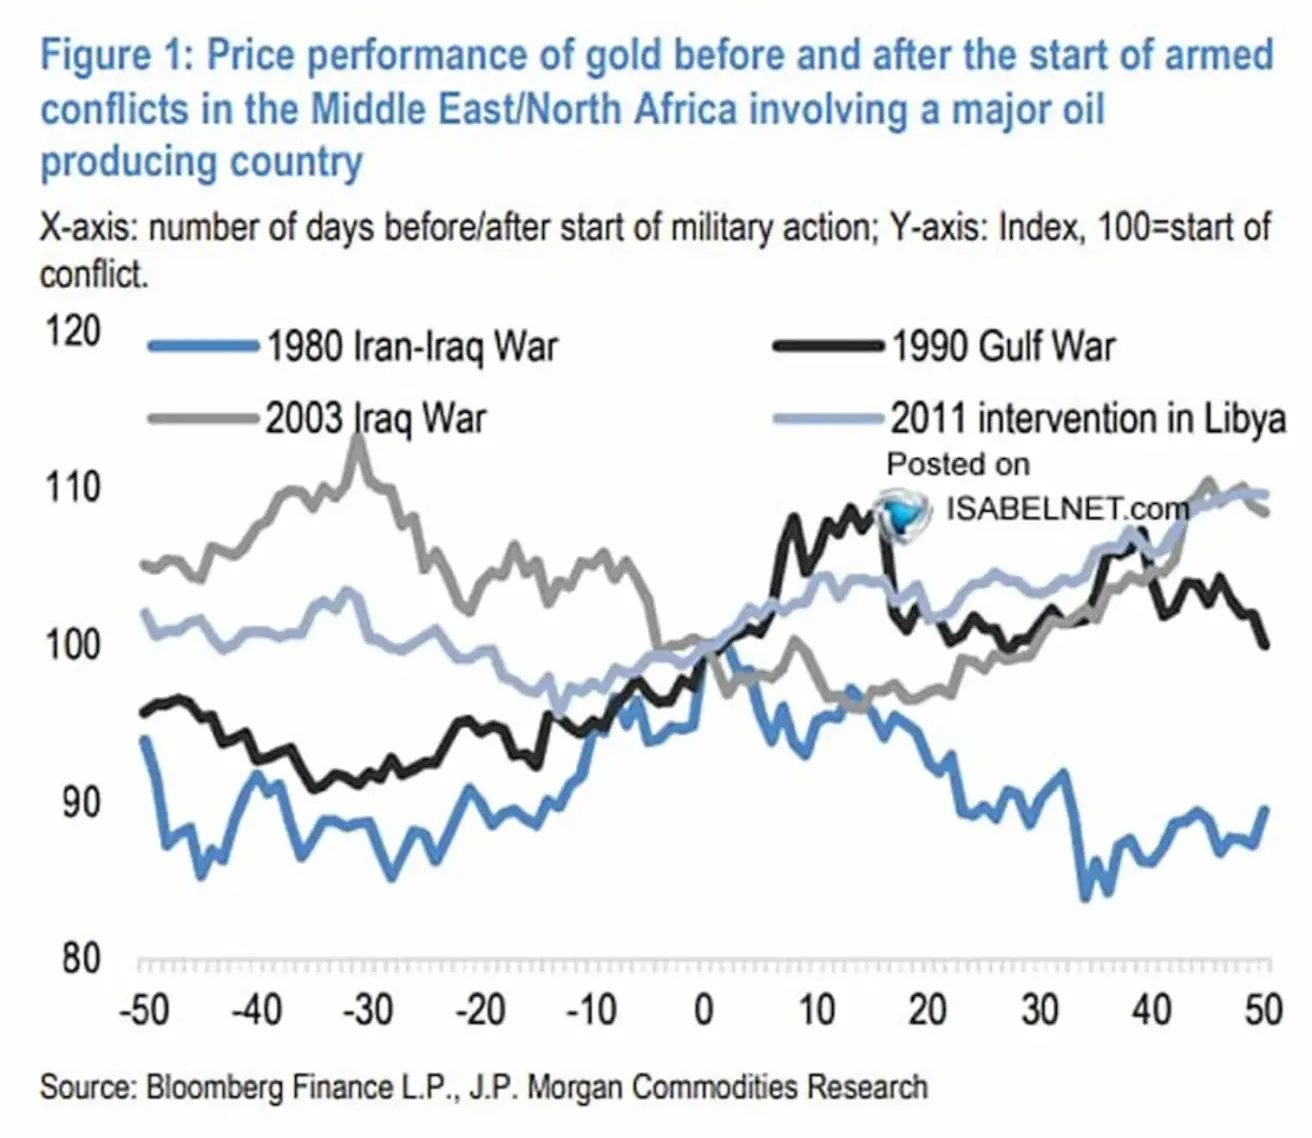
X осі – әскери операция басталғанға дейінгі және кейінгі күндер саны. 0 – қақтығыс басталған күн; теріс мәндер – қақтығысқа дейінгі күндер, оң мәндер – кейінгі күндер. Y осі – алтын бағасының индексі, мұнда 100 – қақтығыс басталған күндегі баға.
Сызықтар әртүрлі тарихи қақтығыстарды білдіреді:
- Иран–Ирак соғысы (1980)
- Парсы шығанағы соғысы (1990)
- Ирак соғысы (2003)
- Ливияға интервенция (2011)
Қақтығыс басталғаннан кейін нарықтың реакциясы әртүрлі болды: екі жағдайда алтын бағасы өсе берді, ал екеуінде тұрақтанды немесе төмендеді. Нарықтар көбіне геосаяси тәуекел сыйымдылығын алдын ала бағалайды. Сондықтан алтын бағасының күрт өсуі қақтығыс басталғаннан кейін бірден бола бермейді — бұл бүгінгі күні де байқалады, яғни геосаяси тәуекел қазіргі бағаларда ескерілген болуы мүмкін.
МҰНАЙ ФЬЮЧЕРСТЕРІ
Апталық өзгеріс: +8,59% (апта соңындағы жабылу: $98,71 баррельге). Жыл басынан бері: +71,94%. Қазіргі уақытта мұнай бағасы $100-дан жоғары.
- OPEC+ тәулігіне 201 мың баррельге (әлемдік ұсыныстың шамамен 0,2%) жеткізуді арттырғанын жариялады.
- ХЭА мүше елдері қажет болған жағдайда стратегиялық қорларды пайдалануға дайын екендерін білдірді.
- Таяу Шығыстағы геосаяси тәуекелдер жоғары күйінде қалып отыр.
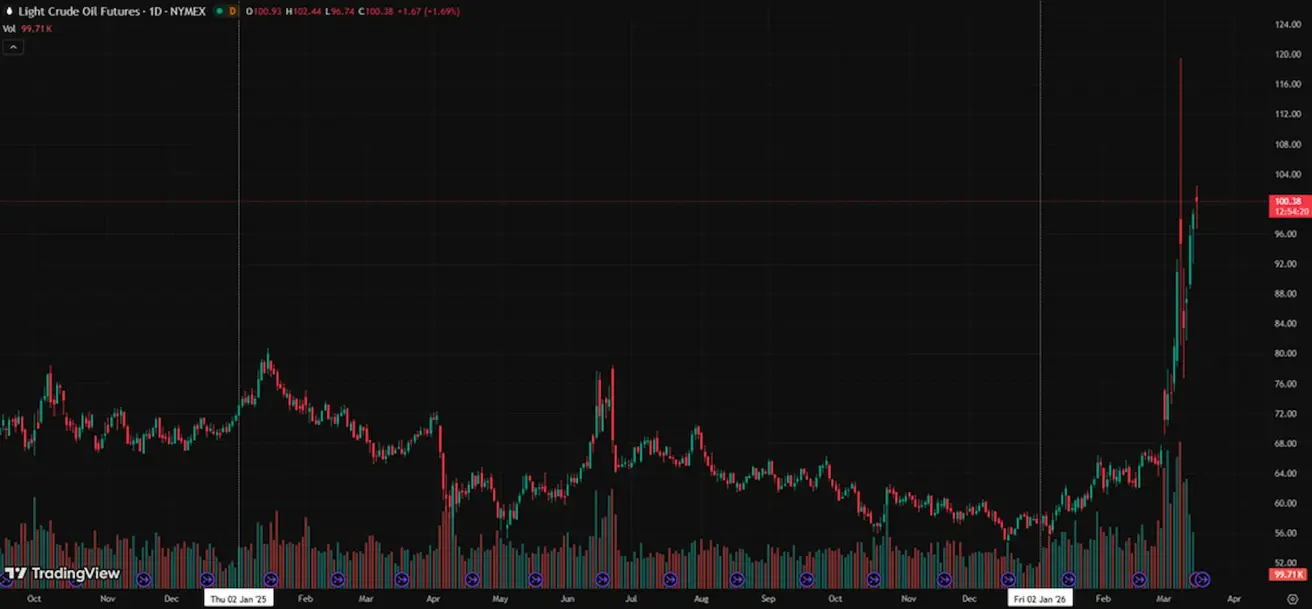
Bloomberg болжамы бойынша, егер Ормуз бұғазы үш айға жабылса, мұнай бағасы $160-тан жоғары болуы мүмкін. Bank of America неғұрлым қалыпты сценарийді күтеді: 2026 жылдың соңына қарай Brent мұнайының орташа бағасы шамамен $77 болады. Қазіргі бағаның күрт өсуінен кейін төмендеу жылдың екінші жартысында басталады деп болжануда. 2027 жылға қарай орташа баға шамамен $65 болады.
ХЭА: Ормуз бұғазы арқылы танкерлерді өткізу тарифтері 600%-ға өсті. Сауд Арабиясы, БАӘ, Кувейт және Ирак мұнай өндіруді тәулігіне 6,7 млн баррельге қысқартты — бұл әлемдік ұсыныстың шамамен 6%-ы және олардың жиынтық өндірісінің үштен бірі. Өндірісті бұрынғы деңгейге қайтару бірнеше айға созылуы мүмкін. Парсы шығанағы елдері энергия ағынының бұзылуы тез шешілмесе, «апатты салдар» болуы мүмкін деп ескертті. ХЭА стратегиялық қорлардан рекордтық 400 млн баррельді босатуды жоспарлап отыр, бұл уақытша ұсыныс тапшылығын өтеуге көмектесуі мүмкін.
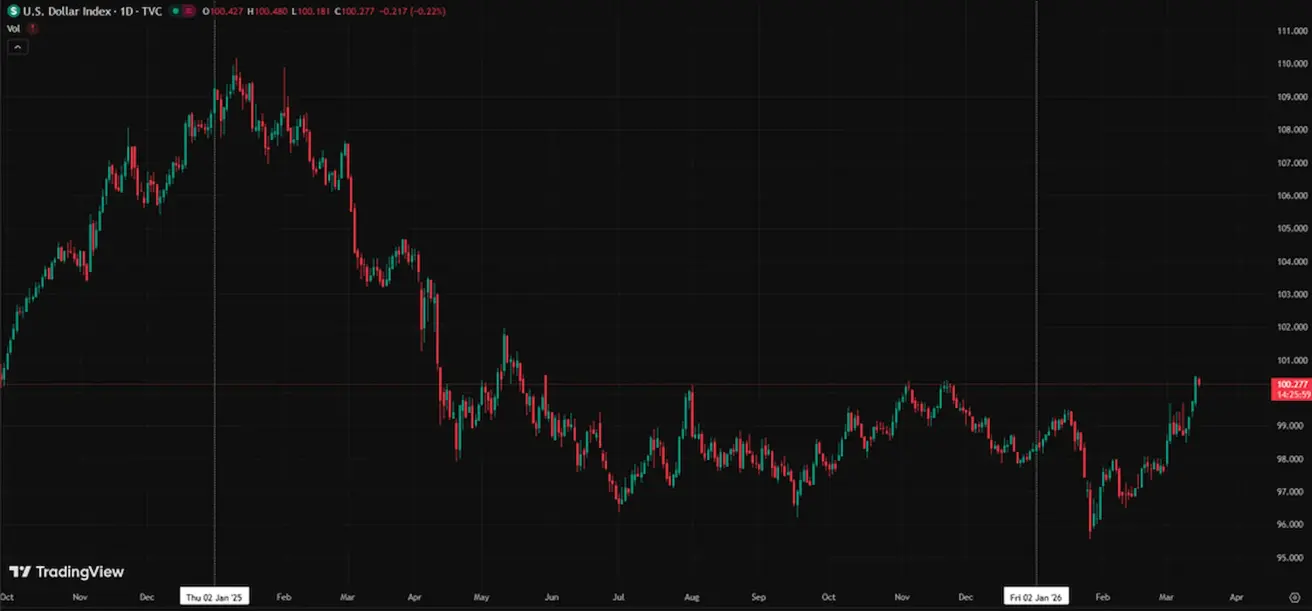
ДОЛЛАР ИНДЕКСІ ФЬЮЧЕРСТЕРІ (DX)
Апталық өзгеріс: +1,66% (апта соңындағы жабылу: 100,494). Жыл басынан бері: +2,55%.
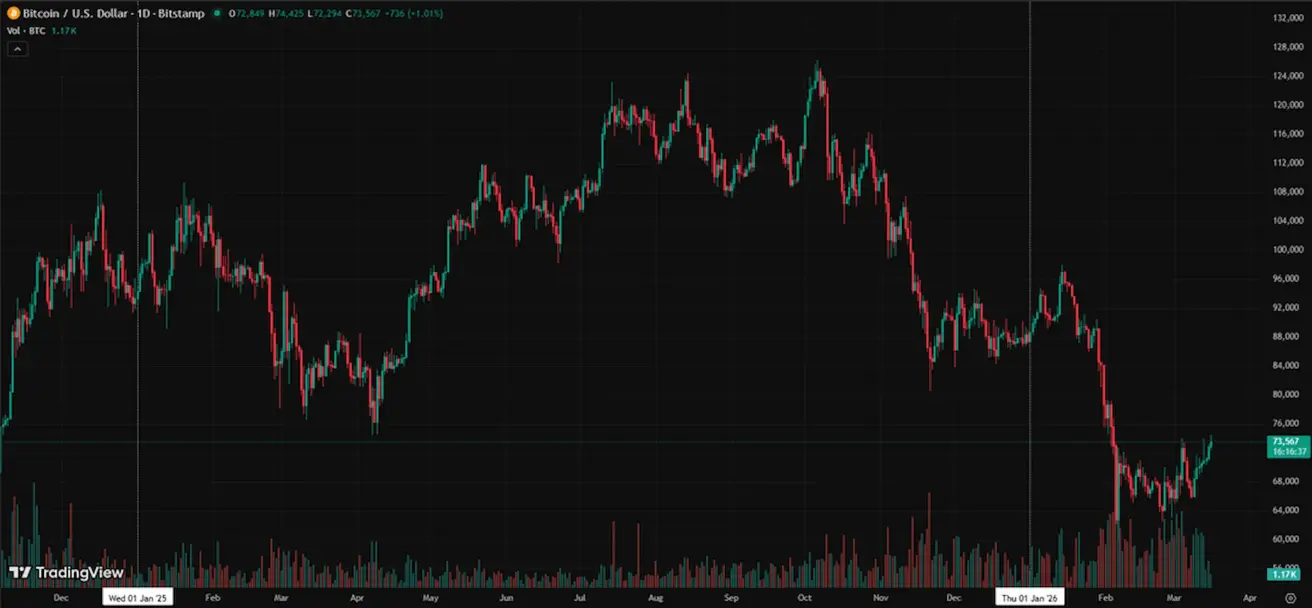
BTC ФЬЮЧЕРСТЕРІ
Апталық өзгеріс +10,39% (апта соңындағы жабылу: $72831); жыл басынан бері: -16,97%.
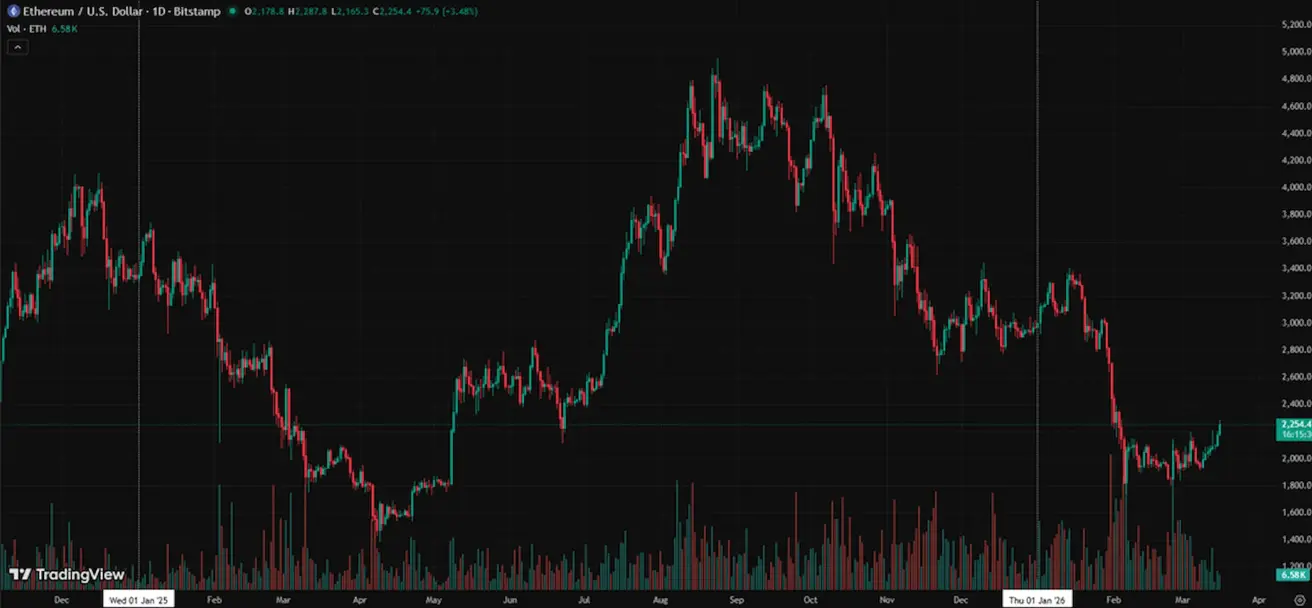
ETH ФЬЮЧЕРСТЕРІ
Апталық өзгеріс +12,44% (апта соңындағы жабылу: $2178,5); жыл басынан бері: -26,75%.
Bitcoin Regime Score диаграммасы BTC нарығының режиміндегі өзгерістерді — өсу және төмендеу фазалары арасындағы ауысуларды көрсетеді.
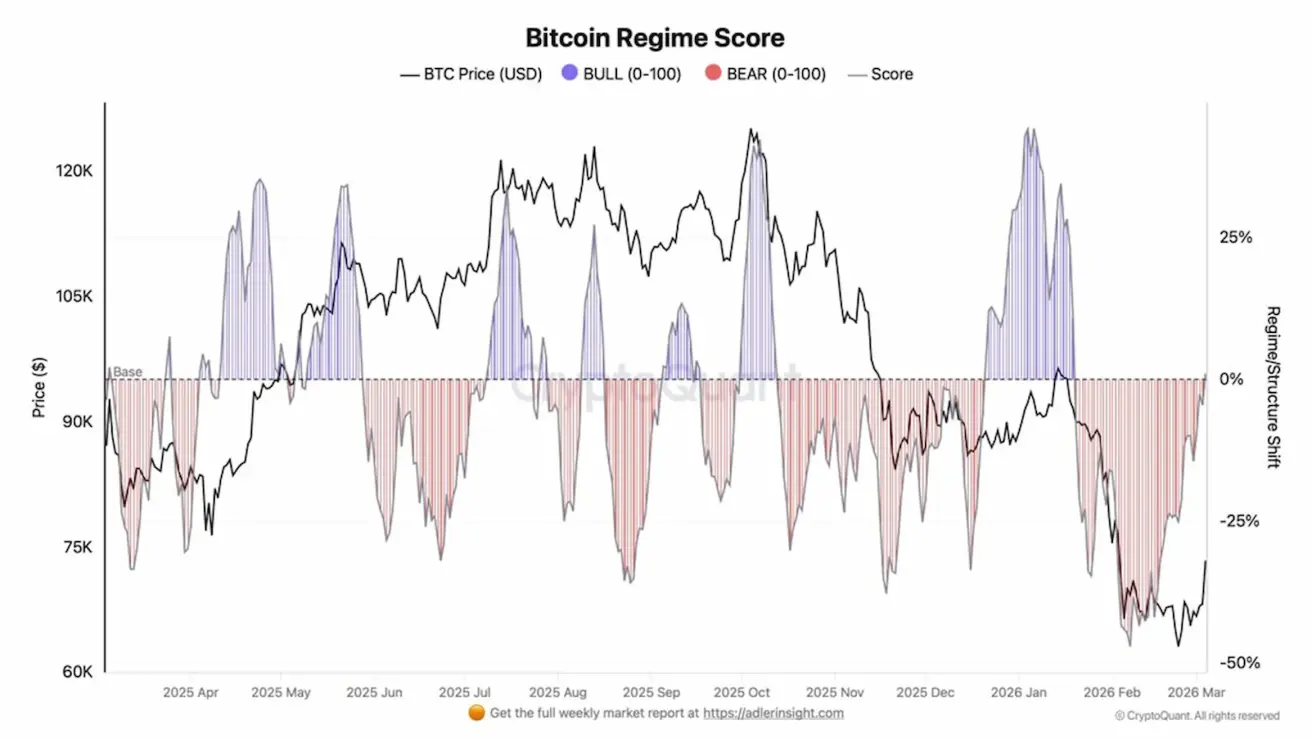
Көрсеткіш бірнеше нарық индикаторларын біріктіретін жиынтық метрика:
- Taker imbalance (агрессивті сатып алу мен сатудың арақатынасы);
- Қаржыландыру мөлшерлемелері мен ашық позициялар;
- Биржалар мен ETF-терге ағындар;
- Баға тренді мен нарық импульсі.
Көрсеткіш нөлден жоғары болса, нарықта өсу импульсі басым, бұл сұраныстың артуы мен тәуекелге бейімділіктің күшеюін көрсетеді. Нөлден төмен болса, нарықта төмендеу режимі басым, әдетте бұл тарату, өтімділіктің азаюы және бағаның түзетілуімен қатар жүреді.
Bitcoin Regime Score қазіргі уақытта 2026 жылдың басындағы терең төмендеу фазасынан кейін BTC нарық құрылымының біртіндеп қалпына келгенін көрсетеді. Бүгінгі таңда индекс мәндері бейтарап аймаққа оралып, нарықтың тұрақтануын және тарату фазасының аяқталғанын көрсетеді.
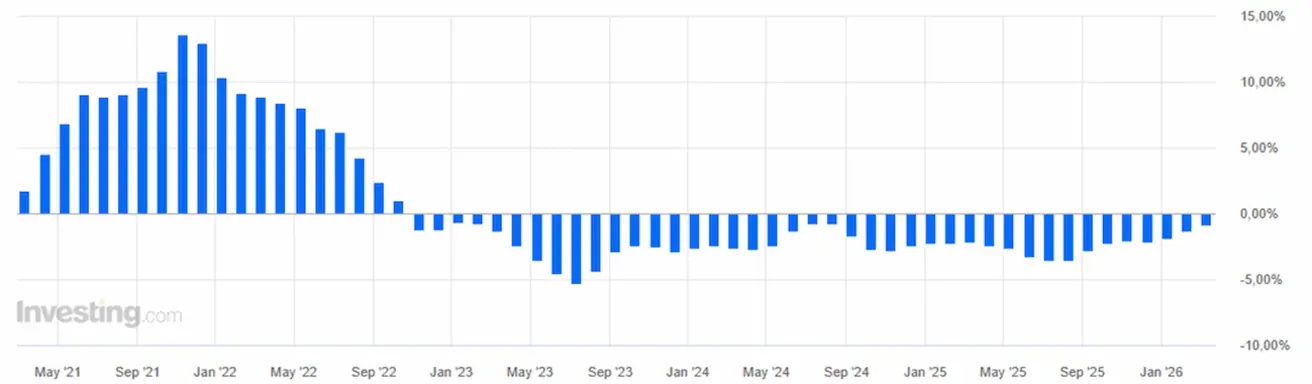
Bitcoin Price vs. Net Institutional Demand диаграммасы BTC бағасын институционалдық сұраныстың таза көлемімен салыстырады.
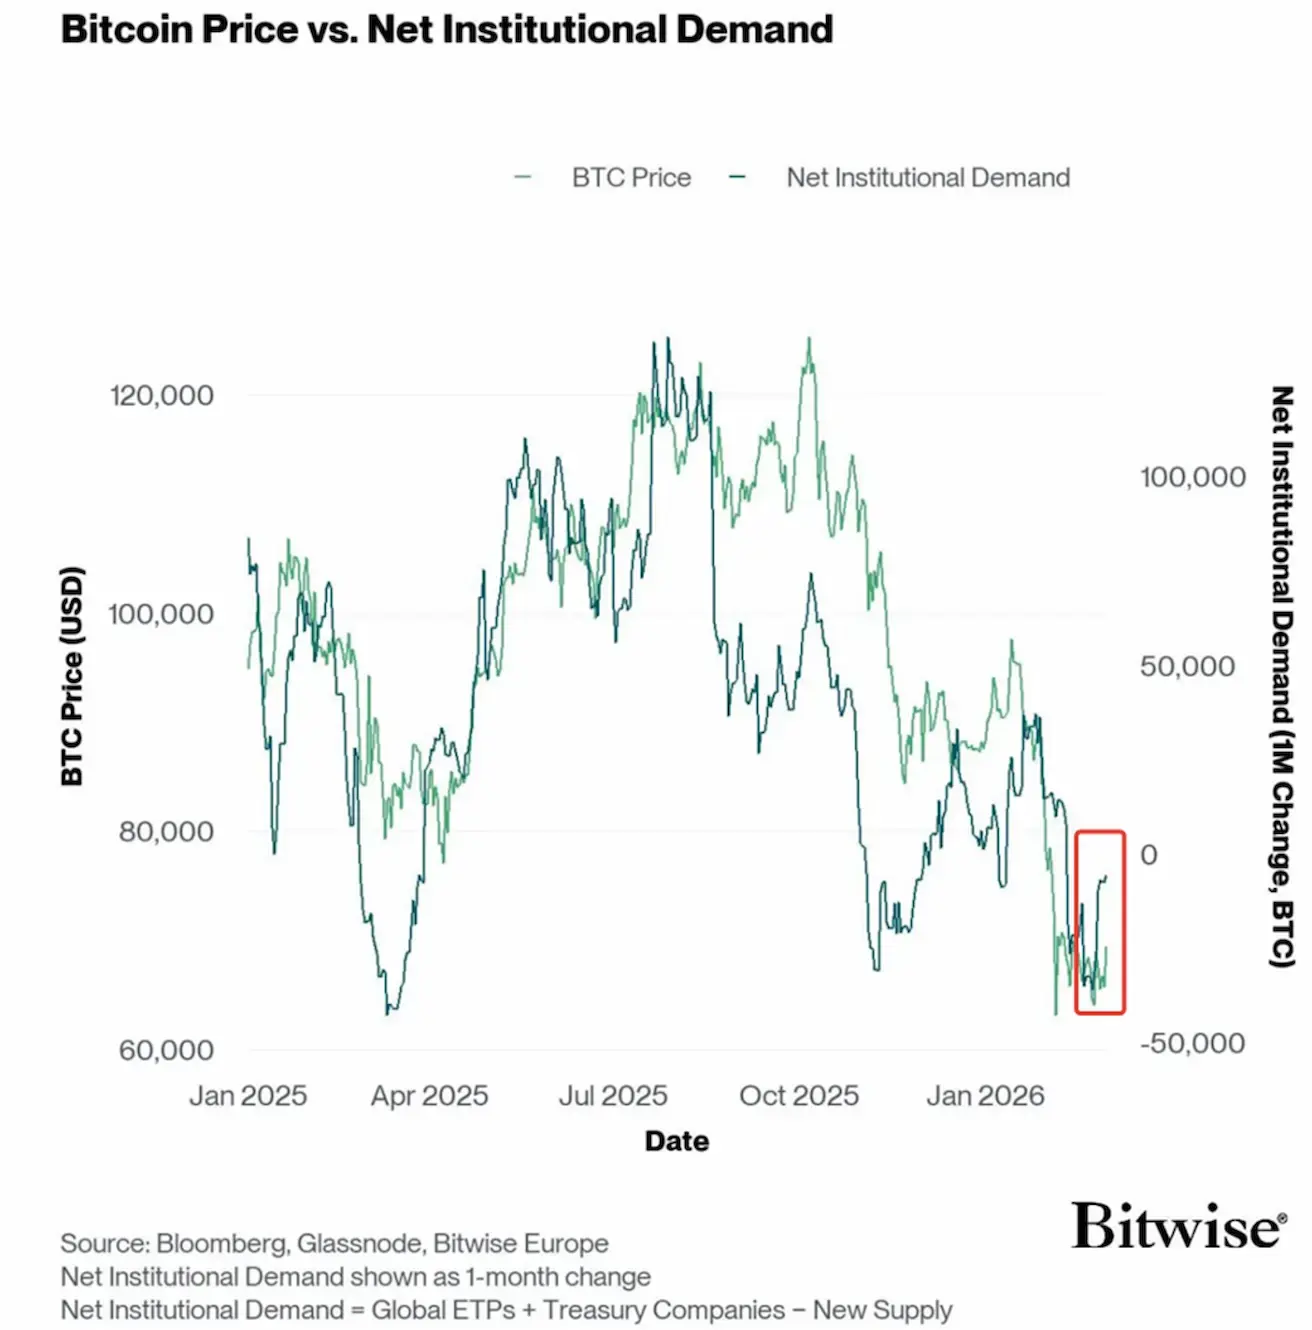
Жасыл сызық — Bitcoin бағасы. Қара сызық — таза институционалдық сұраныс.
Бұл метрика келесідей есептеледі: ETF сатып алулары плюс корпоративтік қазынашылық сатып алулары минус жаңадан шығарылған BTC (майнинг ұсынысы).
Оң жақ осьте сұраныстың ай сайынғы өзгерісі BTC-де көрсетілген.
Осылайша, индикатор институционалдық капитал жаңадан шығарылған Bitcoin ұсынысын сіңіріп жатыр ма, әлде монеталарды тарату жүріп жатыр ма, соны көрсетеді.
Соңғы бір жылда Bitcoin бағасы мен институционалдық сұраныс арасында күшті корреляция қалыптасты. Соңғы апталарда институционалдық сұраныс қалпына келе бастады, бұл ірі инвесторлардың қызығушылығының қайта жандануын көрсетеді.
Криптовалюта нарығындағы жаңалықтар:
Теннесси штатында стратегиялық Bitcoin резервін құру туралы заң жобасы мақұлдау үшін Қаржы, салық және бюджет комитетіне жіберілді. Егер қабылданса, заң штат қазынашысына мемлекеттік қаражаттың 10%-на дейінін Bitcoin-ға орналастыруға мүмкіндік береді.
Clarity Act бойынша, банктік сектор өкілдерінің қарсылығына байланысты заң шығарушылар арасында әлі келісім жоқ. Дегенмен, Трамп оны тезірек қабылдауға шақыруда.
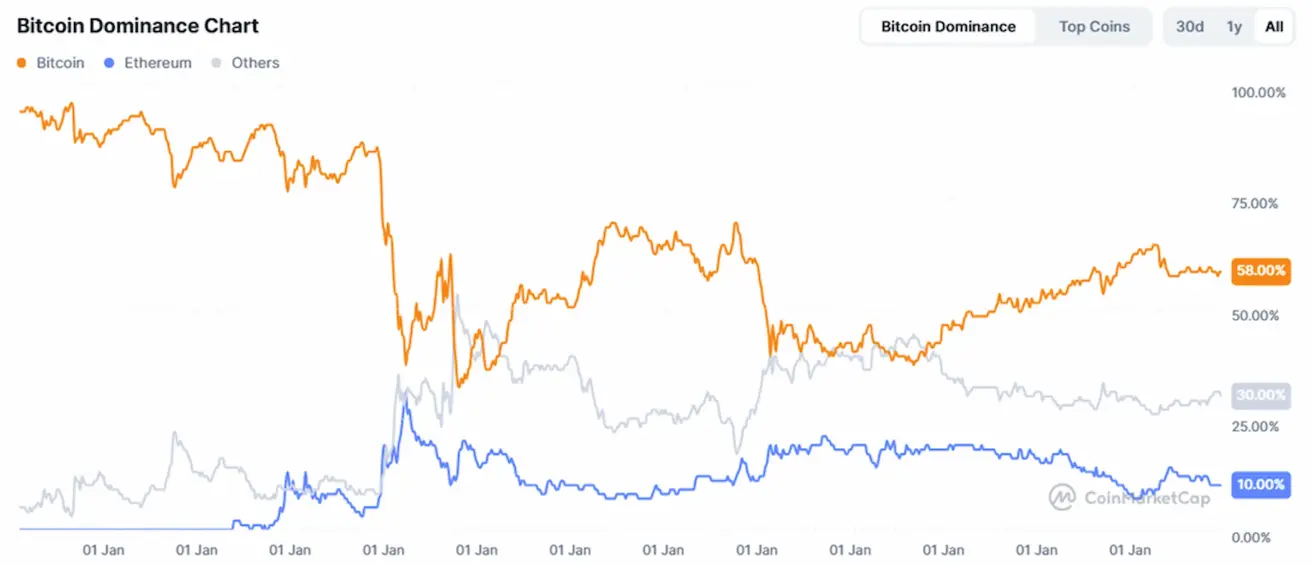
ЖАЛПЫ КРИПТОВАЛЮТА НАРЫҒЫНЫҢ КАПИТАЛИЗАЦИЯСЫ
Жалпы криптовалюта нарығының капитализациясы: $2,51 трлн (бір апта бұрын: $2,4 трлн) (coinmarketcap.com).
Криптоактивтер нарығындағы үлестер:
- Bitcoin: 58,5% (58,8%)
- Ethereum: 10,9% (10,4%)
- Басқалары: 30,5% (30,8%)
ETF-тер бойынша таза ағындар диаграммасы: