Русский
 Қазақша
 Eesti
EestiJuly 27 – August 03, 2026: Weekly economic update
Key market updates
Key Takeaways:
- The policy rate remains unchanged, while the Fed's rhetoric remains cautious;
- Monetary policy remains moderately restrictive;
- U.S. macroeconomic data continue to support a soft-landing scenario: inflation risks are increasing, the labor market is cooling without signs of recession, and current conditions do not yet warrant a rate cut.
Commentary
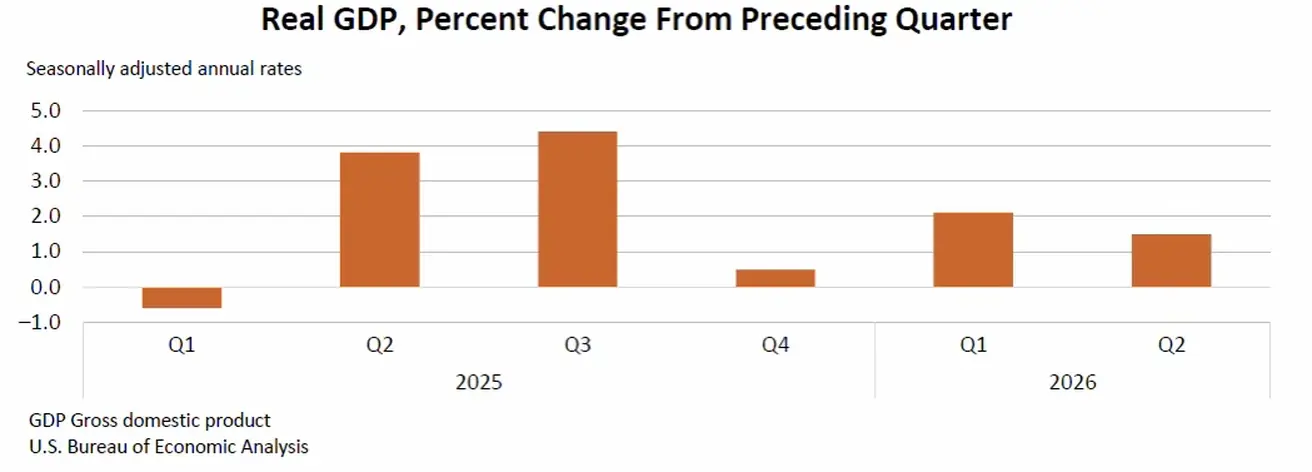
According to the preliminary estimate released by the U.S. Bureau of Economic Analysis (BEA), real gross domestic product (GDP) grew at an annual rate of 1.5% in the second quarter of 2026 (April, May, and June). In the first quarter, real GDP increased by 2.1 percent.
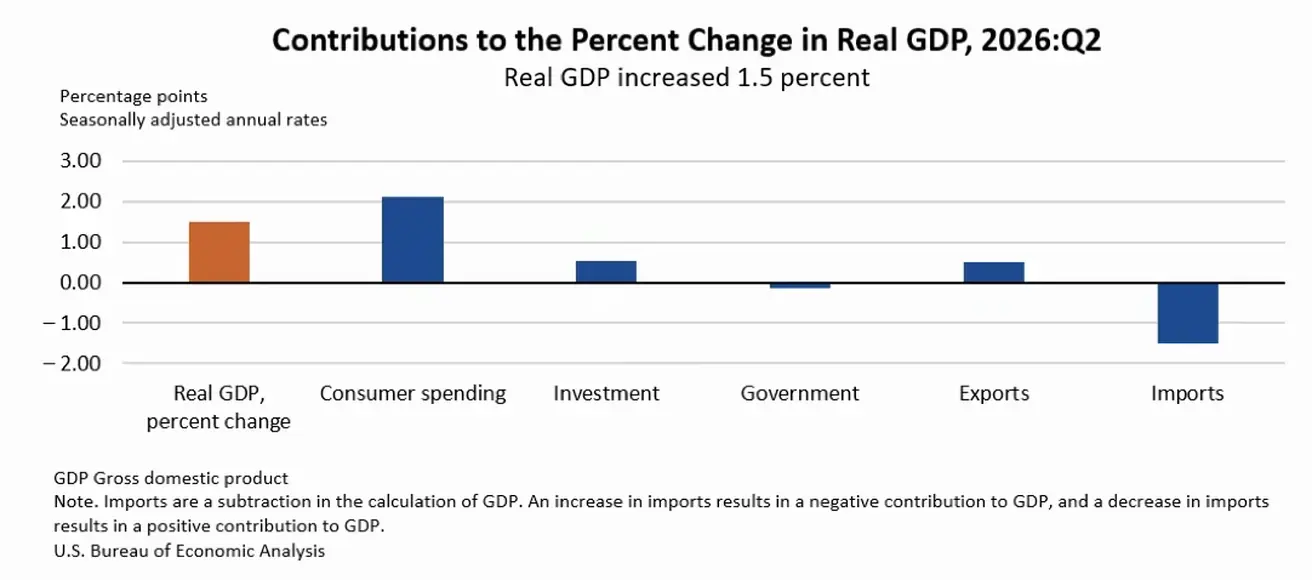
The increase in real GDP in the second quarter reflected increases in consumer spending, investment, and exports, which were partly offset by a decrease in government spending. Imports, which are a subtraction in the calculation of GDP, increased.
Compared to the first quarter, the deceleration in real GDP growth in the second quarter reflected a decrease in government spending and a slowdown in investment and exports, which were partly offset by an acceleration in consumer spending. Imports increased more in the second quarter than in the first.
In other words, the main driver of growth was consumer spending, and excluding this component, GDP would have shown a negative reading.
The GDP data is accompanied by data on the personal consumption expenditures (PCE) price index and the release of the GDP deflator.
How the GDP deflator differs from the PCE price index, and why it matters.
The PCE price index answers the question: "How much more expensive has what American consumers buy become?" The GDP deflator, on the other hand, is an indicator of broad price pressure and answers the question: "How much more expensive has everything produced in the U.S. become?"
The Fed targets the PCE index because its mandate concerns the stability of consumer prices, not prices across the entire economy. In simple terms, a price increase for an Intel (INTC) data center or a rise in military government spending is not included in the PCE index, but it is already reflected in the GDP deflator.
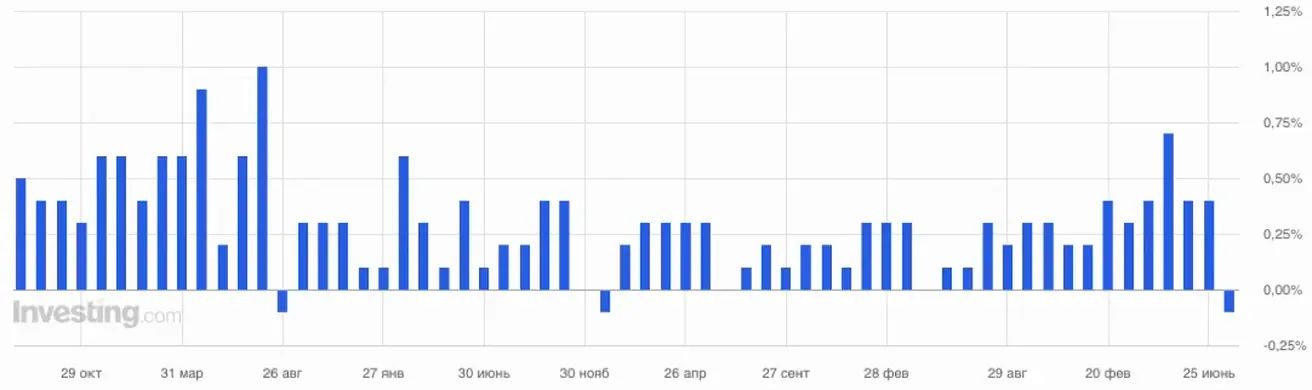
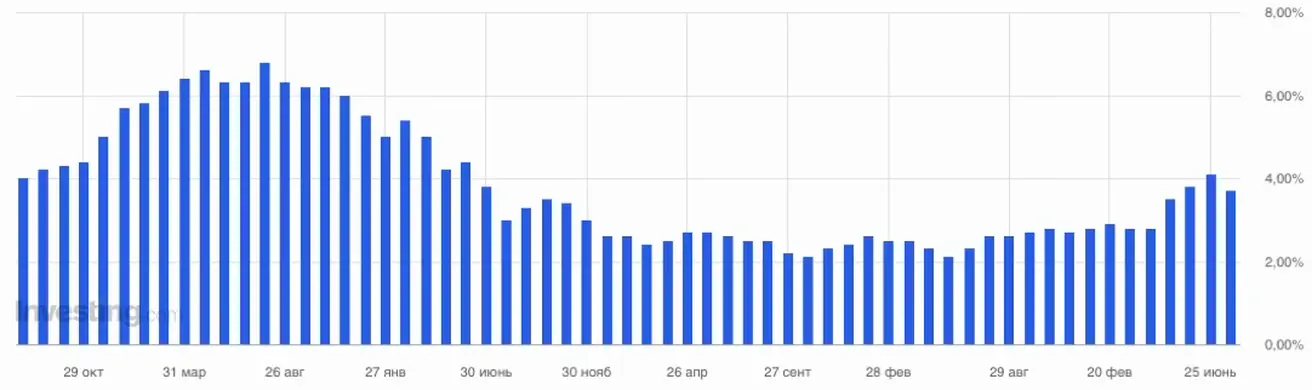
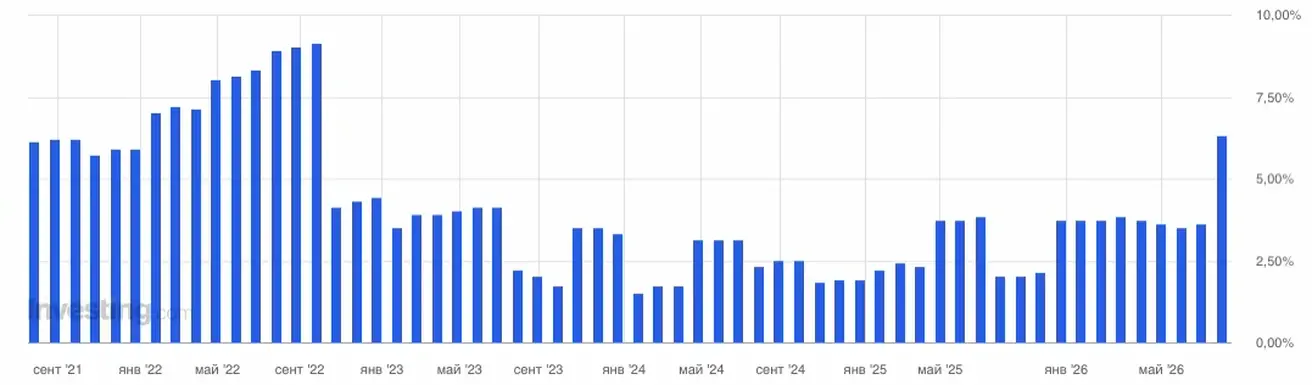
In the current release, PCE showed deflation of one-tenth of a percent on a monthly basis, and on a year-over-year basis, a decline to 3.7% from 0.4%. At the same time, the GDP deflator nearly doubled to 6.3%. Accordingly, over the next few quarters, part of this pressure will feed through into wages, the cost of services, and the cost of final goods. This creates a risk of acceleration in the PCE price index and in inflation expectations. That, in turn, will directly influence the Fed's decision on the key rate and could lead to more hawkish action.
GDP (U.S. Bureau of Economic Analysis, BEA) — 2Q26 annualized, preliminary: +1.5% (1Q26: +2.1%); forecast: 2.1%:
GDPNow (a "nowcast" of the official estimate ahead of its release) from the Federal Reserve Bank of Atlanta: 1.4% (previous: 1.7%).
Inflation: Consumer Price Index (May)
- Core CPI (MoM): 0.0% (previous: 0.2%).
- Core CPI (YoY): 2.6% (previous: 2.9%).
- CPI (MoM): -0.4% (previous: 0.5%).
- CPI (YoY): 3.5% (previous: 4.2%).
Producer Price Index (June)
Further constructive indicators emerged as consumer inflation expectations and producer prices shifted lower.
- PPI (MoM): -0.3% (previous: 0.6%).
- Core PPI (MoM): 0.2% (previous: 0.1%).
Inflation Expectations (Michigan) (June)
- 12-month Inflation Expectations: 4.2% (previous: 4.6%).
- 5-Year Inflation Expectations: 3.3% (previous: 3.3%).
Personal Consumption Expenditures (PCE) Price Index (June): MoM: -0.1% (previous: 0.5%);
YoY: 3.7% (previous: 4.1%);
GDP Deflator (Q2, QoQ): 6.3%, forecast 4.1% (previous: 3.6%);
Labor Market (BLS) (May/June)
- Unemployment Rate: 4.2% (previous: 4.3%).
- Continued Jobless Claims: 1.782K (previous: 1.796K).
- Initial Jobless Claims: 197K (previous: 187K).
- Nonfarm Payrolls (NFP): 57K (previous: 129K).
- Private Nonfarm Payrolls: 49K (previous: 97K).
- Average Hourly Earnings (YoY): 3.5% (previous: 3.4%).
- JOLTS Job Openings: 6.866 million (previous: 6.922 million).
Business Activity Index (PMI) (June)
(Above 50 indicates expansion; below 50 indicates contraction)
- Services PMI: 53.6 (previous: 51.2).
- Manufacturing PMI: 53.8 (previous: 53.9).
- Composite PMI: 53.6 (previous: 51.9).
Monetary Policy
Last week, by a vote of 9 to 3, the Committee decided to keep the federal funds rate target range at 3.5%–3.75%.
Beth M. Hammack, Neel Kashkari, and Lorie K. Logan dissented in favor of holding the rate, preferring to raise the target range by 0.25% already at this meeting. At the previous meeting, everyone voted against raising the rate. Today the balance of power has shifted.
The main takeaway from Kevin Warsh's second appearance is that he continues to pursue a hawkish verbal policy — that is, he advocates for tight monetary policy but limits himself to rhetoric without actual action.
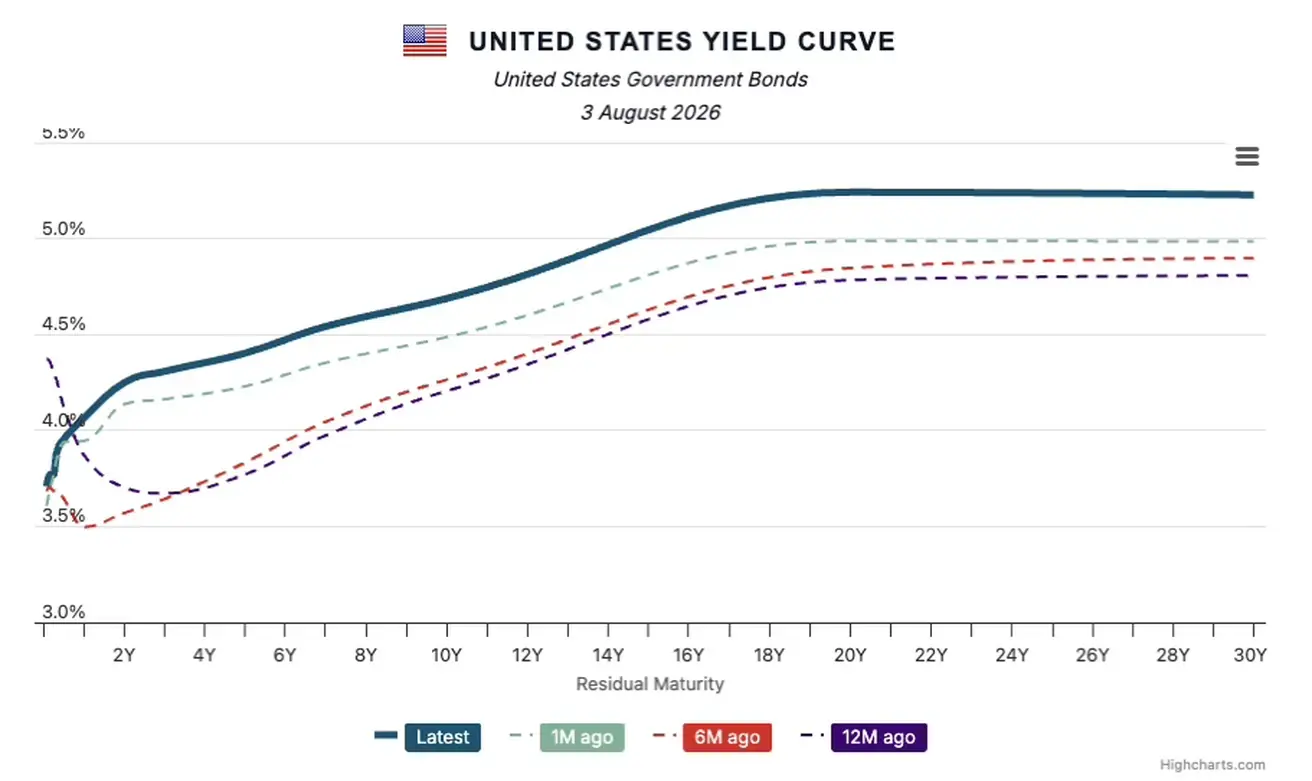
Warsh also says the Fed doesn't need to do anything yet, since the market has already done the work itself and is already living with higher rates compared to the Fed's key rate. This can be seen on the upper chart of the Treasury yield curve — the lowest rate is the federal funds rate:
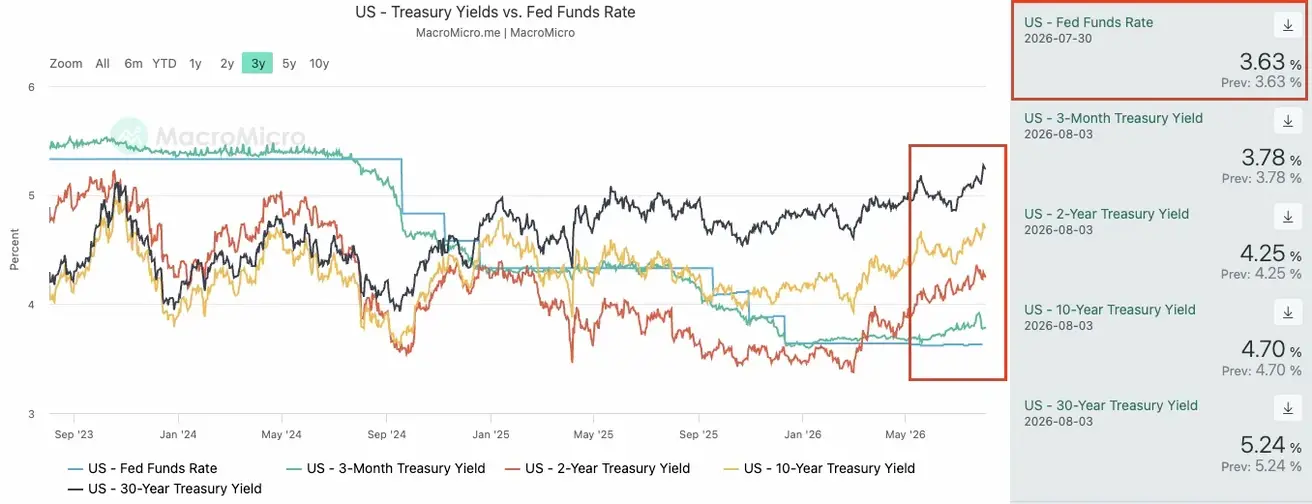
Why are market rates rising? Like the Fed, the market sees that inflation risks, given today's geopolitical escalation, are dominant, and so investors are demanding higher medium- and long-term yields.
On top of that, the market is expecting a rate hike from the Fed — after the FOMC meeting, short-term market expectations for a rate hike at the next meeting rose to 64% from 40% a month earlier. On a 12-month horizon, the market expects two hikes, to a range of 4.00%–4.25%.
Right now, preventing a rise in inflation is more important for the market, in the context of the examples of Paul Volcker (forty years ago) and Powell (in 2021). That's why a rate hike over the medium term would be seen by the market as even moderately positive. And if we see geopolitical de-escalation along with a decline in energy prices, it's quite possible that Warsh will indeed limit himself to rhetoric alone.
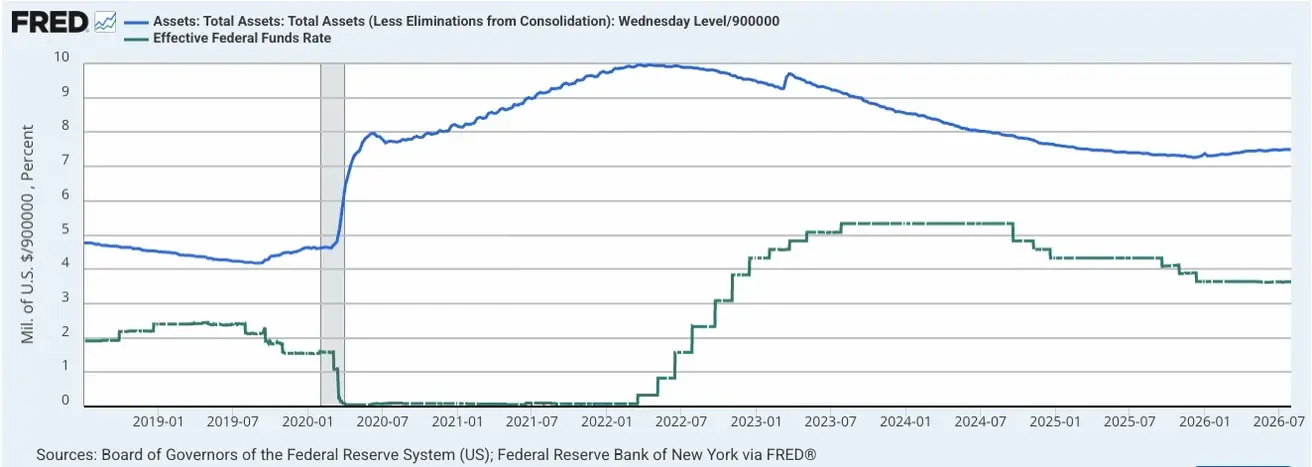
Effective Federal Funds Rate (EFFR): 3.50%–3.75%.
Federal Reserve Balance Sheet: $6.738 trillion, +3.11% since the suspension of quantitative tightening (QT), when the balance sheet stood at $6.535 trillion.
Market Forecast for Rate (FedWatch)
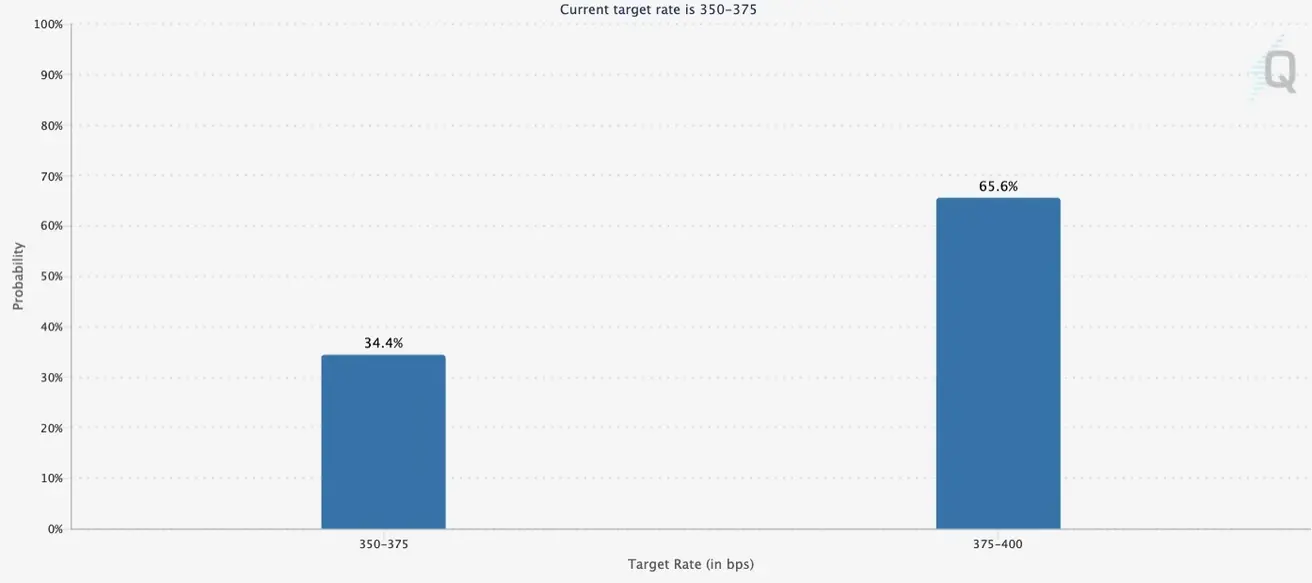
For the next FOMC meeting (September 16), the estimated probability of a rate hike is 64.5% (34.2% a week ago):
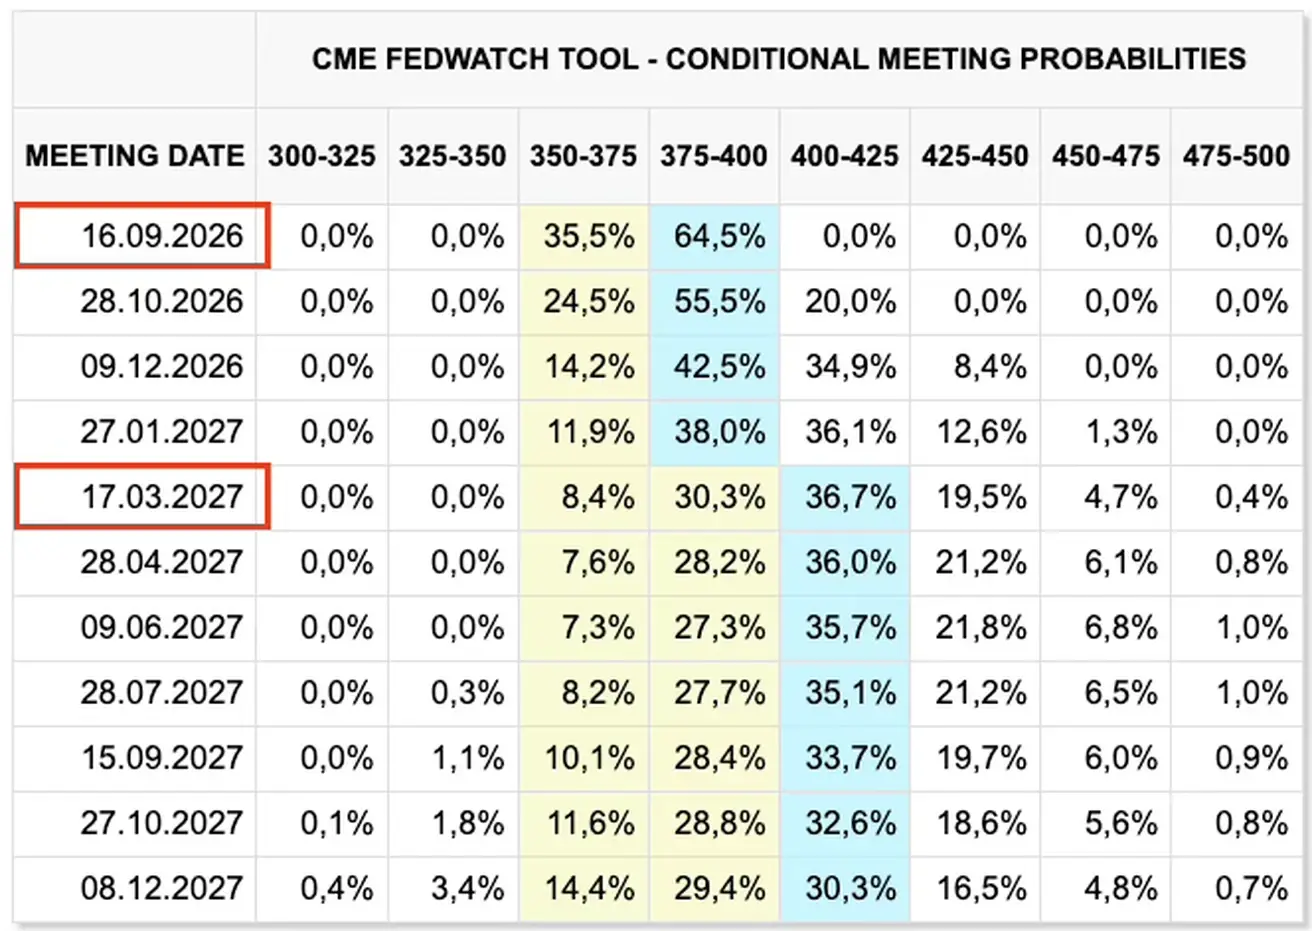
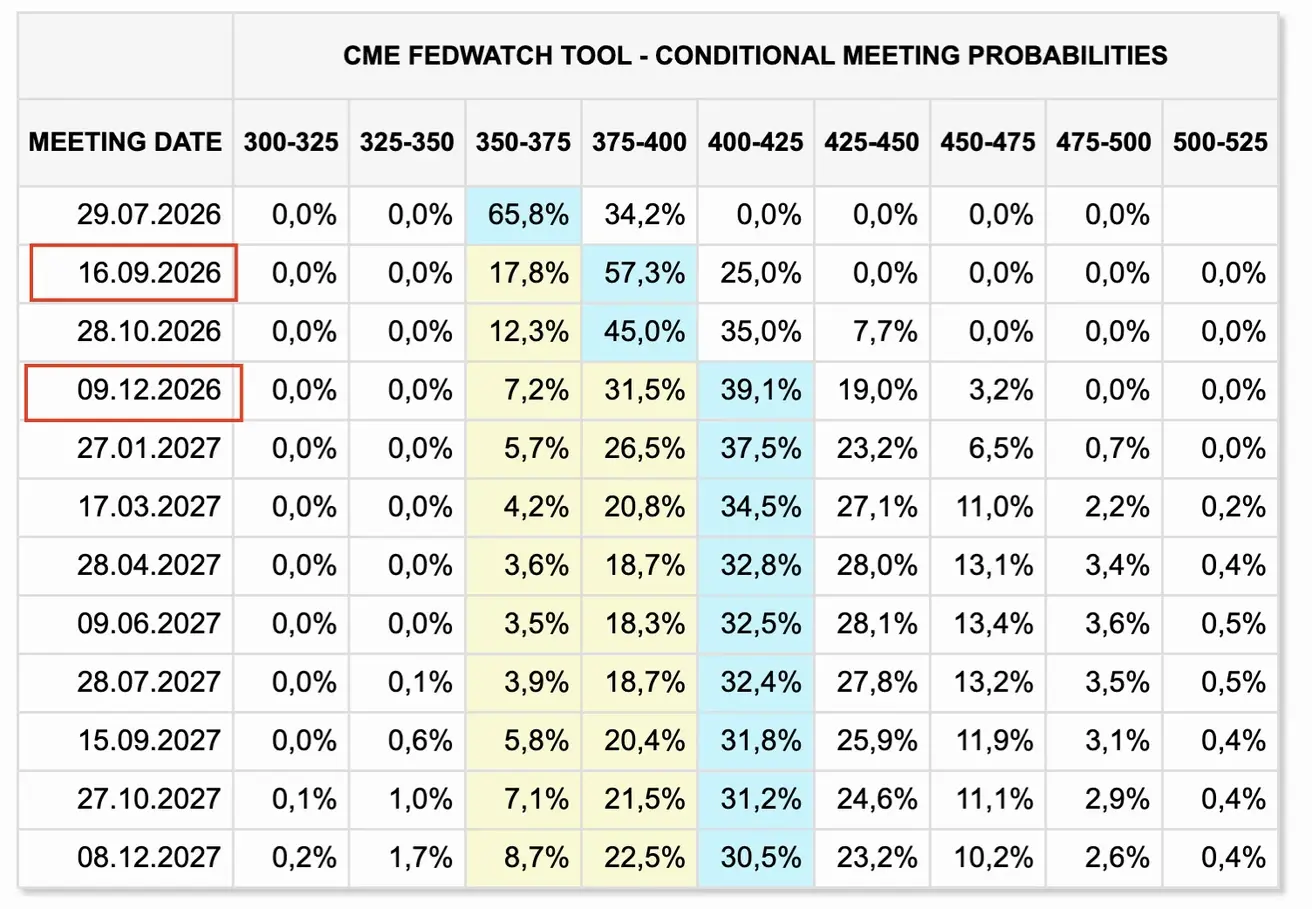
Over the next 12 months, the market anticipates two 25-basis-point rate hikes, bringing the target range to 4.00%–4.25% by September and March 2027:
Today:
A week earlier:
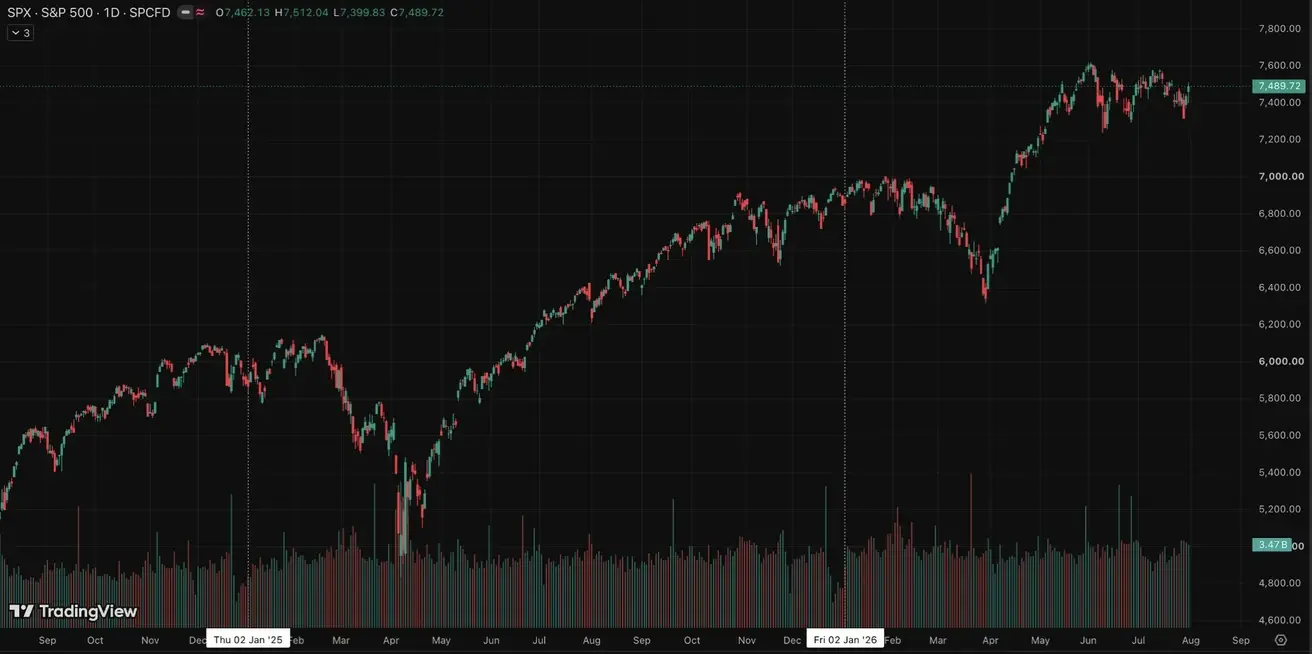
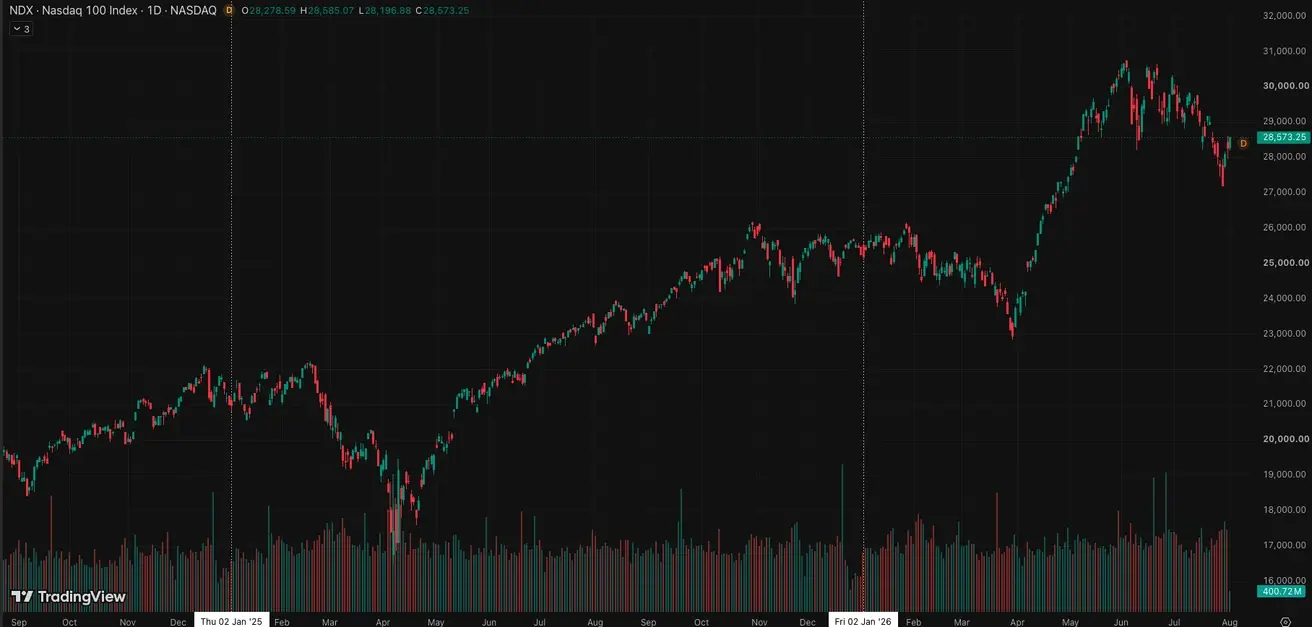
After the meeting, U.S. equity markets rose on Thursday and Friday.
SP500
Weekly performance: +1,05% (week-end close: 7489,72); year-to-date: +9,41%.
NASDAQ100
Weekly performance: +0,52% (week-end close: 28274,2); year-to-date: +11,98%.
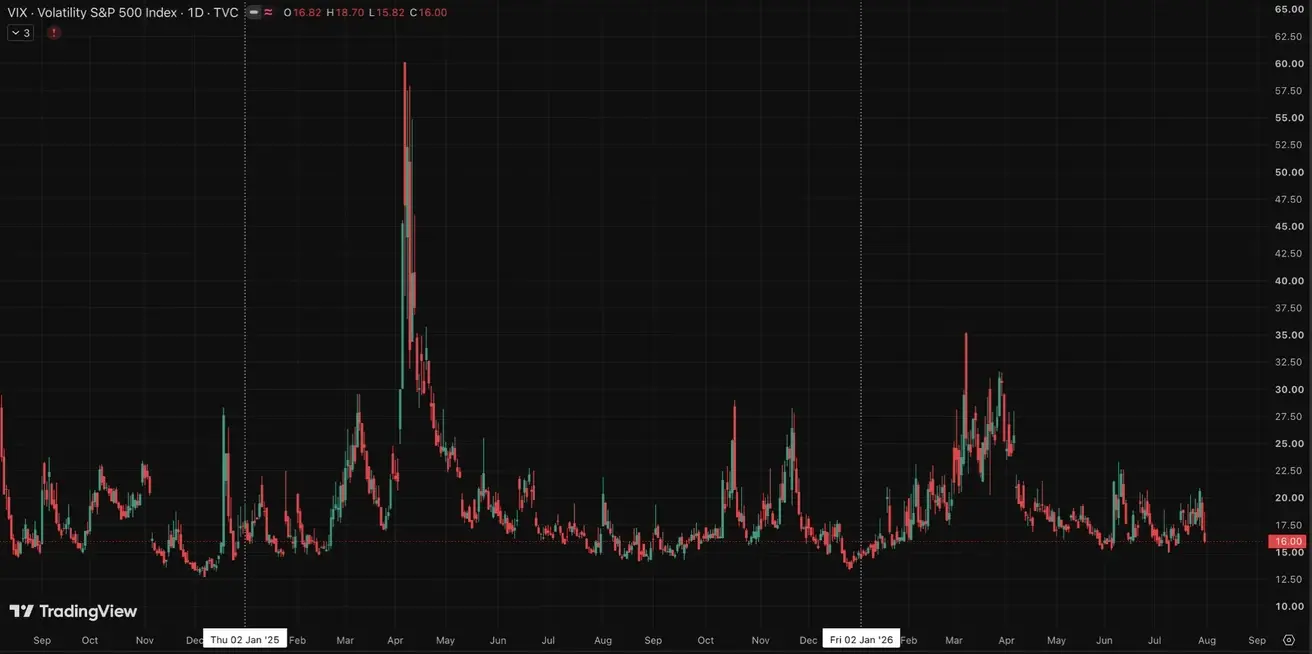
VIX
VIX (volatility index): week-end close at 16,00 points.
Eurozone
- The ECB raised interest rates, while maintaining a hawkish stance as inflationary risks continue to increase;
- Against the backdrop of the conflict in the Middle East, the ECB revised its GDP forecasts downward and raised its inflation projections for the coming years.
Commentary
In the eurozone, after some slowdown, an inflationary impulse is being observed again. GDP in the second quarter recovered slightly to 0.4% month-on-month and 1.0% year-on-year. The unemployment rate remains steady at a low 6.3%.
The rhetoric from ECB officials remains unchanged — all decisions will be made on a data-dependent basis, with the current consensus pointing to one rate hike of 0.25% in September. However, if inflation dynamics worsen, the balance of votes could quickly shift toward greater tightening.
Interest Rates
- Deposit Facility Rate: 2.25% (previous: 2.0%);
- Marginal Lending Facility Rate: 2.65% (previous: 2.4%) — the rate at which banks can obtain overnight funding from the central bank;
- Main Refinancing Rate (Policy Rate): 2.40% (previous: 2.15%).
Inflation: Consumer Price Index (CPI) (July)
- Core CPI (YoY): 2.5% (previous: 2.4%):
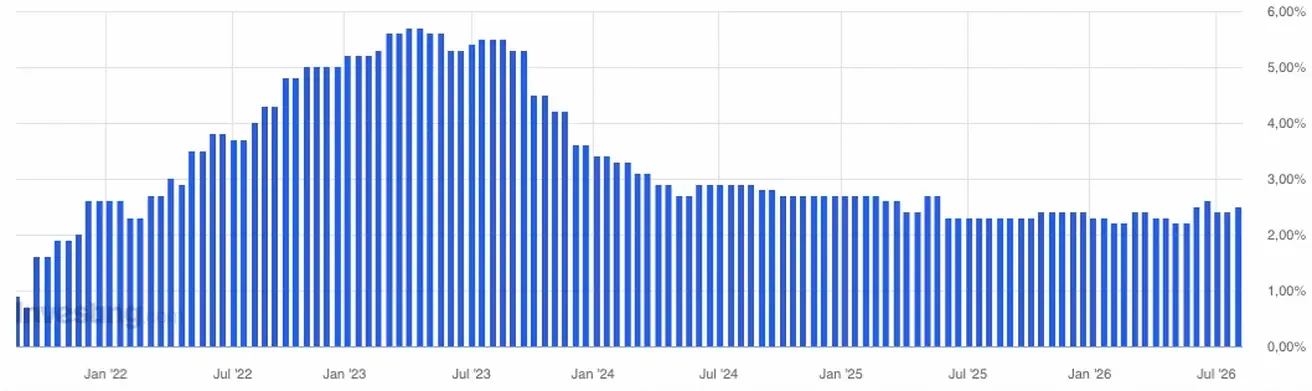
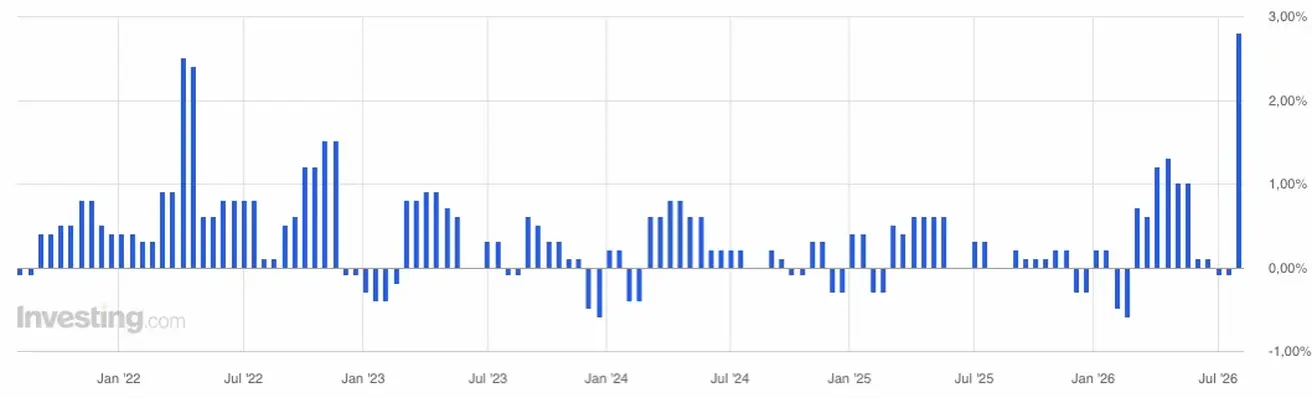
- CPI (MoM): 2.8% (previous: -0.1%):
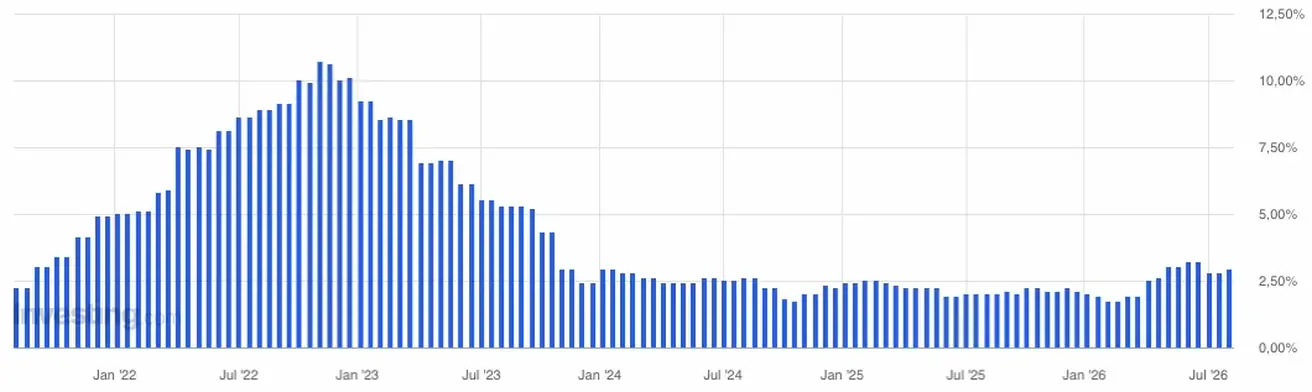
- CPI (YoY): 2.9% (YoY) (previous: 2.8%):
GDP (2Q26 Preliminary Estimate)
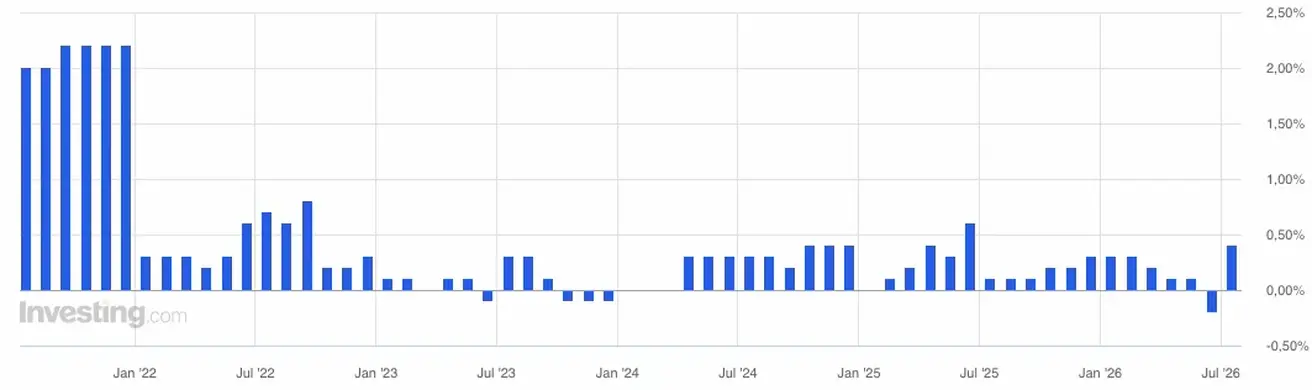
- QoQ: 0.4% (previous: -0.2%):
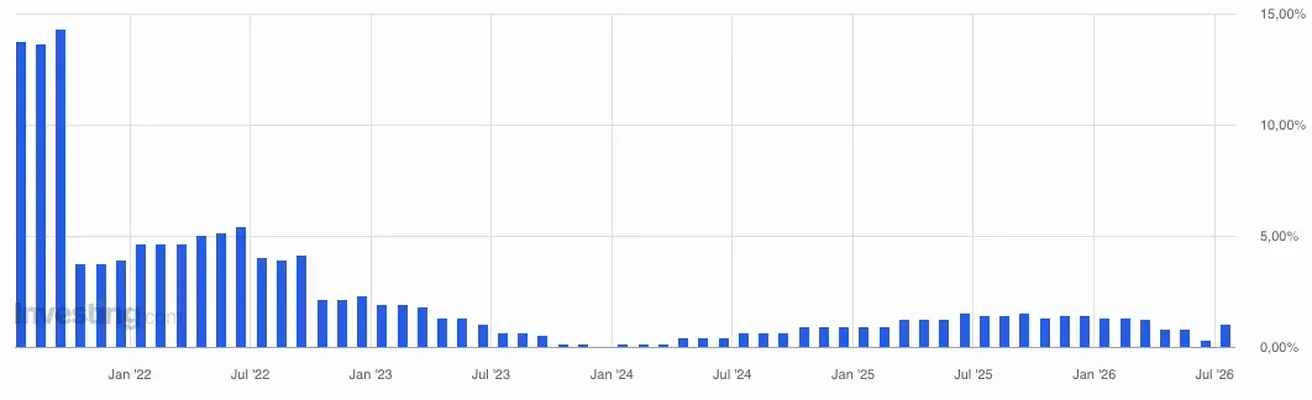
- YoY: 1.0% (previous: 0.3%):
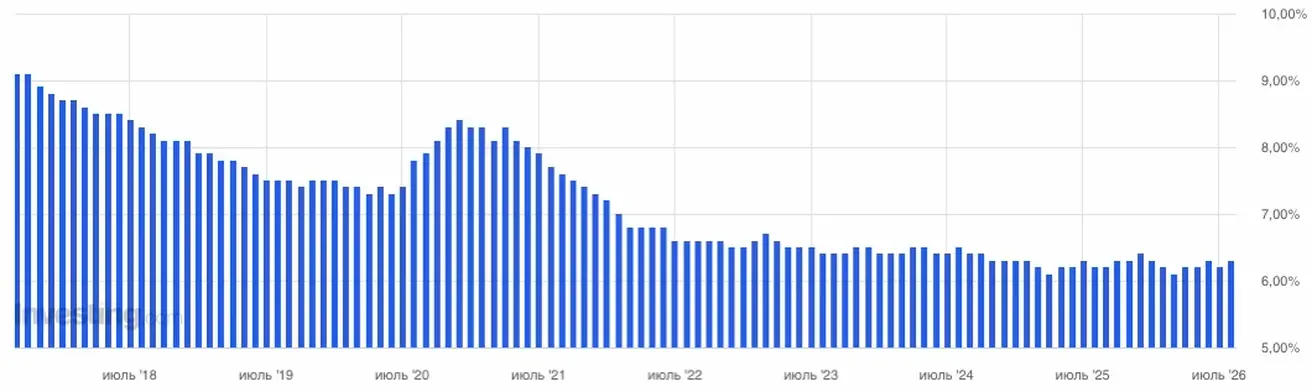
Unemployment Rate (June)
- 6.3% (previous: 6.2%):
Industrial Production (June)
- MoM: 0.1% (previous: 0.9%);
- YoY: 1.67% (previous: 1.37%).
Purchasing Managers' Index (PMI) (May)
- Services PMI: 51.6 (previous: 49.4);
- Manufacturing PMI: 52.0 (previous: 51.4);
- S&P Global Composite PMI: 51.9 (previous: 50.0).
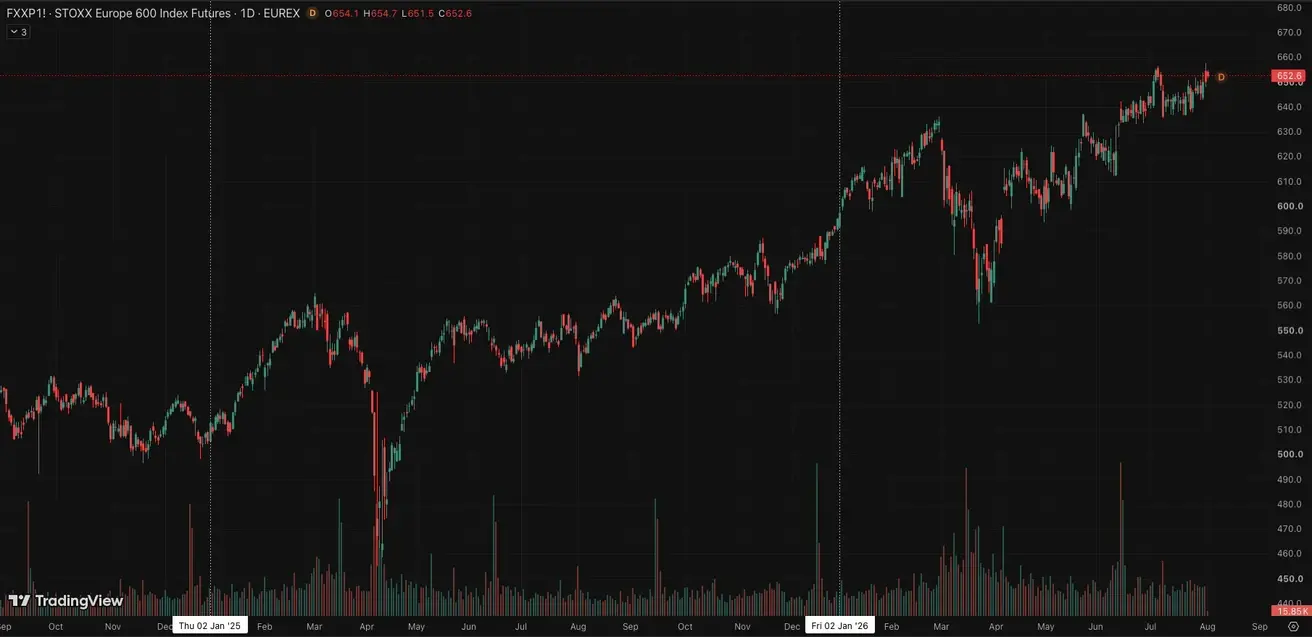
Euro Stoxx 600 (FXXP1!)
Weekly performance: +0,68% (week-end close: 650,3); year-to-date: +9,48%.
China
China's economy continues to stabilize, supported by strong export performance, while domestic demand and investment are gradually recovering. Policymakers remain measured and targeted in their approach to economic stimulus.
- Interest rates remain unchanged;
- Monetary policy remains accommodative;
- China reaffirmed its commitment to fiscal support for economic growth under its 2026 plan, including measures to stimulate domestic demand, optimize tax incentives and subsidies, and modernize industrial capacity.
Commentary
For China, the only macro data released last week was the business activity PMI figures, which showed a slowdown below the 50 level in both the manufacturing and non-manufacturing sectors.
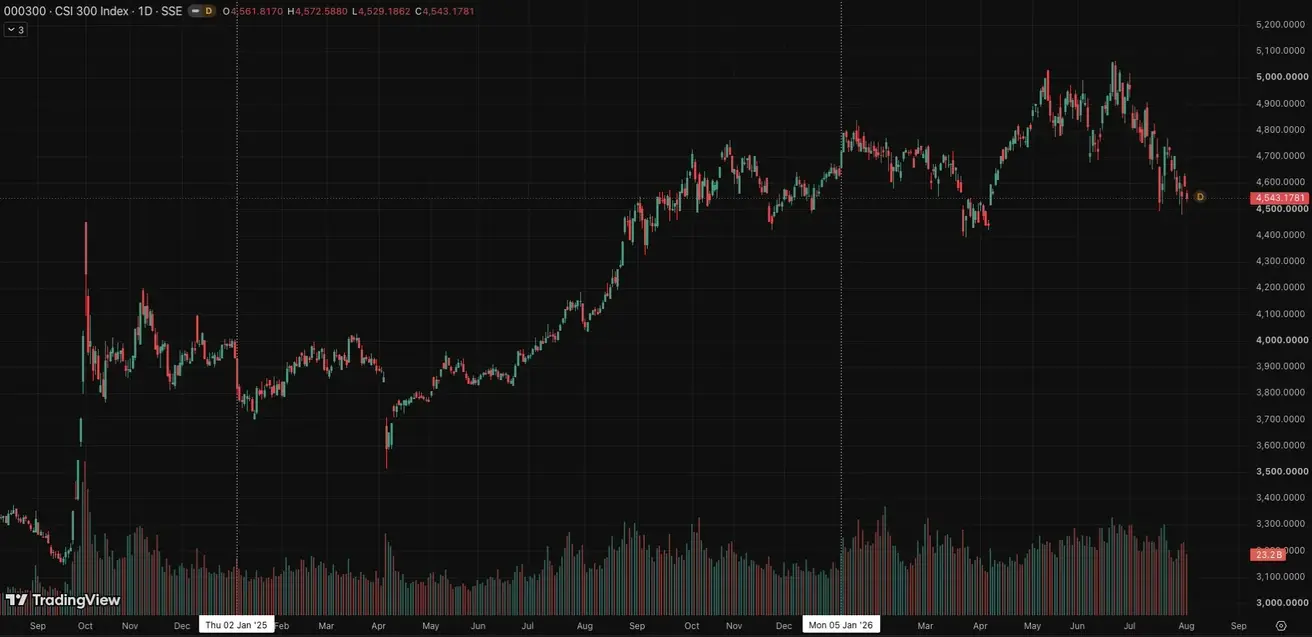
Among last week's releases, worth noting are the decline in retail sales, reflecting a slowdown in consumer demand, and a sharp drop in investment. In addition, protectionist measures from the European Union are adding further pressure. Against this backdrop, the broad Chinese market index CSI300 continues to remain under pressure.
Interest Rates
- 1-Year Loan Prime Rate (medium-term lending): 3.00%;
- 5-Year Loan Prime Rate (benchmark for mortgage lending): 3.50%.
Inflation Indicators (June)
- Consumer Price Index (CPI): -0.3% MoM (previous: -0.1%); 1.0% YoY (previous: 1.2%);
- Producer Price Index (PPI): 4.1% YoY (previous: 3.9%).
Trade Data (June)
- Imports: 36.0% YoY (previous: 27.4%);
- Exports: 27.0% YoY (previous: 19.4%);
- Trade Balance (USD): $125.62 billion (previous: $105.43 billion).
GDP (Q2 2026)
- QoQ: 0.9% (previous: 1.3%);
- YoY: 4.3% (previous: 5.0%).
Labor Market
- Unemployment Rate (June): 5.0% (previous: 5.1%).
Industrial Activity
- Industrial Production (June, YoY): 5.3% (previous: 4.5%).
Fixed Asset Investment
- June, YoY: -5.7% (previous: -4.1%).
Retail Sales
- June, YoY: 0.9% (previous: 1.3%).
Purchasing Managers' Indices (PMI) (May)
- Manufacturing PMI: 49.2 (previous: 50.3);
- Non-Manufacturing PMI: 49.0 (previous: 50.2);
- Composite PMI: 49.3 (previous: 50.6).
CSI 300 Index (000300.HK)
Weekly performance: -1,31% (week-end close: 4543,1781); year-to-date: -1,57%.
Bond Market
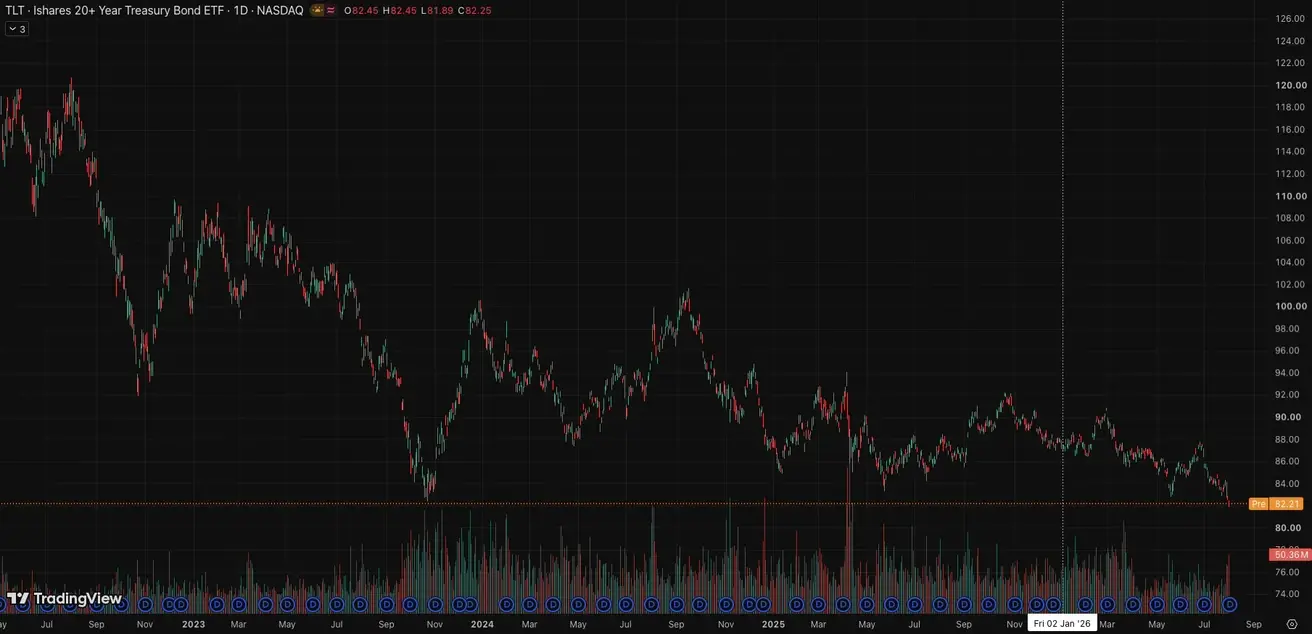
Amid Warsh's hawkish rhetoric and expectations of rate hikes, yields rose on the medium- and long-term segments of the curve.
20+ Year Treasury Bonds (TLT ETF): for the week: -1.20% (week's close: 82.25); year-to-date: -5.63%. The current price corresponds to the low from late 2023, which was the peak of Jerome Powell's aggressive rhetoric:
Yields and Spreads
- Market Yield on U.S. Treasury Securities at 10-Year Constant Maturity: 4.70% (previous: 4.68%);
- 2-Year U.S. Treasury Yield: 4.25% (previous: 4.33%);
- ICE BofA BBB US Corporate Index Effective Yield: 5.68% (previous: 5.70%).
- The yield spread between 10-year and 2-year U.S. Treasury securities stands at 45 basis points (previous: 35 bps);
- The yield spread between 10-year and 3-month U.S. Treasury securities stands at 92 basis points (previous: 77 bps).
U.S. Treasury Yield Curve
The cost of a 5-year U.S. Credit Default Swap (CDS) — a market-based measure of sovereign default insurance — dropped to 35.96 basis points, compared with 37.33 basis points a week earlier.
Gold Futures (GC)
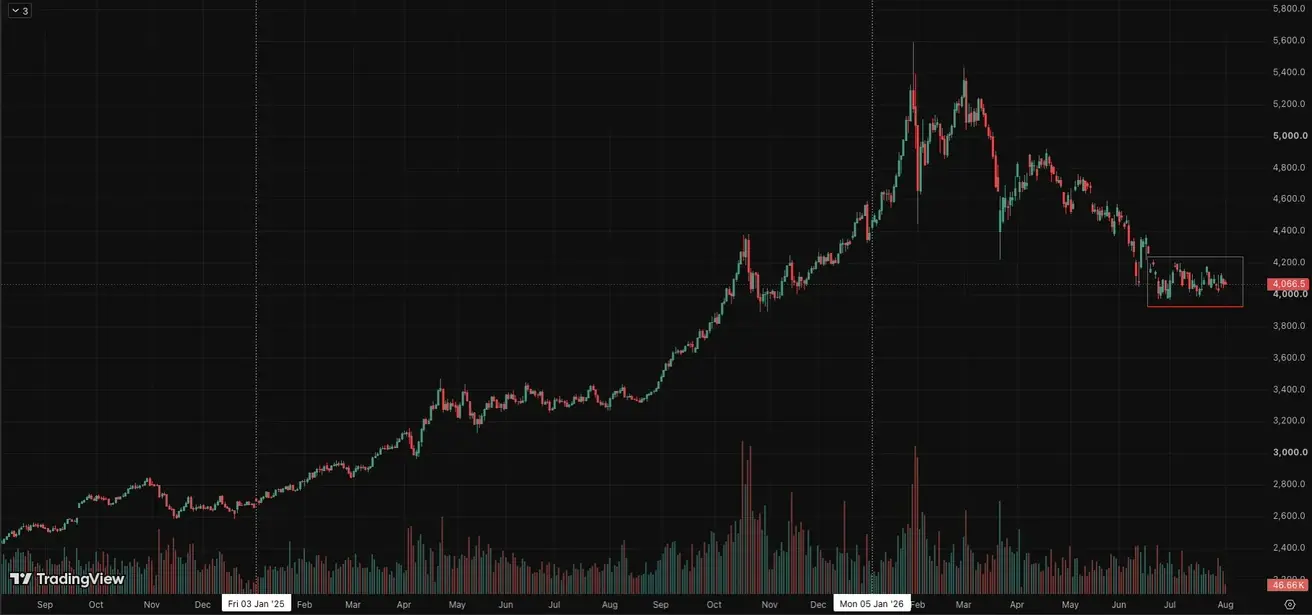
Weekly performance: -0,29% (week close: $4067,9 per troy oz); year-to-date: -6,10%
Oil Futures
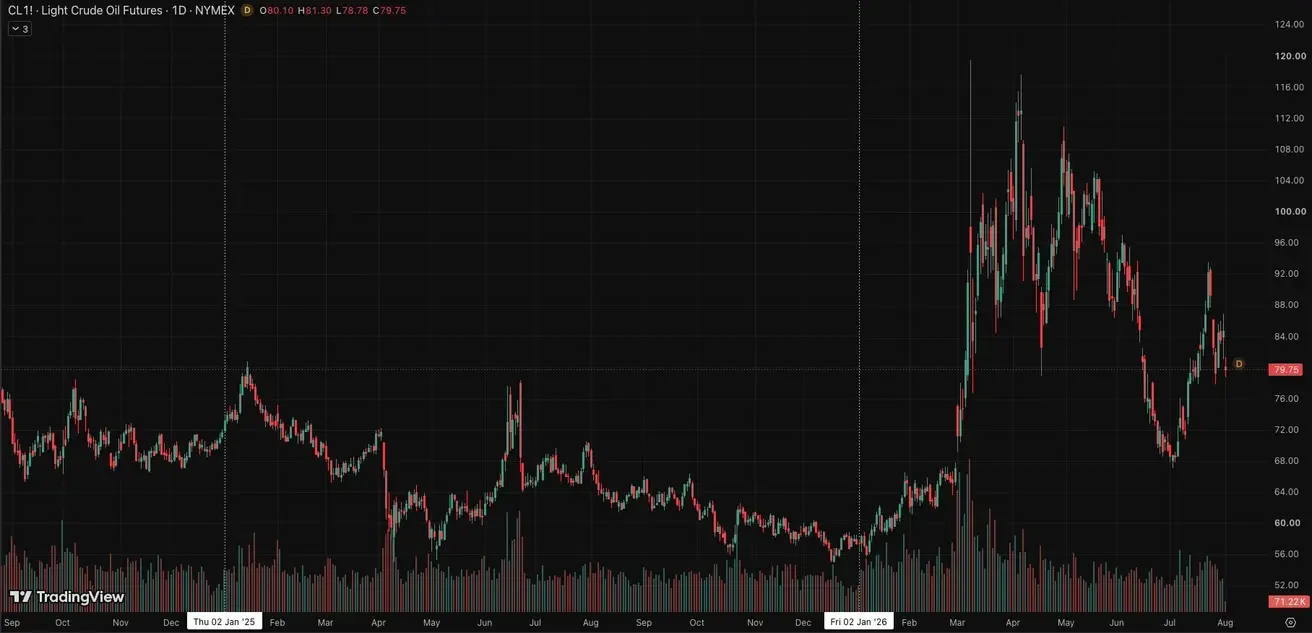
Weekly performance: -5,20% (week close: $84,67 per barrel); year-to-date: +47,48%
Dollar Index Futures (DX)
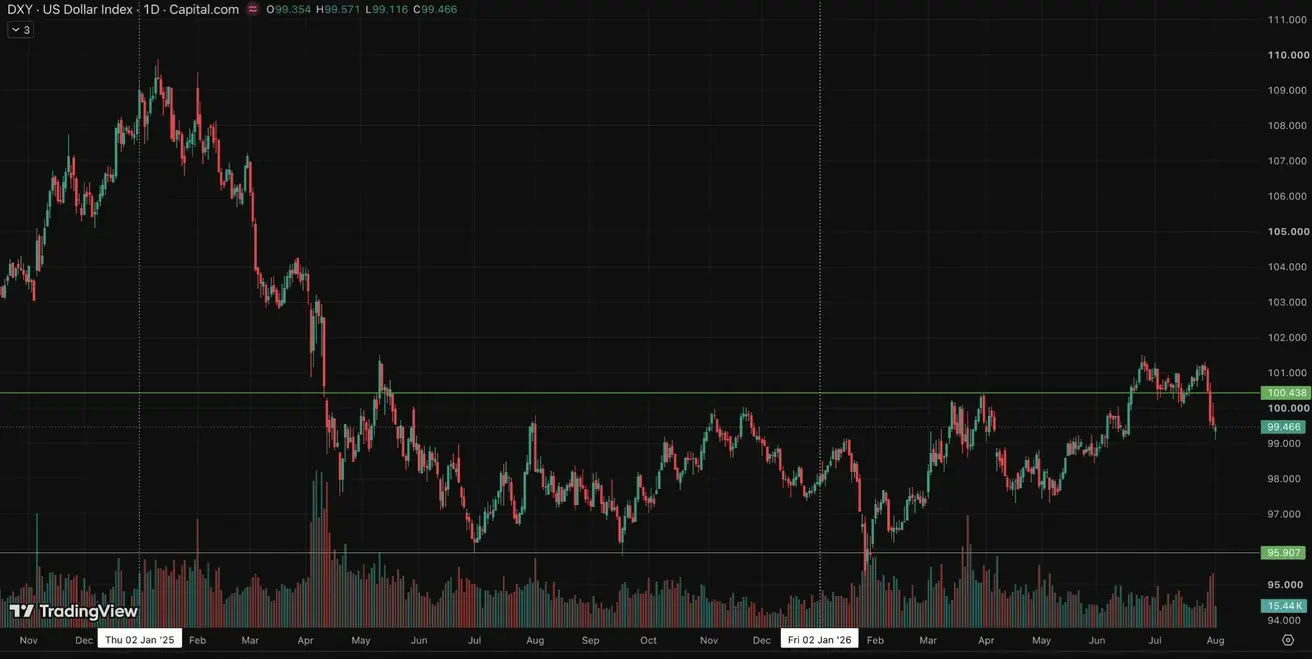
Weekly performance: -1,60% (week close: 99,534); year-to-date: +1,56%.
BTC Futures
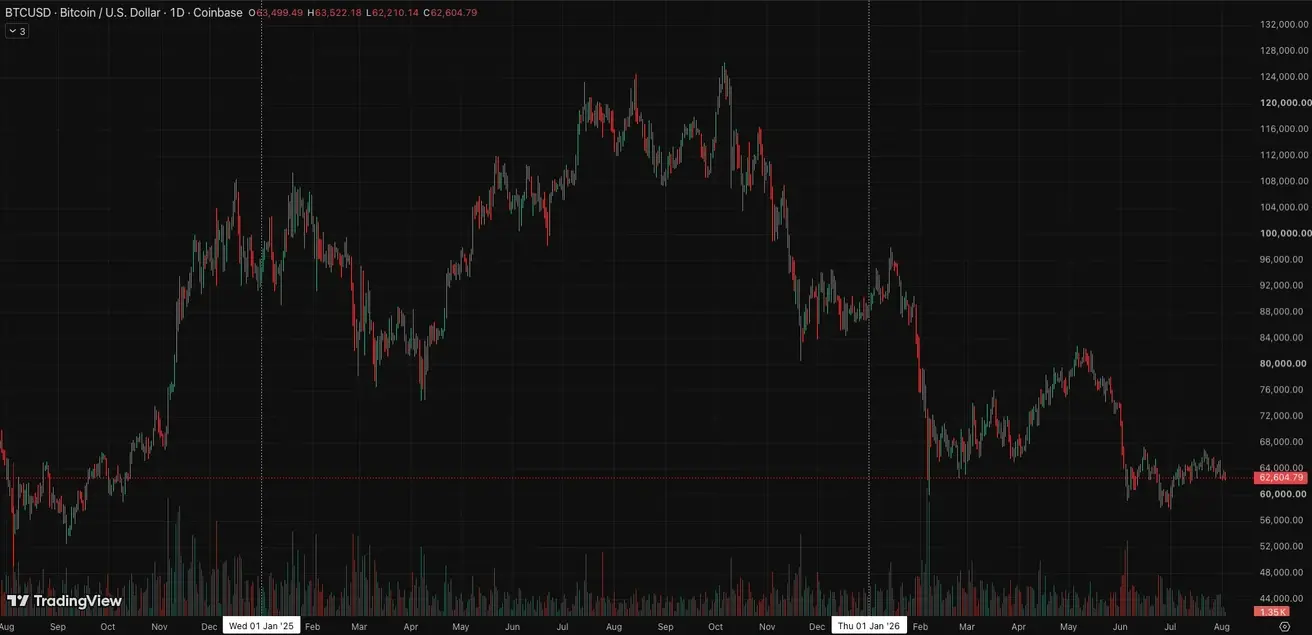
Weekly performance: -2,82% (week close: $63499,49); year-to-date: -27,61%.
ETH Futures
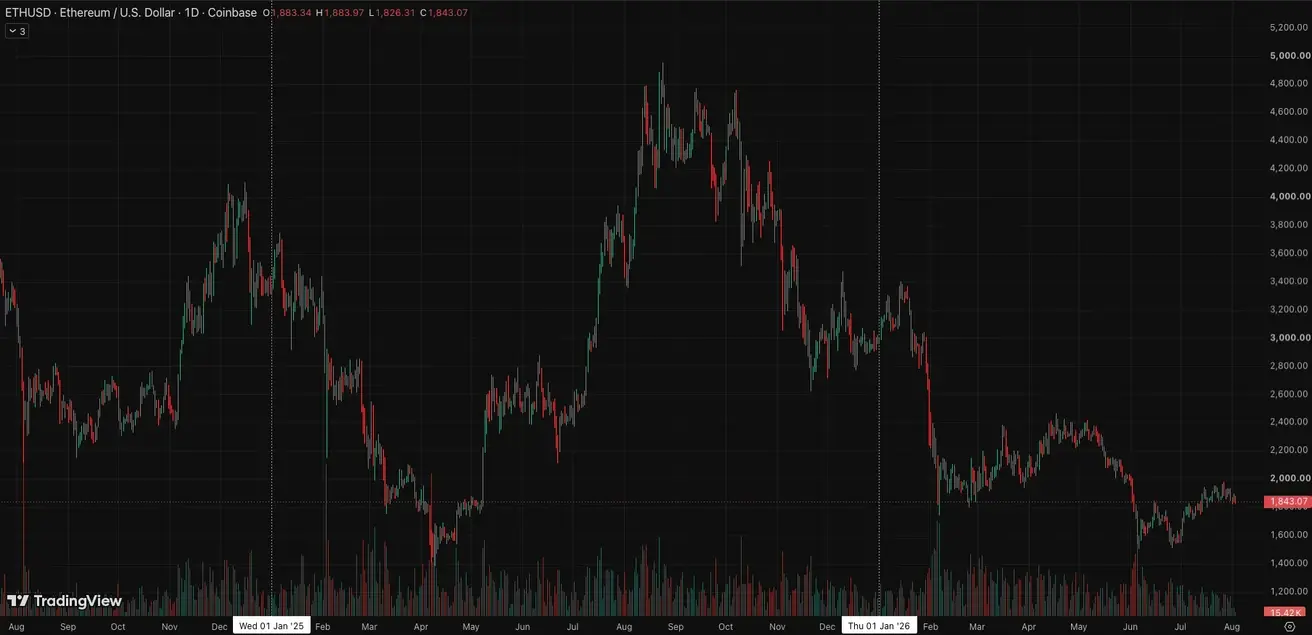
Weekly performance: +3,56% (week close: $1883,35); year-to-date: -36,67%.
Total Cryptocurrency Market Capitalization
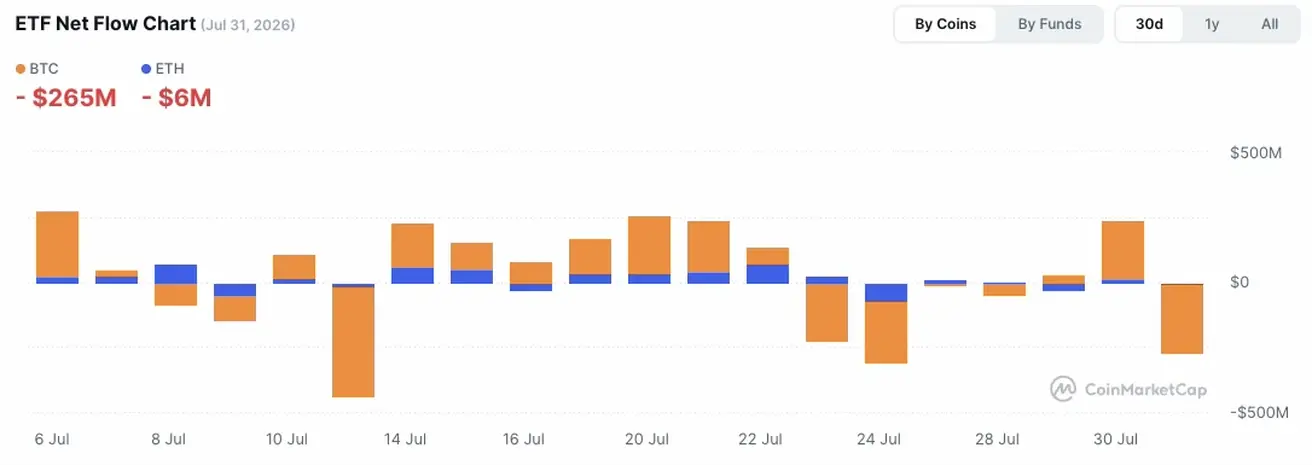
Total crypto market capitalization: $2,15 trillion (vs $2,24 trillion a week earlier) (coinmarketcap.com).
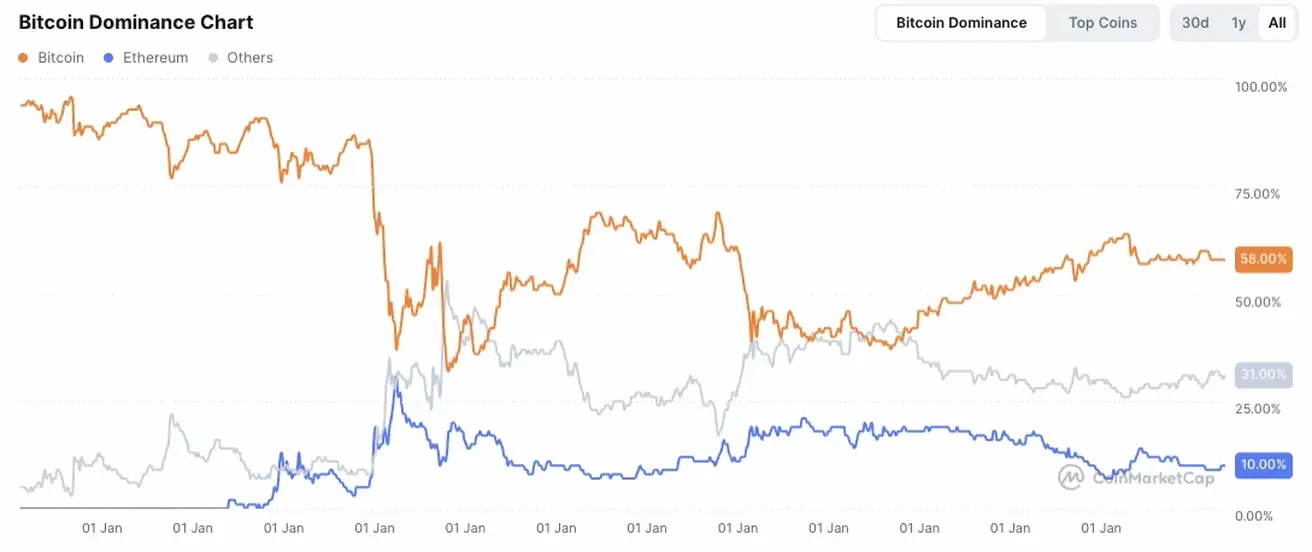
Crypto asset market shares:
- Bitcoin 58,4% (prev. 58,7%)
- Ethereum 10,3% (prev. 10,6%)
- Others 31,3% (prev. 30,7%)