Lietuvių
 Русский
 Қазақша
 Eesti
EestiApril 06 – 12, 2026: Weekly economic update
Key market updates

Markets posted solid gains last week, driven by expectations of positive outcomes from negotiations over the weekend. However, the United States and Iran failed to reach an agreement following talks in Islamabad.
Pakistan stated that it will continue to mediate in the dialogue between the United States and Iran. Iran’s Ministry of Foreign Affairs confirmed that contacts with Pakistan will continue after the negotiations with the United States.
U.S. officials (WSJ): the door to diplomacy with Iran remains open.
Regional Middle Eastern states are making efforts to bring the United States and Iran back to the negotiating table — the next round could take place within the coming days, while discussions are ongoing regarding a potential two-week extension of the ceasefire.
Inflation indicators in the United States and Europe are rising in headline CPI figures, while core indices (excluding energy and food) remain unchanged.
United States (key takeaways):
- The policy rate remains unchanged, with a cautious tone;
- Monetary policy stance remains moderately tight;
- U.S. macroeconomic data continue to support a soft-landing scenario; inflation risks are rising, while the labor market is cooling without signs of recession and, for now, does not necessitate a rate cut.
Macroeconomic Statistics
INFLATION: CONSUMER PRICE INDEX (MARCH):
- Core CPI: (MoM) 0.2% (prev: 0.2%); (YoY) 2.6% (prev: 2.5%).
- CPI: (MoM) 0.9% (prev: 0.3%); (YoY) 3.3% (prev: 2.4%).
PRODUCER PRICE INDEX (FEBRUARY):
- PPI (m/m): 0.7%, prev: 0.5%.
- Core PPI (m/m): 0.5%, prev: 0.8% (revised):
Core Personal Consumption Expenditures (PCE) Price Index (February): MoM: 0.4% (prev: 0.4%); YoY: 3.0% (prev: 3.1%).
Personal Consumption Expenditures (PCE) Price Index (February): MoM: 0.4% (prev: 0.3%); YoY: 2.8% (prev: 2.8%).
INFLATION EXPECTATIONS (MICHIGAN) (MARCH):
- 12-month inflation expectations: 4.8% (prev: 3.8%);
- 5-year inflation expectations: 3.4% (prev: 3.2%).
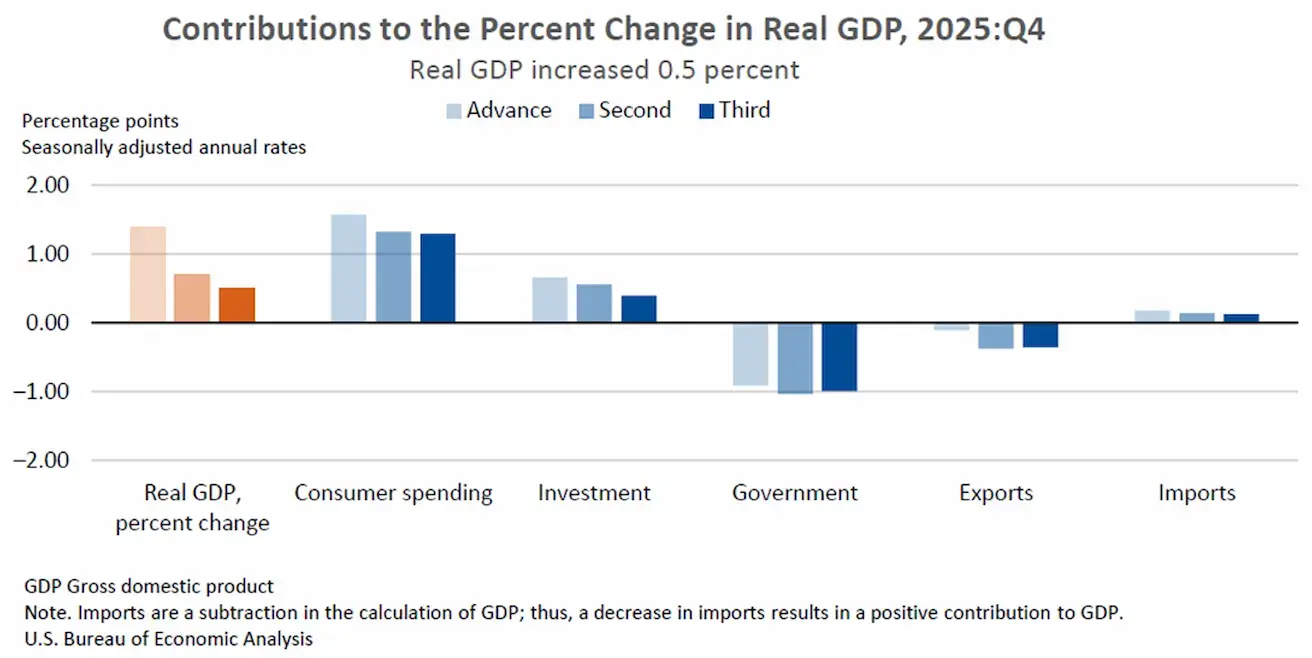
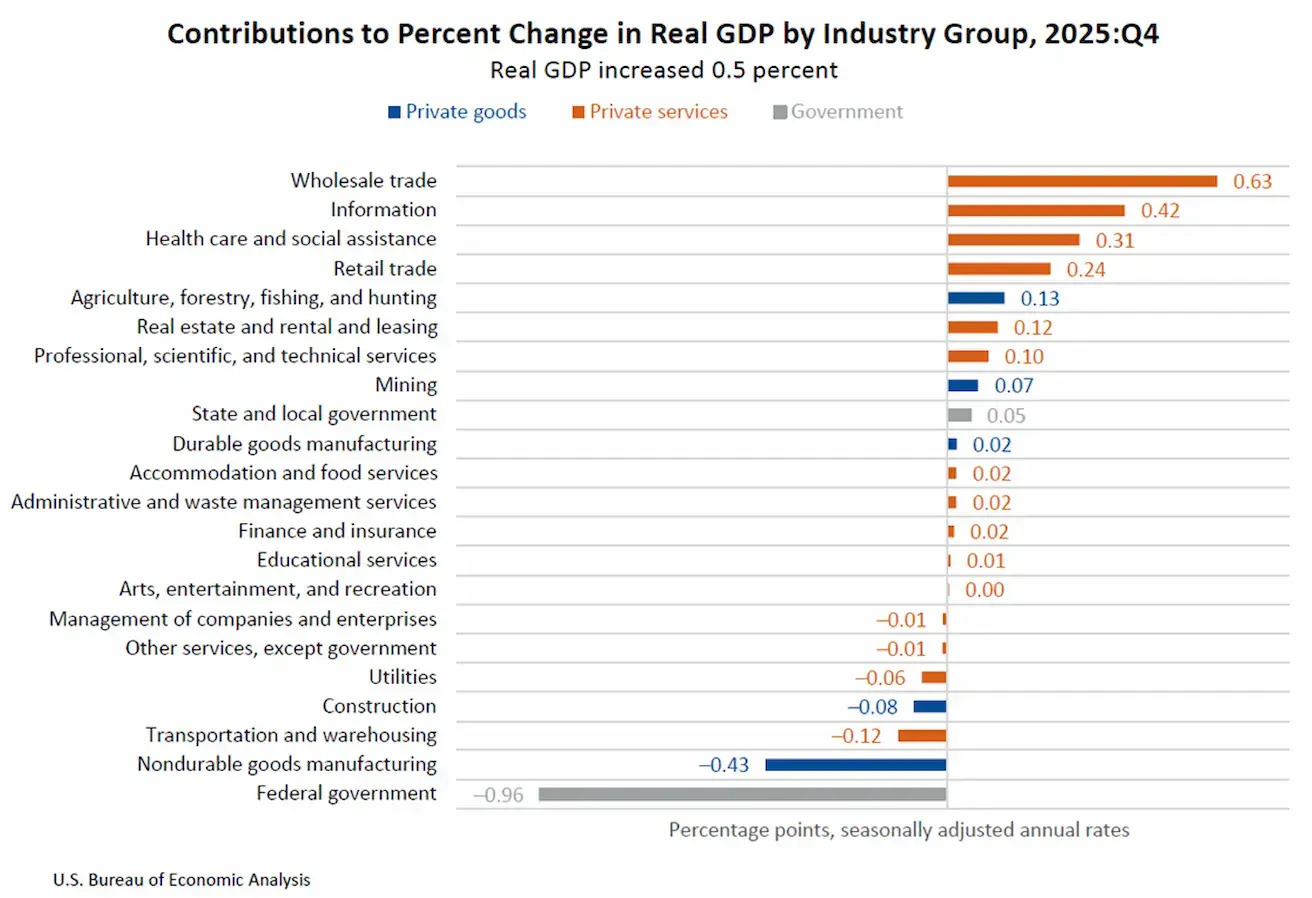
GDP (U.S. Bureau of Economic Analysis, BEA) (Q4 2025, annualized, third estimate): +0.5% (second estimate: 0.7%; Q3 2025: +4.4%).
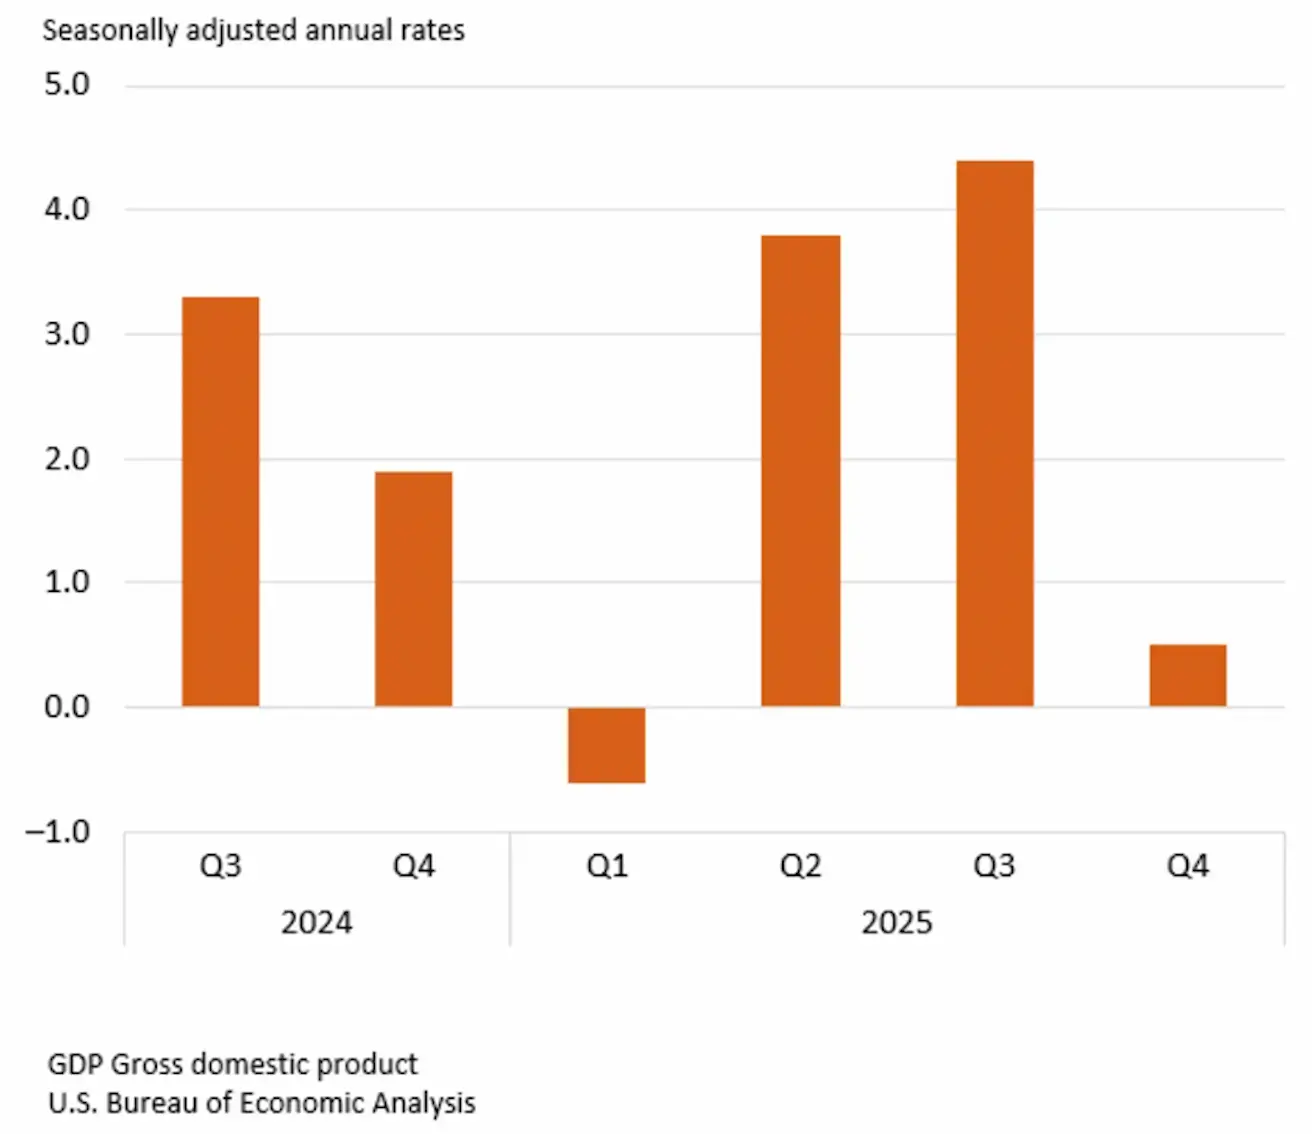
Real GDP was revised downward by 0.2 percentage points to 0.5% from the second estimate of 0.7%, primarily reflecting a decline in projected investment.
The economy has slowed sharply compared to the 4.4% growth recorded in the previous quarter.
The Federal Reserve Bank of Atlanta’s GDPNow indicator (a “real-time” estimate of official GDP ahead of its release): 1.3% (prev: 1.6%).
BUSINESS ACTIVITY INDEX (PMI) (MARCH, PRELIMINARY DATA):
(Above 50 indicates expansion; below 50 indicates contraction)
- Services sector: 51.1 (prev: 51.7);
- Manufacturing sector: 52.4 (prev: 51.6);
- S&P Global Composite: 51.4 (prev: 51.9).
LABOR MARKET (BLS) (MARCH)
- Unemployment rate: 4.3% (prev: 4.4%);
- Total number of continuing jobless claims in the U.S.: 1,794K (prev: 1,851K);
- Initial jobless claims: 219K (prev: 202K);
- Change in nonfarm payroll employment: 178K (prev: -133K);
- Change in private nonfarm payroll employment: 186K (prev: -129K);
- Average hourly earnings (y/y): 3.5% (prev: 3.8%);
- JOLTS job openings: 6.542M (prev: 6.928M).
Weekly change in employment according to ADP: 206K (prev: 15.25K).
MONETARY POLICY
Political outlet Punchbowl reports that the U.S. Senate Banking Committee no longer plans to hold confirmation hearings for Federal Reserve Chair nominee Kevin Warsh, which had been scheduled for next week. The preservation of the Fed’s independence is likely to be viewed positively by the markets.
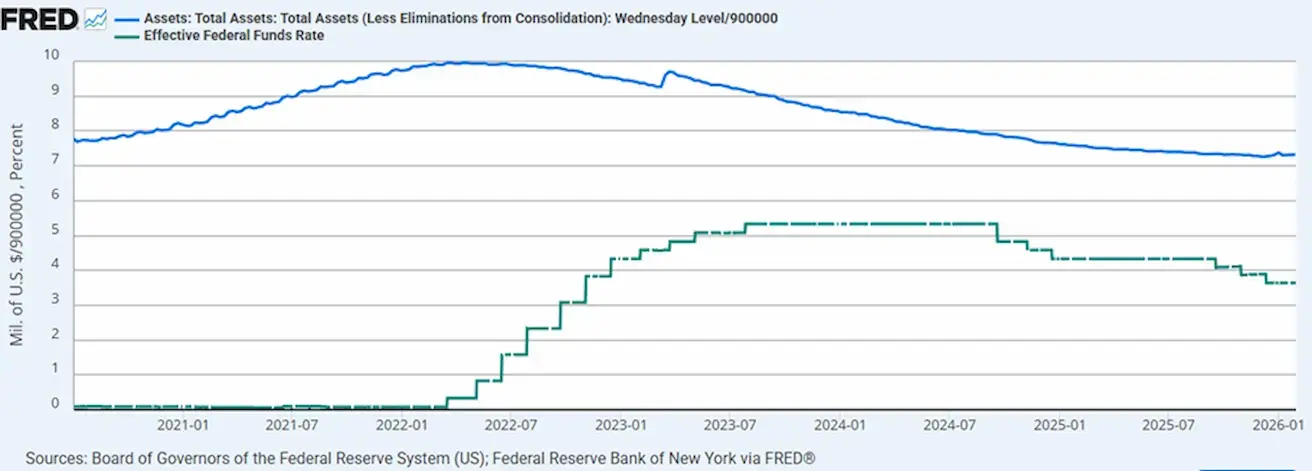
- Effective Federal Funds Rate (EFFR): 3.50%–3.75%;
- The Federal Reserve’s balance sheet stands at $6.693 trillion, up 2.42% since the suspension of QT ($6.535 trillion):
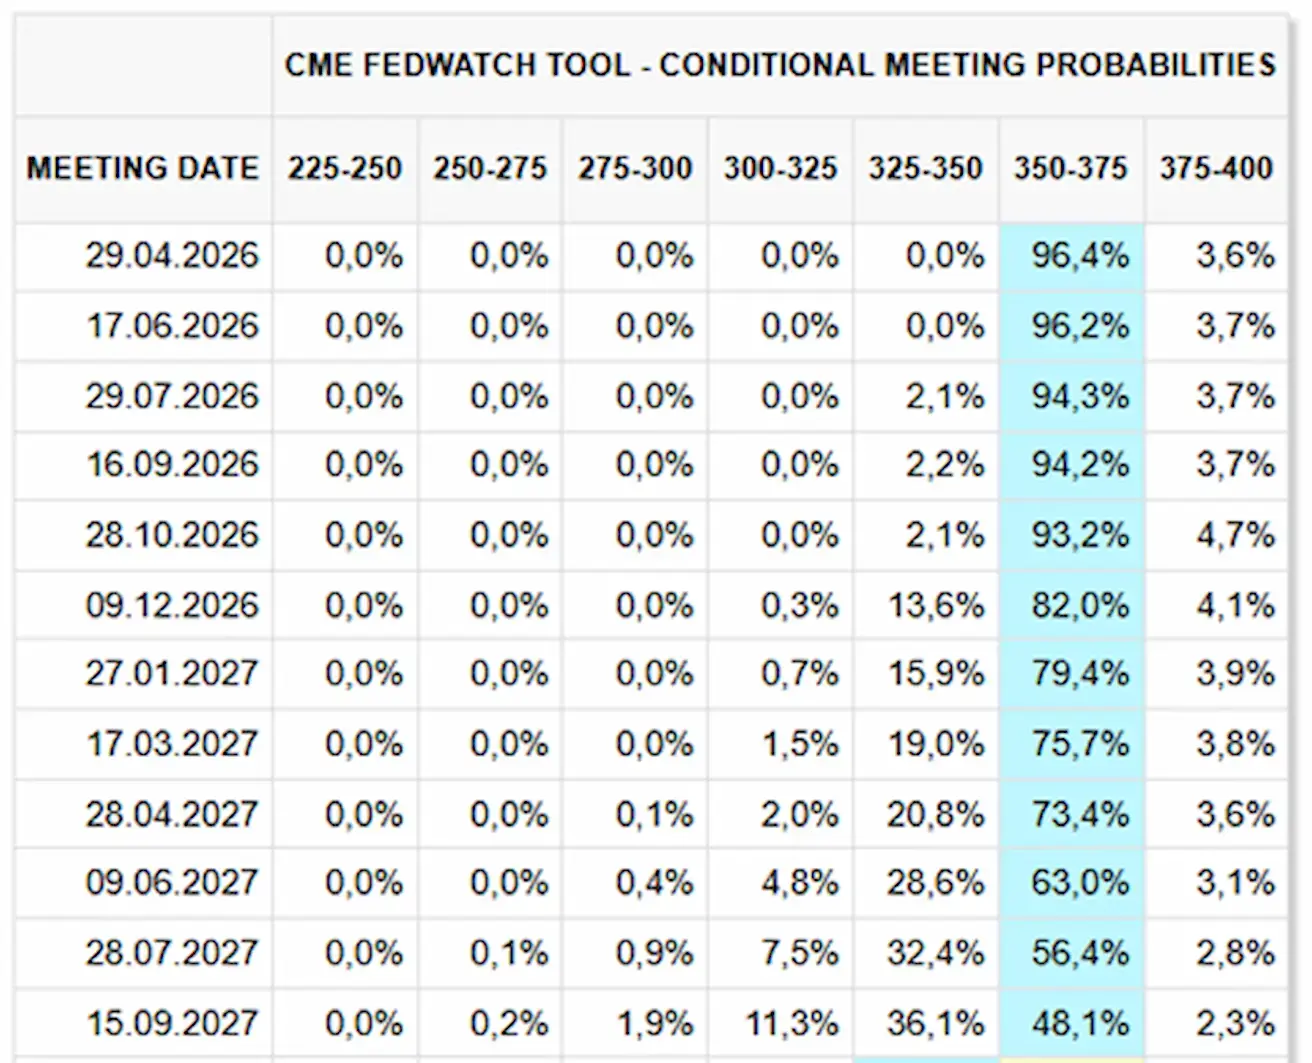
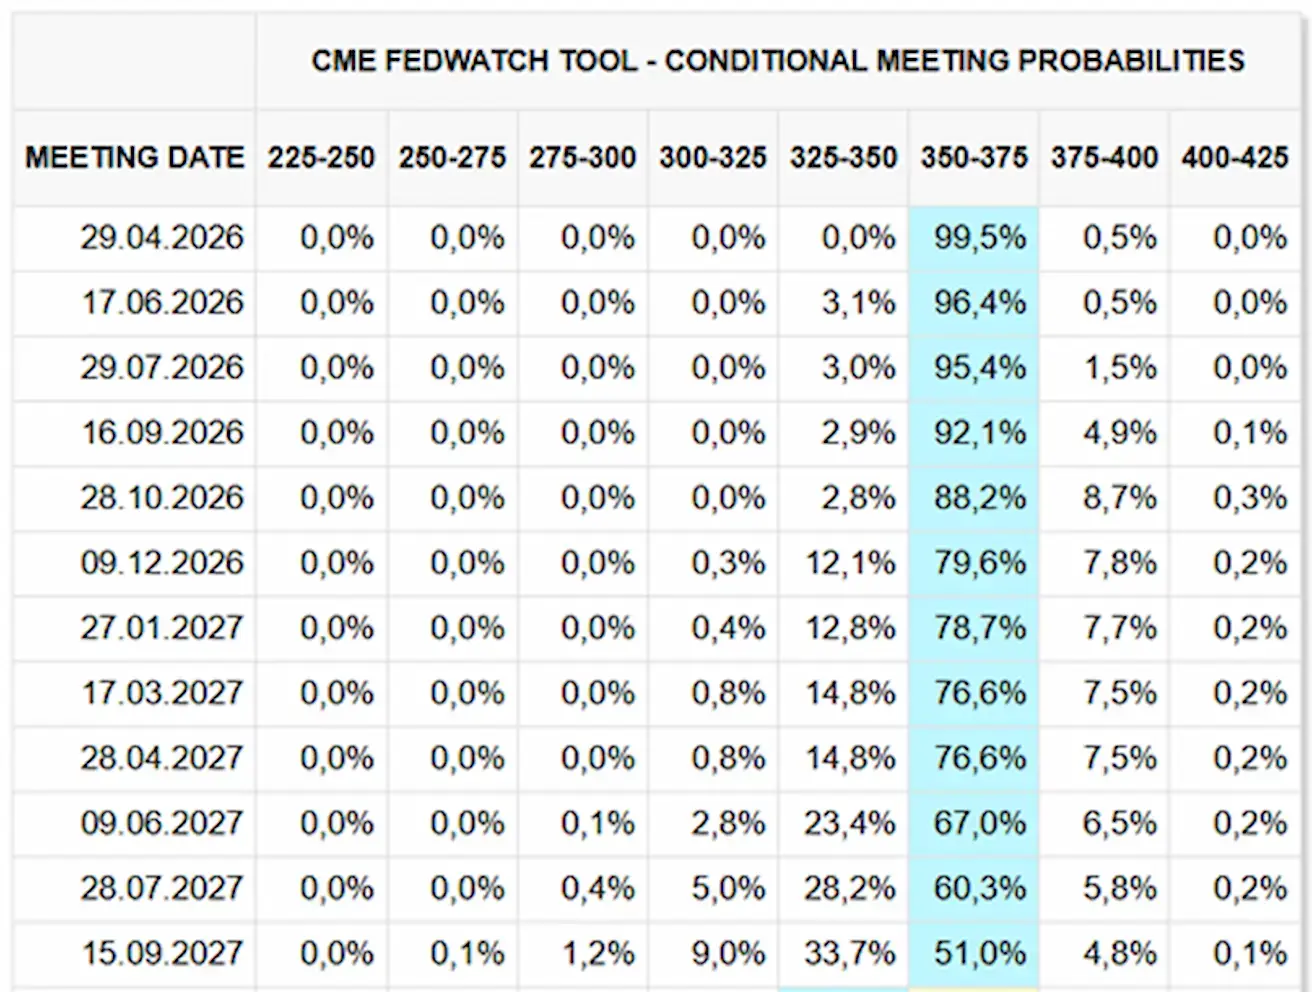
MARKET FORECAST FOR RATE (FEDWATCH)
For the upcoming meeting (April 29), the estimated probability of the rate remaining unchanged stands at 96.38%.
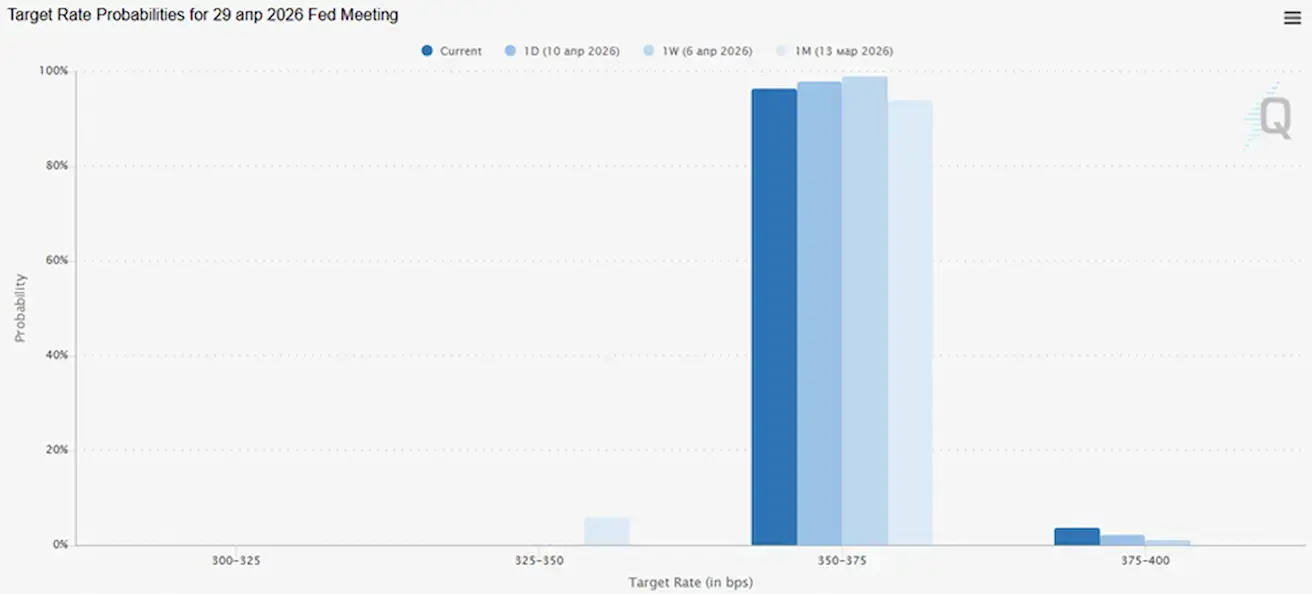
Over the next 12 months, the market is not pricing in any rate cuts:
Today:
**А week earlier: **
Market
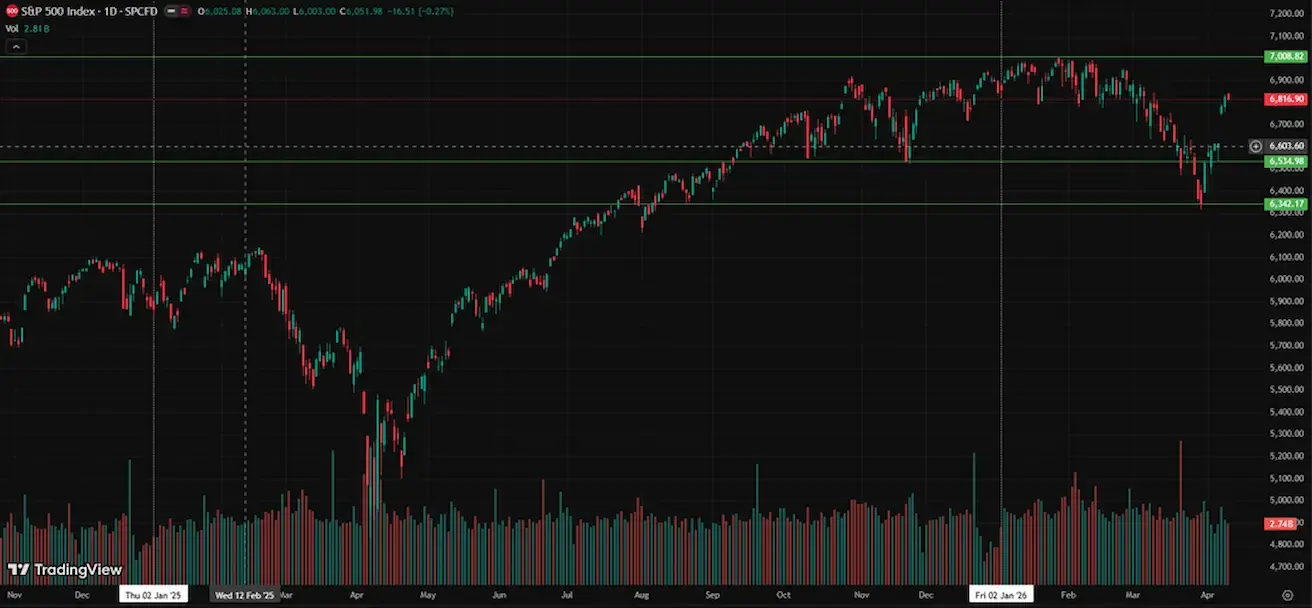
SP500
Weekly performance: +3,56% (week-end close at 6816,9); year-to-date: -0,42%.
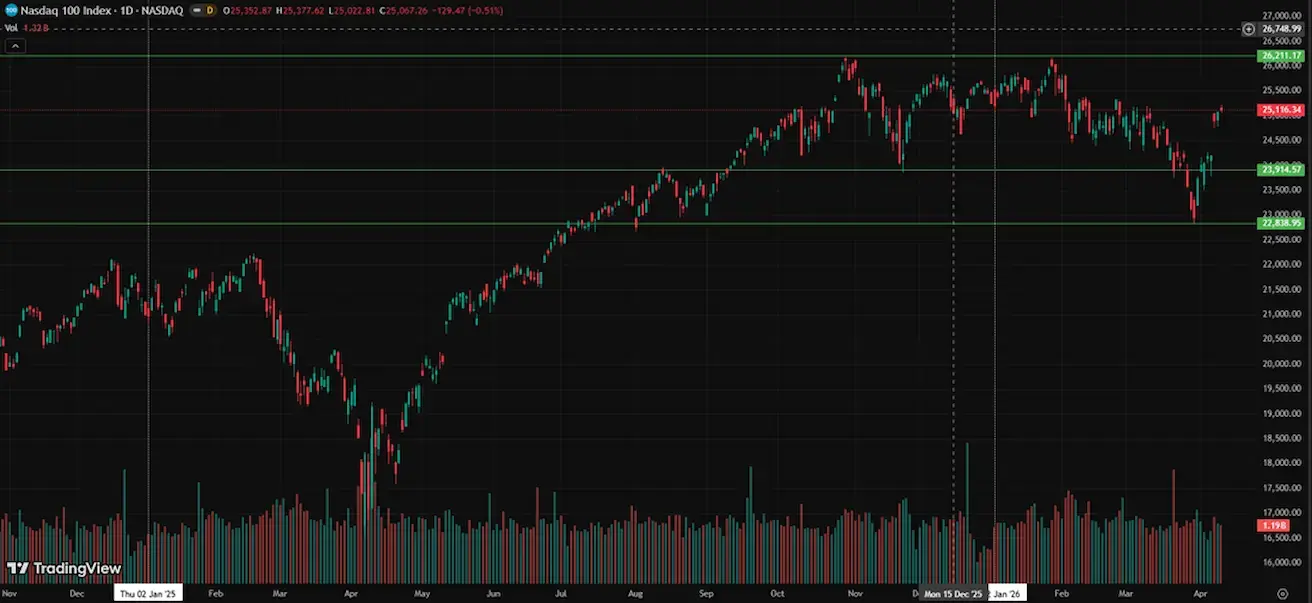
NASDAQ100
Weekly performance: +8,61% (week-end close at 26116,34); year-to-date: +3,43%.
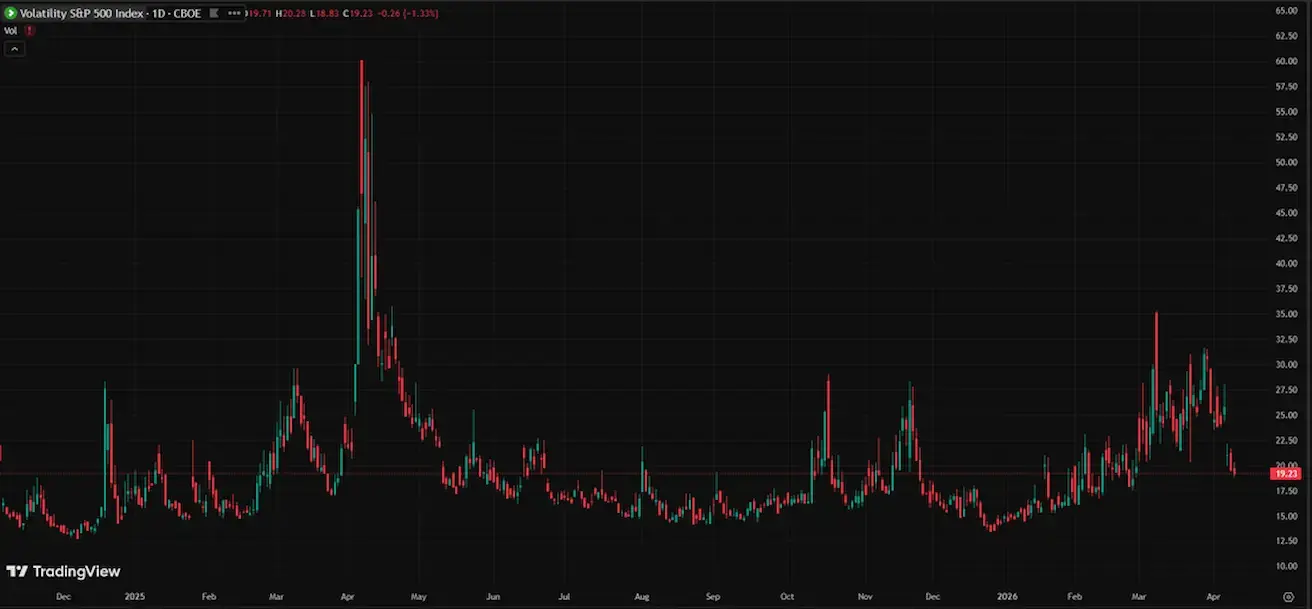
VIX
VIX (volatility index): closed the week at 19.23 points. At the start of today’s session, the index opened at 21, showing a slight increase.
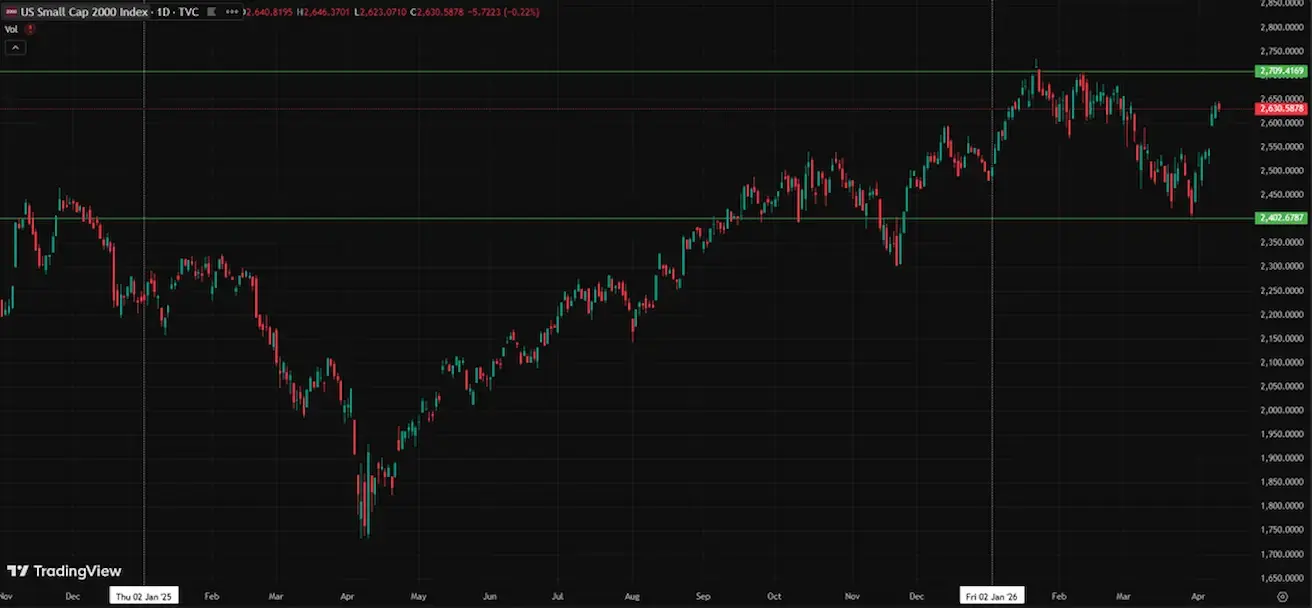
RUSSEL 2000 (RUT)
Weekly performance: +3,97% (week-end close at 2630,58); year-to-date: +5,99%.
Eurozone
- Policy rates remain unchanged for now, but inflation risks are rising;
- The monetary policy stance is neutral, though the balance of risks is tilted toward inflation;
- Amid escalating tensions in the Middle East, the ECB has revised its GDP forecasts downward and raised its inflation outlook for the coming years.
Interest Rates:
- Deposit facility rate: 2.0% (prev: 2.0%);
- Marginal lending facility rate: 2.4% (prev: 2.4%) (used by banks for overnight borrowing from the central bank);
- Main refinancing rate: 2.15% (prev: 2.15%).
Inflation: Consumer Price Index (CPI) (March, preliminary):
- Core CPI (YoY): 2.3% (prev: 2.4%) — declining;
- CPI (MoM): 1.2% (prev: 0.6%); CPI (YoY): 2.5% (prev: 1.9%).
GDP (Q4, final): QoQ: 0.3% (prev: 0.3%); YoY: 1.3% (prev: 1.4%).
Unemployment Rate (February): 6.2% (prev: 6.1%).
PMI (March): remains in expansion territory but shows signs of slowing:
- Services: 50.2 (prev: 51.9);
- Manufacturing: 51.6 (prev: 50.8);
S&P Global Composite: 50.7 (prev: 51.9).
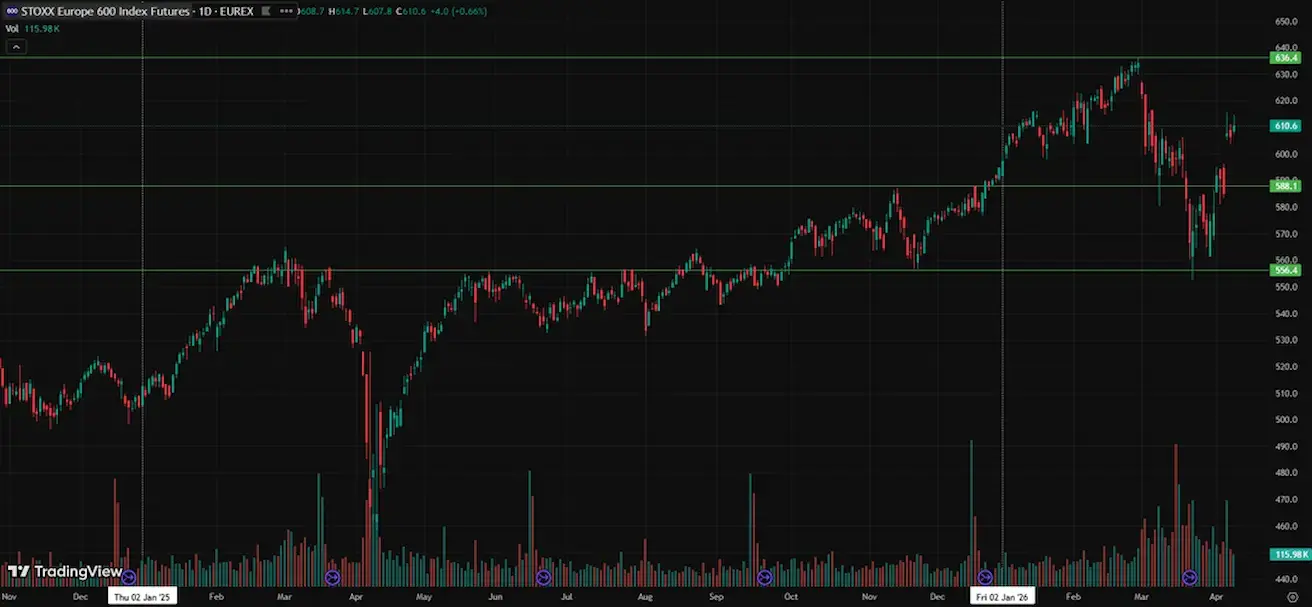
EURO STOXX 600 (FXXP1!)
Weekly performance: +3,37% (Week-end close: 610,6); Year-to-date: 2,79%.
China
The economy is stabilizing on the back of exports, while domestic demand and investment remain weak; policy stimulus remains targeted and cautious.
- Rates remain unchanged;
- Monetary policy stance is accommodative;
- China has reaffirmed continued fiscal support for economic growth under its 2026 plan (stimulating domestic demand, optimizing tax incentives and subsidies, and modernizing industry).
Interest Rates:
- 1Y Loan Prime Rate (medium-term lending): 3.00%;
- 5Y Rate (benchmark rate influencing mortgages): 3.50%.
Inflation Indicators (March):
- Consumer Price Index (CPI): MoM: -0.7% (prev: 1.0%); YoY: 1.0% (prev: 1.3%);
- Producer Price Index (PPI) (YoY): -0.5% (prev: -0.9%).
GDP (Q4, final): QoQ: 1.2% (prev: 1.1%); YoY: 4.5% (prev: 4.8%).
Unemployment Rate (February): 5.3% (prev: 5.1%).
Industrial Production (February, YoY): 6.3% (prev: 5.9%).
Fixed Asset Investment (January, YoY): -3.8% (prev: -2.6%).
Retail Sales (January, YoY): 0.9% (prev: 1.3%).
Trade Data (February):
- Imports (YoY): 19.8% (prev: 5.7%);
- Exports (YoY): 21.8% (prev: 6.6%);
Trade Balance (USD) (February): $213.62 bn (prev: $114.11 bn).
PMI (February):
- Manufacturing: 50.1 (prev: 49.5);
- Non-manufacturing: 50.4 (prev: 49.0);
- Composite: 50.5 (prev: 49.5).
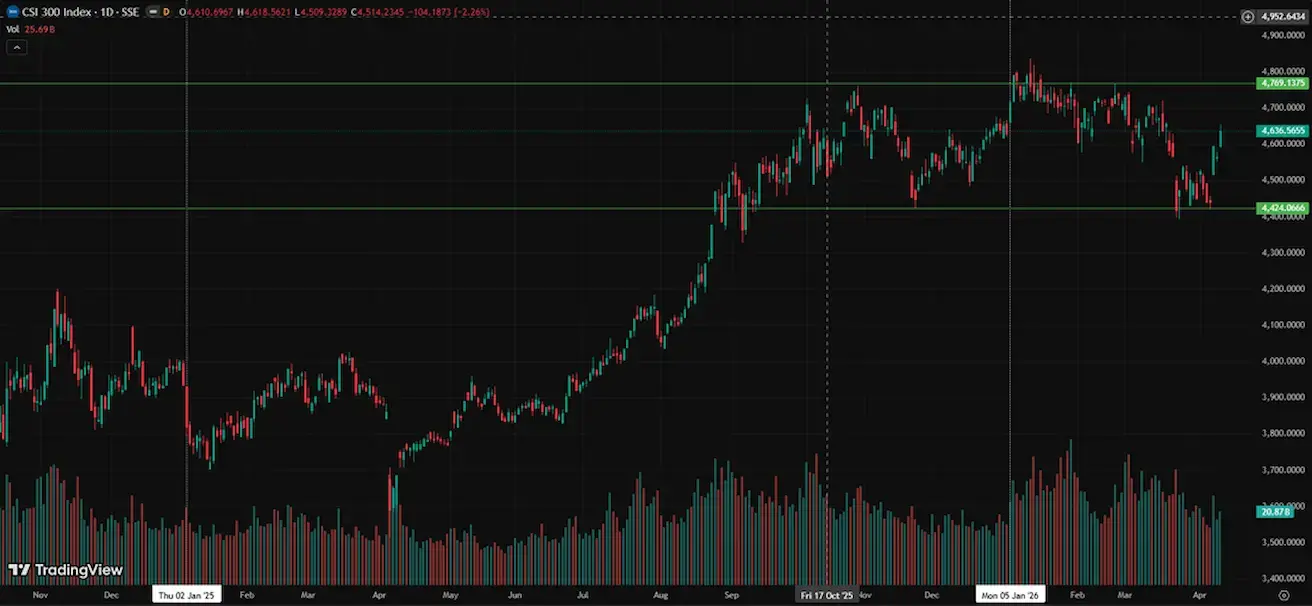
CSI 300 INDEX (000300.HK)
Weekly performance: +4,41% (week-end close at 4636,56); Year-to-date: -0,54%.
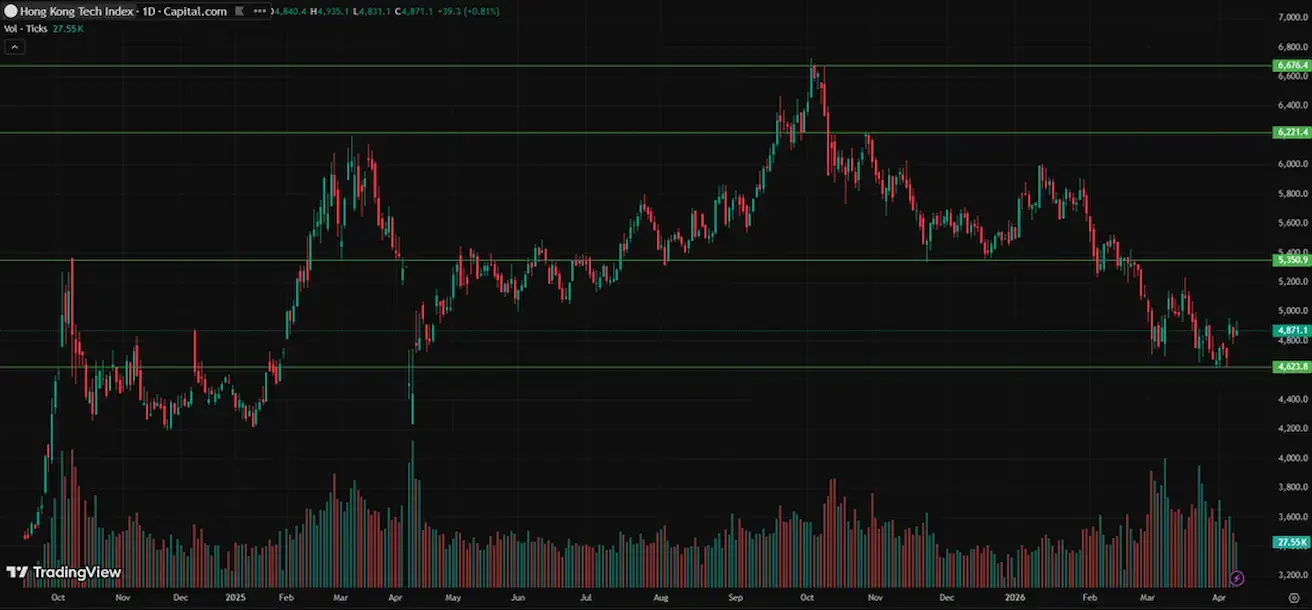
Hang Seng TECH Index (HSTECH)
Weekly performance: +4,10% (week-end close: 4871,1); year-to-date: -11,51%.
BOND MARKET
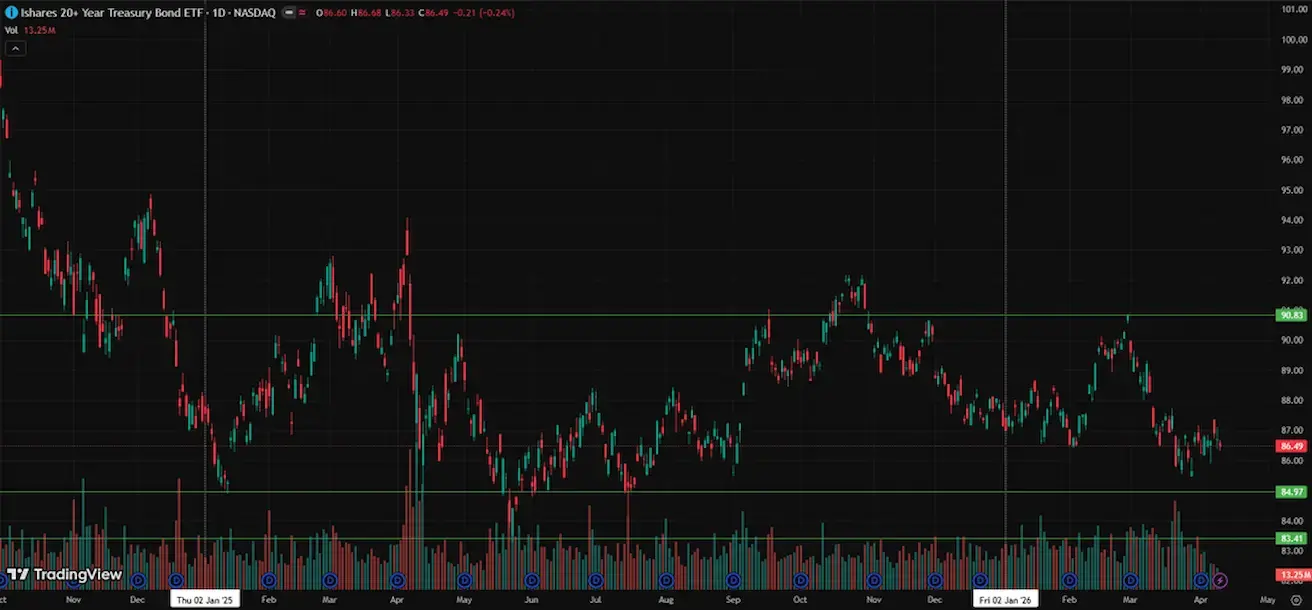
U.S. Treasury bonds 20+ years (ETF TLT): weekly performance: -0,35% (week close: 86,49); year-to-date:-0,77%.
YIELDS AND SPREADS
Yields and spreads — slight decline in yields over the course of the week.
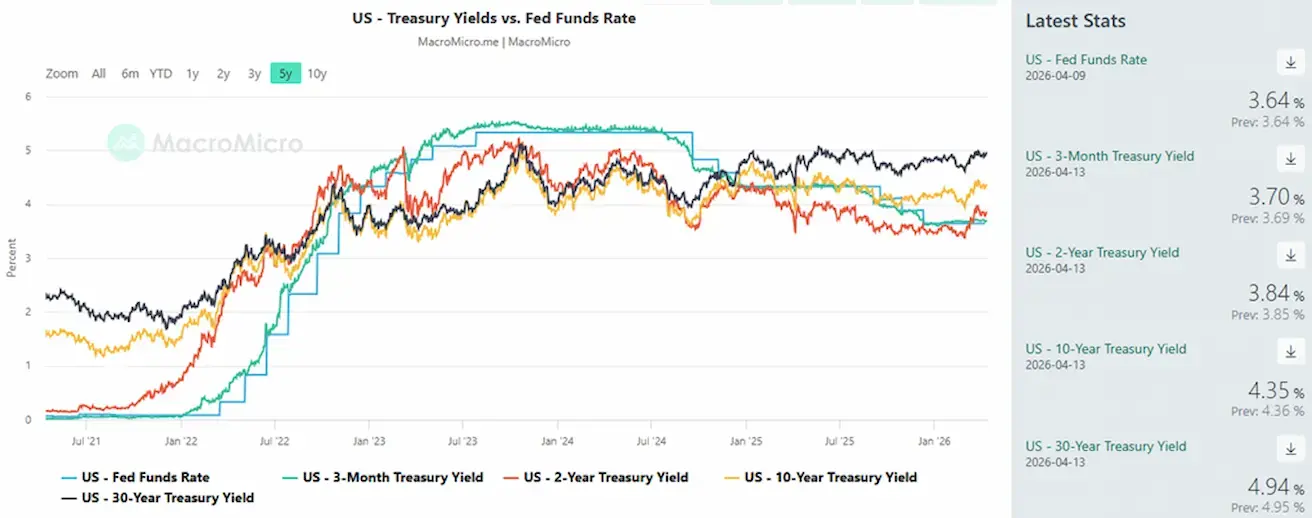
Market Yield on U.S. Treasury Securities at 10-Year Constant Maturity: 4.35% (prev: 4.36%);
2-year Treasury yield: 3.84% (prev: 3.86%);
ICE BofA BBB US Corporate Index Effective Yield: 5.24% (prev: 5.31%).
- The yield spread between 10-year and 2-year U.S. Treasuries stands at 51 basis points (prev: 51);
- The yield spread between 10-year and 3-month U.S. Treasuries stands at 65 basis points (prev: 65). The cost of 5-year U.S. credit default swaps (CDS) (default insurance): 35.53 bps (vs 37.31 bps last week).
Panda Bonds
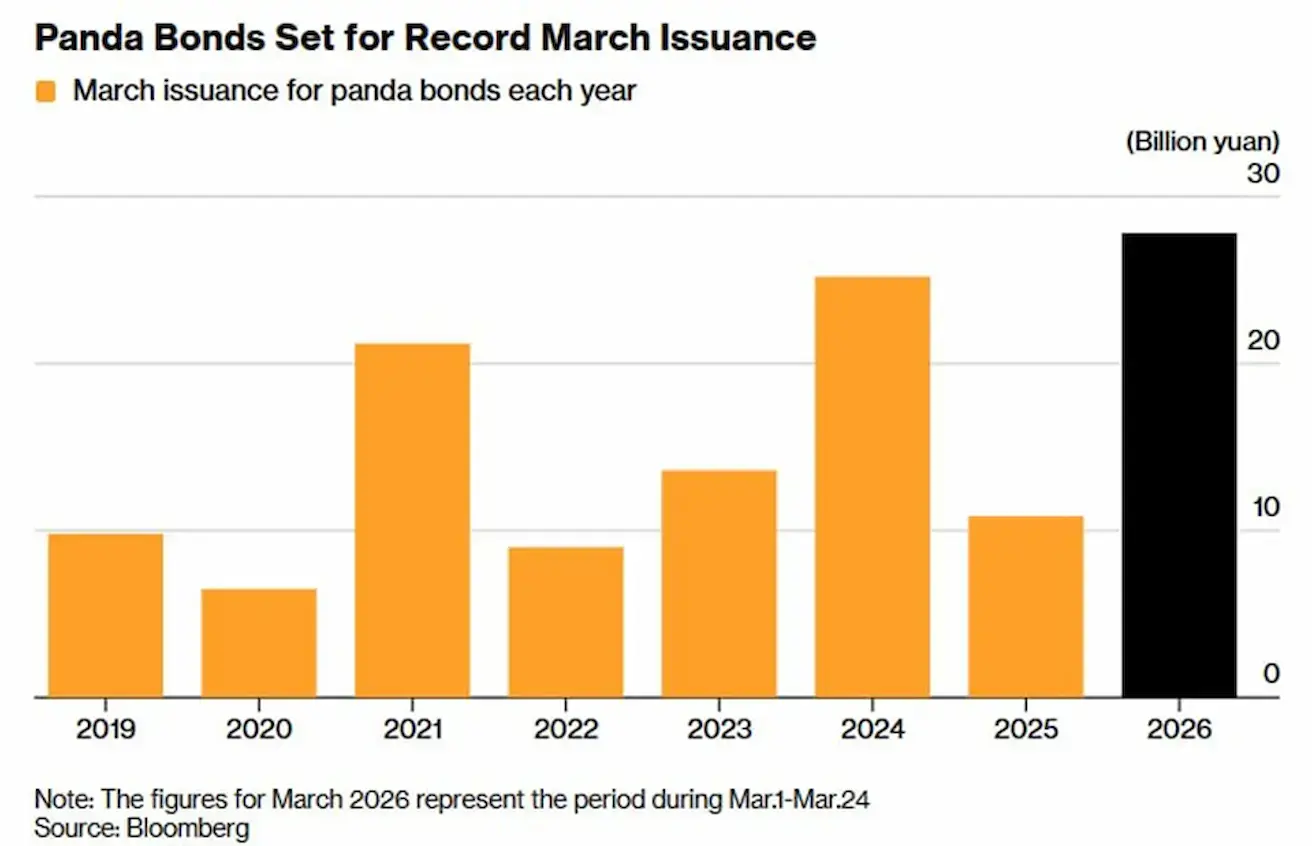
*Panda Bonds are yuan-denominated securities issued by foreign companies, governments, or institutions exclusively within mainland China’s domestic market.
Since the onset of the Middle East conflict, foreign investors have increasingly favored Panda Bonds, despite the yield differential between 10-year U.S. Treasuries at 4.35% and 10-year Chinese government bonds at 1.8%.
Issuance volumes over just a little more than three months have already surpassed the full-year figures of previous years.
International investors are increasingly viewing China’s domestic bond market as a “safe haven.”
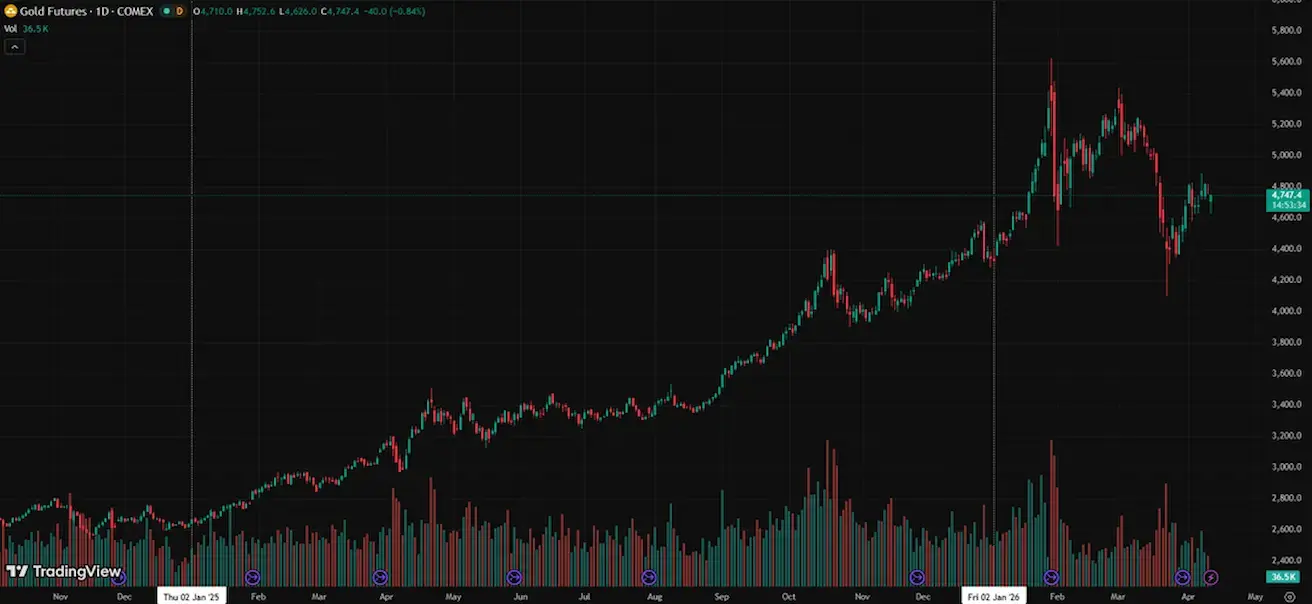
GOLD FUTURES (GC)
Weekly performance: +2,30% (week close: $4787,4 per troy ounce); Year-to-date: +10,51%. Most central banks continue to increase their gold reserves.
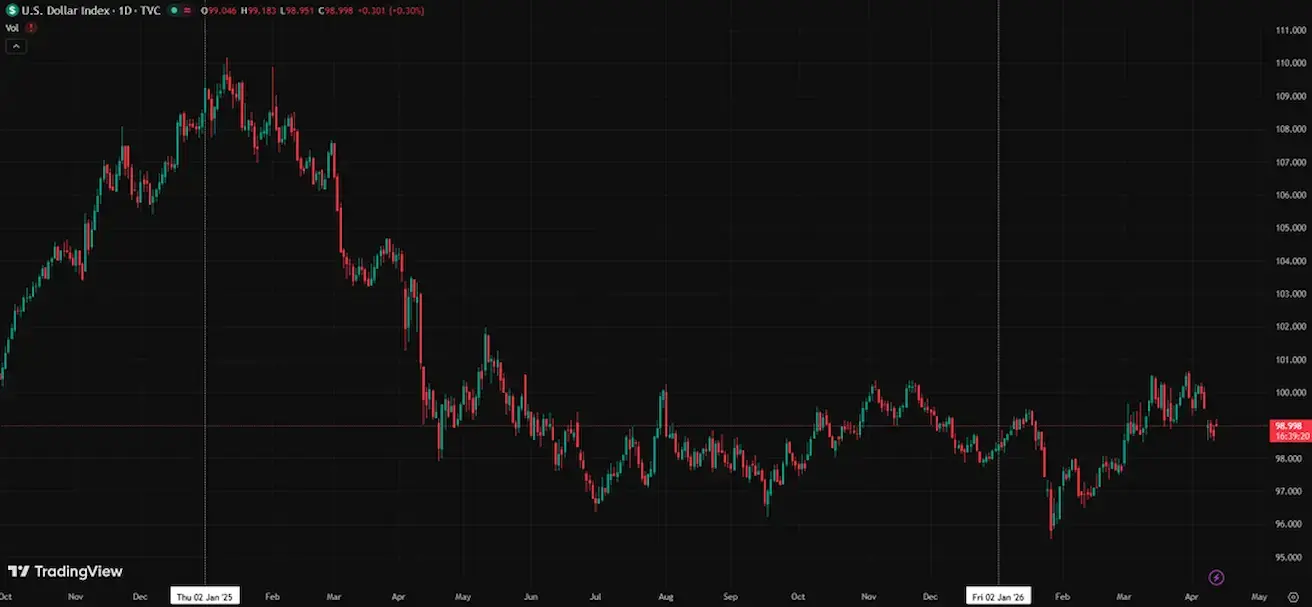
DOLLAR INDEX FUTURES (DX)
Weekly performance: -1,49 (week-end close: 98,697). Year-to-date performance: +0,72%.
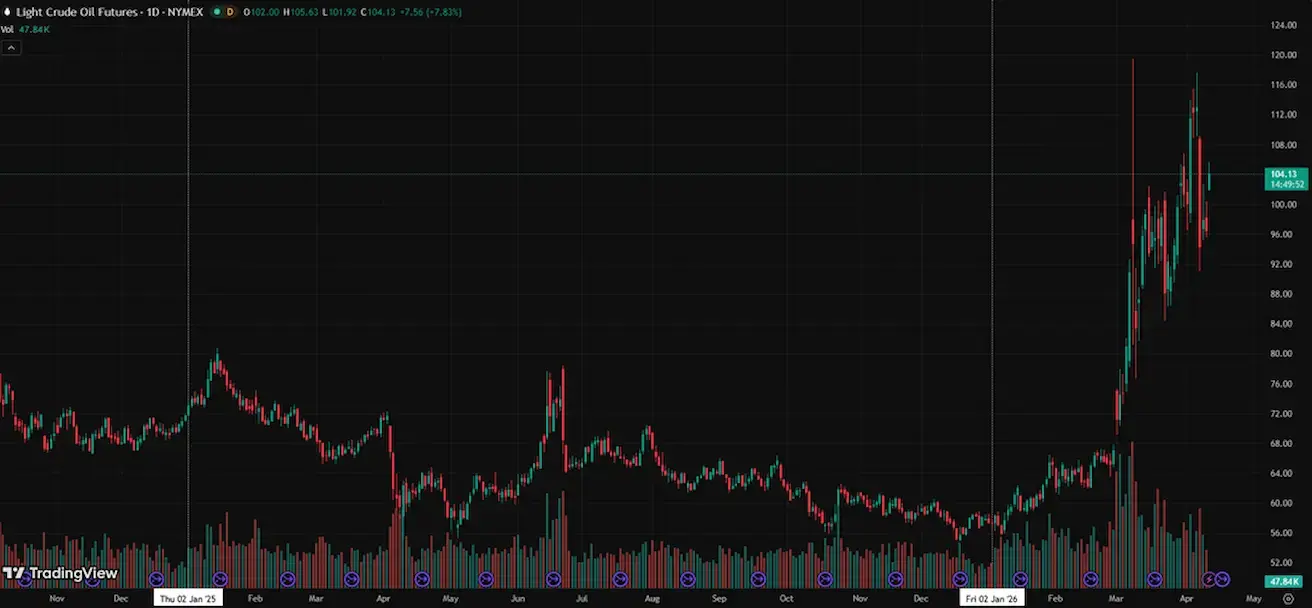
OIL FUTURES
Weekly performance: -13,42% (week-end close: $96,57 per barrel). Year-to-date performance: +68,21%
- IEA participants have begun drawing on their reserves.
- OPEC+ will increase production by 206,000 barrels per day in May.
Brent crude price forecast by the U.S. Energy Information Administration:
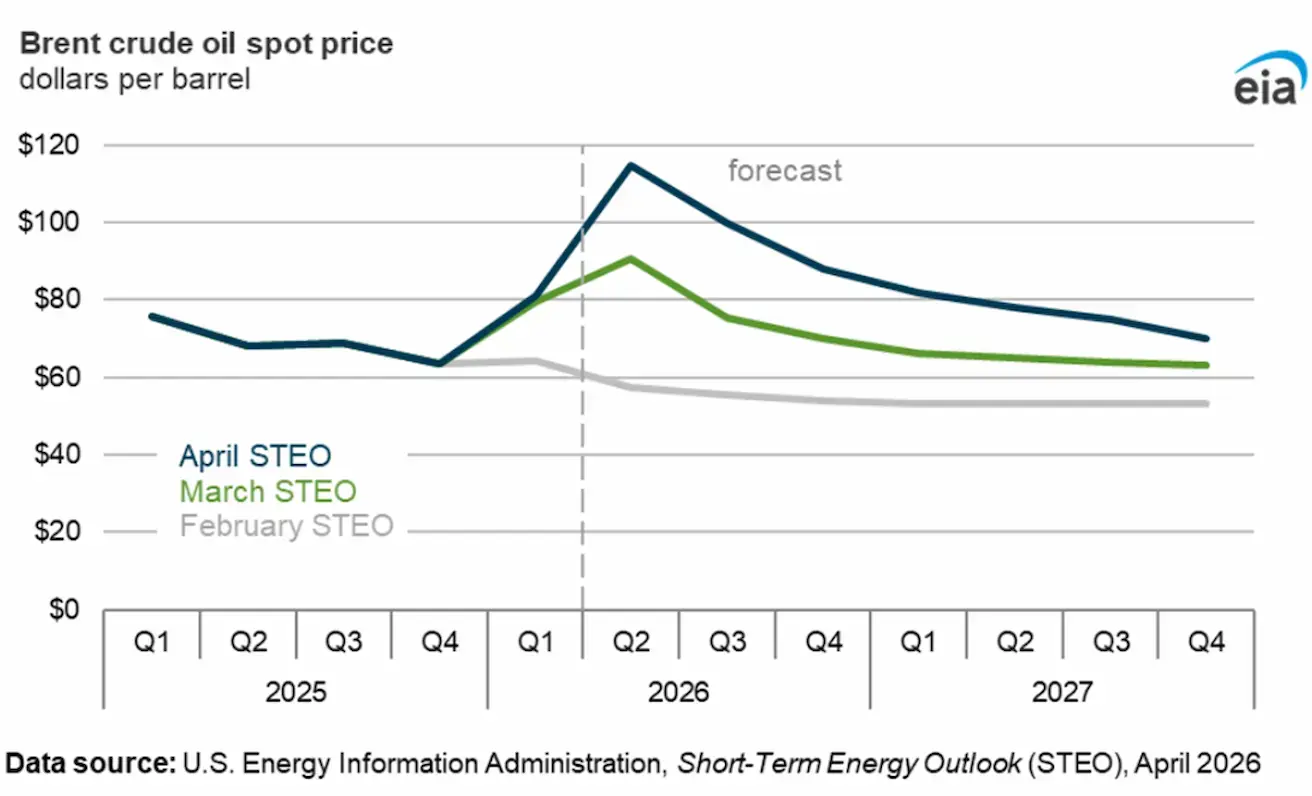
The agency expects Brent crude prices to decline gradually following an increase in the second quarter, to an average of $88 per barrel in the fourth quarter of 2026.
The forecast assumes the conflict will not extend beyond April and that transit through the Strait of Hormuz will gradually resume, though it is not expected to return to pre-conflict levels until the end of 2026.
Given this relatively prolonged adjustment period following the resumption of flows through the strait, the agency anticipates that oil prices will remain elevated, with the average Brent price projected at $76 per barrel in 2027 — approximately $23 per barrel above the February forecast.
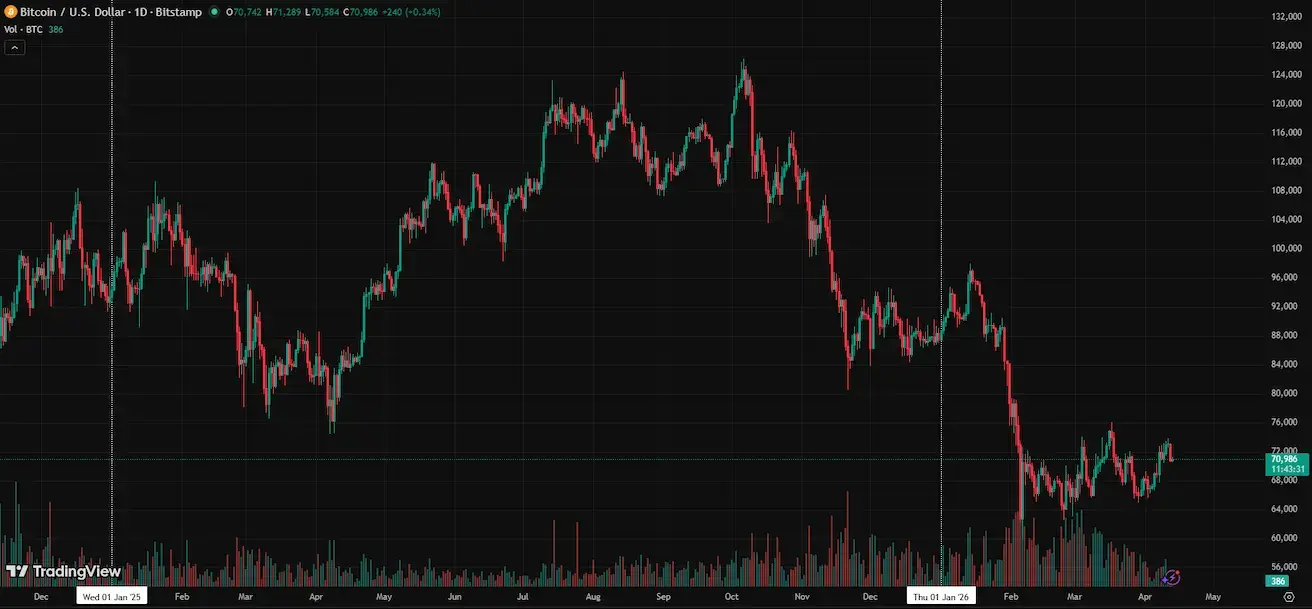
BTC FUTURES
Weekly performance +2,53% (week-end close: $70746); year-to-date: -19,35%.
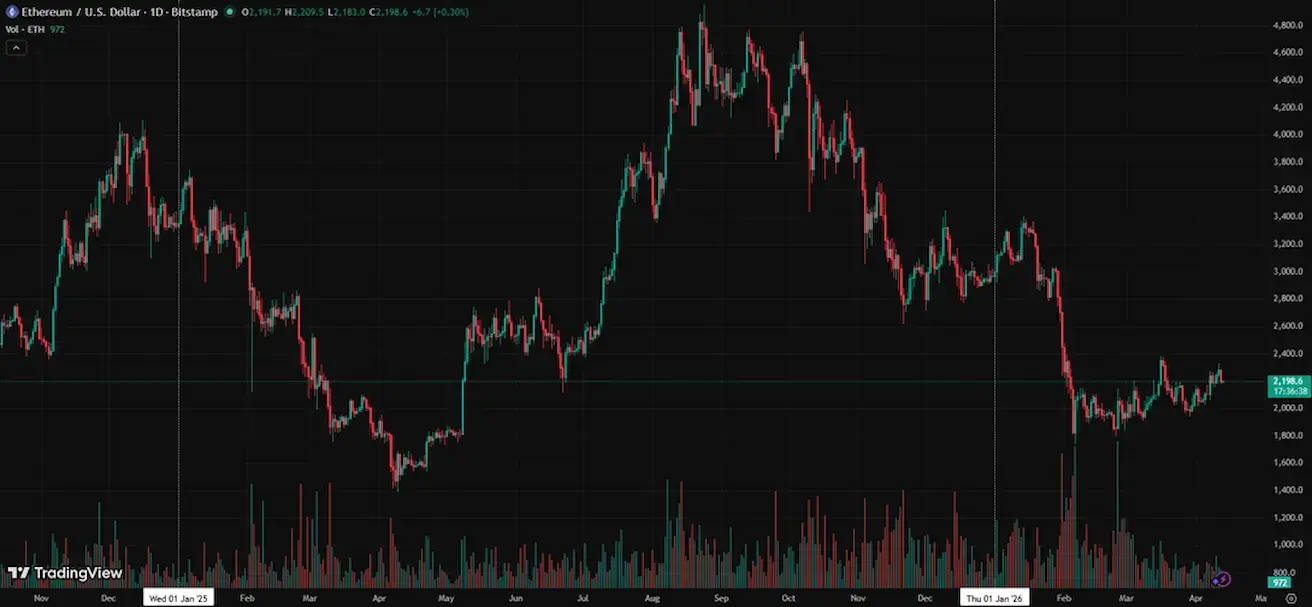
ETH FUTURES
Weekly performance +4,38% (week-end close: $2198,6); year-to-date: -26,07%.
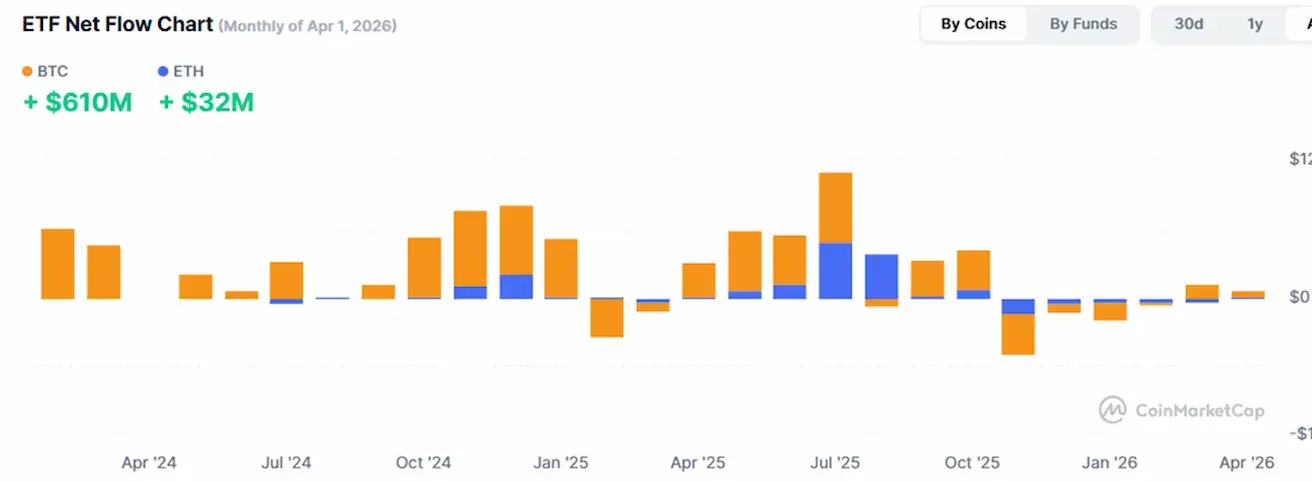
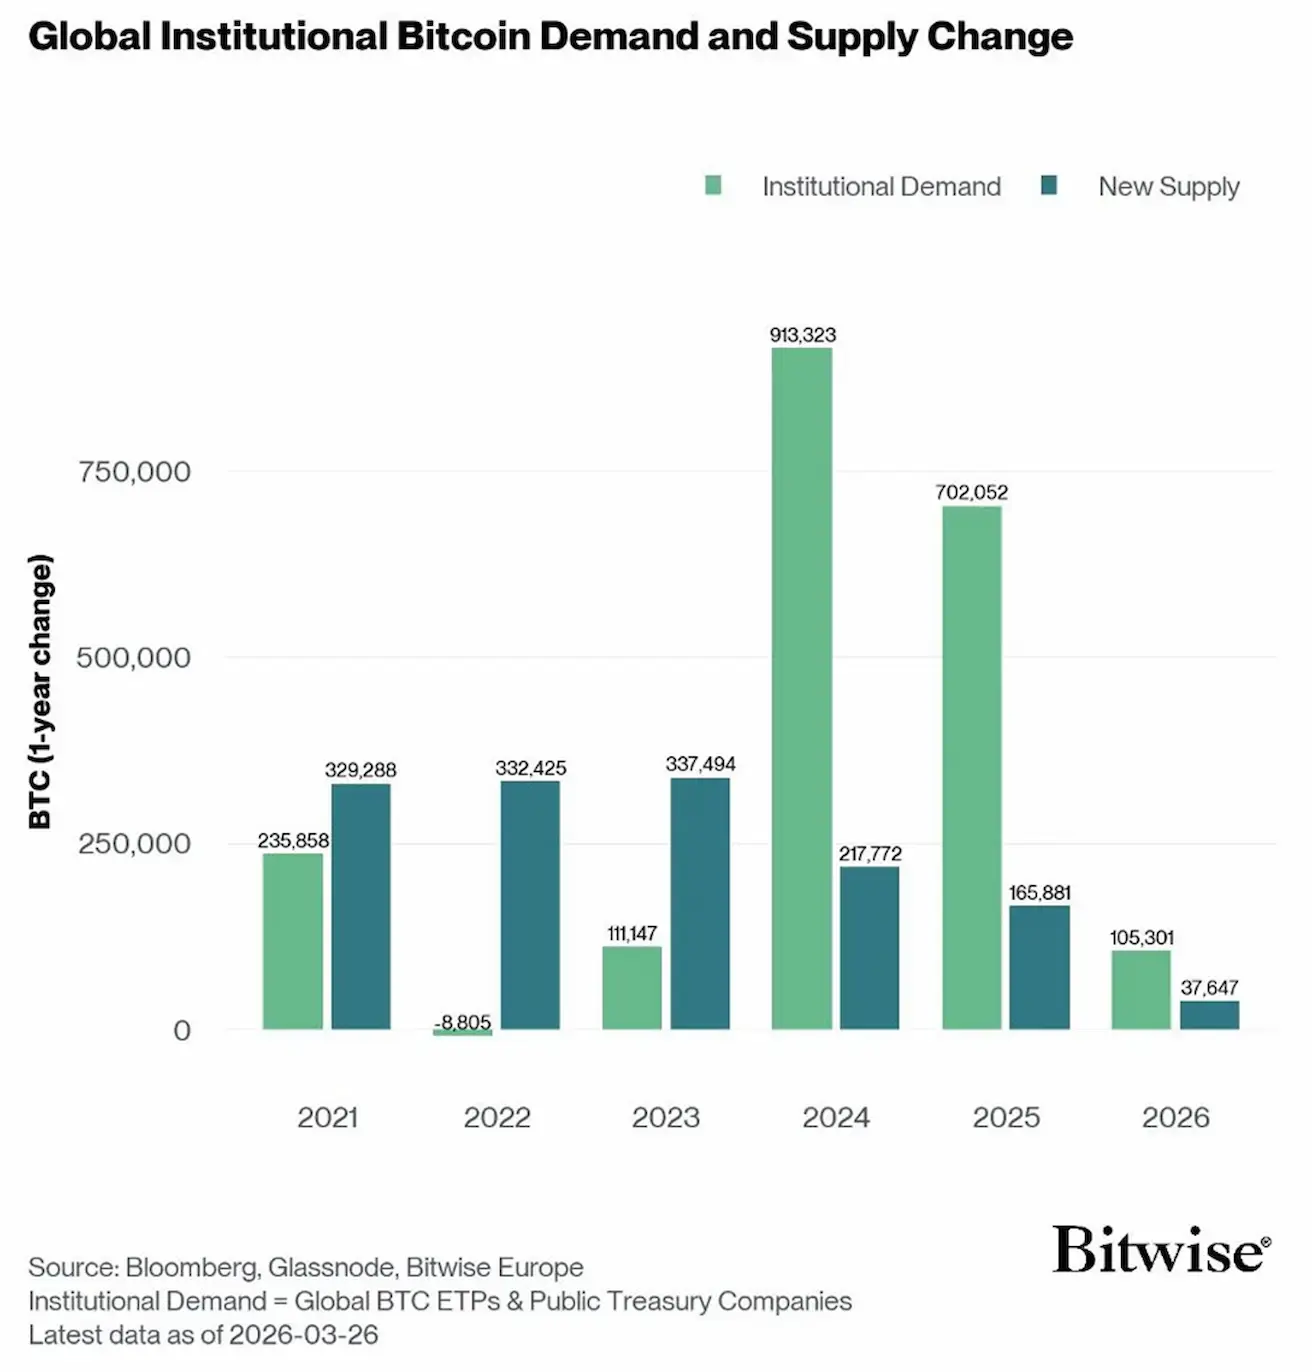
From the Bitwise report: in 2024 and 2025, institutional demand (global exchange-traded products on BTC and treasury companies operating with BTC) exceeded the volume of new Bitcoin supply by threefold.
In 2026, Bitwise expects a similar dynamic, with demand continuing to outpace supply:
TOTAL CRYPTOCURRENCY MARKET CAPITALIZATION
Total crypto market capitalization: $2,42 trillion (vs $2,39 trillion a week earlier) (coinmarketcap.com).
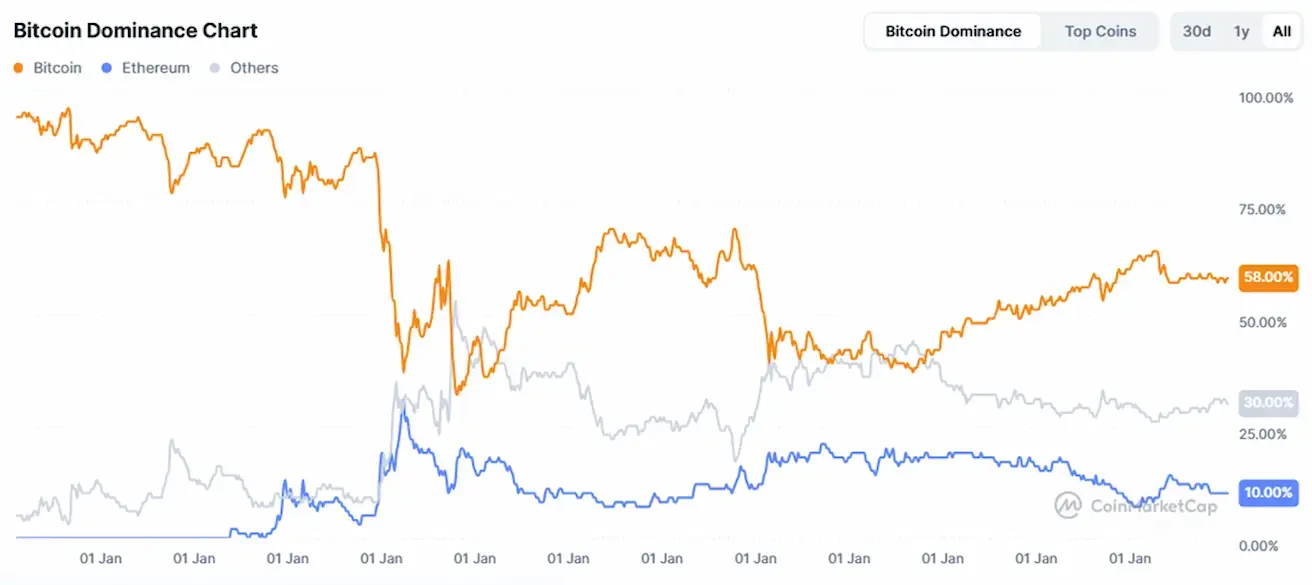
Crypto asset market shares:
- Bitcoin: 58.8% (58.5%)
- Ethereum: 11.0% (10.9%)
- Others: 30.3% (30.6%).
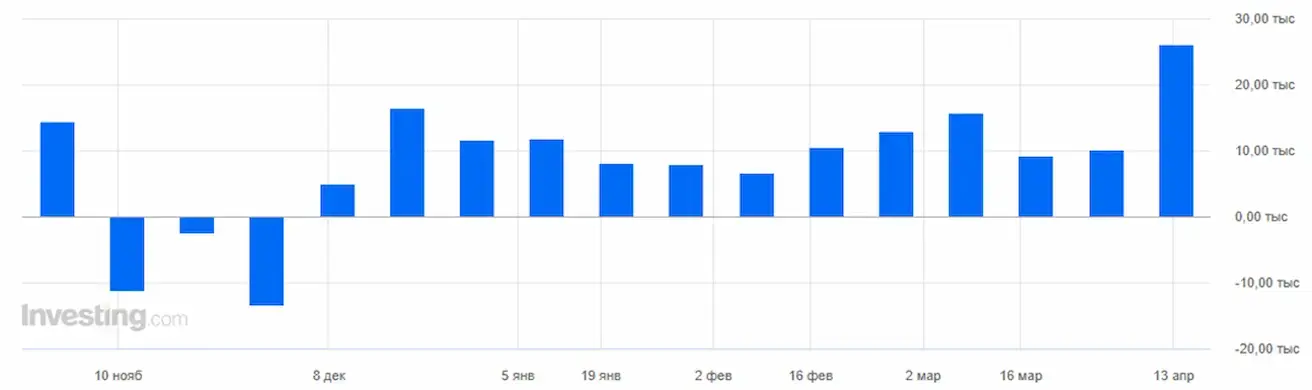
ETF Net Flows Chart: