Русский
 Қазақша
 Eesti
EestiAugust 03 – August 09, 2026: Weekly economic update
Key market updates

Key Takeaways:
- The policy rate remains unchanged, while the Fed's rhetoric remains cautious;
- Monetary policy remains moderately restrictive;
- U.S. macroeconomic data continue to support a soft-landing scenario: inflation risks are increasing, the labor market is cooling without signs of recession, and current conditions do not yet warrant a rate cut.
Commentary
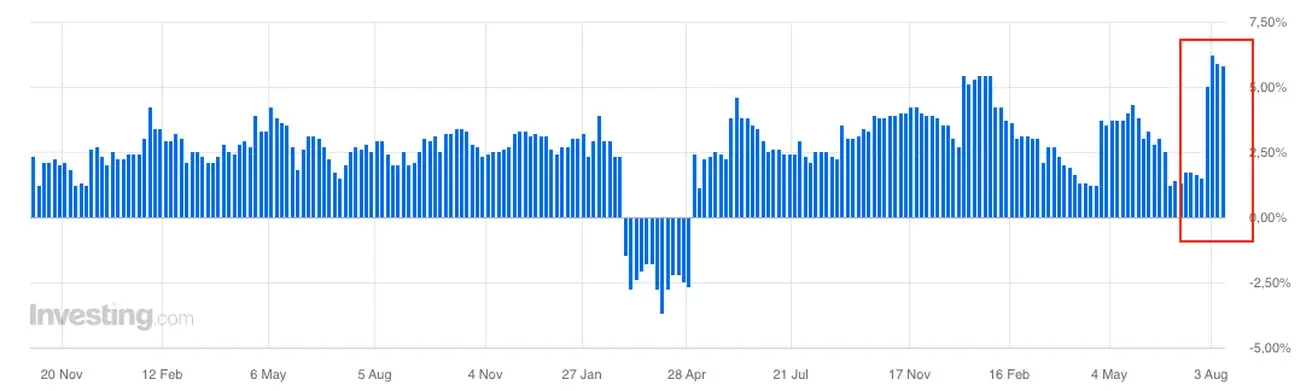
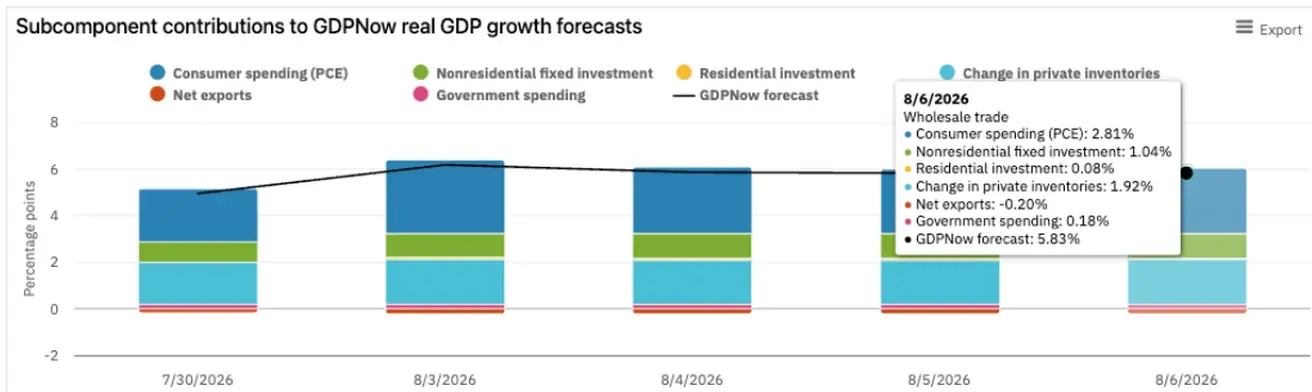
The GDPNow model is signaling a strong start to the third quarter, but the current 5.8% estimate should be treated with caution: it sits well above consensus and is still based on only the first releases of the quarter.
The main driver behind this high reading is a very strong model-based estimate of consumption and investment. Following the August 3 releases, GDPNow raised its estimate of 3Q real consumer spending growth from 3.3% to 4.6% SAAR, and real gross private domestic investment from 15.9% to 17.9%. This pushed the overall GDP Nowcast from 5.0% to 6.2%. Subsequent data then cooled the estimate somewhat: consumption was revised down to 4.1%, and the headline GDPNow figure to 5.8%.
The key takeaway is that consumer spending alone is contributing nearly 3 percentage points of GDP growth. This suggests the U.S. consumer remains quite resilient for now — and consumption accounts for roughly 70% of the U.S. economy. If this component holds up, the economy could indeed grow above consensus, even if the contribution from inventories (a volatile component) later proves smaller.
The U.S. labor market is showing signs of cooling, but it is still too early to speak of a sharp deterioration. The data point more toward a gradual softening in labor demand and easing wage pressure than toward outright labor-market stress.
On one hand, the data show strong consumer spending — a hawkish signal for the Fed; on the other, a cooling labor market — a dovish signal in the opposite direction.
The bottom line is that consumer spending and the labor market may move in different directions for a while yet. The labor market weakness is showing up mainly in flow indicators: companies have grown more cautious about hiring, job openings are declining, and wage pressure is easing.
But the employment level itself remains high: unemployment stands at just 4.1%, and layoffs are not rising sharply. As a result, aggregate household income remains strong enough for now to sustain consumption. In other words, the labor market is cooling from a high base, but not yet to the point of triggering a meaningful pullback in consumer spending. For the Fed and for markets, that makes it a moderately positive signal on balance.
Labor data on their own make the case for future easing, but strong consumption and an elevated GDPNow reading are, for now, offsetting that case.
If energy prices continue to decline, Kevin Warsh will likely continue to stop short of turning words into action, and the policy rate should remain unchanged.
Inflation: Consumer Price Index
- Core CPI (MoM): 0.0% (previous: 0.2%).
- Core CPI (YoY): 2.6% (previous: 2.9%).
- CPI (MoM): -0.4% (previous: 0.5%).
- CPI (YoY): 3.5% (previous: 4.2%).
Producer Price Index (June)
Further constructive indicators emerged as consumer inflation expectations and producer prices shifted lower.
- PPI (MoM): -0.3% (previous: 0.6%).
- Core PPI (MoM): 0.2% (previous: 0.1%).
Inflation Expectations (Michigan) (June)
- 12-month Inflation Expectations: 4.2% (previous: 4.6%).
- 5-Year Inflation Expectations: 3.3% (previous: 3.3%).
GDP (U.S. Bureau of Economic Analysis, BEA) — Q2 2026 annualized growth rate, preliminary: +1.5% (Q1 2026: +2.1%); forecast: 2.1%
GDPNow (the Atlanta Fed's real-time estimate of official GDP growth ahead of release (Q3 2026)): 5.8% (previous: 1.7%).
Labor Market (BLS) (July)
- Unemployment Rate: 4.1% (previous: 4.2%).
- Continued Jobless Claims: 1.801K (previous: 1.782K).
- Initial Jobless Claims: 199K (previous: 197K).
- Nonfarm Payrolls (NFP): -23K (previous: 57K).
- Private Nonfarm Payrolls: 30K (previous: 49K).
- Average Hourly Earnings (YoY): 3.2% (previous: 3.4%).
- JOLTS Job Openings: 6.866 million (previous: 6.922 million).
Business Activity Index (PMI) (June)
(Above 50 indicates expansion; below 50 indicates contraction)
- Services PMI: 54.6 (previous: 51.2).
- Manufacturing PMI: 53.8 (previous: 53.9).
- Composite PMI: 54.5 (previous: 51.9).
Monetary Policy
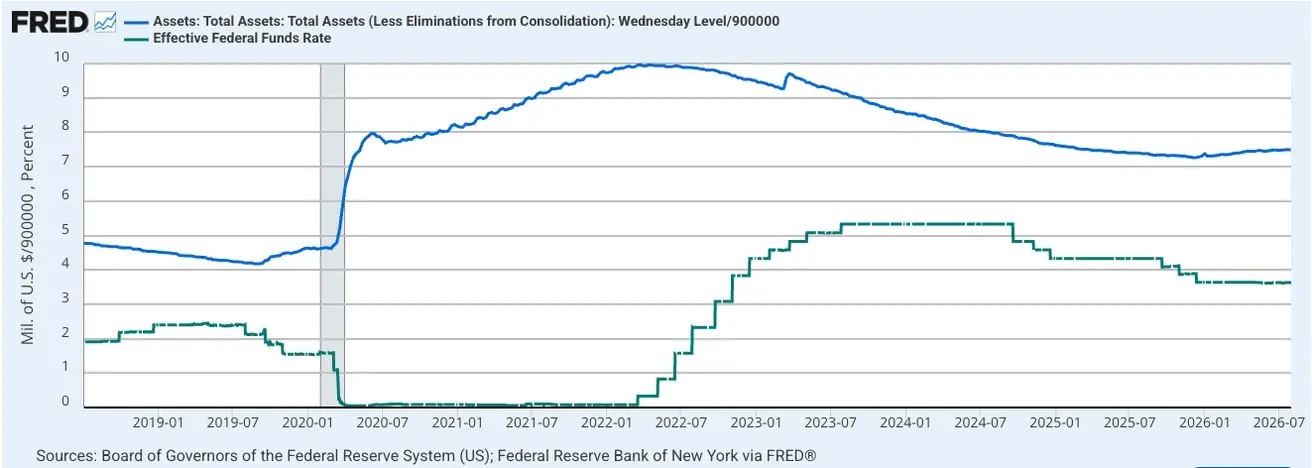
Effective Federal Funds Rate (EFFR): 3.50%–3.75%.
Federal Reserve Balance Sheet: $6.748 trillion, +3.26% since the suspension of quantitative tightening (QT), when the balance sheet stood at $6.535 trillion.
Market Forecast for Rate (FedWatch)
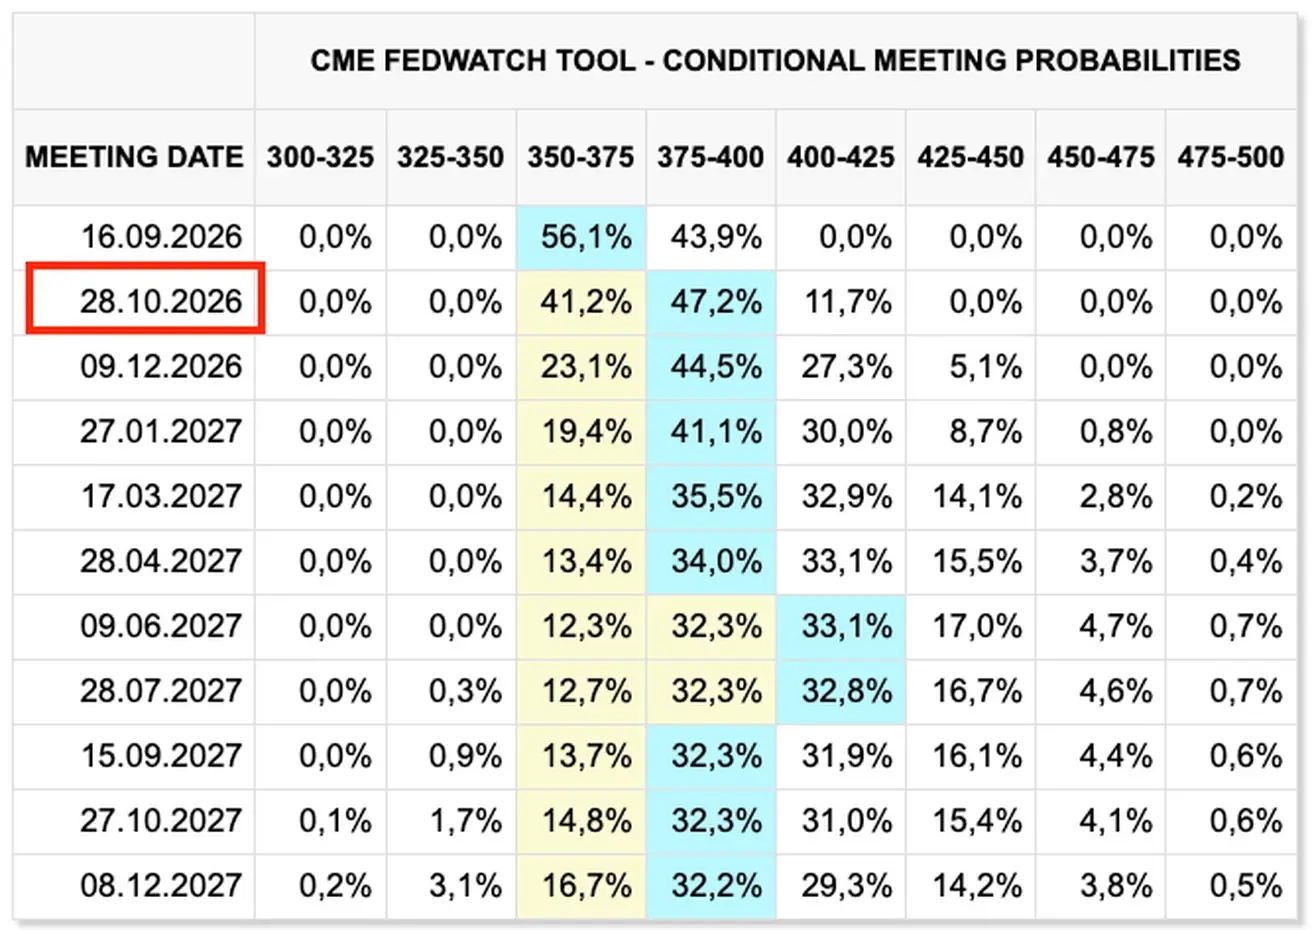
For the next FOMC meeting (September 16) - expectations have improved; the implied market probability of a rate hike is 43.9% (week ago: 64.5%):
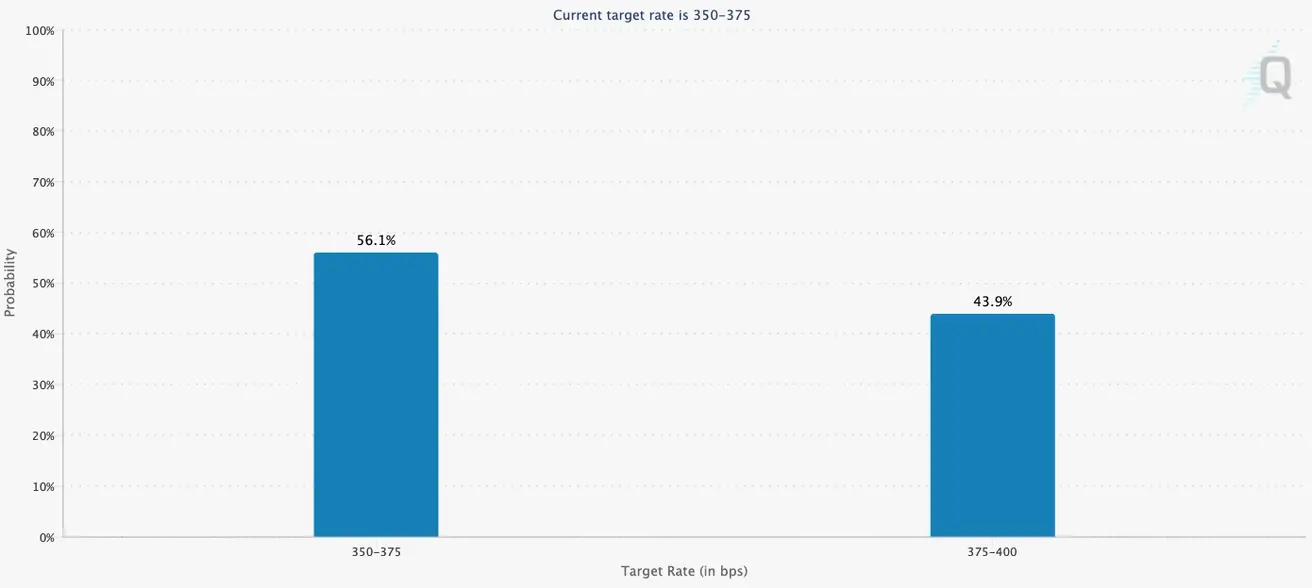
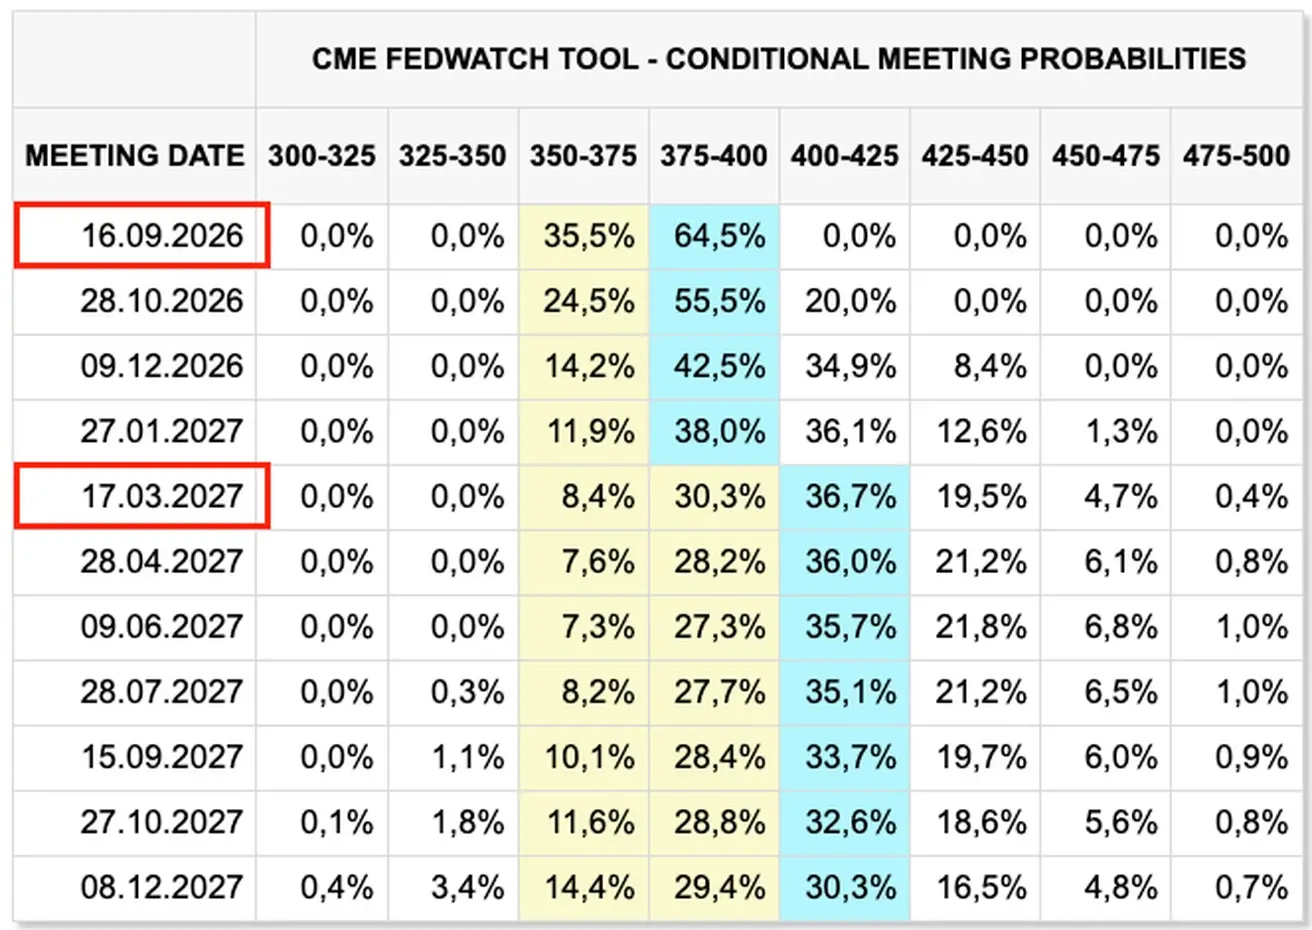
Over the next 12 months, the market now expects a single 25-basis-point rate hike, bringing the target range to 3.75%–4.00% by October of this year. The rate-hike expectations priced in for summer 2027 can be viewed as a temporary outlier.
Today:
A week earlier:
SP500
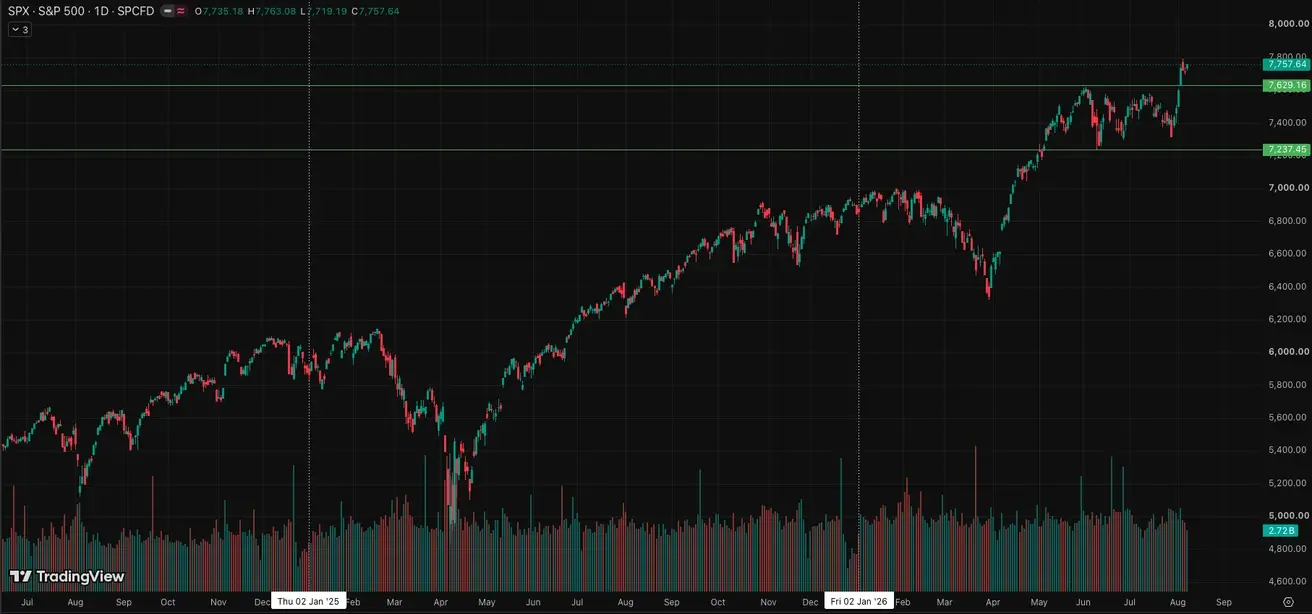
Weekly performance: +3,58% (week-end close: 7757,63); year-to-date: +13,32%.
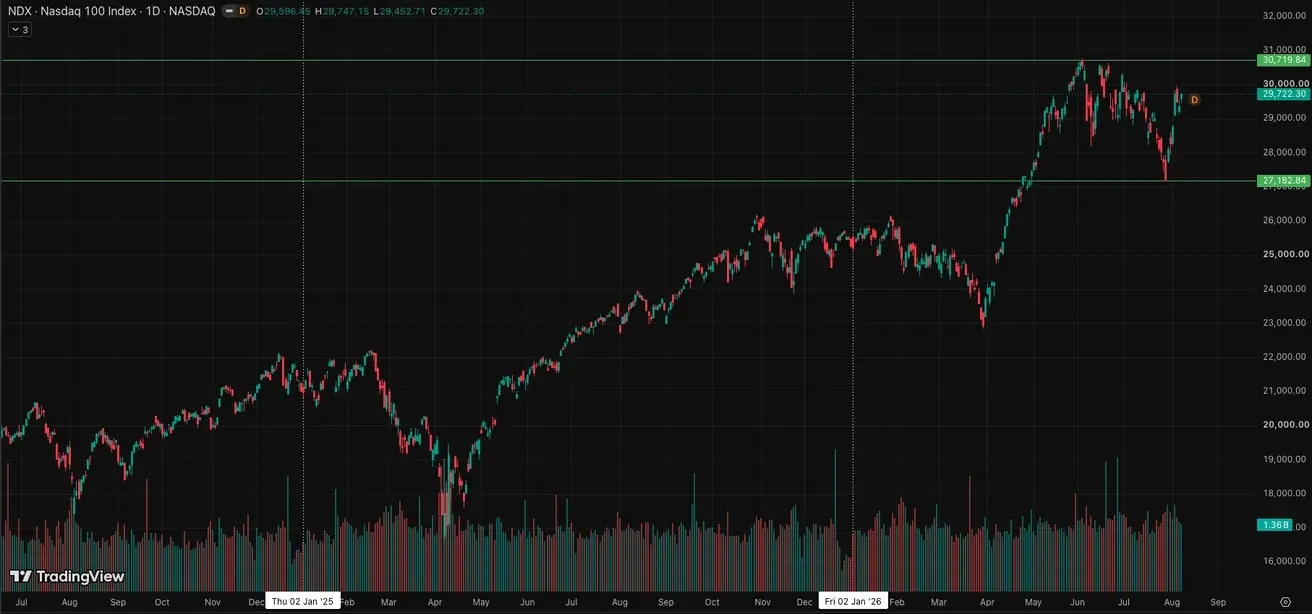
NASDAQ100
Weekly performance: +5,12% (week-end close: 29722,30); year-to-date: +17,71%.
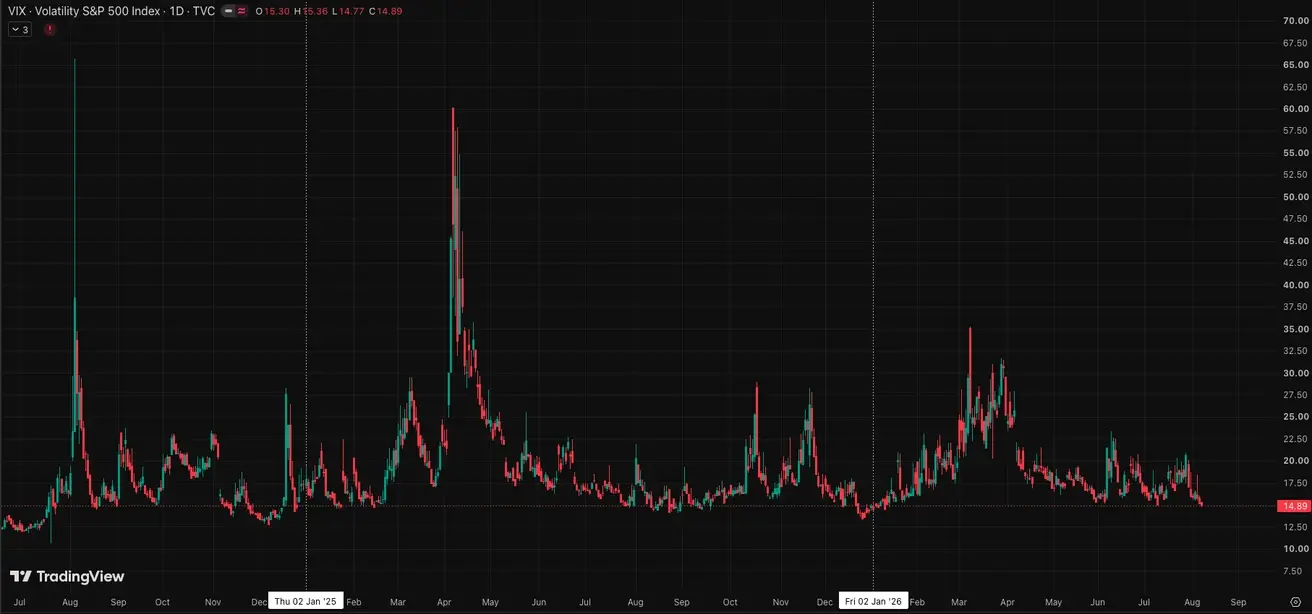
VIX
VIX (volatility index): week-end close at 14,89 points.
Company earnings from last week.
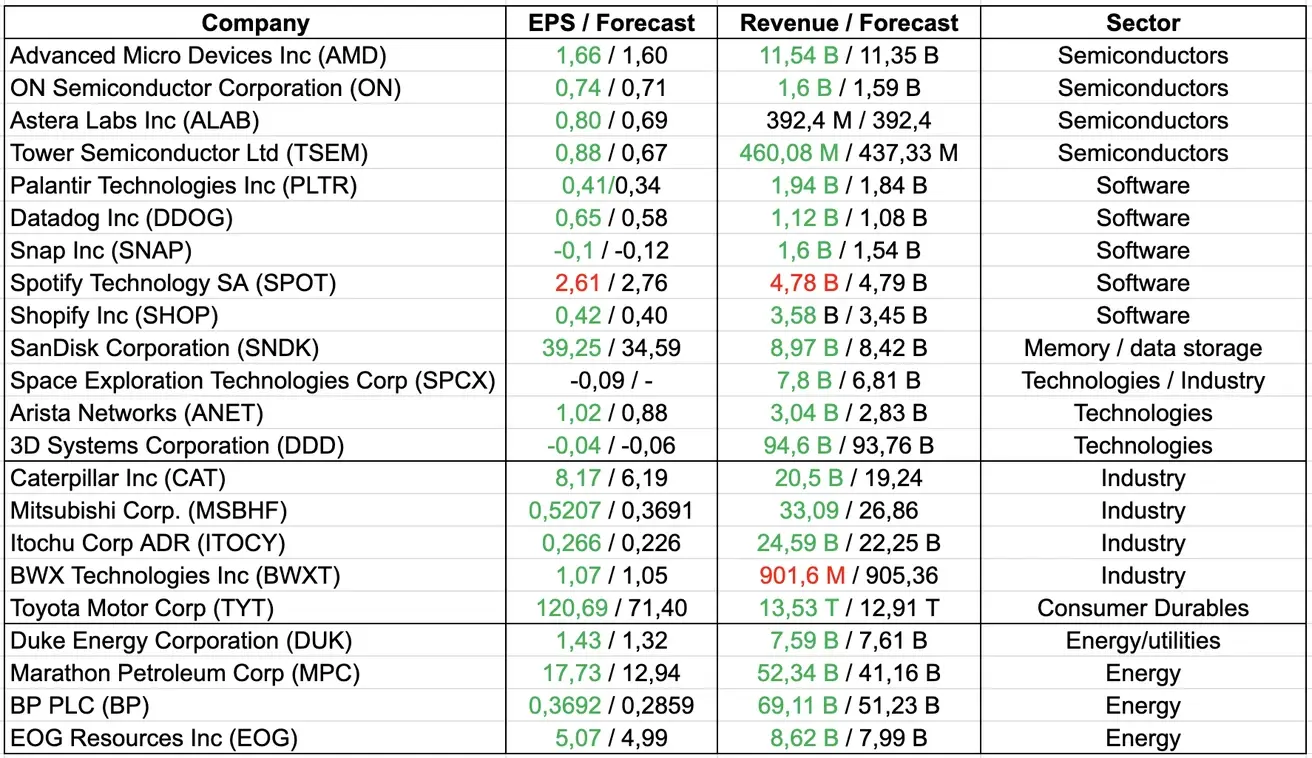
Overall, the sample points to a confidently positive earnings picture. Most companies beat expectations on earnings and/or revenue, with strong results fairly broadly distributed across sectors — from semiconductors and software to industrials and energy. Palantir, SanDisk, Arista Networks, Caterpillar, Marathon Petroleum, and BP stand out in particular. In the tech segment, AMD also topped forecasts on both key metrics. For a number of companies, the deviation from estimates was minimal. On the whole, the sample confirms that earnings season continues to hold a strong tone so far.
Key takeaways from SpaceX management's commentary:
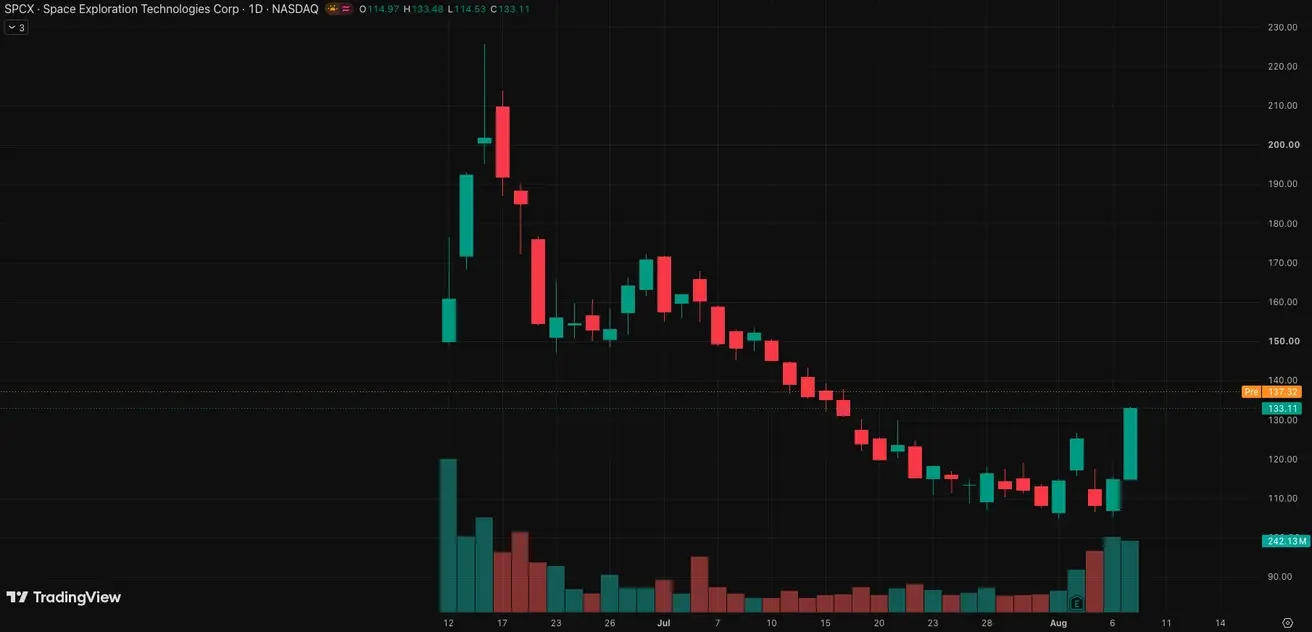
- Starlink remains the key source of profit. The enterprise and government segments are growing faster than the consumer business; management expects them to potentially overtake it over time.
- The main near-term driver is Starlink V3. The new satellites should deliver roughly a 10x increase in throughput, with a meaningful improvement in service quality expected once the constellation reaches roughly 1,000 satellites — targeted for around Q2 2027.
- Starlink Mobile is viewed as a separate, large-scale business. Launches of the next-generation satellites are planned for 2027, with commercial service expected closer to year-end. The company intends to combine satellite coverage with its own terrestrial network.
- Starship is approaching commercial operation. Management believes the heat shield issue has largely been resolved. The next milestones are tower-catch recovery of the ship, an increased launch cadence, and a move to roughly daily flights within about a year.
- AI is becoming a primary driver of both revenue growth and capex. The company expects more than 2 GW of compute capacity by the end of 2026, rising to closer to 10 GW by the end of 2027, though the power infrastructure is being designed with headroom for 15–20 GW.
- The company is fully committed to NVIDIA Vera Rubin. About 10% of compute capacity is planned for training Grok, with the bulk directed toward inference and leasing to third-party customers.
- Demand for AI compute is described as extremely high. Management said new investment in compute infrastructure can pay back in under a year; additional six-month contracts worth $6.7 billion were already signed at the start of Q3.
- Capex is set to remain very high. The next two quarters are likely to be comparable to Q2 — around $18 billion per quarter, predominantly for AI infrastructure.
- Management's guidance is extremely aggressive. The company expects to reach an annualized revenue run rate above $100 billion by December 2026, and has pulled forward its internal target of $1 trillion in revenue from 2031 to 2030, with a non-zero probability of hitting it in 2029.
- Main investment takeaway: management's commentary reinforced the bullish case on Starlink and AI growth, while also confirming the business's high capital intensity, its dependence on rapid buildout of new capacity, and management's very optimistic long-term assumptions.
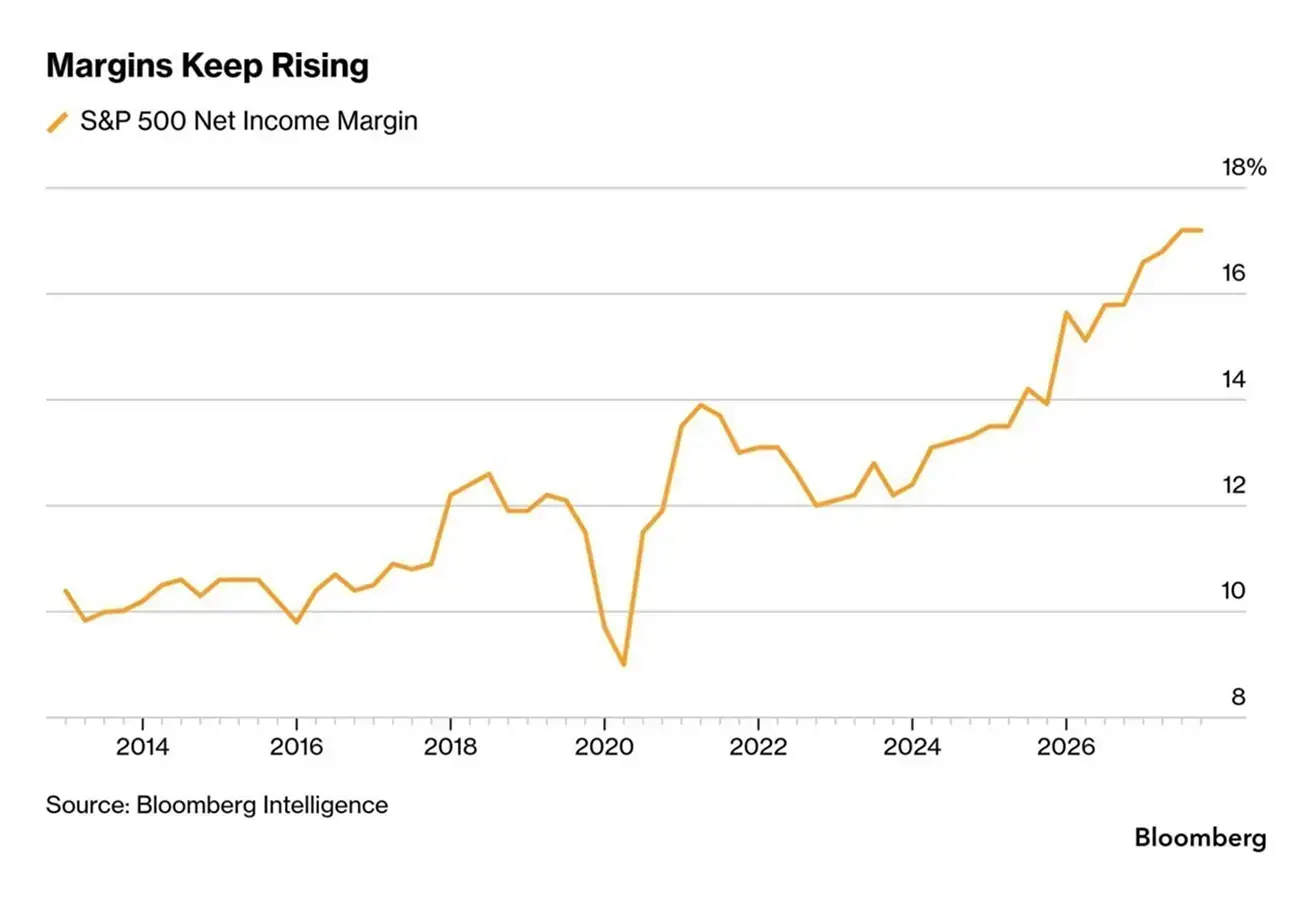
The net margin of S&P 500 companies continues to climb and, per Bloomberg Intelligence's chart, is now approaching 17%.
Bloomberg points to the first quantitative evidence that AI adoption is beginning to lift corporate profitability directly, through productivity gains and cost reduction. According to 22V Research, the 25 S&P 500 companies that have quantified the AI effect are seeing an average benefit of roughly +180 bps to margin. Excluding cases where AI is bundled together with other efficiency measures, the effect comes to around +150 bps.
Importantly, the effect is showing up outside the technology sector as well — examples include companies in waste management, industrial equipment, and insurance. In other words, the second stage of the AI cycle is starting to come through: after the enormous infrastructure buildout, AI is gradually shifting from a capex line item into a tool for lifting productivity across the corporate sector.
That said, in fairness, AI does not appear to be the main driver of the broad rise in S&P 500 margins: the 22V sample covers only 25 companies, and the index's elevated aggregate profitability still depends heavily on the largest technology names. Goldman Sachs, for instance, notes that the median S&P 500 company's ROE has actually declined in recent years.
Bond Market
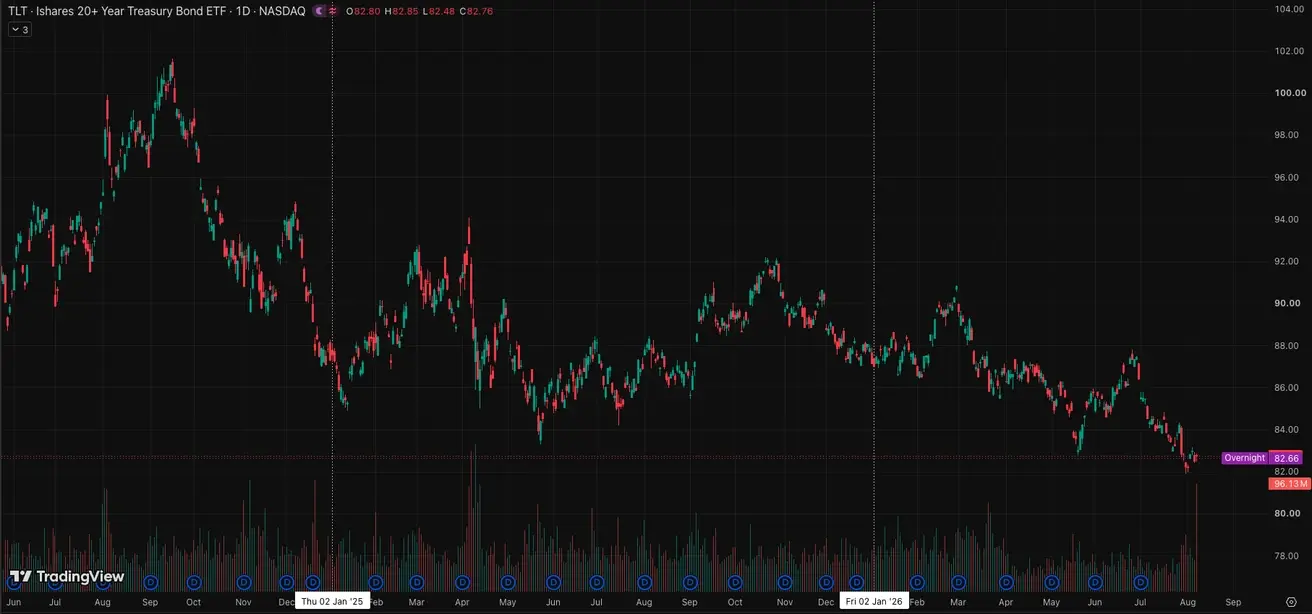
U.S. Treasury Bonds 20+ Years (TLT ETF): +0,62% for the week (weekly close: 82,76); -5,05% year-to-date.
Yields and Spreads
- Market Yield on U.S. Treasury Securities at 10-Year Constant Maturity: 4.66% (previous: 4.70%);
- 2-Year U.S. Treasury Yield: 4.57% (previous: 4.25%);
- ICE BofA BBB US Corporate Index Effective Yield: 5.57% (previous: 5.68%).
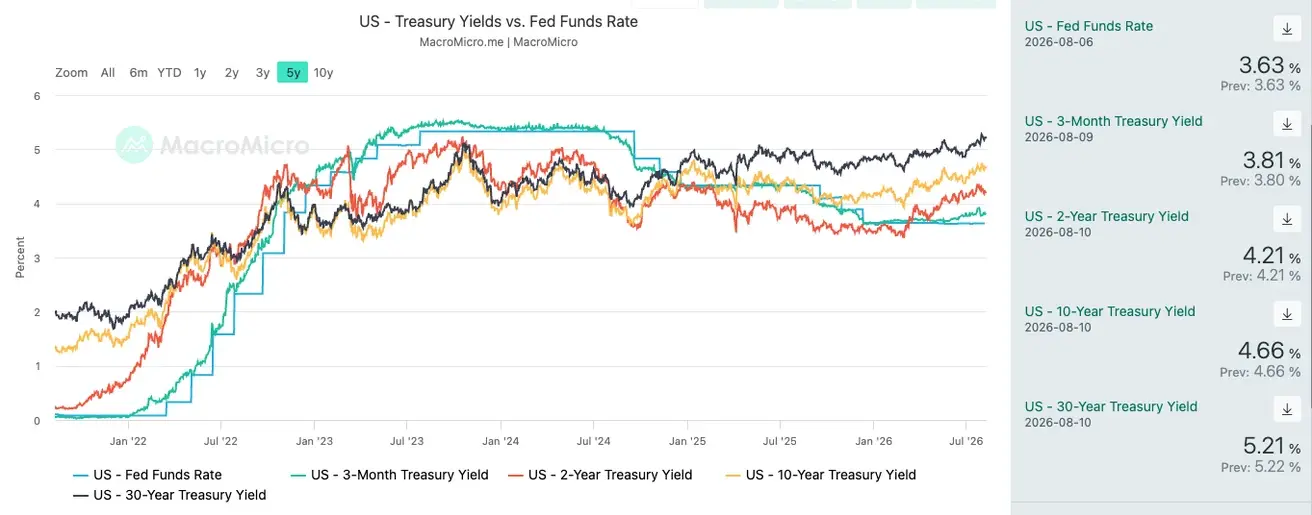
- The yield spread between 10-year and 2-year U.S. Treasury securities stands at 45 basis points (previous: 45 bps);
- The yield spread between 10-year and 3-month U.S. Treasury securities stands at 85 basis points (previous: 92 bps).
U.S. Treasury Yield Curve
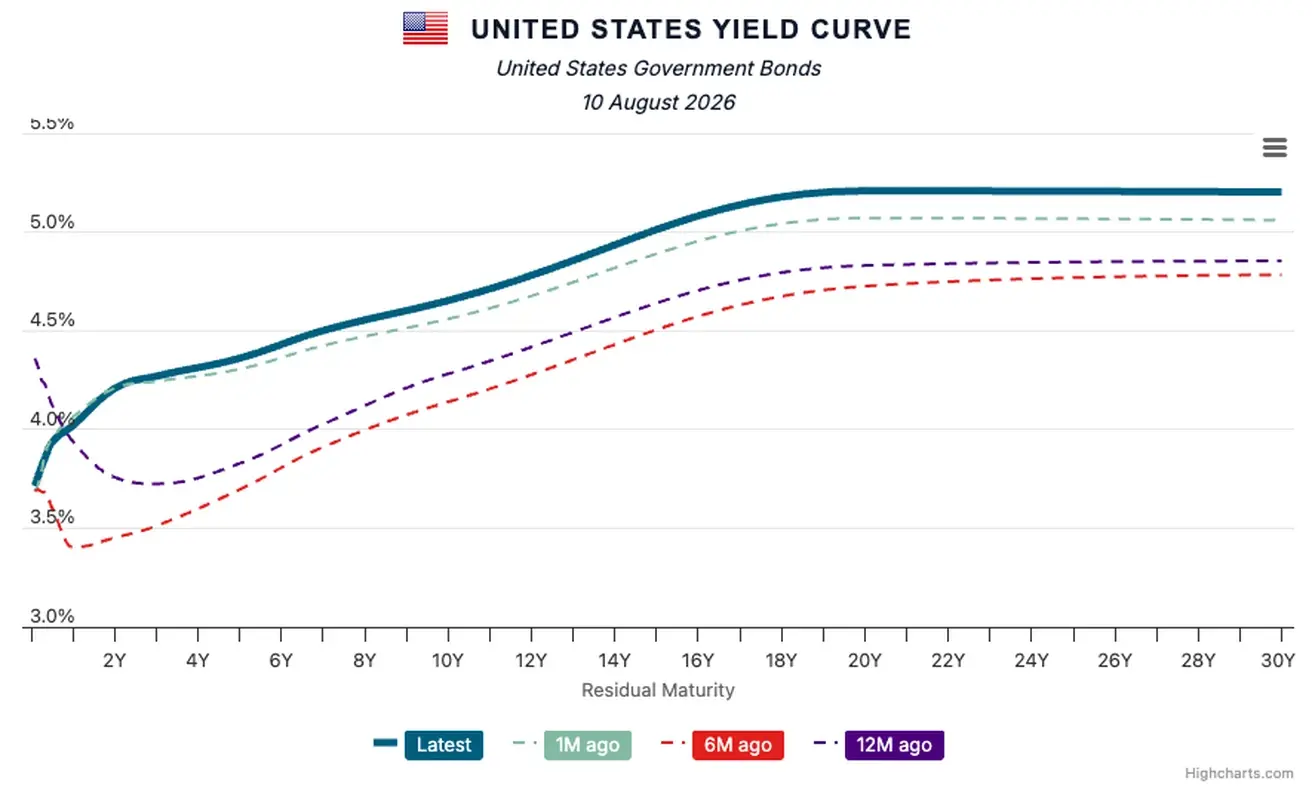
The cost of a 5-year U.S. Credit Default Swap (CDS) — a market-based measure of sovereign default insurance — 35.98 basis points, compared with 35.96 basis points a week earlier.
Eurozone
- The ECB raised interest rates, while maintaining a hawkish stance as inflationary risks continue to increase;
- Against the backdrop of the conflict in the Middle East, the ECB revised its GDP forecasts downward and raised its inflation projections for the coming years.
Commentary
Key points from the "ECB Economic Bulletin, Issue 5, 2026":
- The ECB left rates unchanged and reaffirmed that it will continue to make decisions on a meeting-by-meeting basis, guided by incoming data, with no pre-set rate path;
- Inflation has eased, but the energy shock and geopolitical uncertainty continue to pose upside risks to a renewed acceleration. The ECB believes the full impact of higher energy prices has yet to feed through;
- The eurozone economy is showing a moderate recovery, supported by the services sector, digital technologies, investment, and government spending, though the growth outlook remains subdued amid elevated uncertainty;
- The balance of risks remains cautious: risks to growth are tilted to the downside, while risks to inflation are tilted to the upside, which for now does not provide convincing grounds for a swift easing of monetary policy.
Interest Rates
- Deposit Facility Rate: 2.25% (previous: 2.0%);
- Marginal Lending Facility Rate: 2.65% (previous: 2.4%) — the rate at which banks can obtain overnight funding from the central bank;
- Main Refinancing Rate (Policy Rate): 2.40% (previous: 2.15%).
Inflation: Consumer Price Index (CPI) (July)
- Core CPI (YoY): 2.5% (previous: 2.4%);
- Headline CPI: 2.8% (MoM) (previous: -0.1%); 2.9% (YoY) (previous: 2.8%).
GDP (Q2 2026 Preliminary Estimate)
- QoQ: 0.4% (previous: -0.2%);
- YoY: 1.0% (previous: 0.3%).
Unemployment Rate (June)
- 6.3% (previous: 6.3%).
Industrial Production (June)
- MoM: 0.1% (previous: 0.9%);
- YoY: 1.67% (previous: 1.37%).
Purchasing Managers' Index (PMI) (May)
- Services PMI: 51.6 (previous: 49.4);
- Manufacturing PMI: 52.0 (previous: 51.4);
- S&P Global Composite PMI: 51.9 (previous: 50.0).
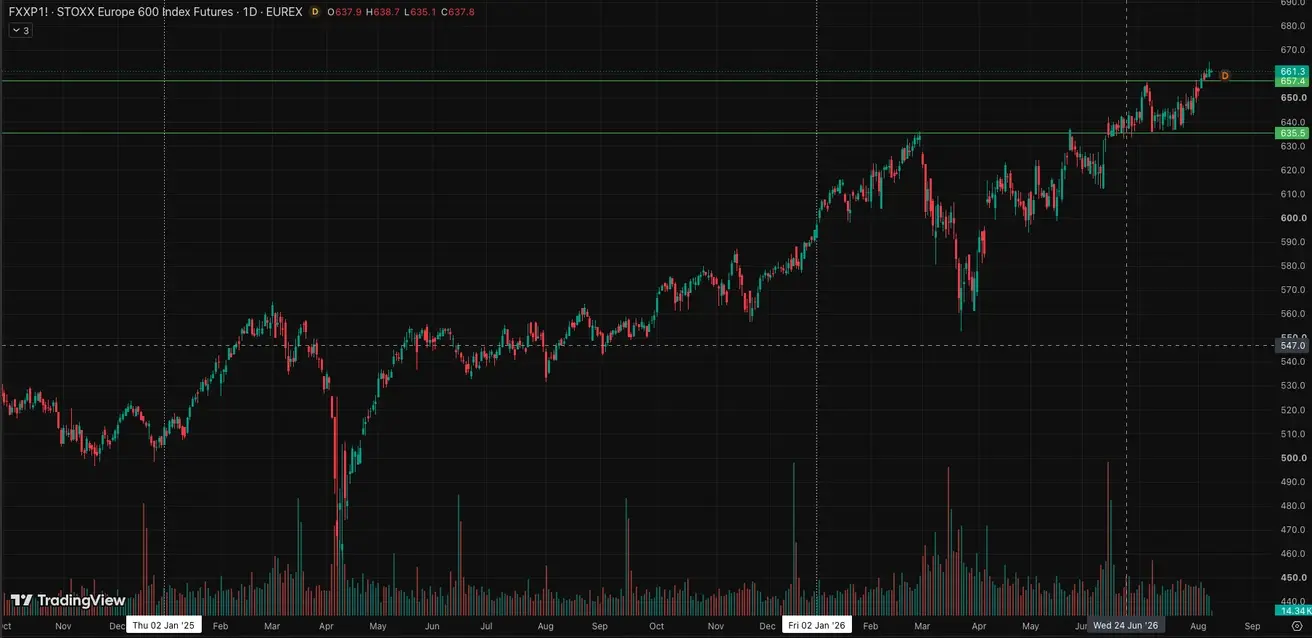
Euro Stoxx 600 (FXXP1!)
Weekly performance: +1,78% (week-end close: 661,9); year-to-date: +11,43%.
China
China's economy continues to stabilize, supported by strong export performance, while domestic demand and investment are gradually recovering. Policymakers remain measured and targeted in their approach to economic stimulus.
- Interest rates remain unchanged;
- Monetary policy remains accommodative;
- China reaffirmed its commitment to fiscal support for economic growth under its 2026 plan, including measures to stimulate domestic demand, optimize tax incentives and subsidies, and modernize industrial capacity.
Interest Rates
- 1-Year Loan Prime Rate (medium-term lending): 3.00%;
- 5-Year Loan Prime Rate (benchmark for mortgage lending): 3.50%.
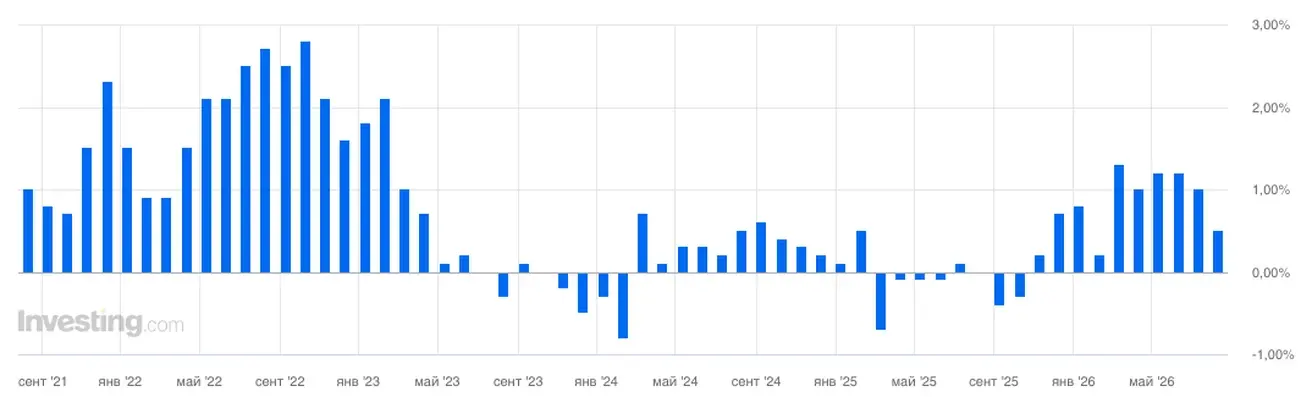
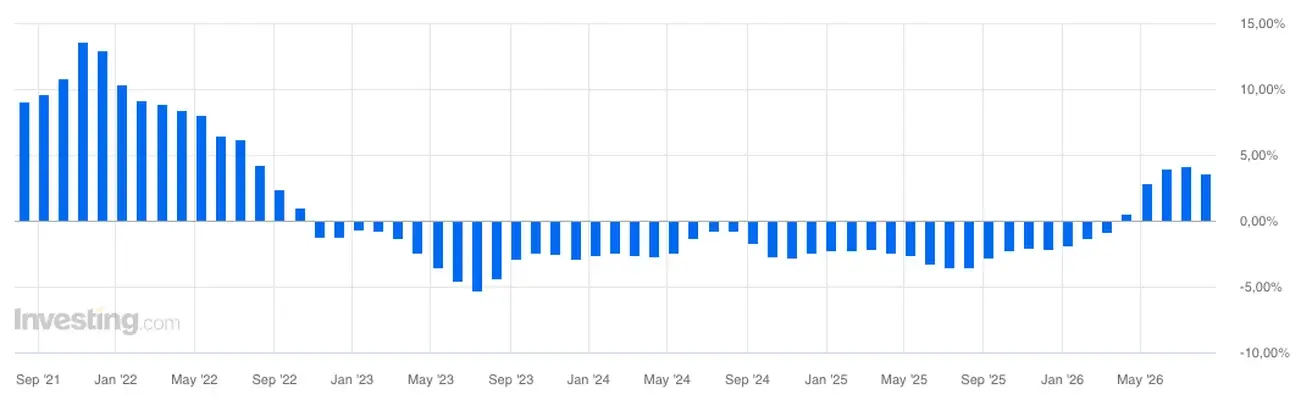
Inflation Indicators (July)
- Consumer Price Index (CPI): -0.1% MoM (previous: -0.3%); 0.5% YoY (previous: 1.0%);
- Producer Price Index (PPI): 3.5% YoY (previous: 4.1%).
Trade Data
- Imports (June): 27.5% YoY (previous: 36.0%);
- Exports (June): 23.9% YoY (previous: 27.0%);
- Trade Balance (USD) (July): $112.5 billion (previous: $125.62 billion).
GDP (Q2 2026)
- QoQ: 0.9% (previous: 1.3%);
- YoY: 4.3% (previous: 5.0%).
Labor Market
- Unemployment Rate (June): 5.0% (previous: 5.1%).
Industrial Activity
- Industrial Production (June, YoY): 5.3% (previous: 4.5%).
Fixed Asset Investment
- June, YoY: -5.7% (previous: -4.1%).
Retail Sales
- June, YoY: 0.9% (previous: 1.3%).
Purchasing Managers' Indices (PMI) (May)
- Manufacturing PMI: 49.2 (previous: 50.3);
- Non-Manufacturing PMI: 49.0 (previous: 50.2);
- Composite PMI: 49.3 (previous: 50.6).
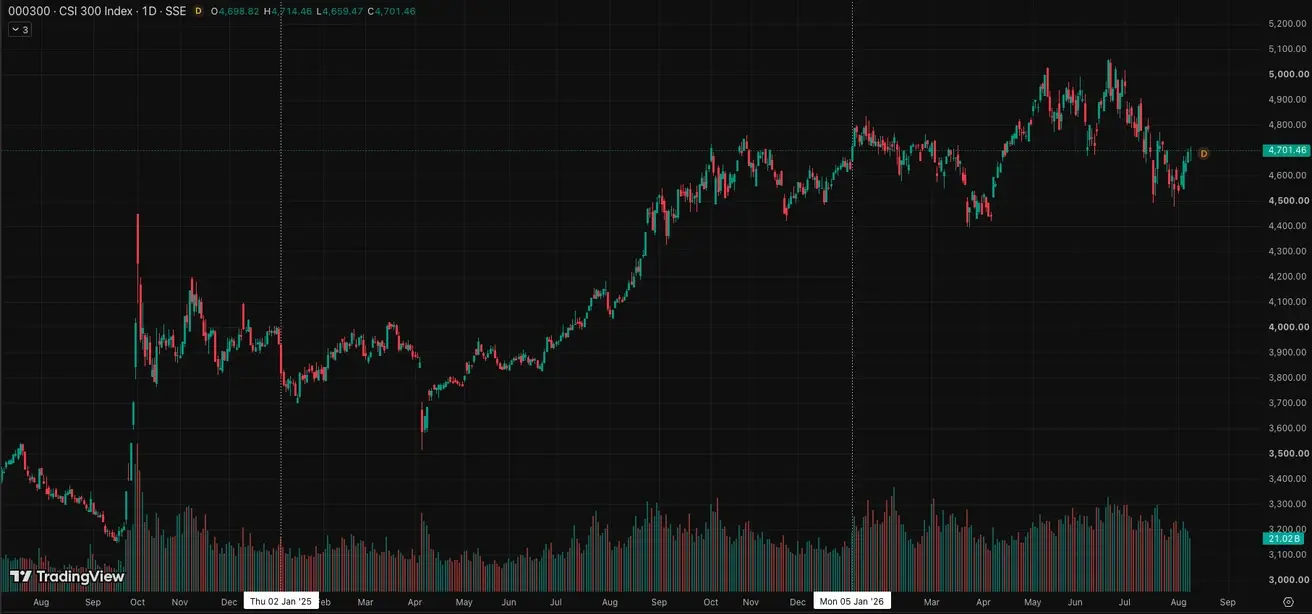
CSI 300 Index (000300.HK)
Weekly performance: +2,32% (week-end close: 4694,44); year-to-date: 0,70%.
Gold Futures (GC)
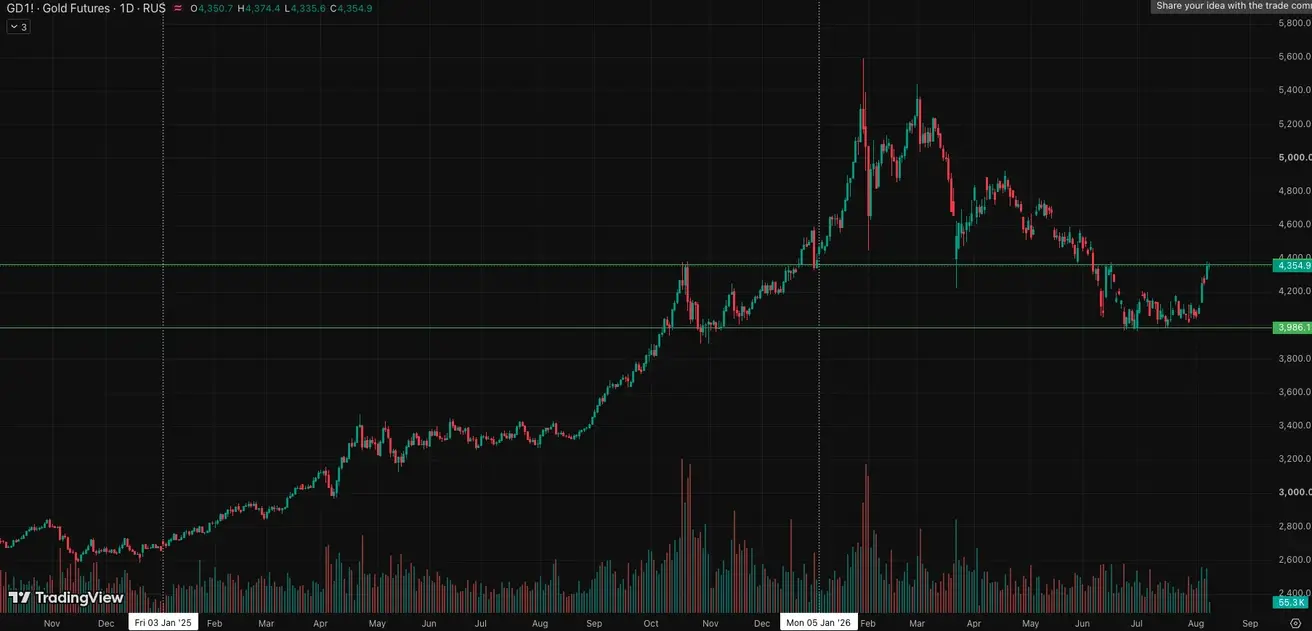
Weekly performance: +7,07% (week close: $4355,3 per troy oz); year-to-date: +0,54%
Oil Futures
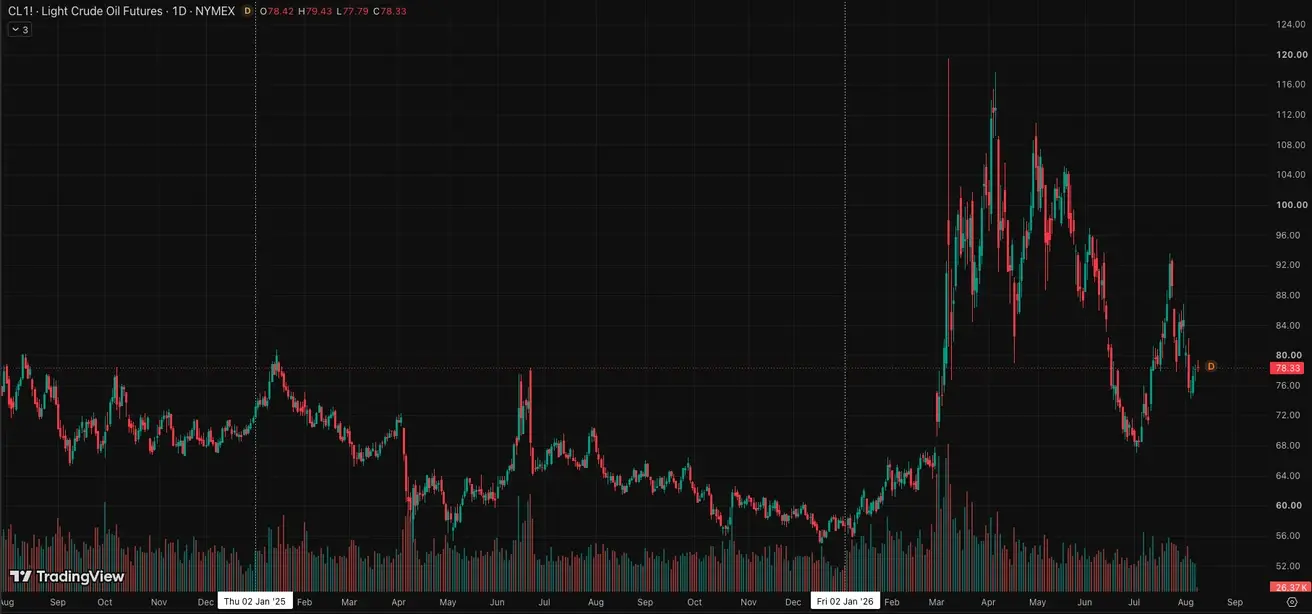
Weekly performance: -7,67% (week close: $78,18 per barrel); year-to-date: +36,18%
Dollar Index Futures (DX)
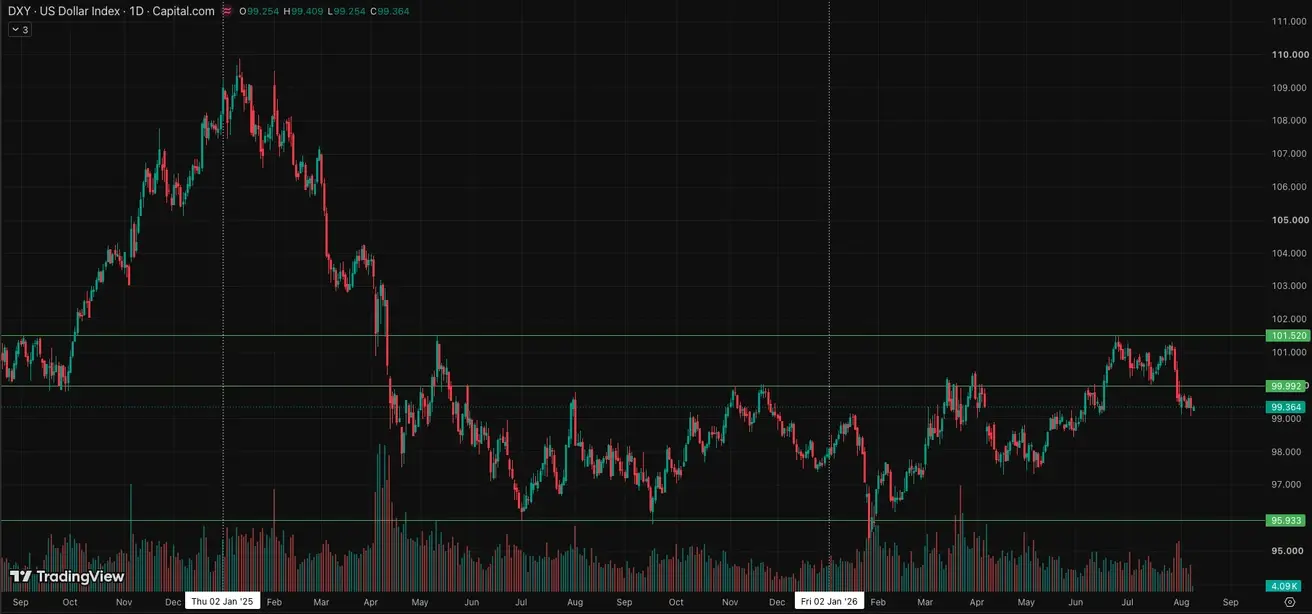
Weekly performance: -0,18% (week close: 99,341); year-to-date: +1,37%.
BTC Futures
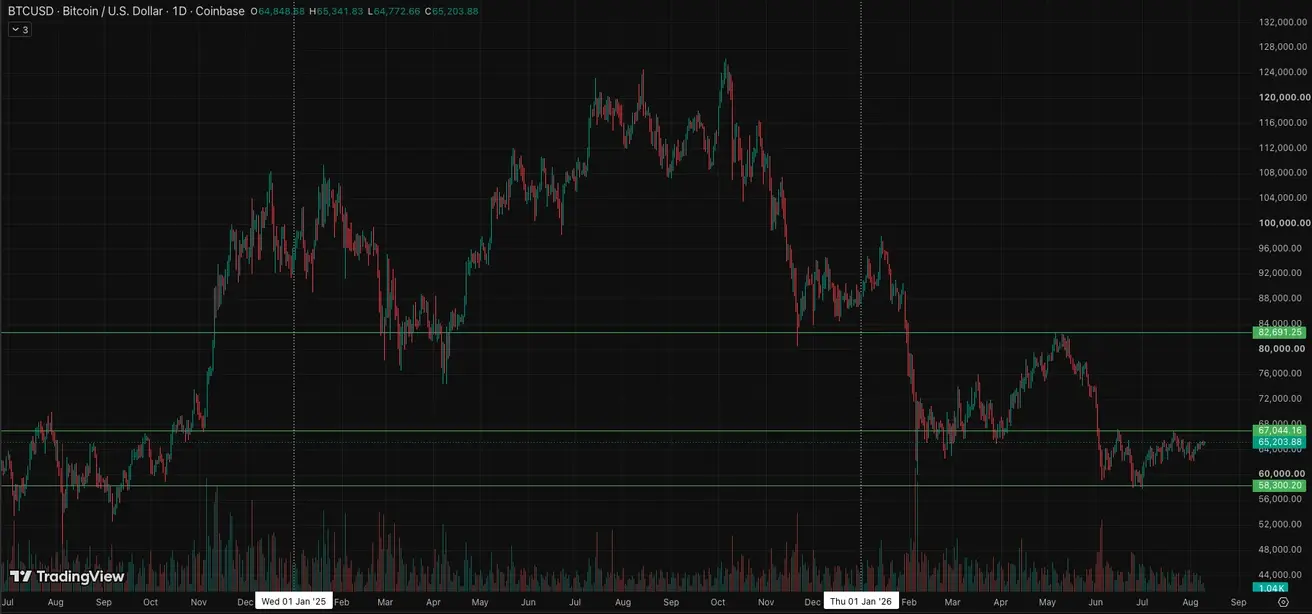
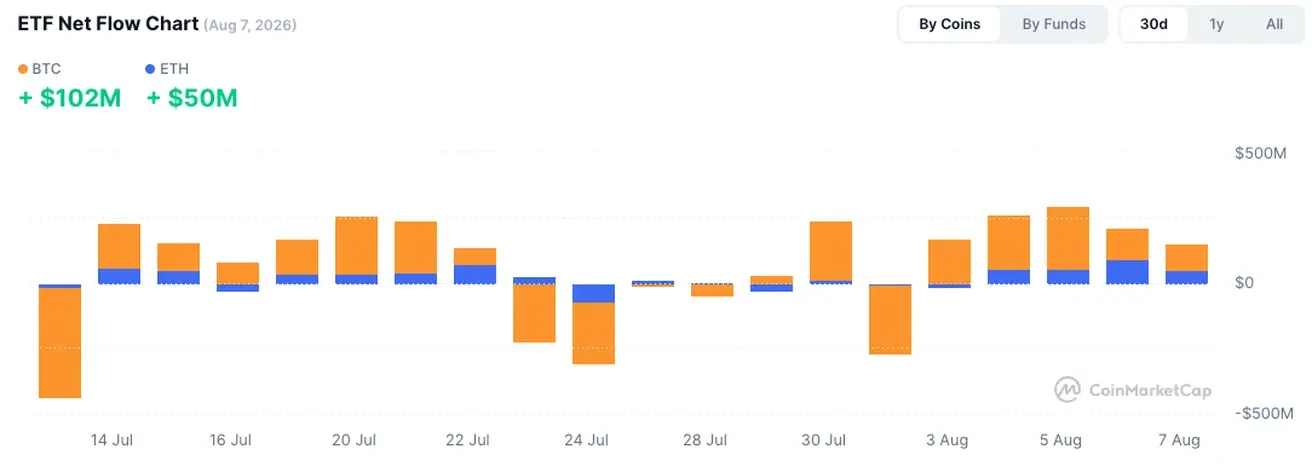
Weekly performance: +2,12% (week close: $64848,69); year-to-date: -26,07%.
ETH Futures
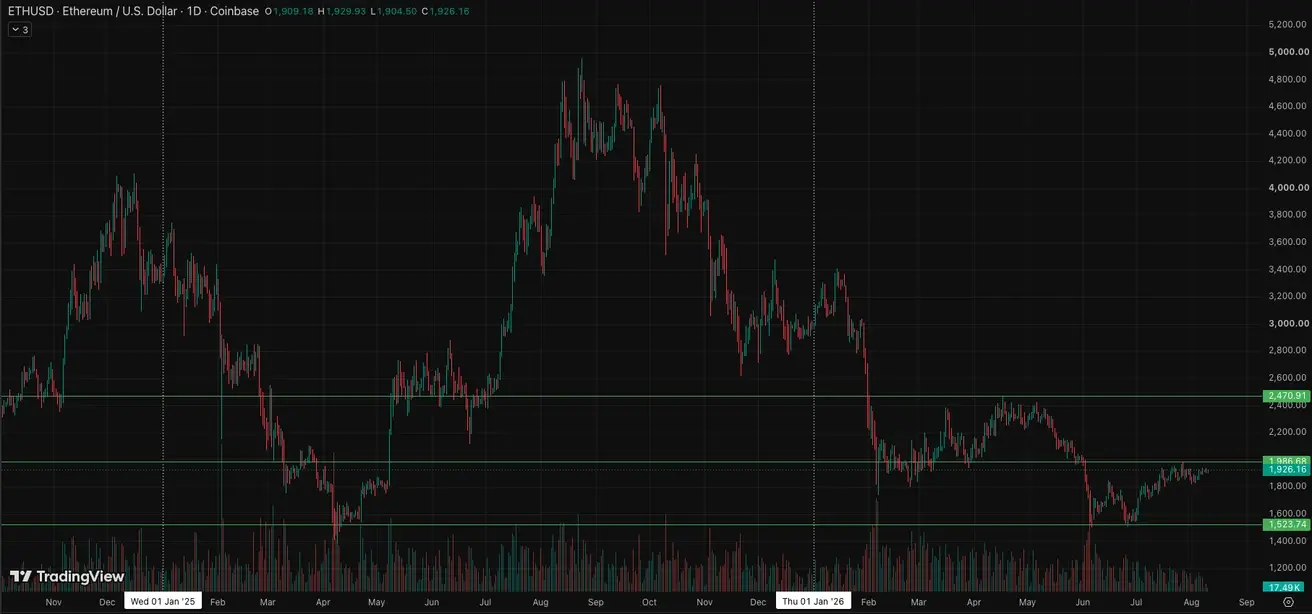
Weekly performance: +1,37% (week close: $1909,09); year-to-date: -35,81%.
Total Cryptocurrency Market Capitalization
Total crypto market capitalization: $2,22 trillion (vs $2,15 trillion a week earlier) (coinmarketcap.com).
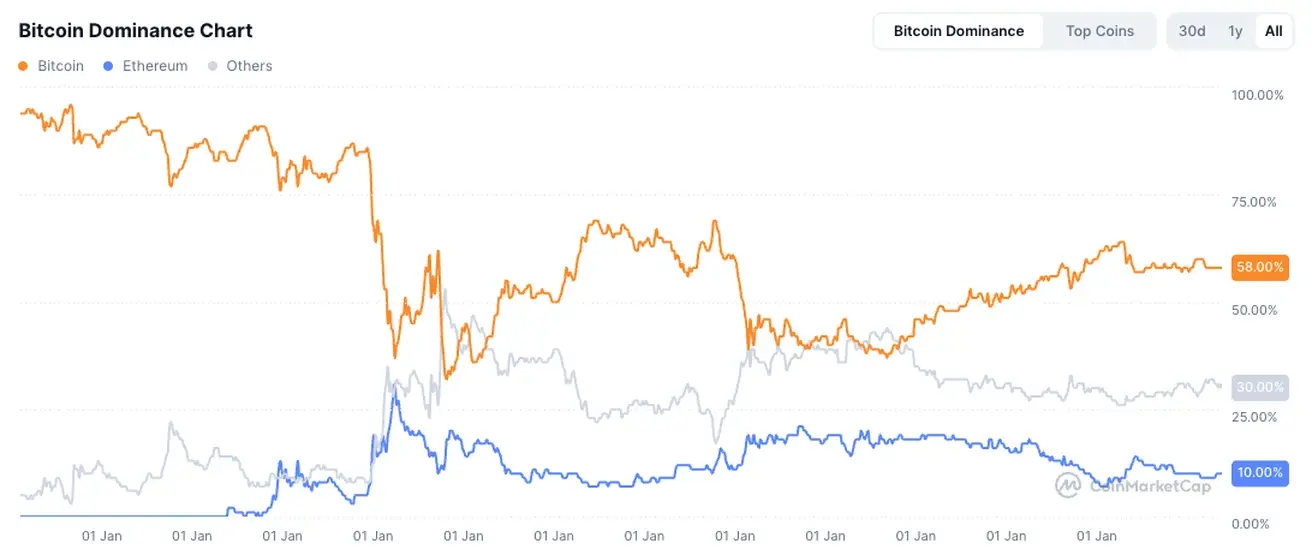
Crypto asset market shares:
- Bitcoin 58,9% (prev. 58,4%)
- Ethereum 10,4% (prev. 10,3%)
- Others 30,7% (prev. 31,3%)