Русский
 Қазақша
 Eesti
EestiAugust 24 – August 30, 2026: Weekly economic update
Key market updates

Key Takeaways:
- The policy rate remains unchanged, while the Fed's rhetoric remains cautious;
- Monetary policy remains moderately restrictive;
- U.S. macroeconomic data continue to support a soft-landing scenario: inflation risks are increasing, the labor market is cooling without signs of recession, and current conditions do not yet warrant a rate cut.
The core takeaway from Warsh's Jackson Hole speech: the Fed is turning noticeably tougher on inflation and less willing to "walk the market by the hand" through forward guidance.
- A more hawkish rate signal. Warsh signaled that a rate hike is genuinely back on the table if upcoming data doesn't show convincing progress toward the inflation target. The Fed needs to be confident that core inflation is moving toward target clearly and quickly enough — otherwise, "we have work to do." So this isn't a direct promise of a hike, but the narrative is clear: by default, the Fed is no longer willing to tolerate above-target inflation.
- Inflation is the main risk. Warsh acknowledged that the labor market looks stable and output is fairly solid, but inflation is still too high. That's a key emphasis: as long as the economy doesn't look weak, the Fed can afford to be tougher.
- "Less forward guidance." Warsh again pushed the idea of a "quieter Fed" — giving markets less advance signaling on the rate path and feeding them fewer forecasts. He said markets shouldn't look to the Fed as the main source of "the next trade," or else you get a "hall of mirrors" effect: the market watches the Fed, the Fed watches the market, and everyone loses sight of the actual changes happening in the economy.
- Data matters more than promises. He didn't commit to a September decision, but he clearly raised the weight of upcoming data — inflation and the labor market above all. That's why markets read the speech as a shift toward a possible rate hike.
- AI and financial innovation are an important backdrop, but not a substitute for the inflation target. Warsh also talked about AI, productivity, and financial innovation, and how they could reshape the economy. But the overall takeaway wasn't "AI will save the day, so we can relax." If anything, it was the opposite: the Fed needs to better understand these new data sources, investment flows, and financial conditions, but the inflation target remains the anchor.
Summary: The Fed didn't promise to raise rates, but it did raise the bar for keeping rates unchanged. The main signal: if inflation doesn't show convincing deceleration, the Fed is ready to act. At the same time, Warsh continues to build a new communication model — less forward guidance, more emphasis on data, and more responsibility placed on markets for their own expectations.
Inflation: Consumer Price Index (July)
- Core CPI (MoM): 0.2% (previous: 0.0%).
- Core CPI (YoY): 2.5% (previous: 2.6%).
- CPI (MoM): 0.1% (previous: -0.4%).
- CPI (YoY): 3.4% (previous: 3.5%).
Producer Price Index (July)
- PPI (MoM): 0.0% (previous: -0.3%).
- Core PPI (MoM): 0.2% (previous: 0.2%).
Inflation Expectations (Michigan) (August)
- 12-month Inflation Expectations: 4.30% (previous: 4.2%).
- 5-Year Inflation Expectations: 3.3% (previous: 3.3%).
Core Fed inflation gauge: Personal Consumption Expenditures price index (July):
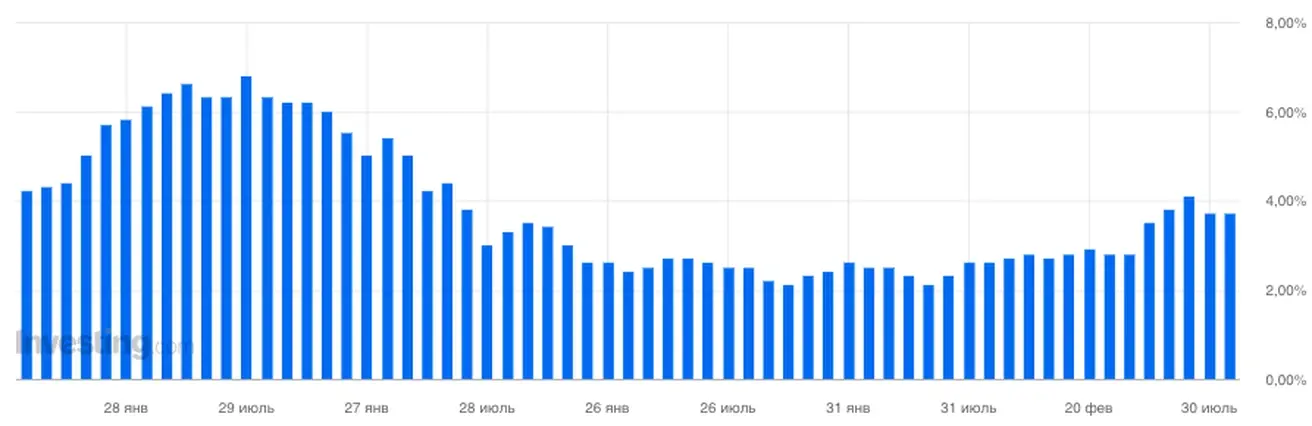
Core index (MoM): 0.2% (prior: 0.1%); (YoY) 3.3% (prior: 3.3%)
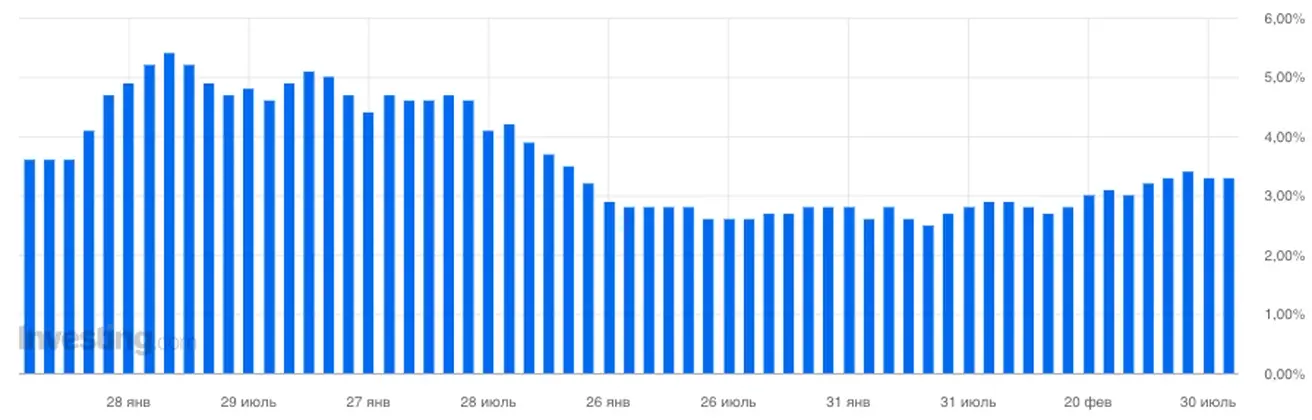
Headline (MoM): 0.2% (prior: -0.1%); (YoY): 3.7% (prior: 3.7%)
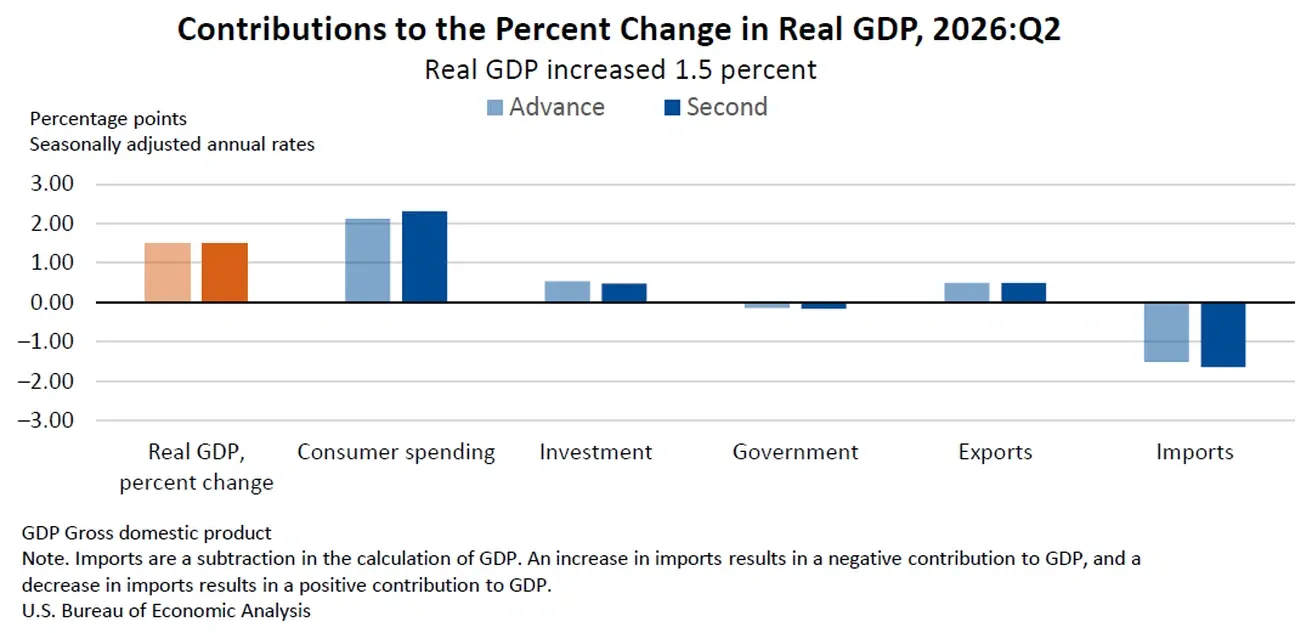
GDP (U.S. Bureau of Economic Analysis, BEA) — Q2 2026 annualized growth rate, preliminary: +1.5% (Q1 2026: +2.1%); forecast: 1.5%
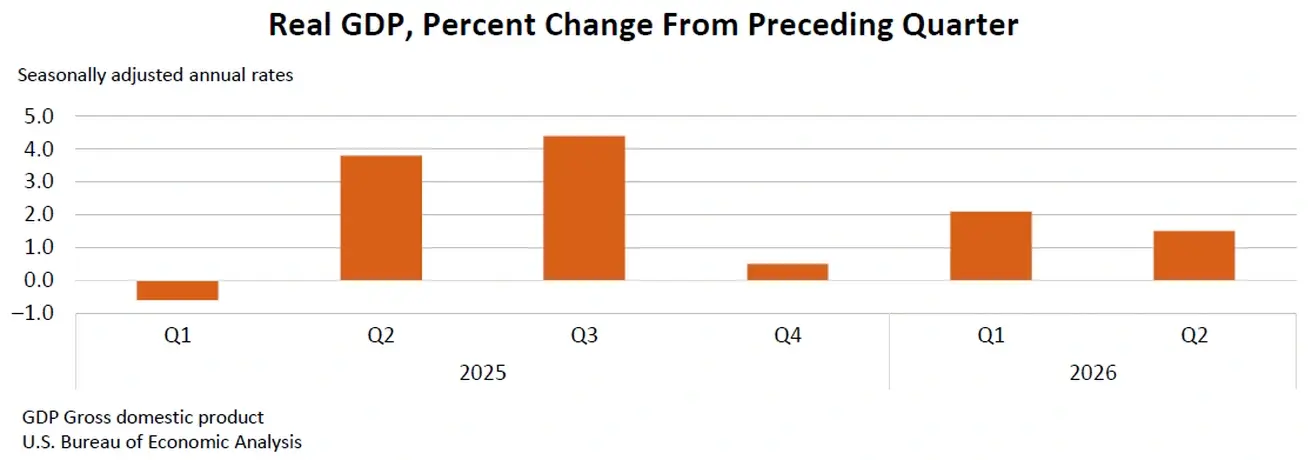
Compared with the first quarter, the slowdown in real GDP growth in the second quarter reflected a decline in government spending and a slowdown in investment and exports, partially offset by faster consumer spending. Imports rose more in the second quarter than in the first. Real final sales to private domestic purchasers — the sum of consumer spending and gross private domestic investment — rose 4.2 percent in the second quarter, 0.3 percentage points higher than the previous estimate.
US GDP deflator (QoQ): 6.3% (prior: 6.4%)
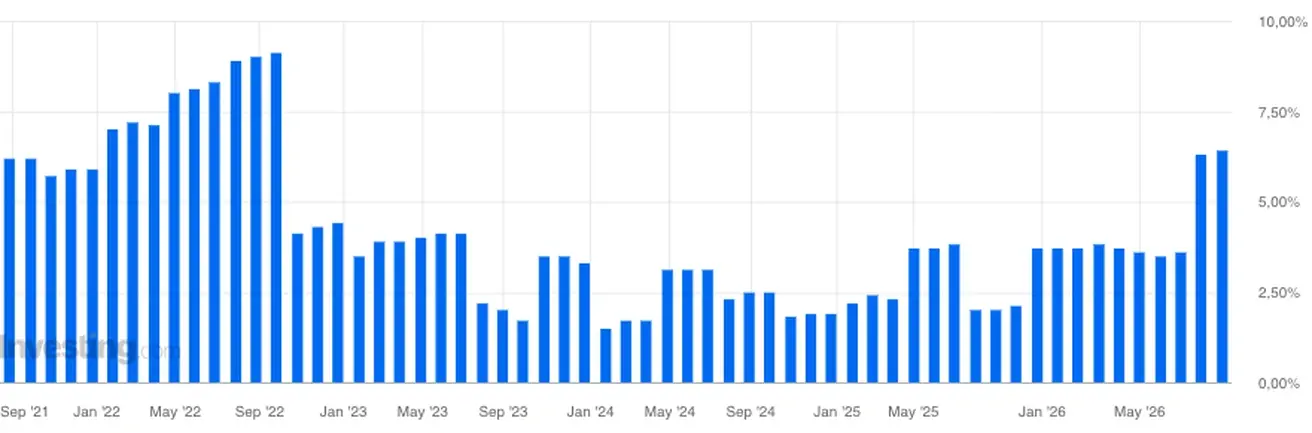
The GDP deflator is much broader than PCE: it captures price changes across all final output produced domestically in the US—consumption + investment + government spending + exports—while excluding imports. That means it can accelerate sharply due to price changes in the investment, government, or export segments, even when consumer inflation is calmer.
Overall, US consumer inflation is stabilizing, but the broad GDP price deflator has stayed elevated for a second straight quarter. This points to continued price pressure outside the consumer sector specifically, and gives the Fed grounds to maintain a cautious stance on rates.
GDPNow (the Atlanta Fed's real-time estimate of official GDP growth ahead of release (Q3 2026)): 4.6% (previous: 4.3%).
Labor Market (BLS) (July)
- Unemployment Rate: 4.1% (previous: 4.2%).
- Continued Jobless Claims: 1.778K (previous: 1.799K).
- Initial Jobless Claims: 203K (previous: 206K).
- Nonfarm Payrolls (NFP): -23K (previous: 57K).
- Private Nonfarm Payrolls: 30K (previous: 49K).
- Average Hourly Earnings (YoY): 3.2% (previous: 3.4%).
- JOLTS Job Openings: 6.866 million (previous: 6.922 million).
Business Activity Index (PMI) (July)
(Above 50 indicates expansion; below 50 indicates contraction)
- Services PMI: 56.8 (previous: 54.6).
- Manufacturing PMI: 53.2 (previous: 53.8).
- Composite PMI: 56.0 (previous: 54.5).
Monetary Policy
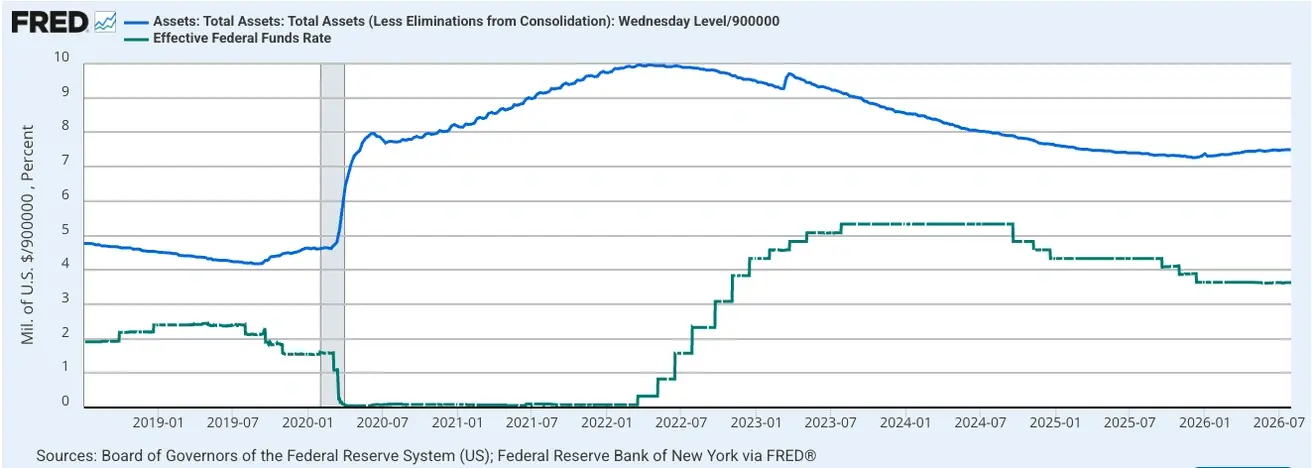
Effective Federal Funds Rate (EFFR): 3.50%–3.75%.
Federal Reserve Balance Sheet: $6.730 trillion, +2.98% since the suspension of quantitative tightening (QT), when the balance sheet stood at $6.535 trillion.
Market Forecast for Rate (FedWatch)
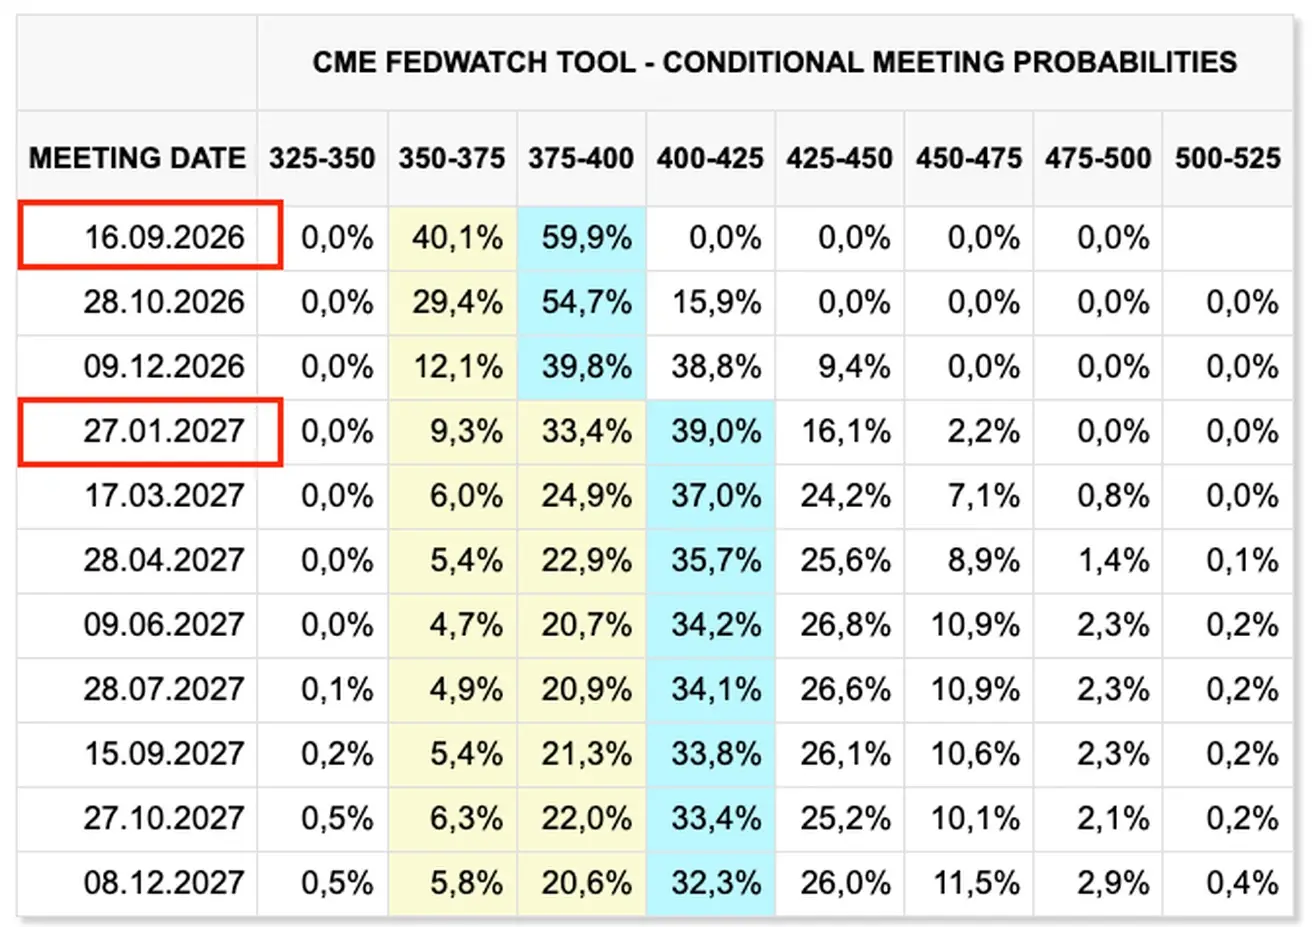
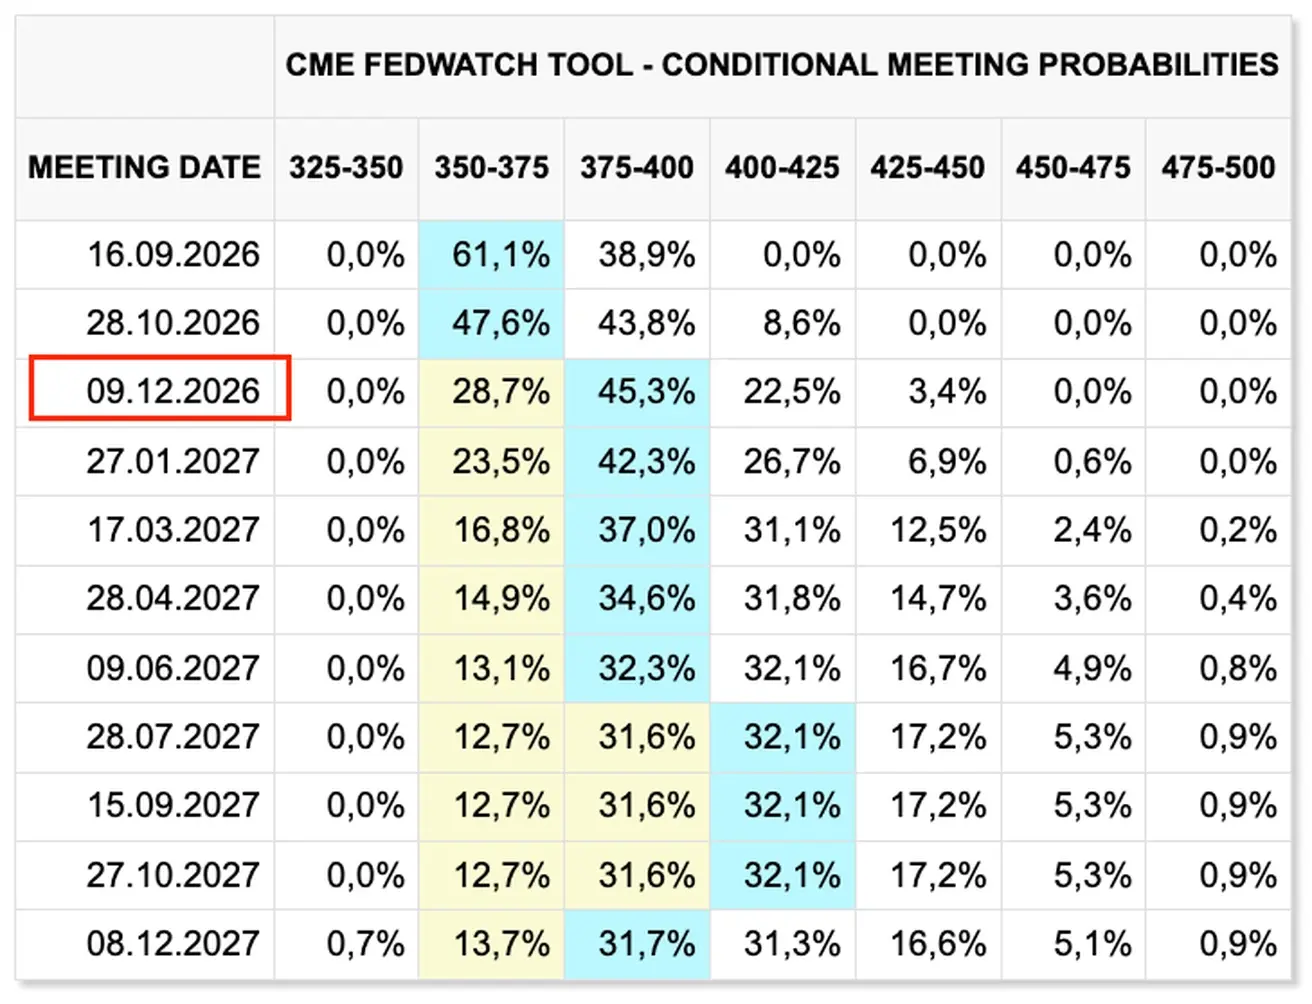
For the next FOMC meeting (September 16) - the implied market probability of a rate hike is 59.8% (week ago: 38.9%; four weeks ago: 64.5%):
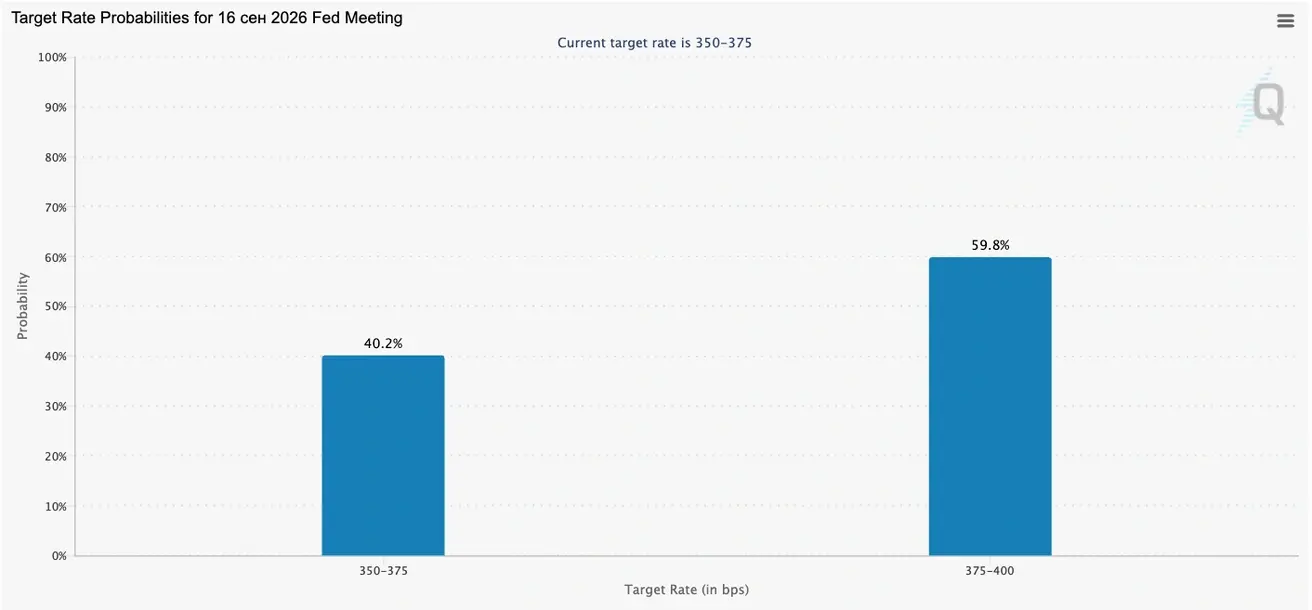
Over the next 12 months, the market now expects two 25-basis-point rate hikes, bringing the target range to 4.00%–4.25% by September of this year and January 2027.
Today:
A week earlier:
Bond Market
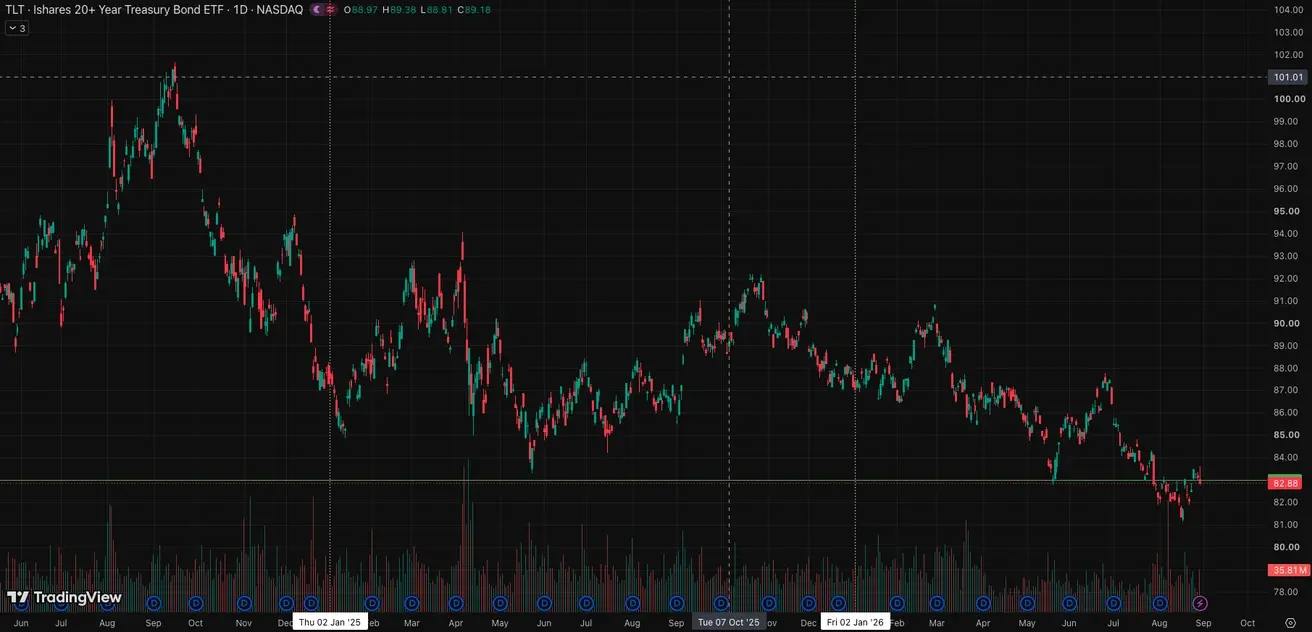
U.S. Treasury Bonds 20+ Years (TLT ETF): +1,01% for the week (weekly close: 82,88); -4,91% year-to-date.
Yields and Spreads
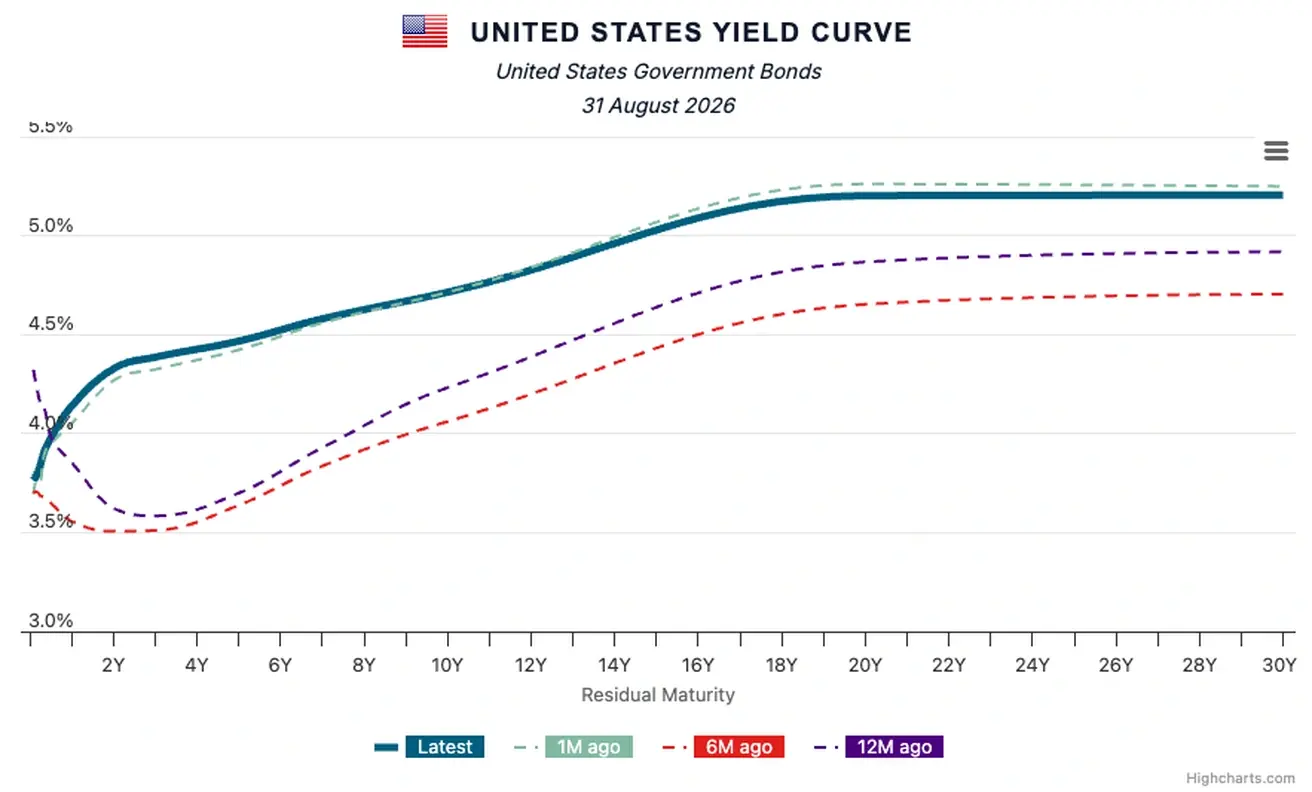
- Market Yield on U.S. Treasury Securities at 10-Year Constant Maturity: 4.73% (previous: 4.71%);
- 2-Year U.S. Treasury Yield: 4.35% (previous: 4.23%);
- ICE BofA BBB US Corporate Index Effective Yield: 5.56% (previous: 5.59%).
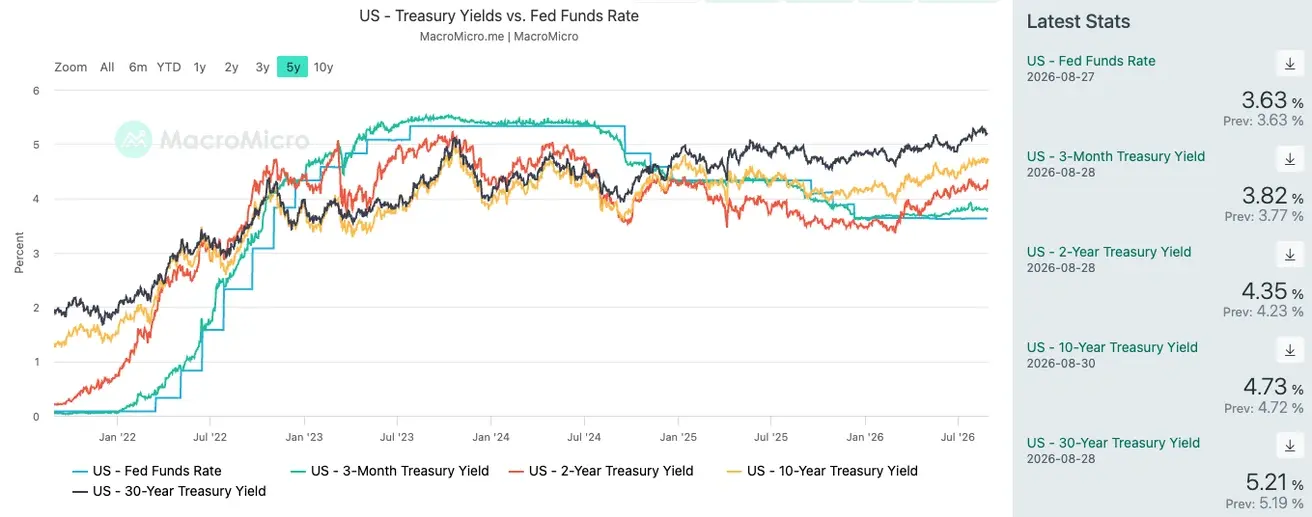
- The yield spread between 10-year and 2-year U.S. Treasury securities stands at 38 basis points (previous: 48 bps);
- The yield spread between 10-year and 3-month U.S. Treasury securities stands at 91 basis points (previous: 90 bps).
U.S. Treasury Yield Curve
The cost of a 5-year U.S. Credit Default Swap (CDS) — a market-based measure of sovereign default insurance — 33.29 basis points, compared with 34.18 basis points a week earlier.
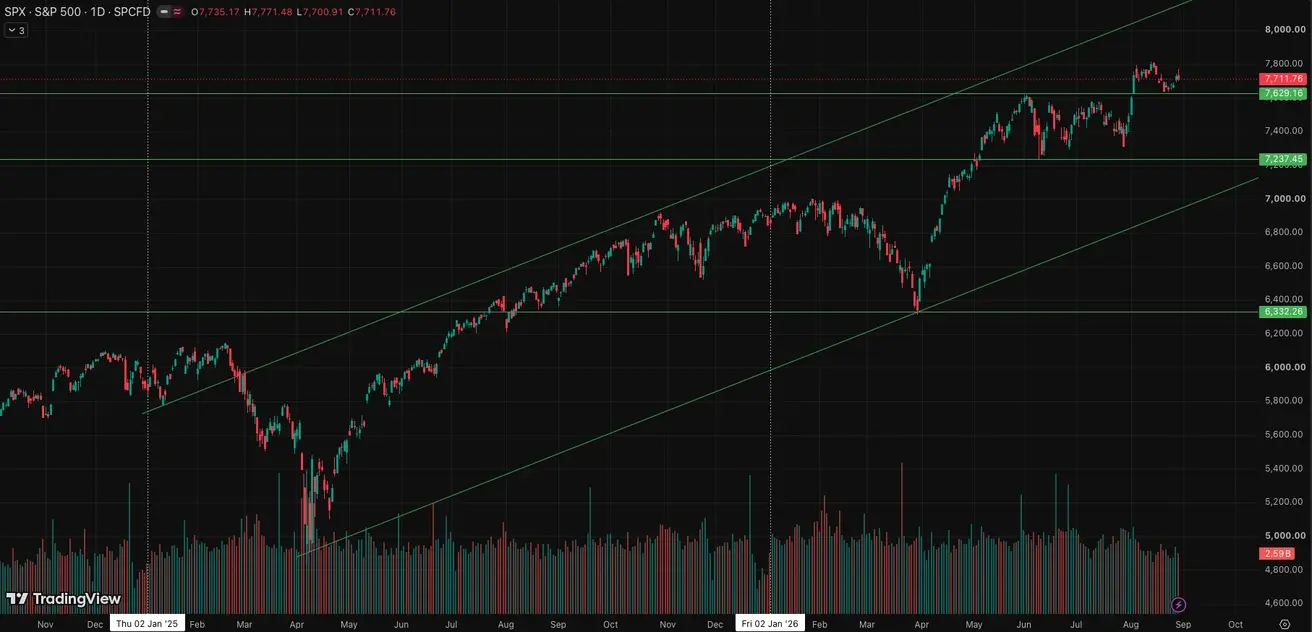
SP500
Weekly performance: +0,49% (week-end close: 7711,76); year-to-date: +12,65%.
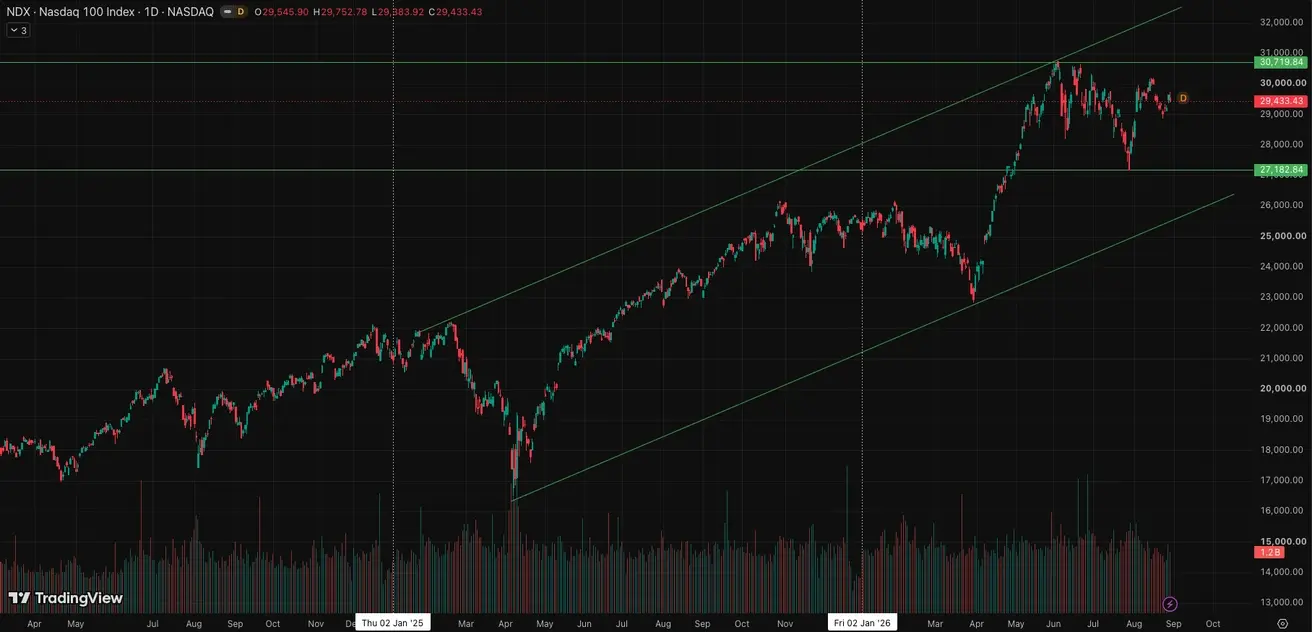
NASDAQ100
Weekly performance: +0,43% (week-end close: 29433,43); year-to-date: +16,57%.
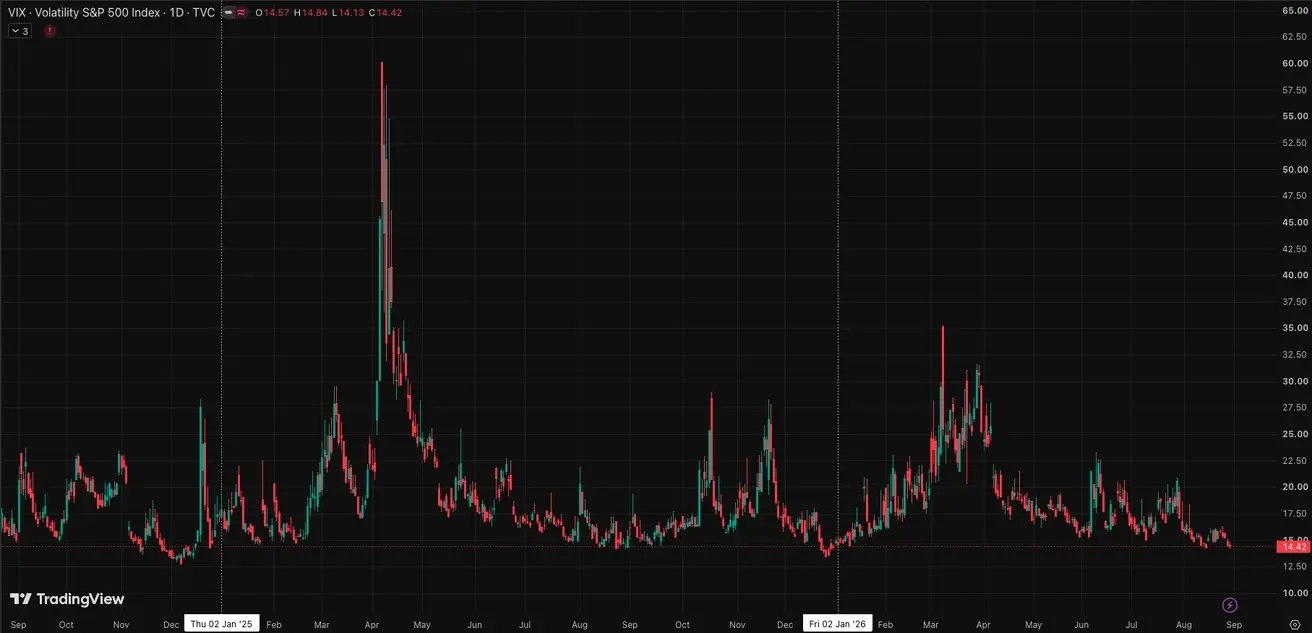
VIX
VIX (volatility index): week-end close at 14,42 points.
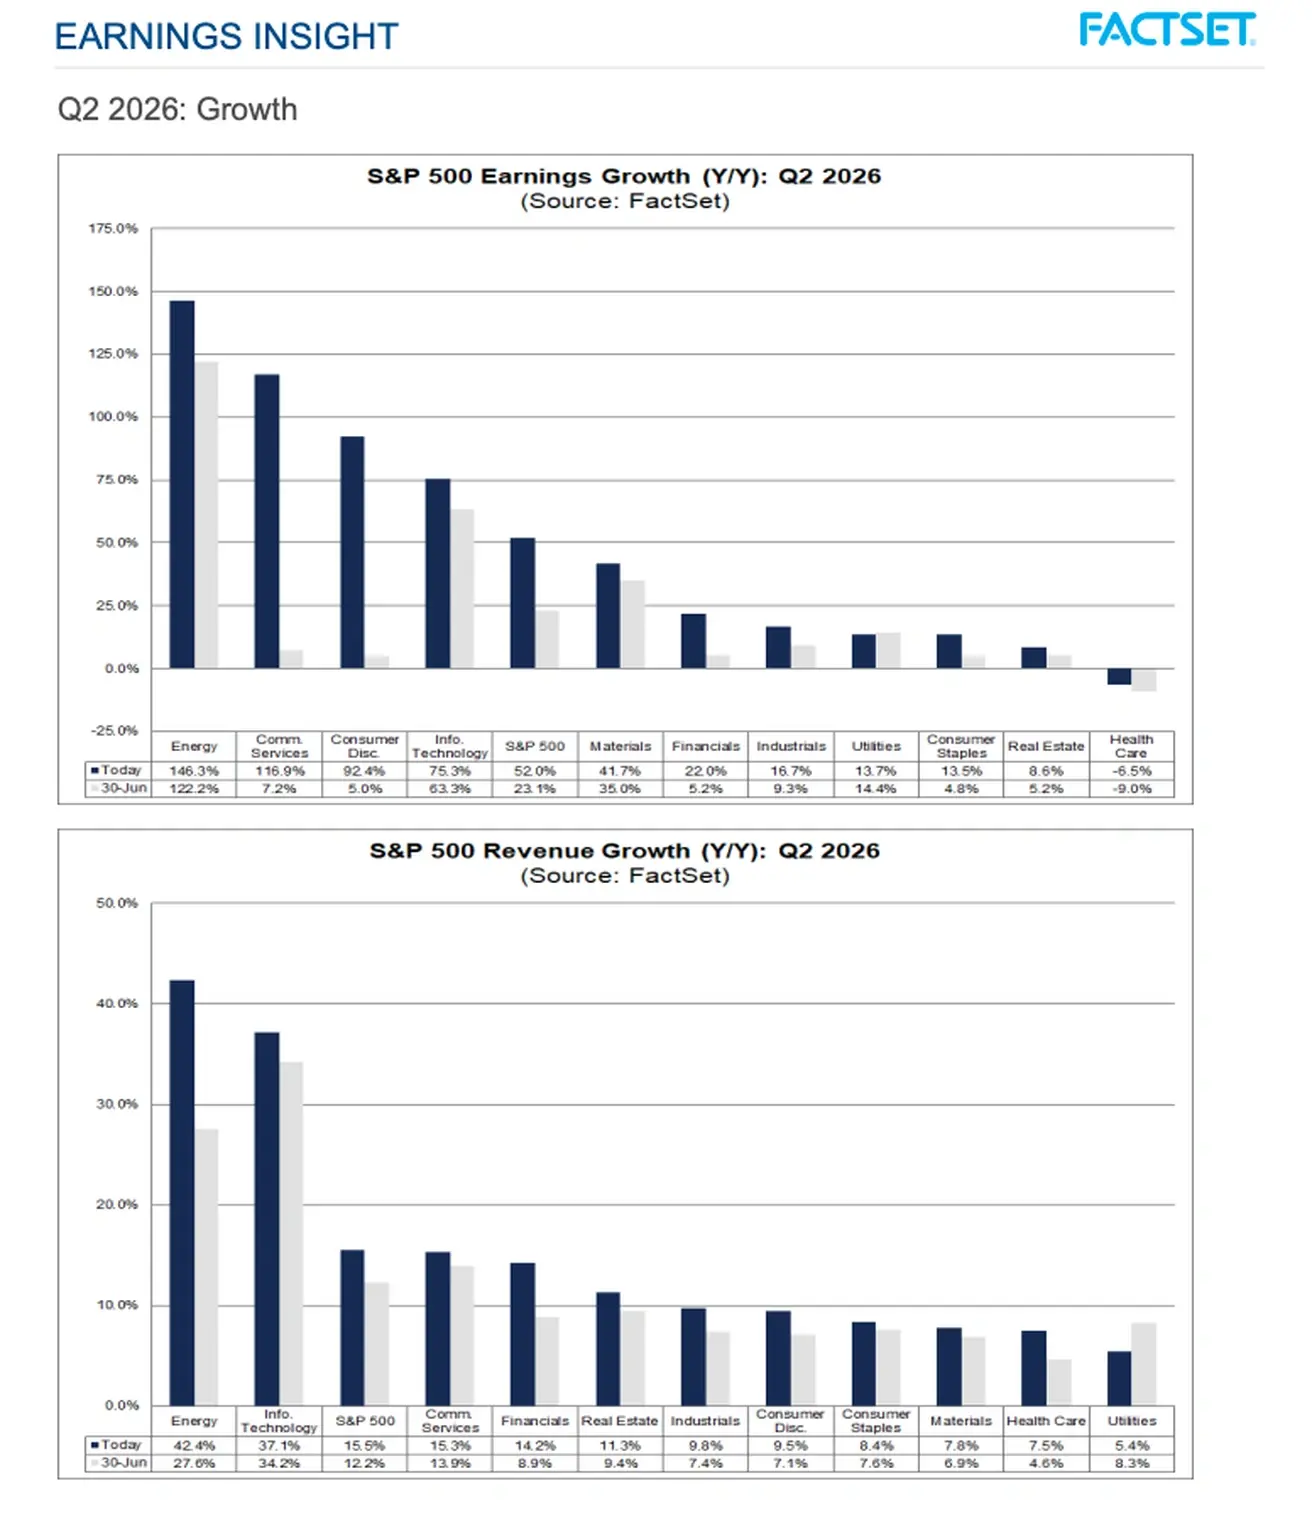
Key takeaways from FactSet's earnings season overview, August 28 (97% of S&P 500 companies have reported):
- The earnings season is very strong: 86% of S&P 500 companies beat EPS estimates, and 77% beat revenue estimates. Both are notably above historical averages;
- Earnings growth accelerated to 52% y/y, which would be the highest since Q2 2021. Even excluding Alphabet and Amazon, growth remains around 34%, meaning the strength of the season isn't just a mega-cap one-off effect;
- S&P 500 margin hit a record 17%; excluding Alphabet and Amazon, it's 15.1%, still the highest in FactSet's entire recorded history;
- Forecasts for the second half of the year remain strong: FactSet expects EPS growth of 28.2% in Q3 and 25.8% in Q4, with full-year 2026 growth at +31.2%;
- Market valuation has become slightly more comfortable: forward P/E fell to 19.6x from 20.4x at the end of June, as the EPS forecast rose faster than the index itself.
NVIDIA reported above expectations — the results confirmed the AI case more than they challenged it. The main takeaway: demand for AI infrastructure isn't slowing down, and NVIDIA's business scale is already approaching the "$100 billion in quarterly revenue" level.
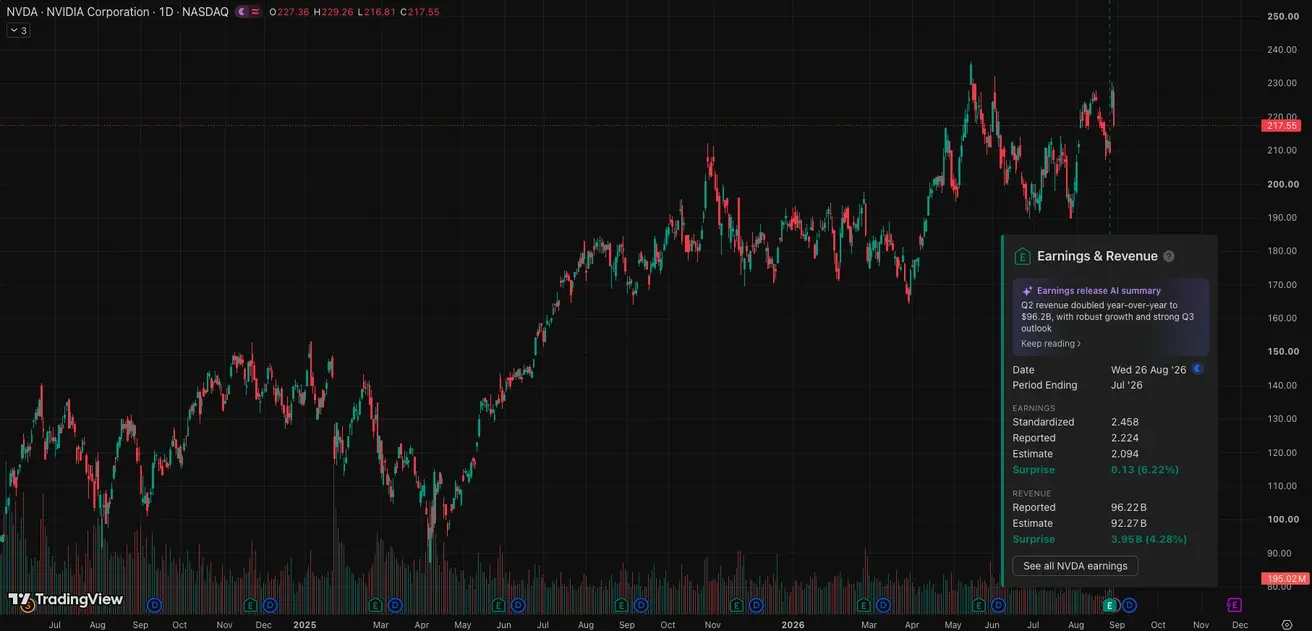
Key numbers
- Q2 FY2027 revenue: $96.2 billion, +18% QoQ and +106% YoY;
- Data Center: $89.0 billion, +18% QoQ and +117% YoY — this is effectively almost NVIDIA's entire business now;
- Gross margin: 75.0%;
- EPS: GAAP $2.46; non-GAAP $2.22;
- Q3 guidance: $108 billion ±2%, meaning the company is moving past the $100 billion quarterly revenue level.
What stood out
- A very important detail: NVIDIA's Q3 guidance does not include Data Center compute revenue from China. In other words, the guidance is strong even without the China segment;
- The company expects roughly 70% revenue growth in FY2027, and in Huang's words, this reflects "supply-constrained visibility";
- Vera Rubin is already in full-scale production. This matters because the market was watching not just current Blackwell/Rubin demand, but also the smooth transition to the next platform;
- Over the quarter, NVIDIA returned about $26 billion to shareholders through buybacks and dividends, with roughly $99 billion remaining in buyback authorization. This matters for perception: the company is no longer just a growth story, but a giant generating enormous free cash flow.
What Huang said: "Compute is now generating revenue." The point: AI has stopped being an experiment and become a production resource that is directly monetized. He said AI has reached an inflection point — tokens are already doing useful work, they're profitable, and demand is accelerating.
A year ago, demand for NVIDIA's chips and infrastructure was largely associated with a limited number of the biggest AI developers. Now demand has broadened significantly: NVIDIA's hardware is needed not only by leading AI labs, but also by startups, companies building open models, cloud providers, industrial projects, and areas tied to robotics and "physical AI."
Risks that remain
- Margin. Gross margin currently sits at 75%, but the market is watching pressure from memory and component costs. Media reports note that rising memory costs could push margin down toward the 72–73% range in the coming periods.
- China risk. Guidance excluding China compute revenue is, on one hand, a strength, since the forecast is already high without it. On the other hand, it's a reminder that the China segment remains politically and regulatory constrained.
- NVIDIA is actively investing in the AI ecosystem and helping build out financial infrastructure. This supports demand, but the market will be watching closely whether part of that demand is becoming "self-reinforcing" through NVIDIA's involvement in financing customers and partners. The WSJ separately flagged questions about the strategy of using the balance sheet to support AI labs and data centers.
- Custom silicon competition. Google, Amazon, OpenAI, and others are developing their own chips/accelerators. For now, though, NVIDIA's position remains strong thanks to its full platform: GPUs, networking, software, CUDA, racks, systems, and its customer ecosystem.
For the market, this is positive: the report supports the thesis that AI capex is alive and scaling. But valuation is already very demanding, so going forward the market will be watching not just revenue growth, but also margin, the quality of demand, financing of the AI ecosystem, and the durability of customers' ROI.
Eurozone
- The ECB raised interest rates, while maintaining a hawkish stance as inflationary risks continue to increase;
- Against the backdrop of the conflict in the Middle East, the ECB revised its GDP forecasts downward and raised its inflation projections for the coming years.
Key points from the report (dated August 27, 2026) on the monetary policy meeting of the Governing Council of the European Central Bank, held in Frankfurt am Main on Wednesday and Thursday, July 22-23, 2026:
Main takeaways:
- The ECB paused, but the tightening cycle is likely not over. All members supported keeping rates unchanged in July, but the communication explicitly emphasized that another hike will likely be needed if the inflation outlook doesn't improve materially;
- Inflation slowed more than expected, but risks remain skewed to the upside. Headline and core inflation declined, but the ECB believes the full impact of the energy shock has yet to play out, and elevated gas, fuel, and food prices could reignite price pressure;
- The eurozone economy proved more resilient than expected. The manufacturing sector continues to grow, and investment is being supported by digitalization, AI, defense, and infrastructure. At the same time, the energy shock and geopolitics continue to weigh on the outlook;
- Second-round inflation effects have not yet taken hold. Wage growth is slowing, pressure on labor costs is easing, and long-term inflation expectations remain around 2%. This is one of the main arguments in favor of pausing rate hikes;
- The key turning point is September. The ECB is waiting for new projections and data on GDP, inflation, wages, and inflation expectations, after which it will decide whether the current price rise remains a temporary energy shock or is turning into more persistent inflation.
Interest Rates
- Deposit Facility Rate: 2.25% (previous: 2.0%);
- Marginal Lending Facility Rate: 2.65% (previous: 2.4%) — the rate at which banks can obtain overnight funding from the central bank;
- Main Refinancing Rate (Policy Rate): 2.40% (previous: 2.15%).
Inflation: Consumer Price Index (CPI) (July)
- Core CPI (YoY): 2.5% (previous: 2.4%);
- Headline CPI: 0.2% (MoM) (previous: -0.1%); 2.9% (YoY) (previous: 2.8%).
GDP (Q2 2026 Preliminary Estimate)
- QoQ: 0.4% (previous: -0.2%);
- YoY: 1.0% (previous: 0.3%).
Unemployment Rate (June)
- 6.3% (previous: 6.3%).
Industrial Production (June)
- MoM: 0.0% (previous: 0.3% revised);
- YoY: 1.67% (previous: 1.37%).
Purchasing Managers' Index (PMI) (July)
- Services PMI: 51.7 (previous: 51.6);
- Manufacturing PMI: 52.8 (previous: 52.0);
- S&P Global Composite PMI: 52.0 (previous: 51.9).
Euro Stoxx 600 (FXXP1!)
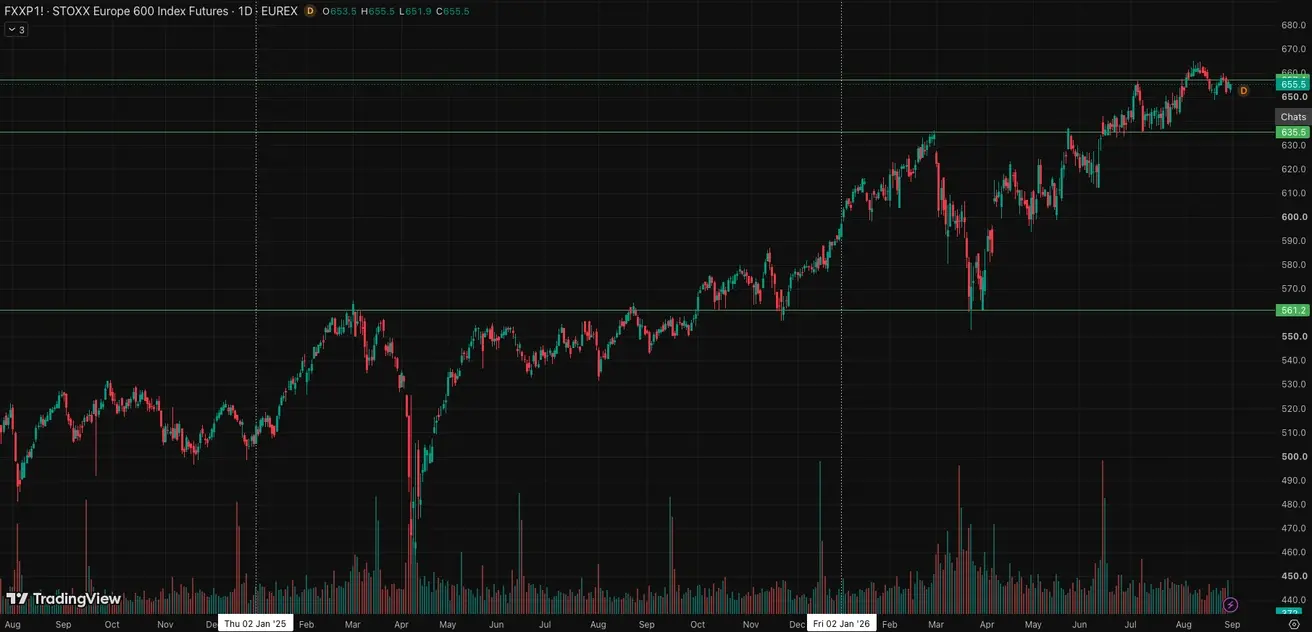
Weekly performance: +0,21% (week-end close: 656,3); year-to-date: 10,49%.
China
China's economy continues to stabilize, supported by strong export performance, while domestic demand and investment are gradually recovering. Policymakers remain measured and targeted in their approach to economic stimulus.
- Interest rates remain unchanged;
- Monetary policy remains accommodative;
- China reaffirmed its commitment to fiscal support for economic growth under its 2026 plan, including measures to stimulate domestic demand, optimize tax incentives and subsidies, and modernize industrial capacity.
Interest Rates
- 1-Year Loan Prime Rate (medium-term lending): 3.00%;
- 5-Year Loan Prime Rate (benchmark for mortgage lending): 3.50%.
Inflation Indicators (July)
- Consumer Price Index (CPI): -0.1% MoM (previous: -0.3%); 0.5% YoY (previous: 1.0%);
- Producer Price Index (PPI): 3.5% YoY (previous: 4.1%).
Trade Data
- Imports (June): 27.5% YoY (previous: 36.0%);
- Exports (June): 23.9% YoY (previous: 27.0%);
- Trade Balance (USD) (July): $112.5 billion (previous: $125.62 billion).
GDP (Q2 2026)
- QoQ: 0.9% (previous: 1.3%);
- YoY: 4.3% (previous: 5.0%).
Labor Market
- Unemployment Rate (July): 5.2% (previous: 5.0%).
Industrial Activity
- Industrial Production (July, YoY): 4.5% (previous: 5.3%).
Fixed Asset Investment
- June, YoY: -6.7% (previous: -5.7%).
Retail Sales
- June, YoY: 0.6% (previous: 0.9%).
Purchasing Managers' Indices (PMI) (May)
- Manufacturing PMI: 49.2 (previous: 50.3);
- Non-Manufacturing PMI: 49.0 (previous: 50.2);
- Composite PMI: 49.3 (previous: 50.6).
CSI 300 Index (000300.HK)
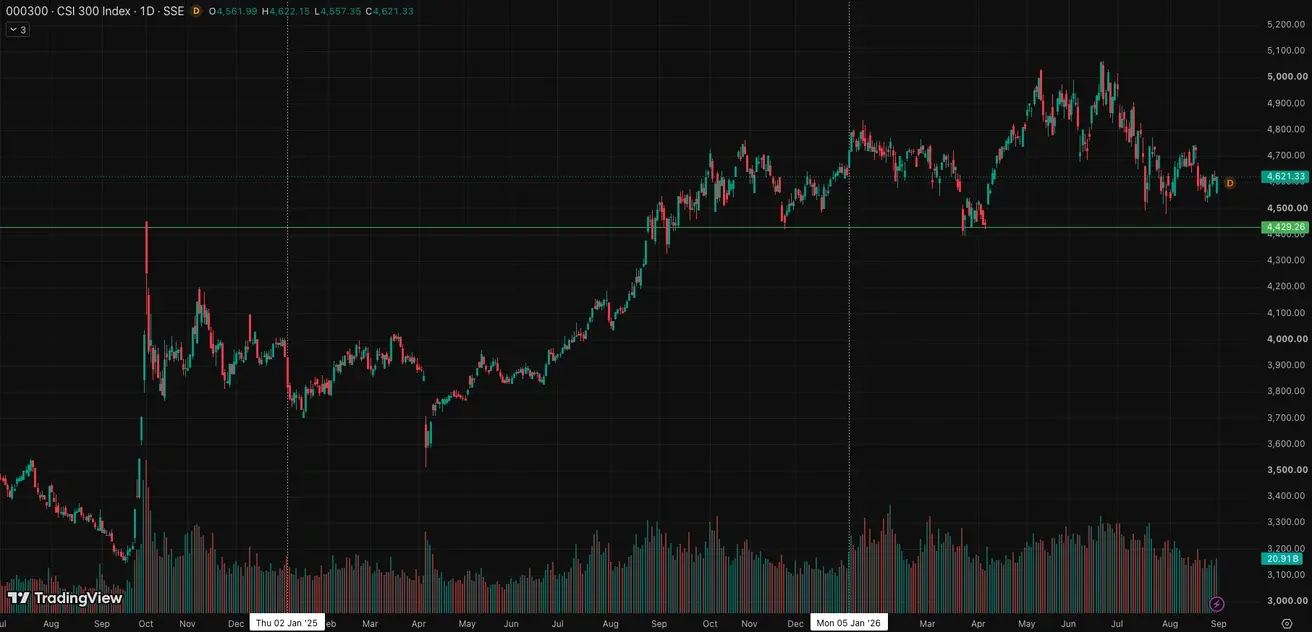
Weekly performance: -0,21% (week-end close: 4609,18); year-to-date: -1,12%.
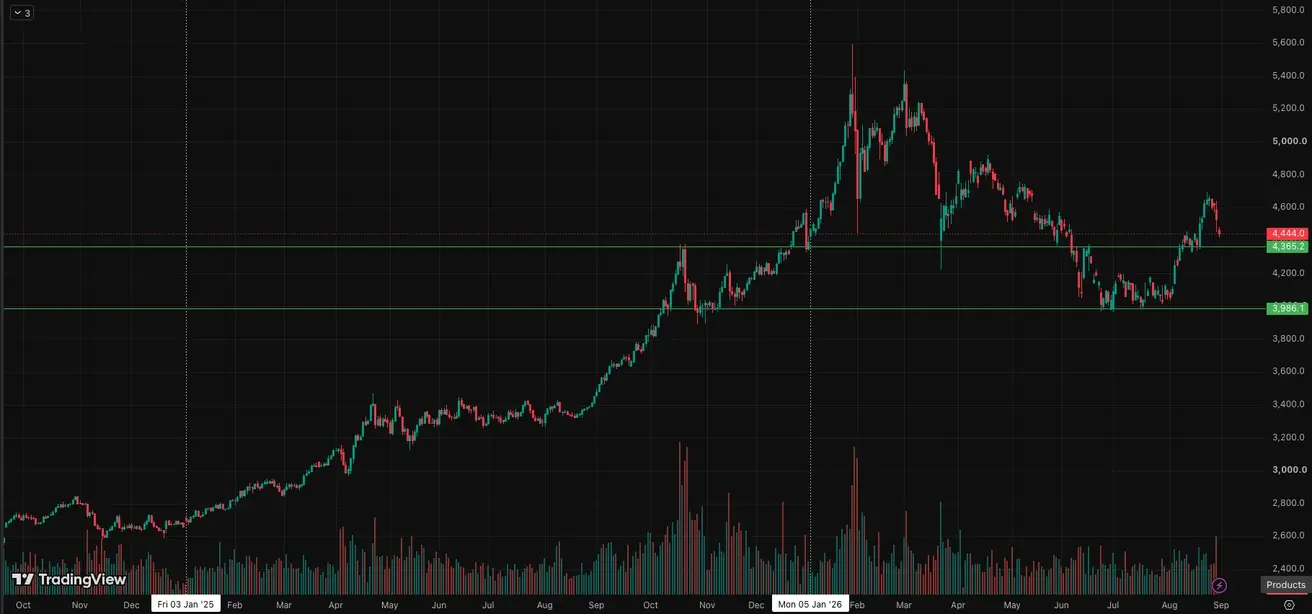
Gold Futures (GC)
Weekly performance: -2,02% (week close: $4531,0 per troy oz); year-to-date: +4,59%
Oil Futures
Weekly performance: -4,20% (week close: $83,40 per barrel); year-to-date: +45,27%
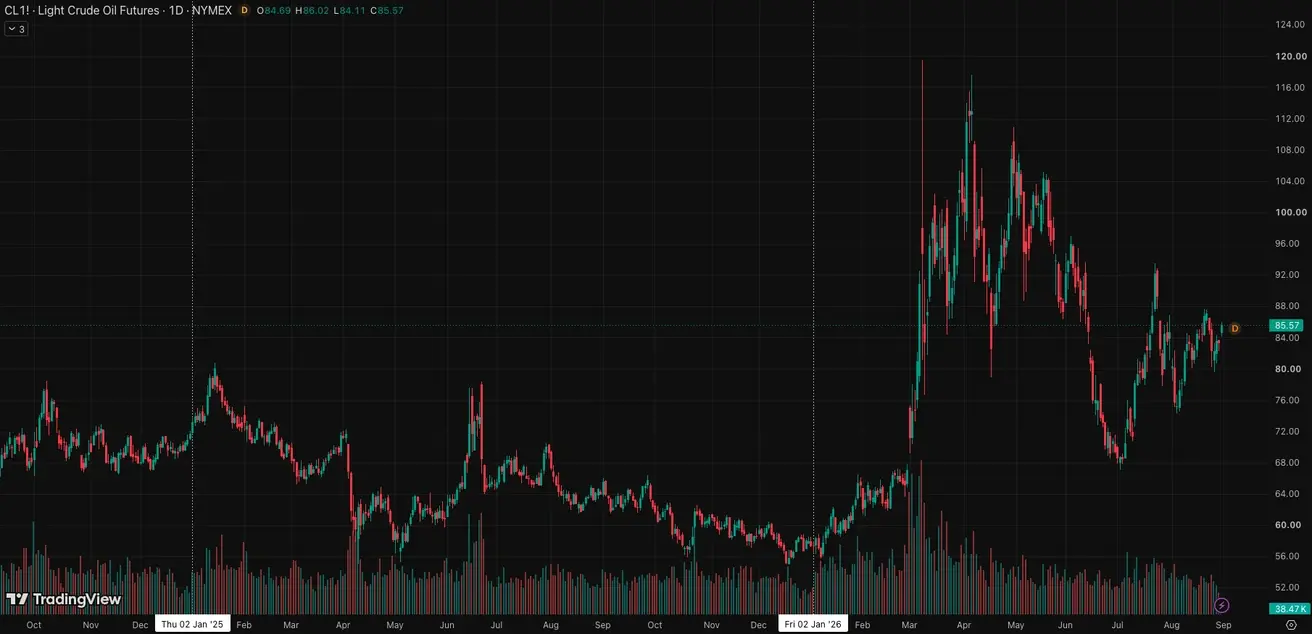
Total oil flow through the Strait of Hormuz has risen to 7-8 million barrels per day, compared to ~4 million in mid-July. Morgan Stanley raised its Brent price forecast to $100 for Q4 2026, citing a slow recovery in Middle East supply.
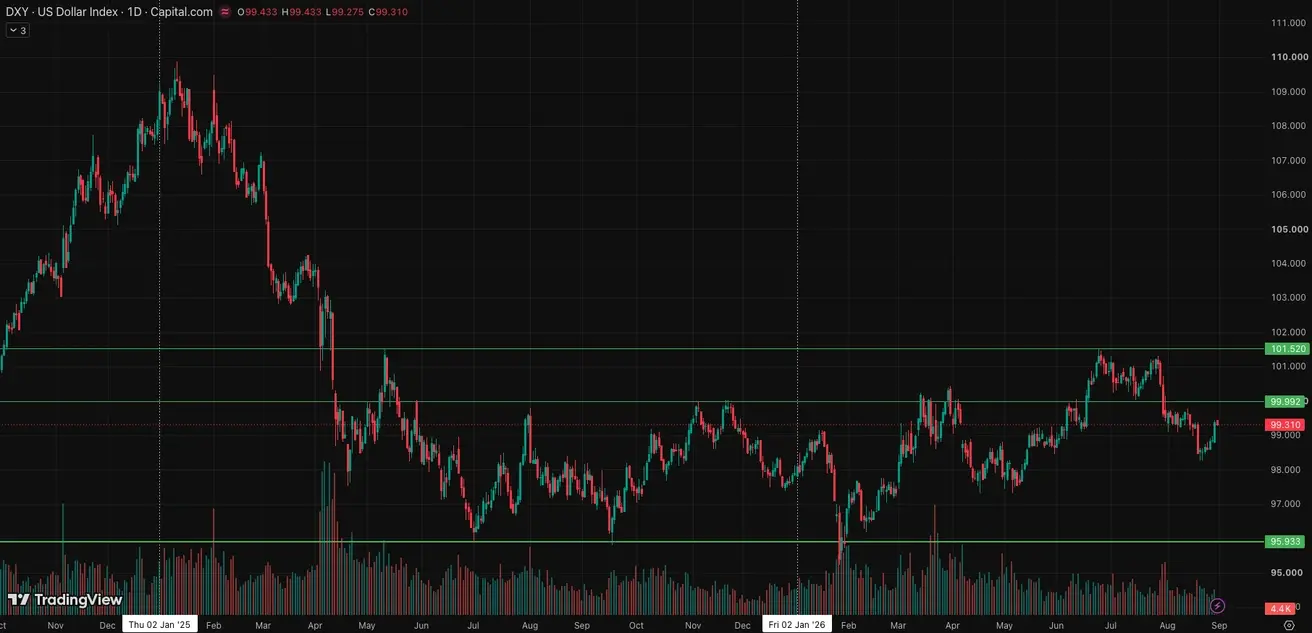
Dollar Index Futures (DX)
Weekly performance: +0,88% (week close: 99,378); year-to-date: +1,41%.
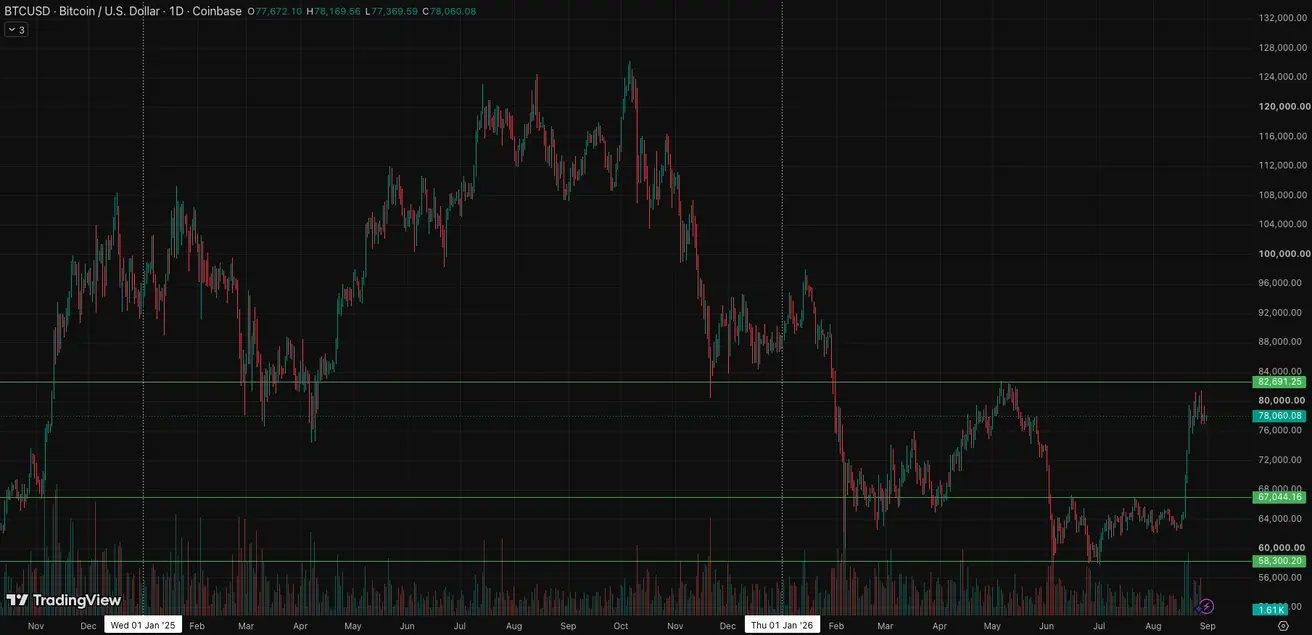
BTC Futures
Weekly performance: -0,08% (week close: $77665,14); year-to-date: -11,46%.
ETH Futures
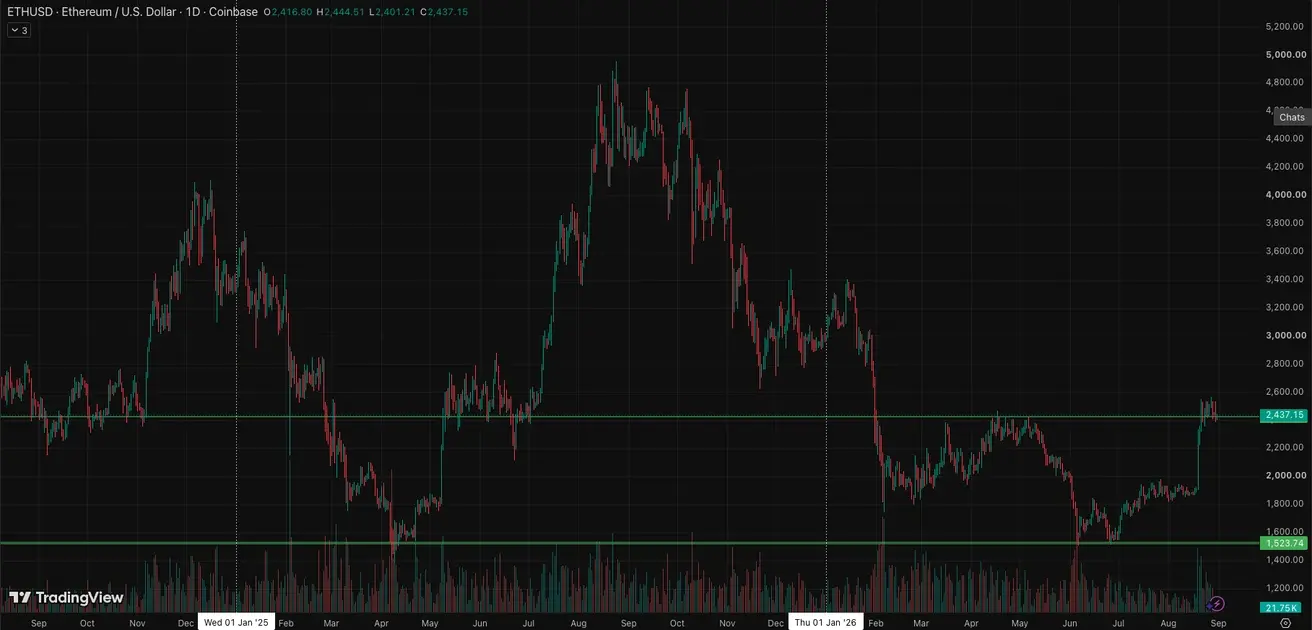
Weekly performance: -1,89% (week close: $2416,86); year-to-date: -18,73%.
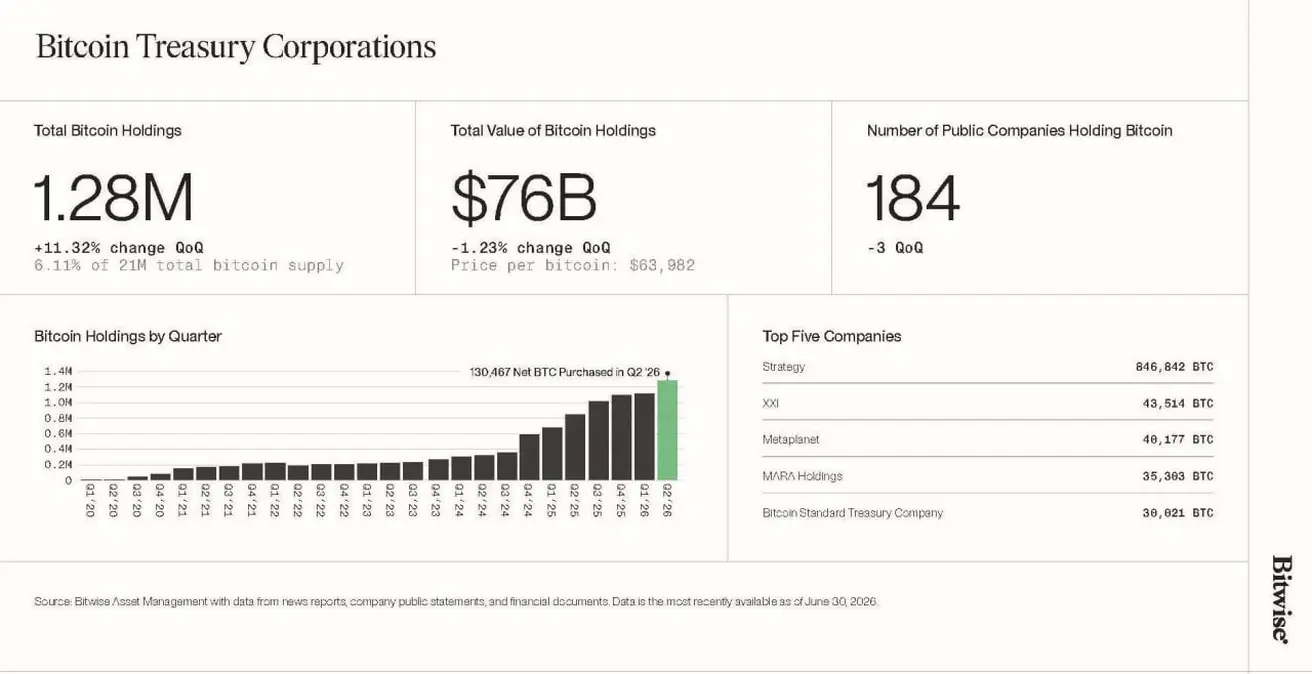
Bitwise: 184 public companies now hold a combined 1.28 million BTC on their balance sheets (6.11% of total supply). Strategy remains the largest holder.
Total Cryptocurrency Market Capitalization
Total crypto market capitalization: $2,64 trillion (vs $2,63 trillion a week earlier) (coinmarketcap.com).
Crypto asset market shares:
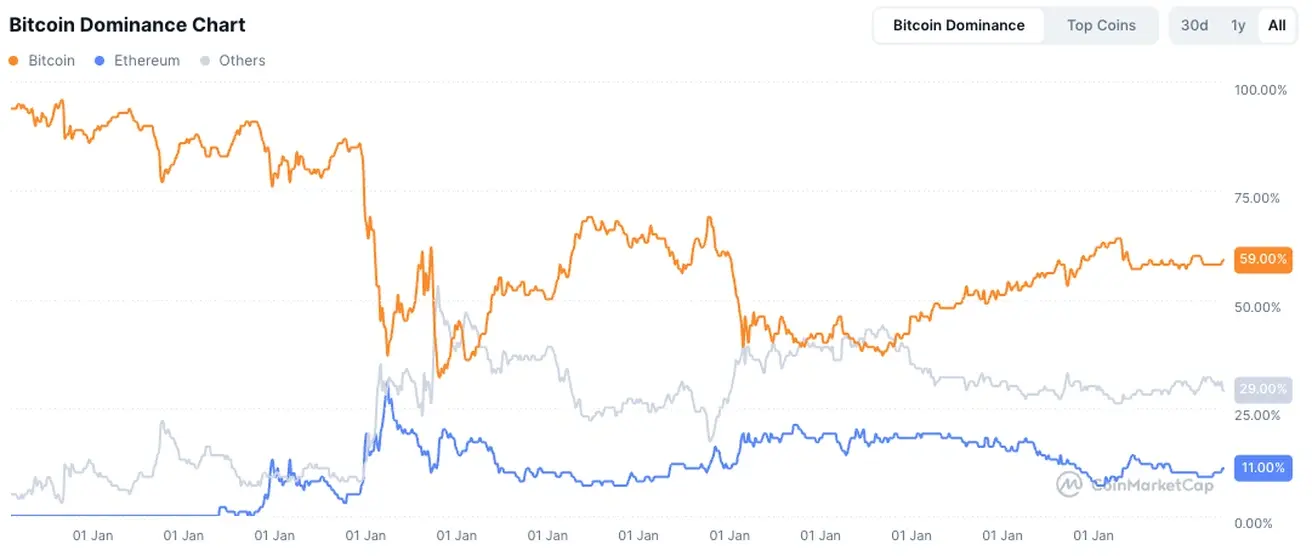
- Bitcoin 59,7% (prev. 59,3%)
- Ethereum 11,2% (prev. 11,3%)
- Others 29,1% (prev. 29,4%)