Русский
 Қазақша
 Eesti
EestiAugust 10 – August 16, 2026: Weekly economic update
Key market updates

Key Takeaways:
- The policy rate remains unchanged, while the Fed’s rhetoric remains cautious;
- Monetary policy remains moderately restrictive;
- U.S. macroeconomic data continue to support a soft-landing scenario: inflation risks are increasing, the labor market is cooling without signs of recession, and current conditions do not yet warrant a rate cut.
Commentary
On a year-over-year basis, consumer inflation has trended downward for a second consecutive month. Inflation expectations show no upward trend. Easing inflationary pressure is positive for markets, and the case for a rate hike is weakening, though levels remain above targets.
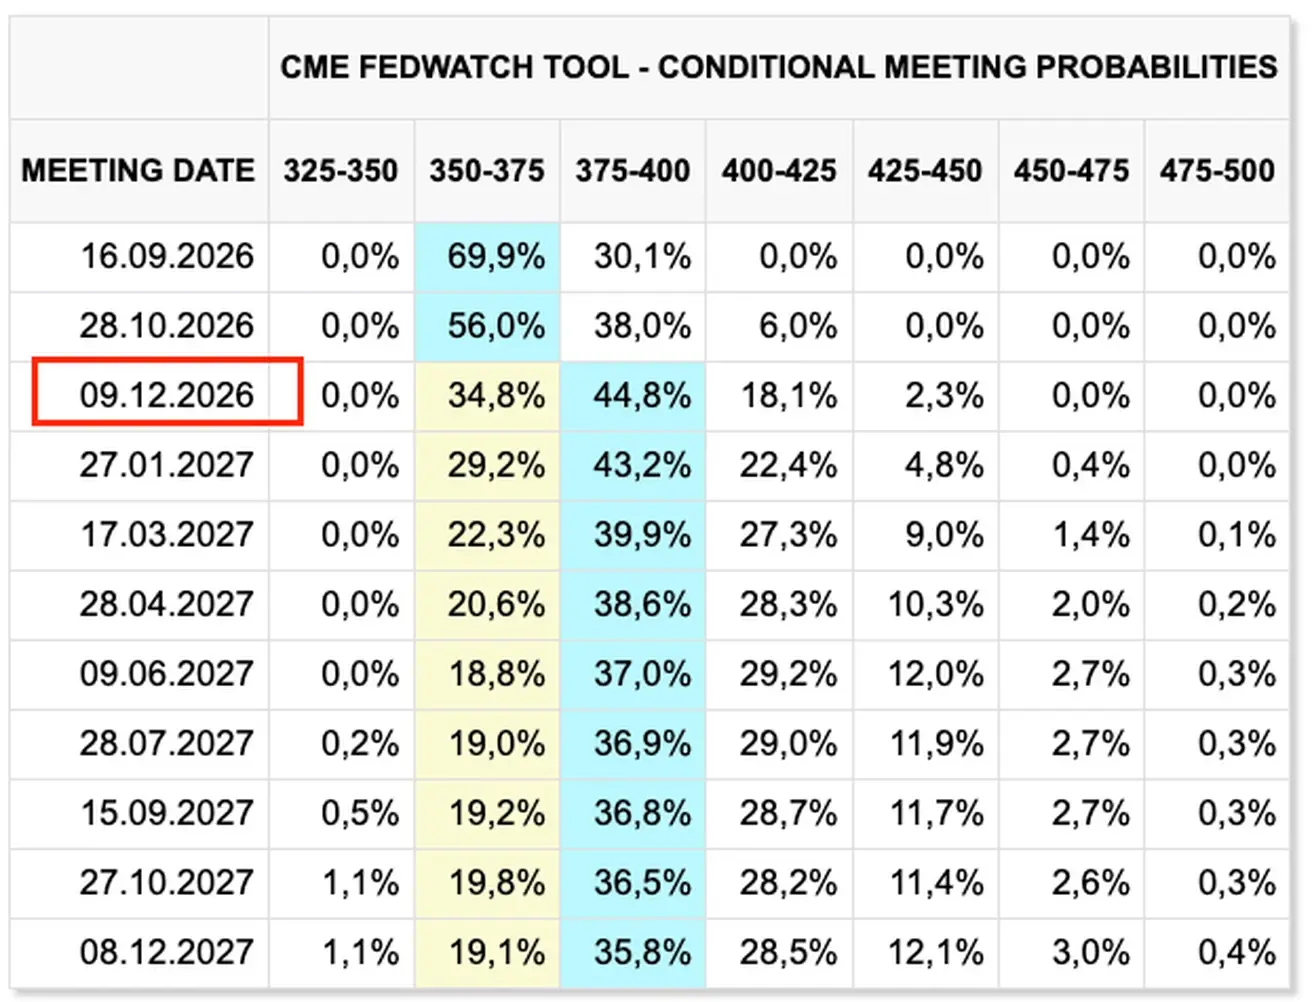
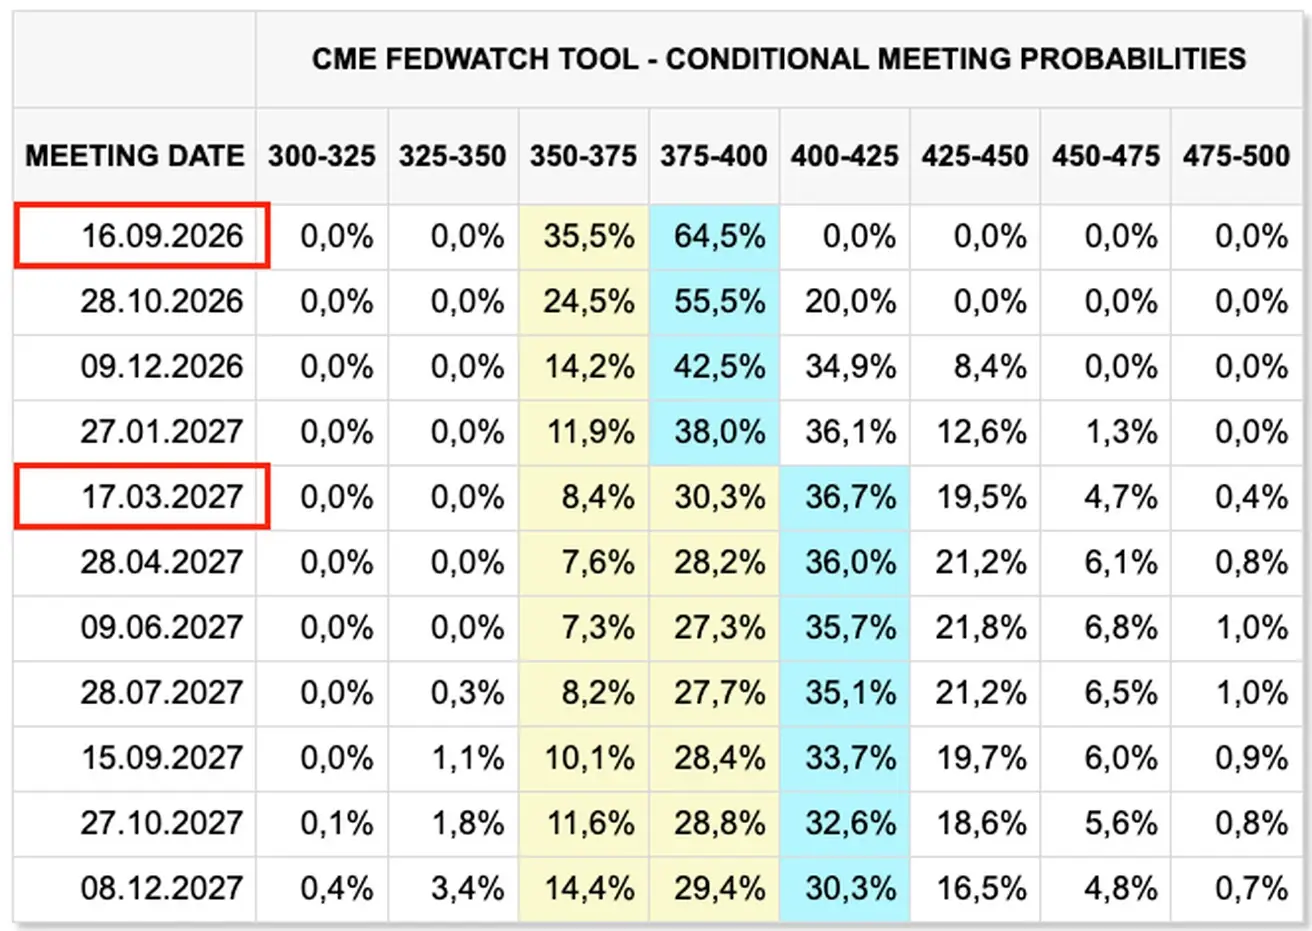
Following the CPI releases, expectations for the Fed’s actions improved accordingly: the probability of a rate hike at the September meeting fell from 64.5% two weeks ago to 30.1%. The market’s base case now expects the 3.50%–3.75% range to be maintained in September, though it still prices in one 25 bps hike by December.
Inflation: Consumer Price Index (July)
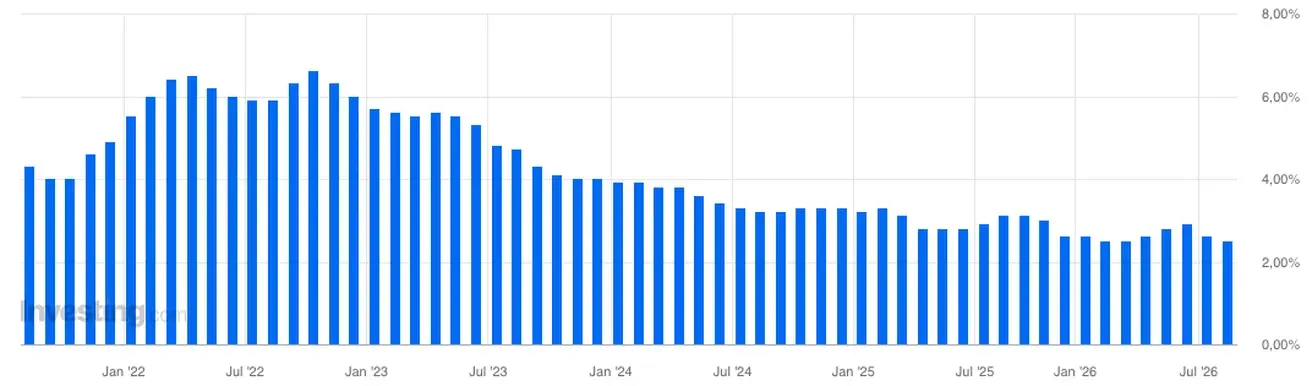
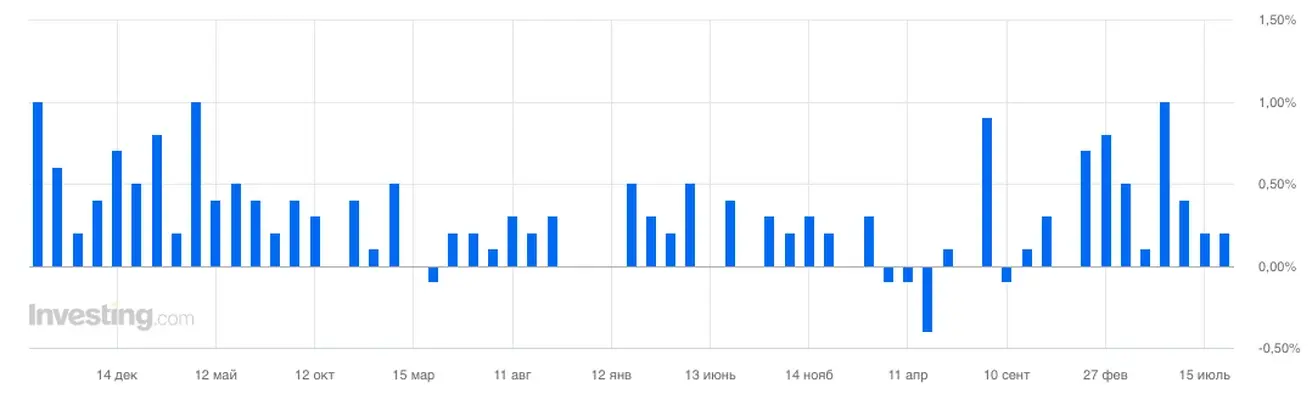
- Core CPI: (MoM) 0.2% (previous: 0.0%); (YoY) 2.5% (previous: 2.6%).
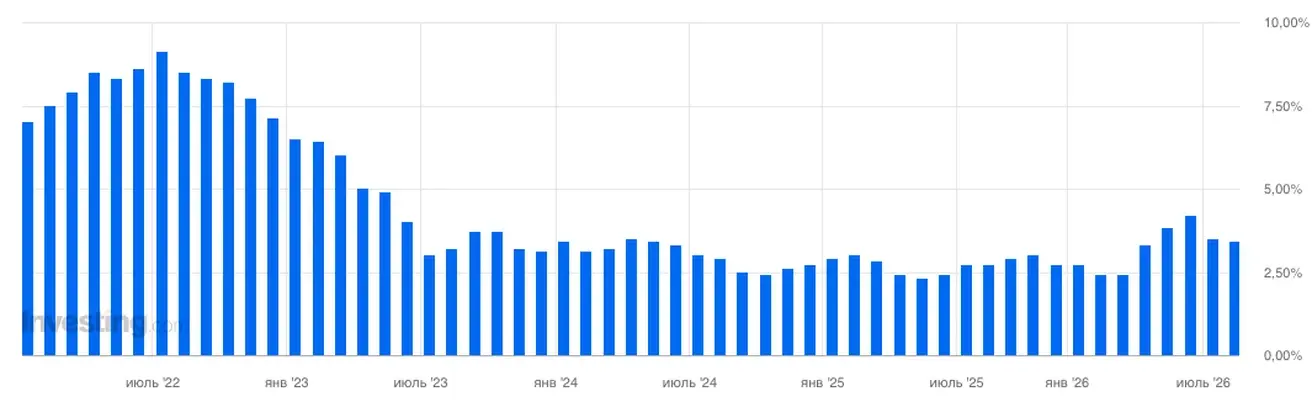
- CPI: (MoM) 0.1% (previous: -0.4%); (YoY) 3.4% (previous: 3.5%).
Producer Price Index (June)
Further constructive indicators emerged as consumer inflation expectations and producer prices shifted lower.
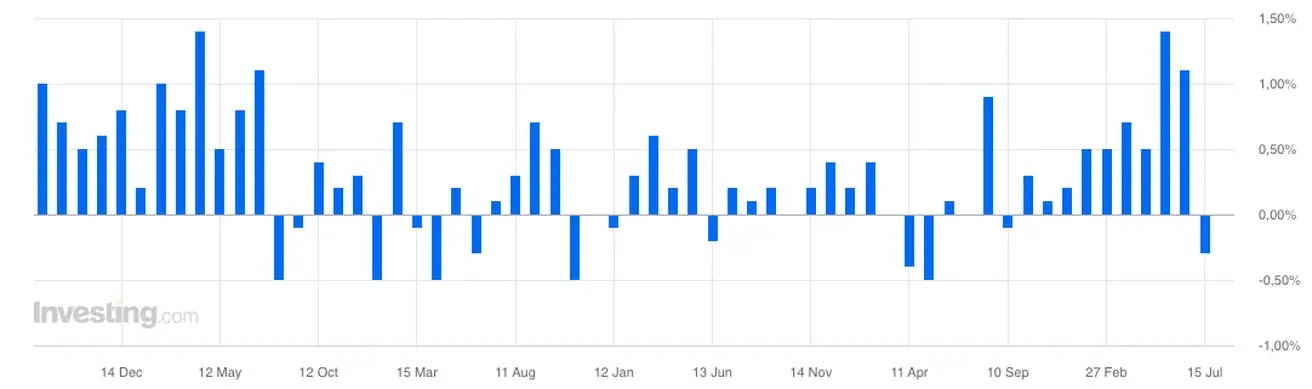
- PPI (MoM): 0.0% (previous: -0.3%).
- Core PPI (MoM): 0.2% (previous: 0.2%).
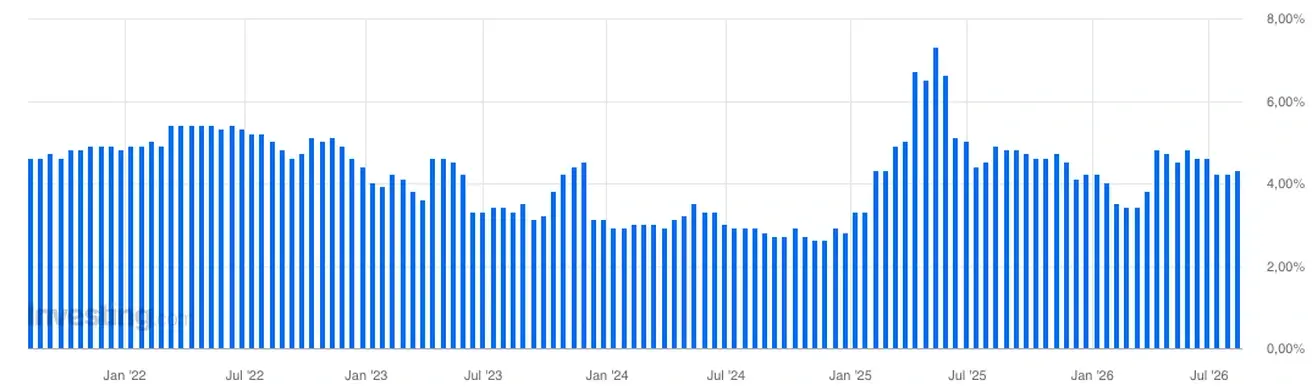
Inflation Expectations (Michigan) (June)
- 12-month Inflation Expectations: 4.3% (previous: 4.2%).
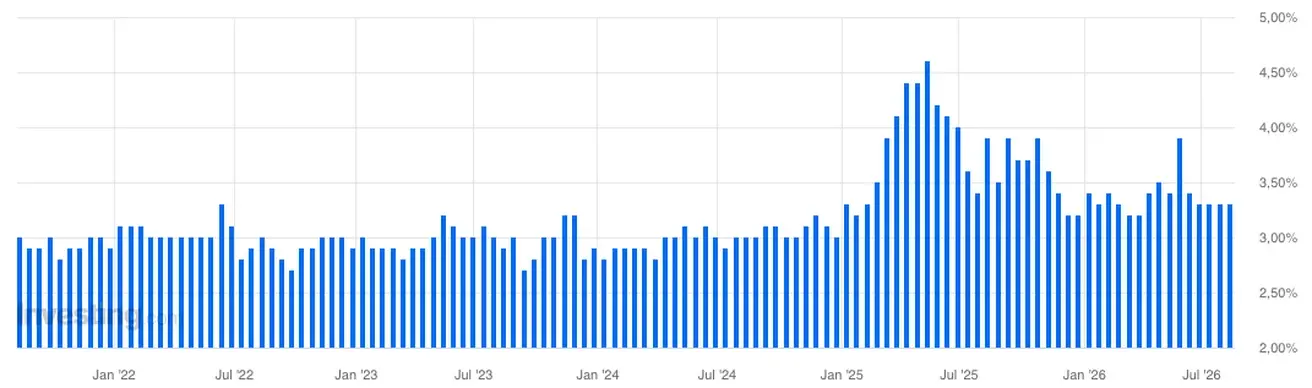
- 5-Year Inflation Expectations: 3.3% (previous: 3.3%).
GDP (U.S. Bureau of Economic Analysis, BEA): Q2 2026 annualized growth rate, preliminary: +1.5% (Q1 2026: +2.1%); forecast: 2.1%.
GDPNow (the Atlanta Fed’s real-time estimate of official GDP growth ahead of release (Q3 2026)): 4.3% (previous: 5.8%).
Labor Market (BLS) (July)
- Unemployment Rate: 4.1% (previous: 4.2%);
- Continued Jobless Claims: 1.777K (previous: 1.802K);
- Initial Jobless Claims: 209K (previous: 199K);
- Nonfarm Payrolls (NFP): -23K (previous: 57K);
- Private Nonfarm Payrolls: 30K (previous: 49K);
- Average Hourly Earnings (YoY): 3.2% (previous: 3.4%);
- JOLTS Job Openings: 6.866 million (previous: 6.922 million).
Business Activity Index (PMI) (June)
Above 50 indicates expansion; below 50 indicates contraction.
- Services PMI: 54.6 (previous: 51.2);
- Manufacturing PMI: 53.8 (previous: 53.9);
- Composite PMI: 54.5 (previous: 51.9).
Monetary Policy
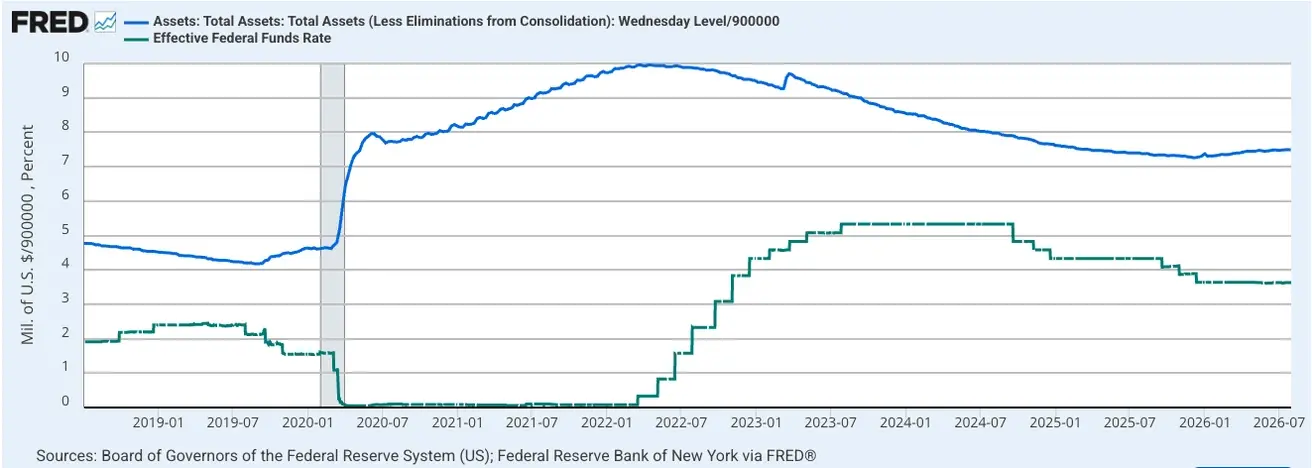
Effective Federal Funds Rate (EFFR): 3.50%–3.75%.
Federal Reserve Balance Sheet: $6.759 trillion, +3.43% since the suspension of quantitative tightening (QT), when the balance sheet stood at $6.535 trillion.
Fedwatch
For the next FOMC meeting (September 16), expectations have improved; the implied market probability of a rate hike is 30.1% (week ago: 43.9%; two weeks ago: 64.5%):
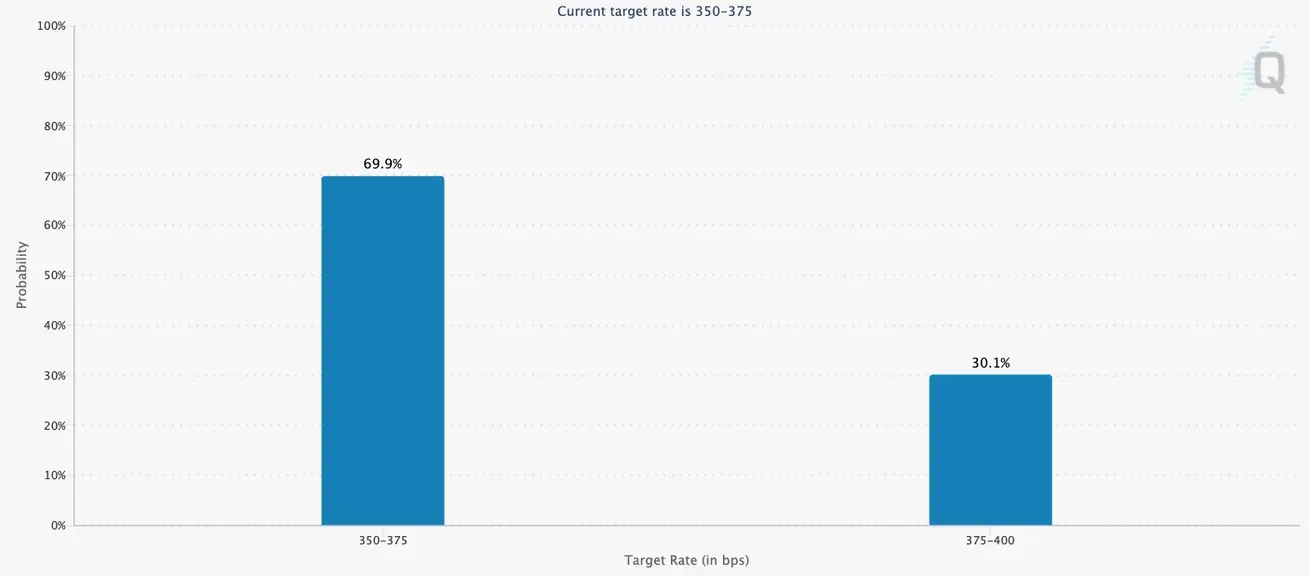
Over the next 12 months, the market now expects a single 25 bps rate hike, bringing the target range to 3.75%–4.00% by December of this year.
Today:
A week earlier:
Bond Market
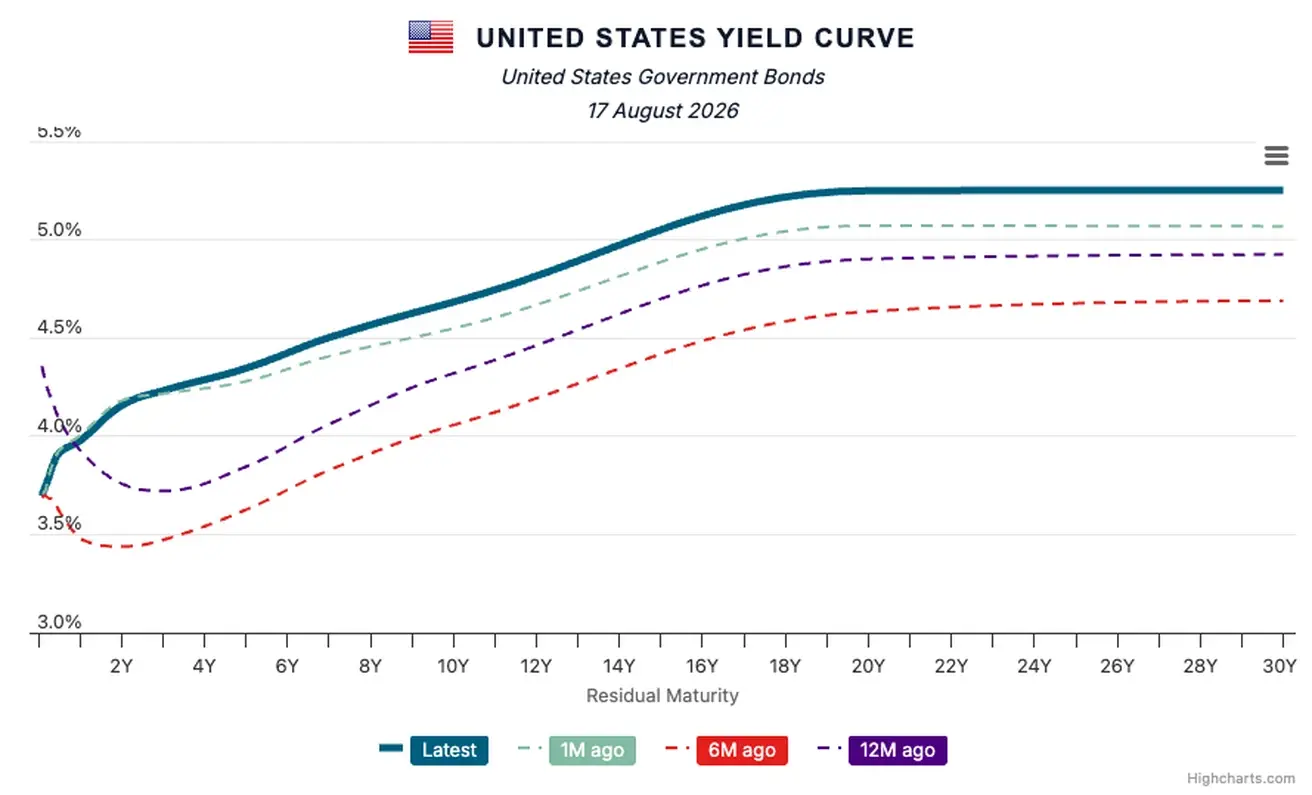
Despite improved rate expectations, the long end of the yield curve is not getting comparable support. Last week, the 2-year yield declined, the 10-year held around 4.7%, and the main pressure fell on the 30-year bonds.
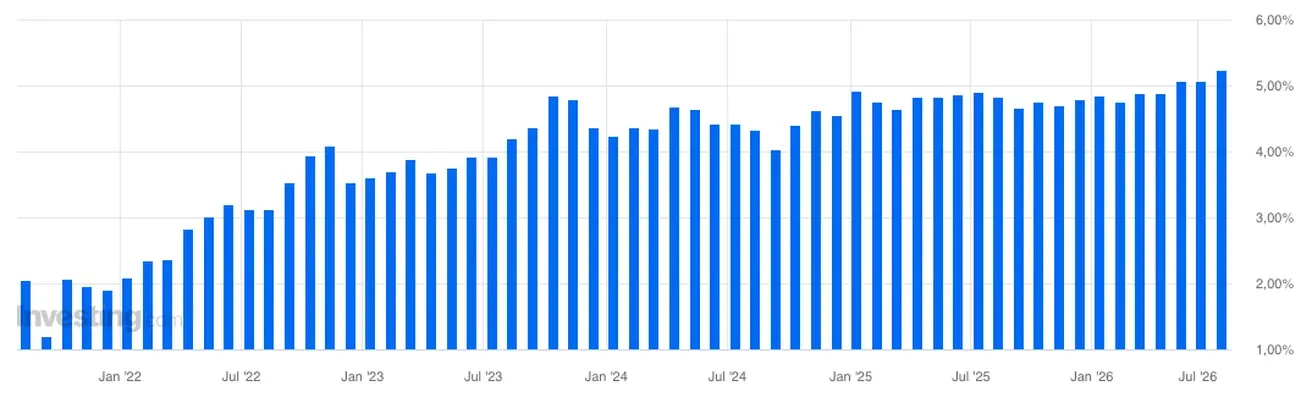
As a result, the curve is steepening. This is an important signal: the market has lowered its expectations for the Fed’s near-term actions but, at the same time, is demanding a higher premium for holding long-term government debt. The main reasons are persistent inflation risks, high borrowing, and concerns about the US budget deficit. At the latest auction, 30-year Treasuries were placed at a yield of 5.216% — the highest yield since 2001 (in the past 25 years).
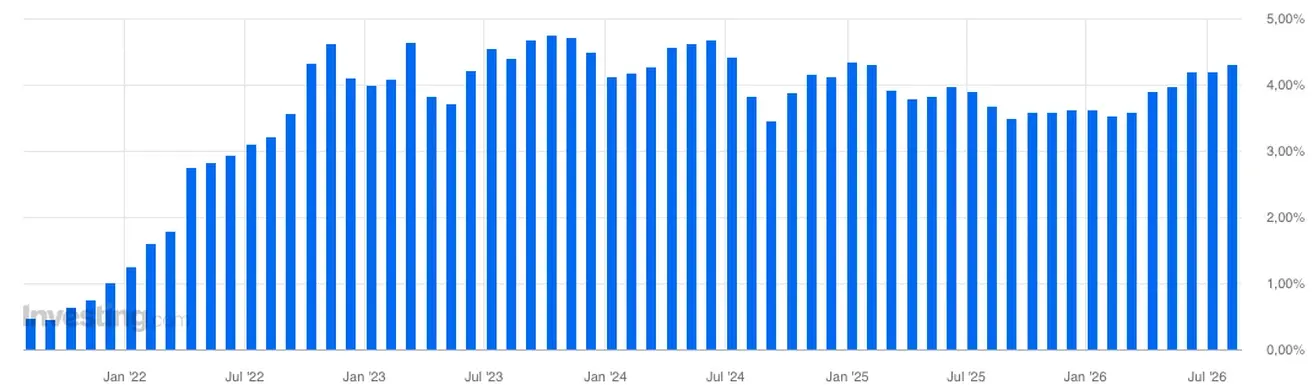
That said, the recent auctions themselves can’t be called weak. The 10-year auction cleared roughly at market yield, with primary dealers left holding a smaller share of the issue — a good sign of genuine investor demand.
The August 13 30-year issue had a bid-to-cover ratio of 2.39x, meaning bids came in at roughly 2.4 times the amount offered.
Bottom line: demand for US debt remains intact, rate expectations are improving → short duration responds with lower yields → the long end of the yield curve stays elevated due to factors the Fed controls far less directly.
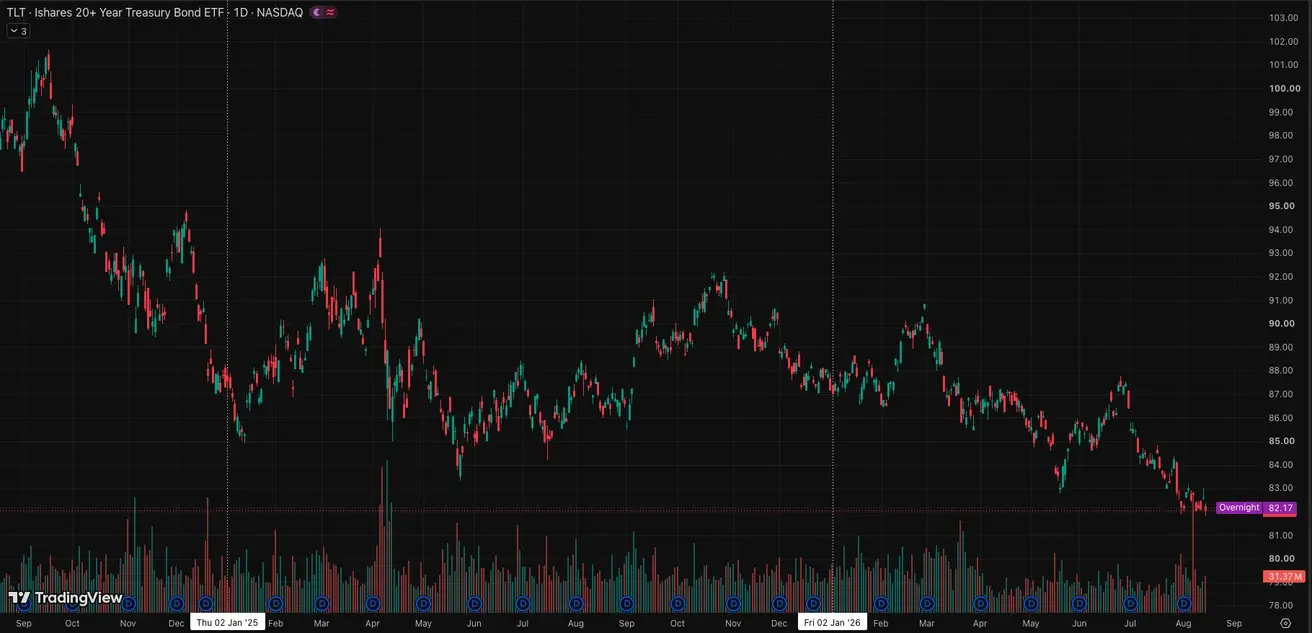
U.S. Treasury Bonds 20+ Years (TLT ETF): -0.87% for the week (weekly close: 82.04); -5.87% year-to-date.
Yields and Spreads
- Market Yield on U.S. Treasury Securities at 10-Year Constant Maturity: 4.68% (previous: 4.66%);
- 2-Year U.S. Treasury Yield: 4.17% (previous: 4.57%);
- ICE BofA BBB US Corporate Index Effective Yield: 5.53% (previous: 5.57%).
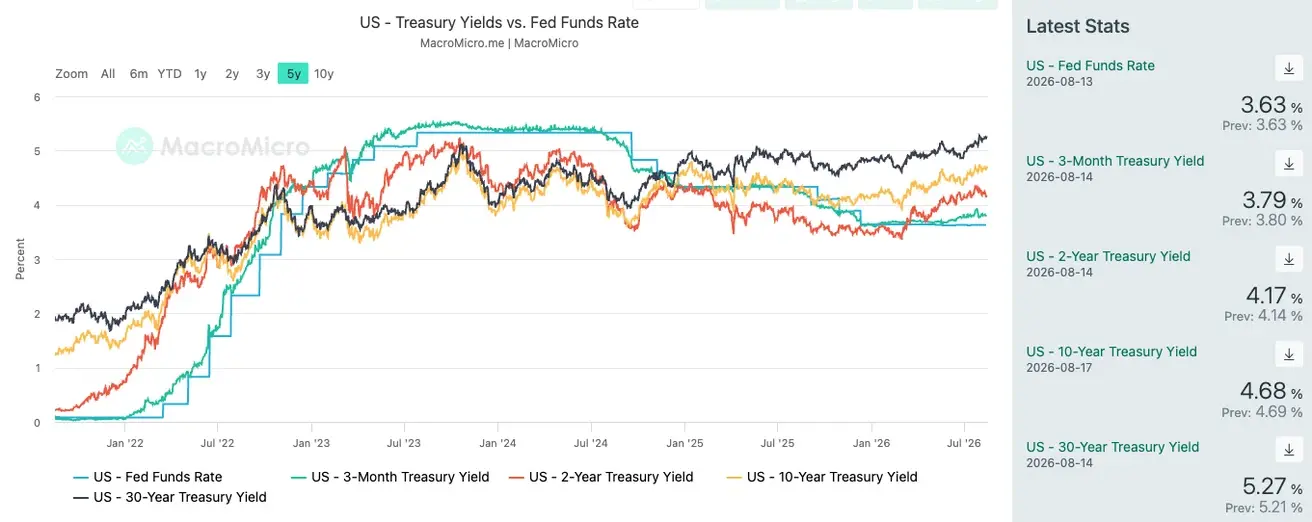
- The yield spread between 10-year and 2-year U.S. Treasury securities stands at 51 basis points (previous: 45 bps);
- The yield spread between 10-year and 3-month U.S. Treasury securities stands at 89 basis points (previous: 85 bps).
10-year US Treasury auction: 4.291% (previous: 4.179%):
30-year US Treasury auction: 5.216% (previous: 5.058%):
U.S. Treasury Yield Curve
The cost of a 5-year U.S. Credit Default Swap (CDS) — a market-based measure of sovereign default insurance — 33.73 basis points, compared with 35.98 basis points a week earlier.
SP500
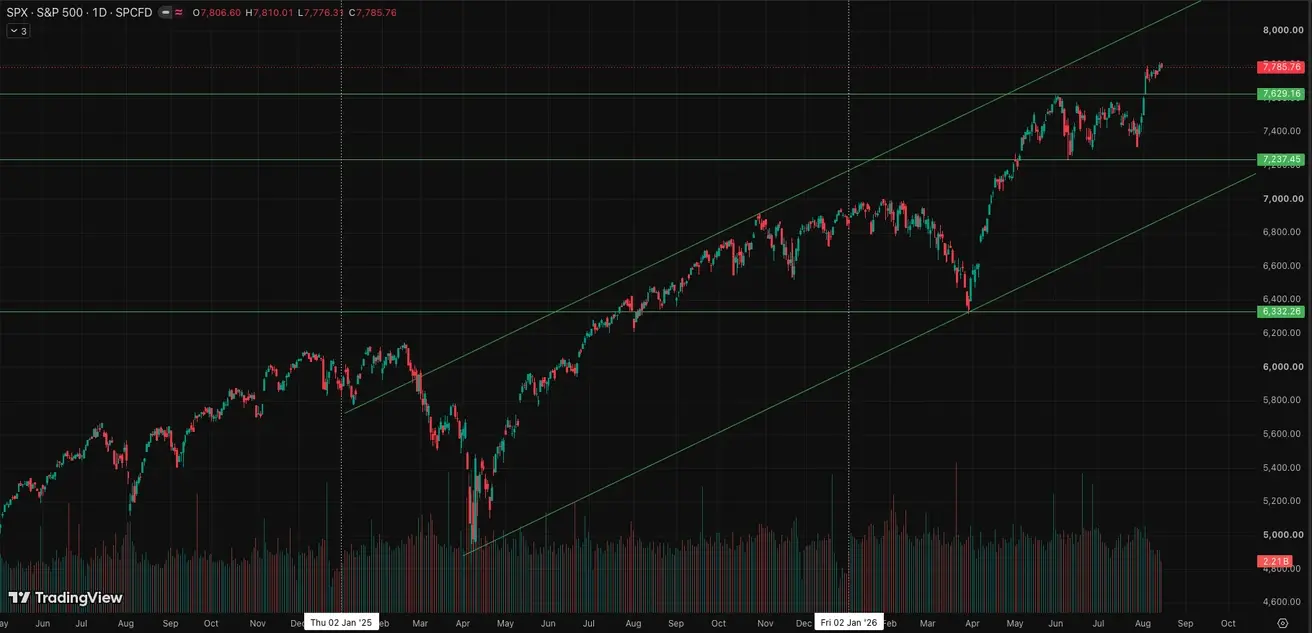
Weekly performance: +0.36% (week-end close: 7,785.86); year-to-date: +13.74%. Another all-time high — 7,800 points.
NASDAQ100
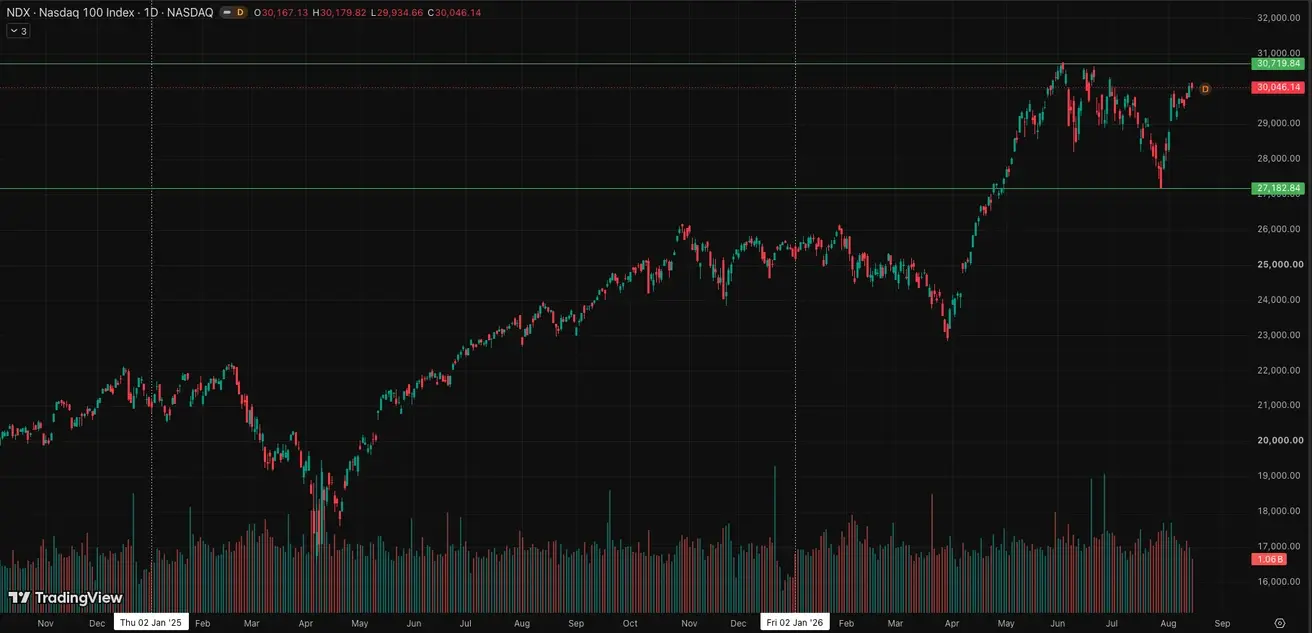
Weekly performance: +1.09% (week-end close: 30,046.14); year-to-date: +19.00%.
VIX
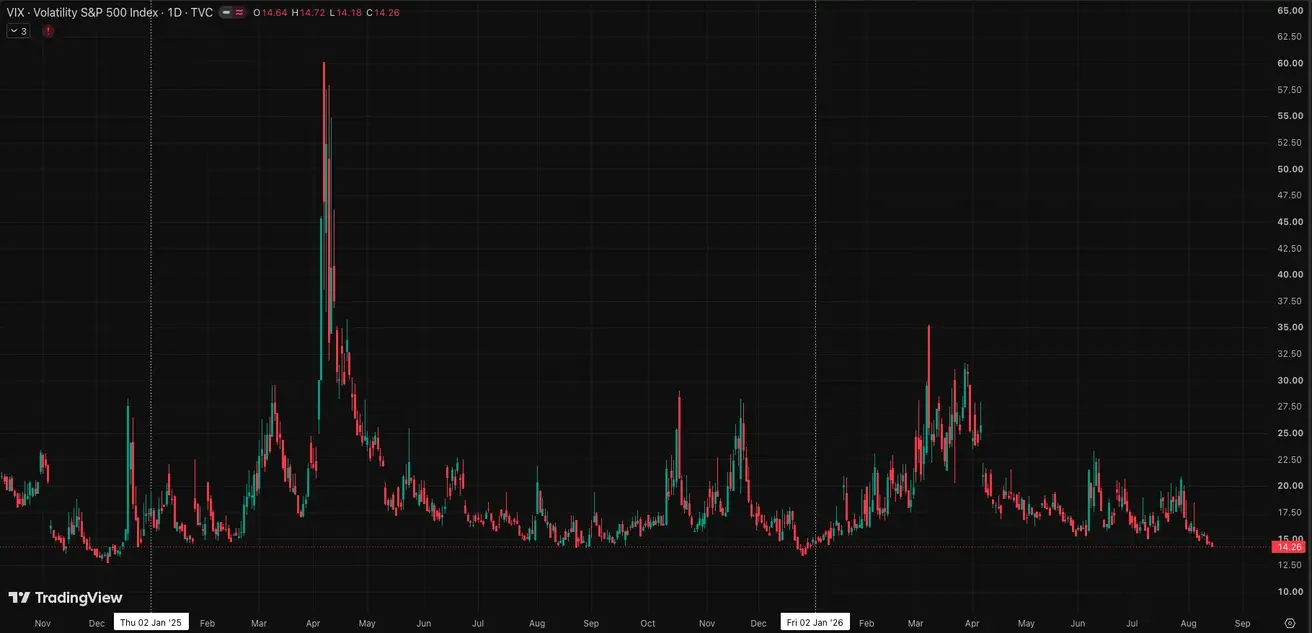
VIX (volatility index): week-end close at 14.26 points.
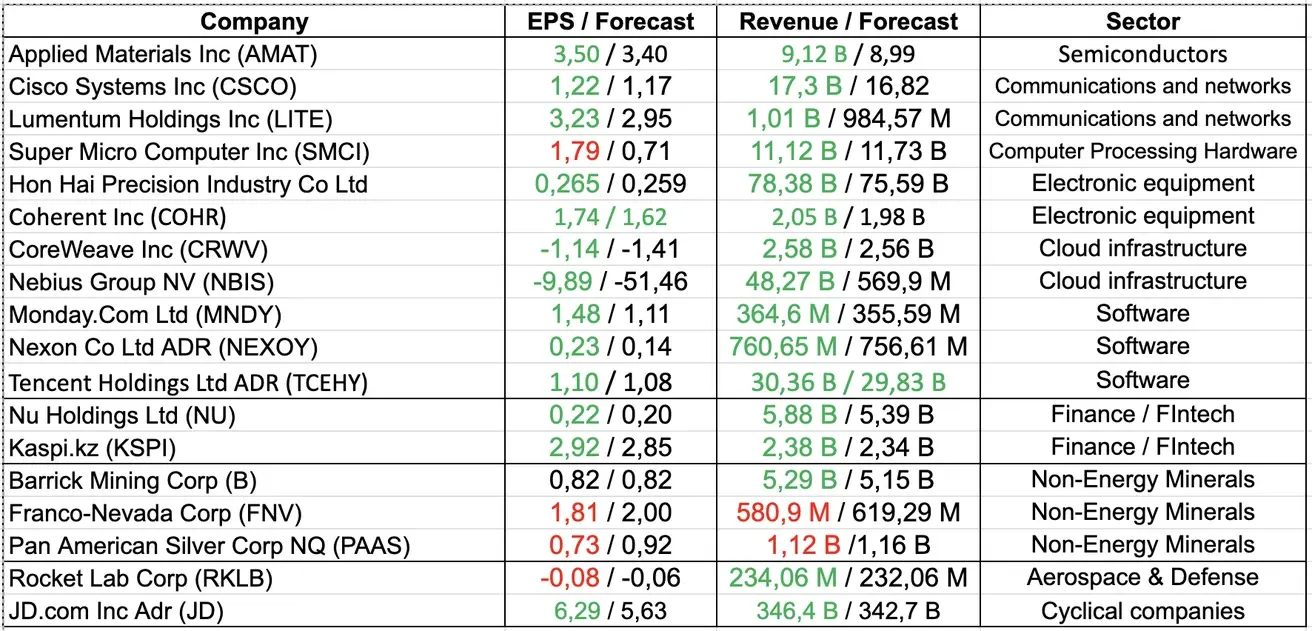
Company earnings from last week.
Of the 18 companies in the table, most beat revenue expectations, while the most notable EPS beats came from Super Micro, Lumentum, Nebius, and CoreWeave.
AI infrastructure stands out in particular: CoreWeave more than doubled revenue year over year and raised its annual guidance, Nebius posted 454% year-over-year revenue growth, and Lumentum grew 109%. This confirms that strong demand for compute capacity, servers, and optical infrastructure is still holding up.
That said, the results weren’t uniformly positive. Super Micro beat EPS expectations by a wide margin but fell short on revenue; Applied Materials also beat expectations, but its stock declined after the report. In other words, the market is starting to focus less on simply beating forecasts and more on margins, management commentary, and companies’ ability to live up to elevated expectations, especially in the AI segment.
Relative to the broader market, the season is broadening out beyond Big Tech. According to Wells Fargo, roughly 80% of reporting companies posted an average EPS beat of about 8%, with non-tech companies beating expectations by around 10% versus 4% for tech companies.
Analysts have not only acknowledged strong Q2 results but also raised forward estimates. FactSet now expects S&P 500 EPS growth of +27.4% in Q3, +25.2% in Q4, and +30.0% for full-year 2026.
On August 13, Citigroup raised its index EPS forecast to $365, roughly +4.3% (index EPS being the projected aggregate earnings of S&P 500 companies per index point). This is because the current earnings season has come in stronger than expected, not just on profit but also on revenue and margins. That said, Citi separately cautions that part of the increase in headline EPS is tied to investment revaluations and other non-operating factors. The bank’s 2026 target for the S&P 500 remains at 8,100.
Yardeni made a far more aggressive revision to index EPS: from $330 to $375 for 2026, an increase of nearly +14% over the previous forecast. At the same time, the 2027 forecast was raised from $375 to $415, and the S&P 500 target for year-end 2026 was lifted from 8,250 to 8,400 points. Yardeni’s core premise is that the US economy will remain resilient through 2026 and 2027 and that elevated corporate margins will hold.
JPMorgan raised its year-end 2026 S&P 500 target to 8,000 from 7,800.
Looking back, it’s fair to say the S&P 500 is trading above its historical median today, at around 30x trailing earnings. But the market is now pricing in a sharp rise in EPS. If the Citi/Yardeni forecasts play out, the current price already corresponds to roughly 21x 2026 earnings, while FactSet models around 20x on a next-twelve-months basis.
The main takeaway is that a strong earnings season matters now not just as a set of good quarterly results. It’s raising the base of expected S&P 500 earnings itself, and that’s fundamental support for current market levels.
Eurozone
- The ECB raised interest rates, while maintaining a hawkish stance as inflationary risks continue to increase;
- Against the backdrop of the conflict in the Middle East, the ECB revised its GDP forecasts downward and raised its inflation projections for the coming years.
Interest Rates
- Deposit Facility Rate: 2.25% (previous: 2.0%);
- Marginal Lending Facility Rate: 2.65% (previous: 2.4%) — the rate at which banks can obtain overnight funding from the central bank;
- Main Refinancing Rate (Policy Rate): 2.40% (previous: 2.15%).
Inflation: Consumer Price Index (CPI) (July)
- Core CPI (YoY): 2.5% (previous: 2.4%);
- Headline CPI: 2.8% (MoM) (previous: -0.1%); 2.9% (YoY) (previous: 2.8%).
GDP (Q2 2026 Preliminary Estimate)
- QoQ: 0.4% (previous: -0.2%);
- YoY: 1.0% (previous: 0.3%).
Unemployment Rate (June)
6.3% (previous: 6.3%).
Industrial Production (June)
- MoM: 0.0% (previous: 0.3%, revised);
- YoY: 1.67% (previous: 1.37%).
Purchasing Managers’ Index (PMI) (May)
- Services PMI: 51.6 (previous: 49.4);
- Manufacturing PMI: 52.0 (previous: 51.4);
- S&P Global Composite PMI: 51.9 (previous: 50.0).
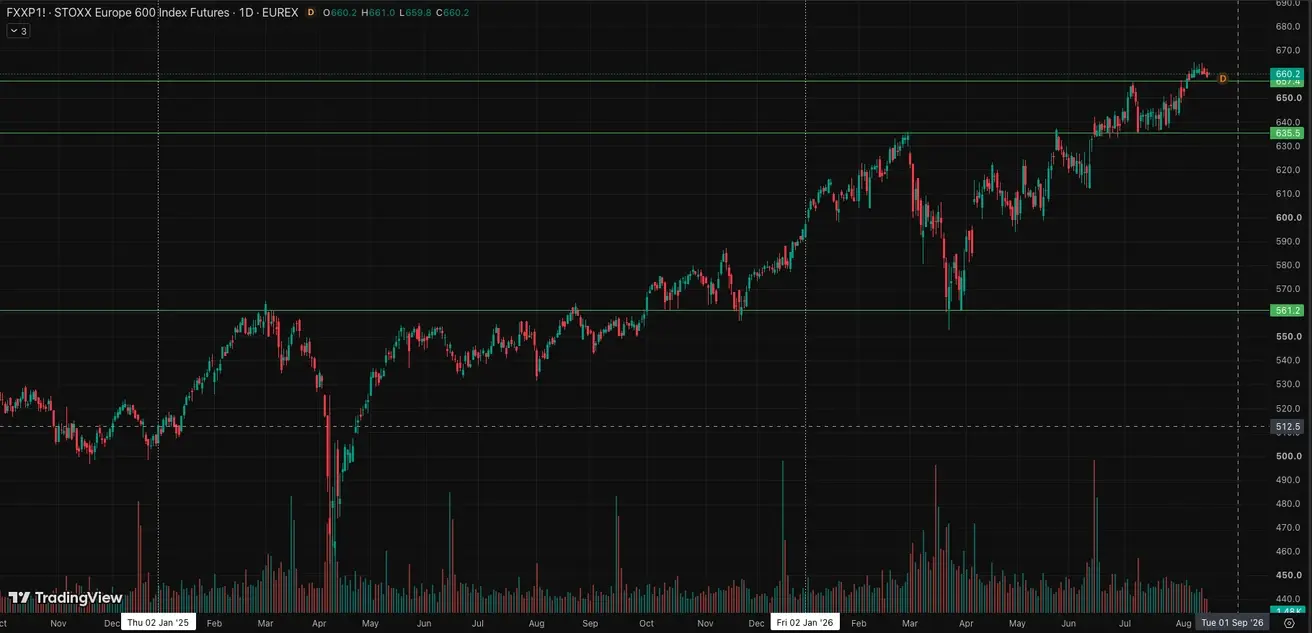
Euro Stoxx 600 (FXXP1!)
Weekly performance: -0.41% (week-end close: 659.2); year-to-date: +10.98%.
China
China’s economy continues to stabilize, supported by strong export performance, while domestic demand and investment are gradually recovering. Policymakers remain measured and targeted in their approach to economic stimulus.
- Interest rates remain unchanged;
- Monetary policy remains accommodative;
- China reaffirmed its commitment to fiscal support for economic growth under its 2026 plan, including measures to stimulate domestic demand, optimize tax incentives and subsidies, and modernize industrial capacity.
Interest Rates
- 1-Year Loan Prime Rate (medium-term lending): 3.00%;
- 5-Year Loan Prime Rate (benchmark for mortgage lending): 3.50%.
Inflation Indicators (July)
- Consumer Price Index (CPI): -0.1% MoM (previous: -0.3%); 0.5% YoY (previous: 1.0%);
- Producer Price Index (PPI): 3.5% YoY (previous: 4.1%).
Trade Data
- Imports (June): 27.5% YoY (previous: 36.0%);
- Exports (June): 23.9% YoY (previous: 27.0%);
- Trade Balance (USD) (July): $112.5 billion (previous: $125.62 billion).
GDP (Q2 2026)
- QoQ: 0.9% (previous: 1.3%);
- YoY: 4.3% (previous: 5.0%).
Labor Market
- Unemployment Rate (June): 5.0% (previous: 5.1%).
Industrial Activity
- Industrial Production (June, YoY): 5.3% (previous: 4.5%).
Fixed Asset Investment
- June, YoY: -5.7% (previous: -4.1%).
Retail Sales
- June, YoY: 0.9% (previous: 1.3%).
Purchasing Managers’ Indices (PMI) (May)
- Manufacturing PMI: 49.2 (previous: 50.3);
- Non-Manufacturing PMI: 49.0 (previous: 50.2);
- Composite PMI: 49.3 (previous: 50.6).
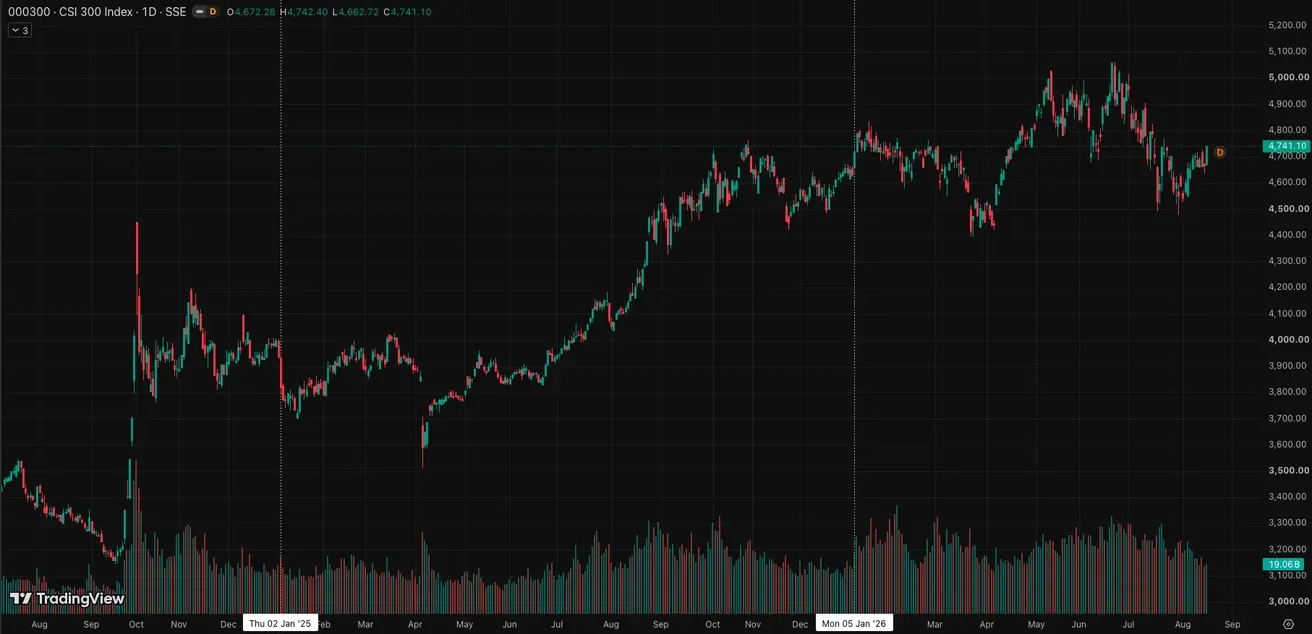
CSI 300 Index (000300.HK)
Weekly performance: -0.61% (week-end close: 4,665.88); year-to-date: +0.09%.
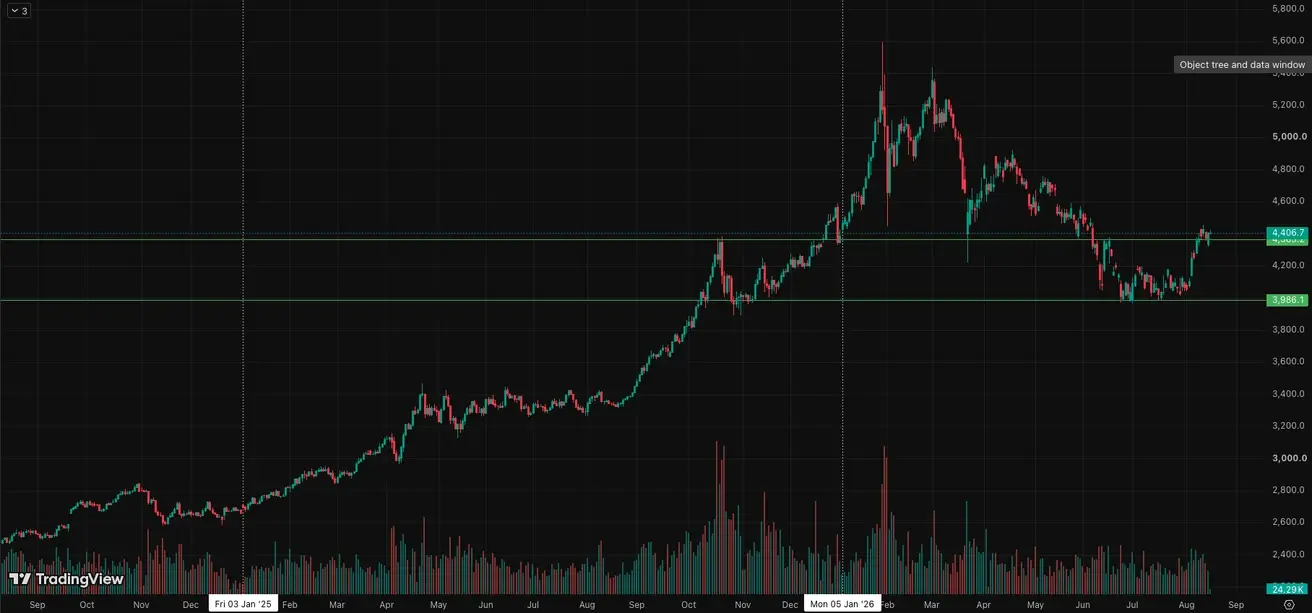
Gold Futures (GC)
Weekly performance: +1.04% (week close: $4,400.60 per troy oz); year-to-date: +1.58%.
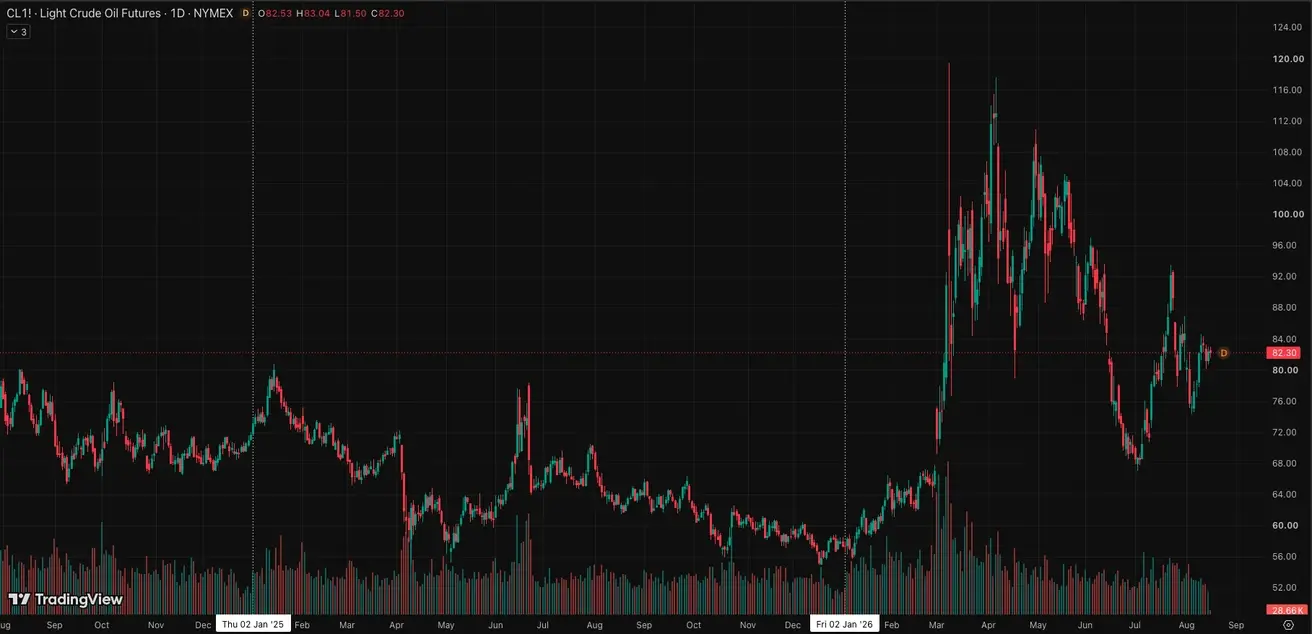
Oil Futures
Weekly performance: +5.27% (week close: $82.40 per barrel); year-to-date: +57.41%.
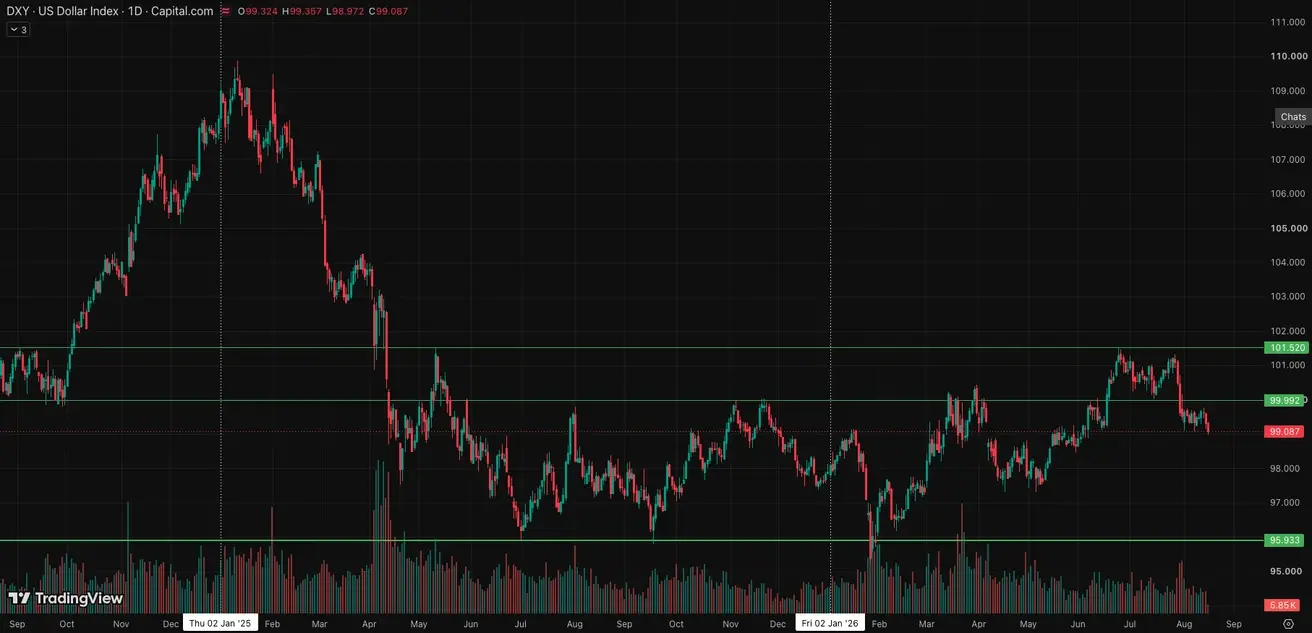
Dollar Index Futures (DX)
Weekly performance: +0.02% (week close: 99.317); year-to-date: +1.35%.
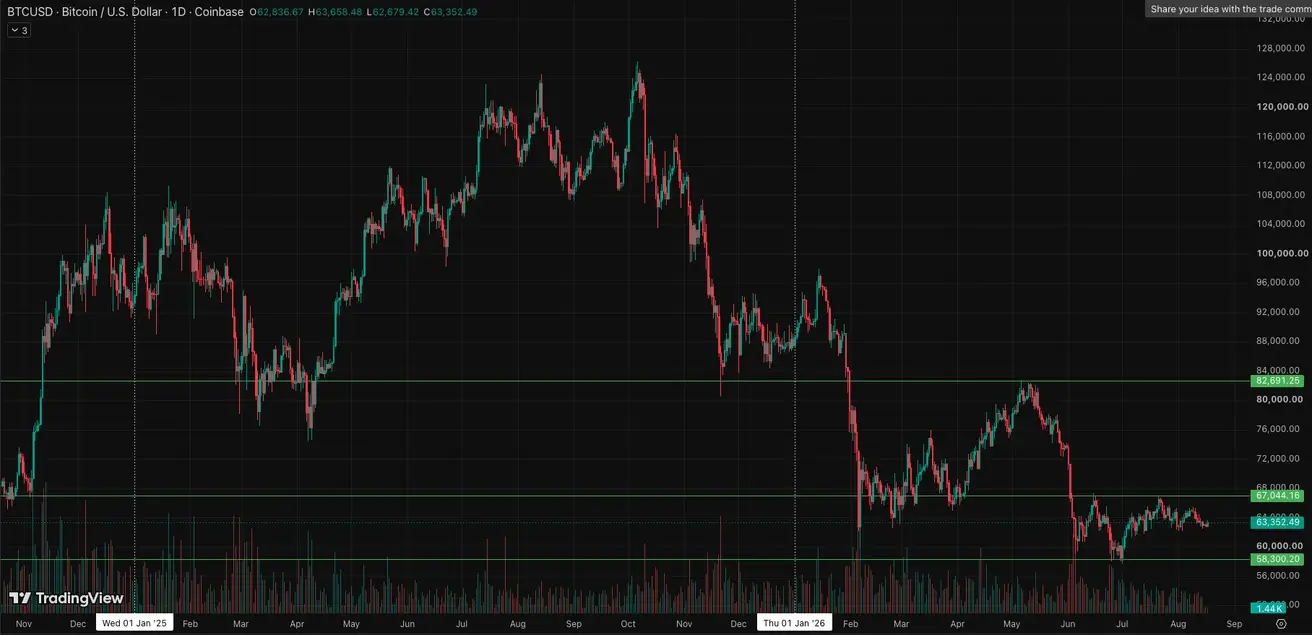
BTC Futures
Weekly performance: -3.10% (week close: $62,836.66); year-to-date: -28.37%.
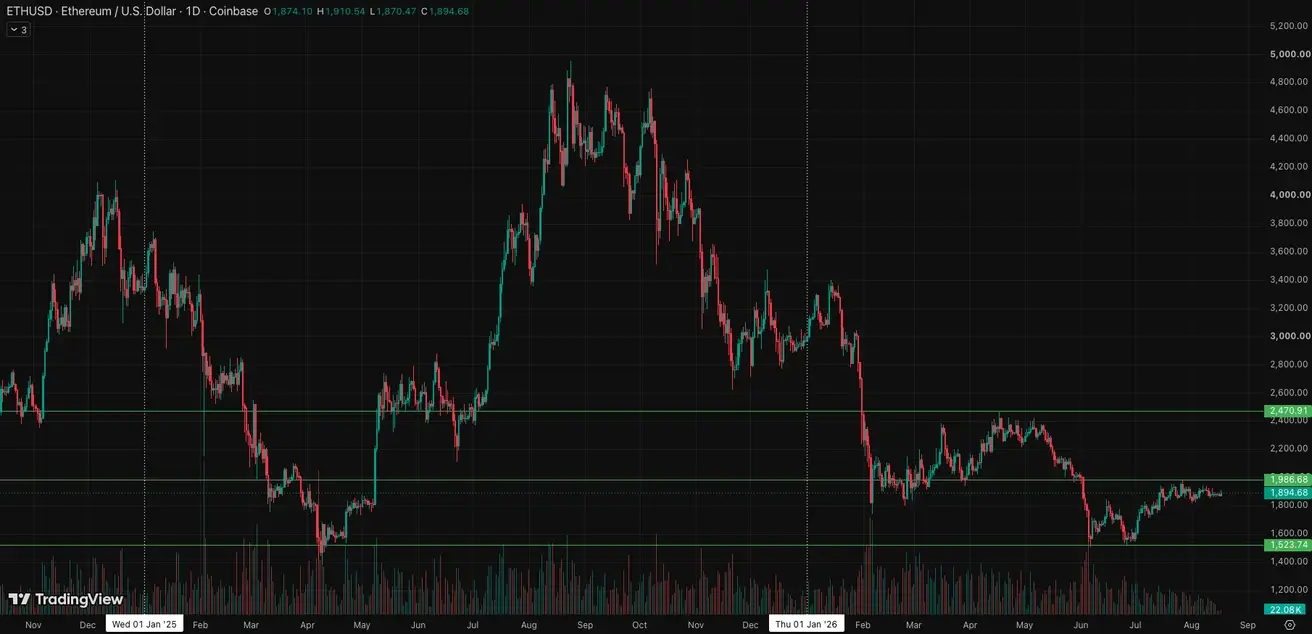
ETH Futures
Weekly performance: -1.83% (week close: $1,874.13); year-to-date: -36.98%.
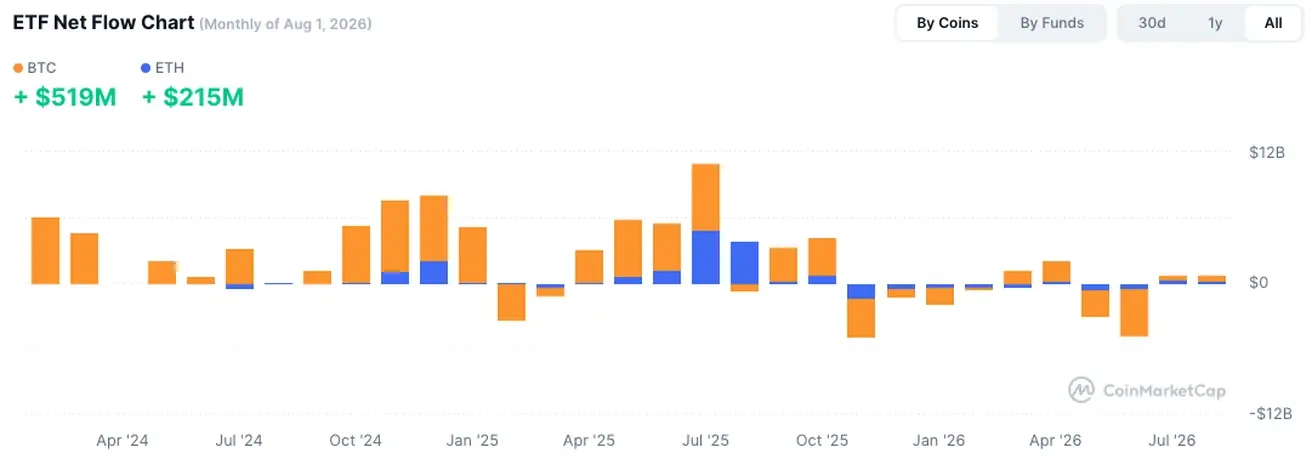
Total Cryptocurrency Market Capitalization
Total crypto market capitalization: $2.18 trillion (vs $2.22 trillion a week earlier) (coinmarketcap.com).
Crypto asset market shares:
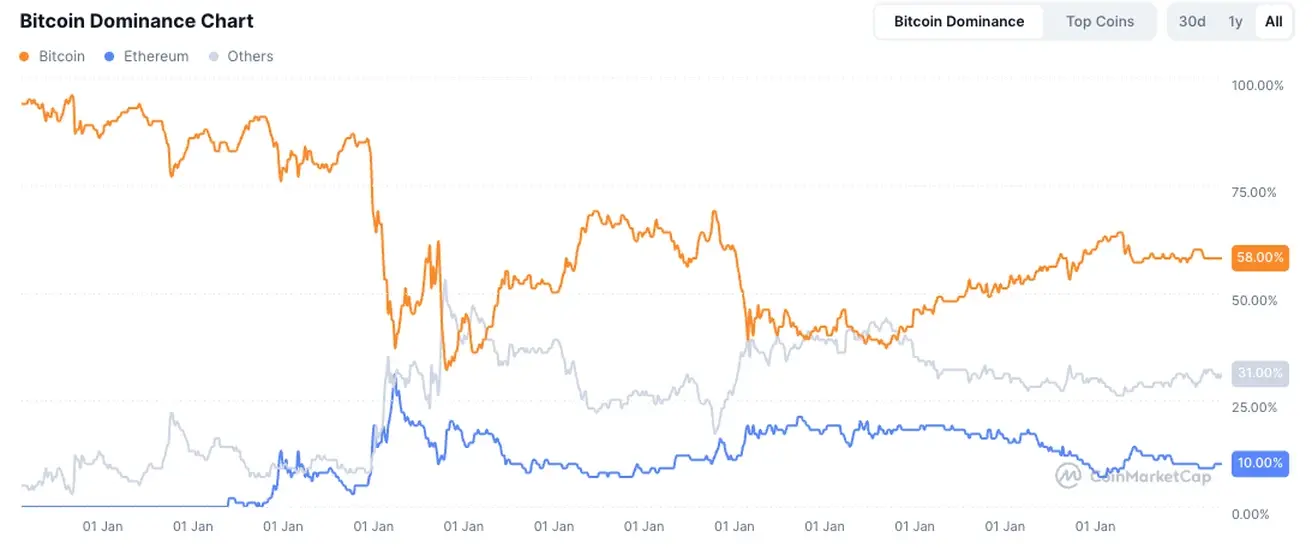
- Bitcoin: 58.5% (previous: 58.9%);
- Ethereum: 10.5% (previous: 10.4%);
- Others: 31.0% (previous: 30.7%).