Русский
 Қазақша
 Eesti
EestiAugust 17 – August 23, 2026: Weekly economic update
Key market updates

Key Takeaways:
- The policy rate remains unchanged, while the Fed’s rhetoric remains cautious;
- Monetary policy remains moderately restrictive;
- U.S. macroeconomic data continue to support a soft-landing scenario: inflation risks are increasing, the labor market is cooling without signs of recession, and current conditions do not yet warrant a rate cut.
INFLATION: CONSUMER PRICE INDEX (JULY):
- Core CPI (MoM): 0.2% (previous: 0.0%).
- Core CPI (YoY): 2.5% (previous: 2.6%).
- CPI (MoM): 0.1% (previous: -0.4%).
- CPI (YoY): 3.4% (previous: 3.5%).
PRODUCER PRICE INDEX (JULY):
- PPI (MoM): 0.0% (previous: -0.3%).
- Core PPI (MoM): 0.2% (previous: 0.2%).
INFLATION EXPECTATIONS (MICHIGAN) (JUNE):
-
12-month Inflation Expectations: 4.3% (previous: 4.2%).
-
5-Year Inflation Expectations: 3.3% (previous: 3.3%).
GDP (U.S. Bureau of Economic Analysis, BEA) — Q2 2026 annualized growth rate, preliminary: +1.5% (Q1 2026: +2.1%); forecast: 2.1%
GDPNow (the Atlanta Fed’s real-time estimate of official GDP growth ahead of release (Q3 2026)): 4.3% (previous: 5.8%).
LABOR MARKET (BLS) (JULY)
- Unemployment Rate: 4.1% (previous: 4.2%).
- Continued Jobless Claims: 1.799K (previous: 1.777K).
- Initial Jobless Claims: 206K (previous: 209K).
- Nonfarm Payrolls (NFP): -23K (previous: 57K).
- Private Nonfarm Payrolls: 30K (previous: 49K).
- Average Hourly Earnings (YoY): 3.2% (previous: 3.4%).
- JOLTS Job Openings: 6.866 million (previous: 6.922 million).
BUSINESS ACTIVITY INDEX (PMI) (JULY): (Above 50 indicates expansion; below 50 indicates contraction)
- Services PMI: 56.8 (previous: 54.6).
- Manufacturing PMI: 53.2 (previous: 53.8).
- Composite PMI: 56.0 (previous: 54.5).
Conference Board Leading Economic Index (LEI): 0.2 (prior: -0.1)
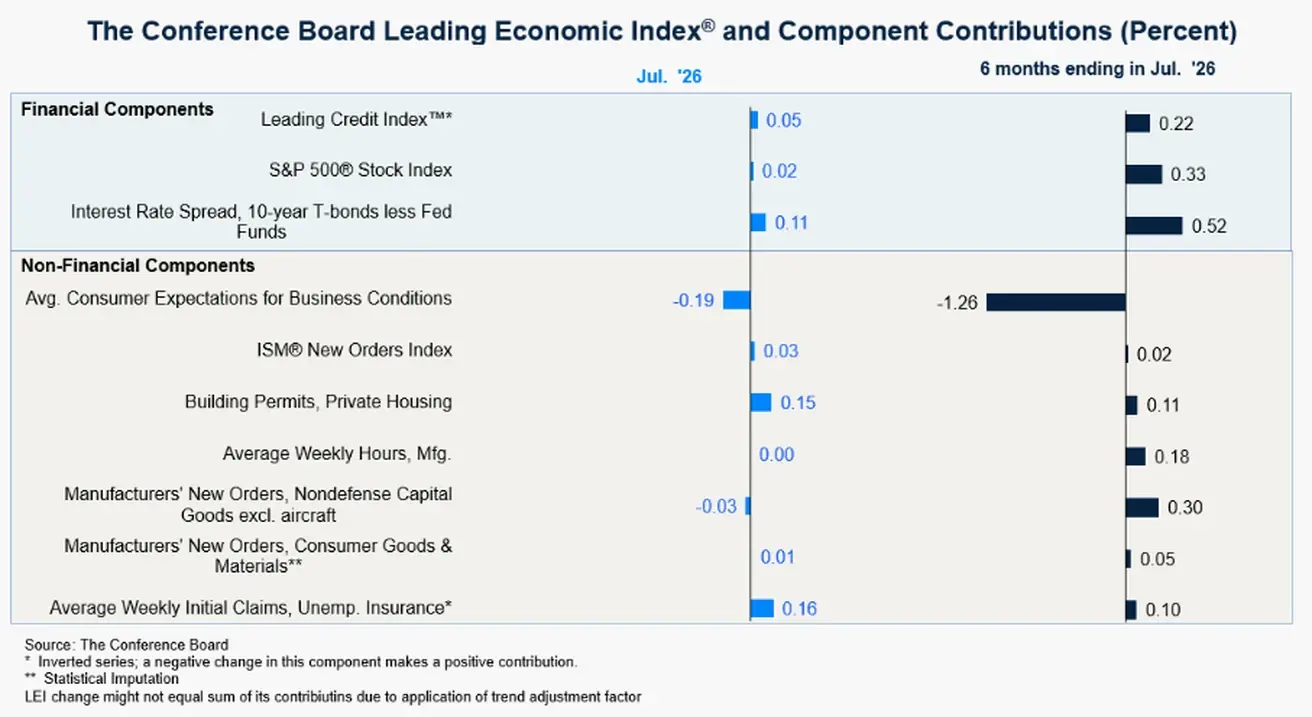
The Leading Economic Index (LEI) provides an early indication of significant turning points in the business cycle and where the economy is heading in the near term. The Coincident Economic Index (CEI) shows the current state of the economy.
The leading, coincident, and lagging indices are essentially composite averages of leading, coincident, and lagging indicators. They summarize common turning-point patterns in economic data more clearly and convincingly than the individual components, largely because they smooth out the volatility of those components.
In the component breakdown, consumer expectations made the largest negative contribution, while consumer spending remains high. Despite weak expectations, consumers are still spending.
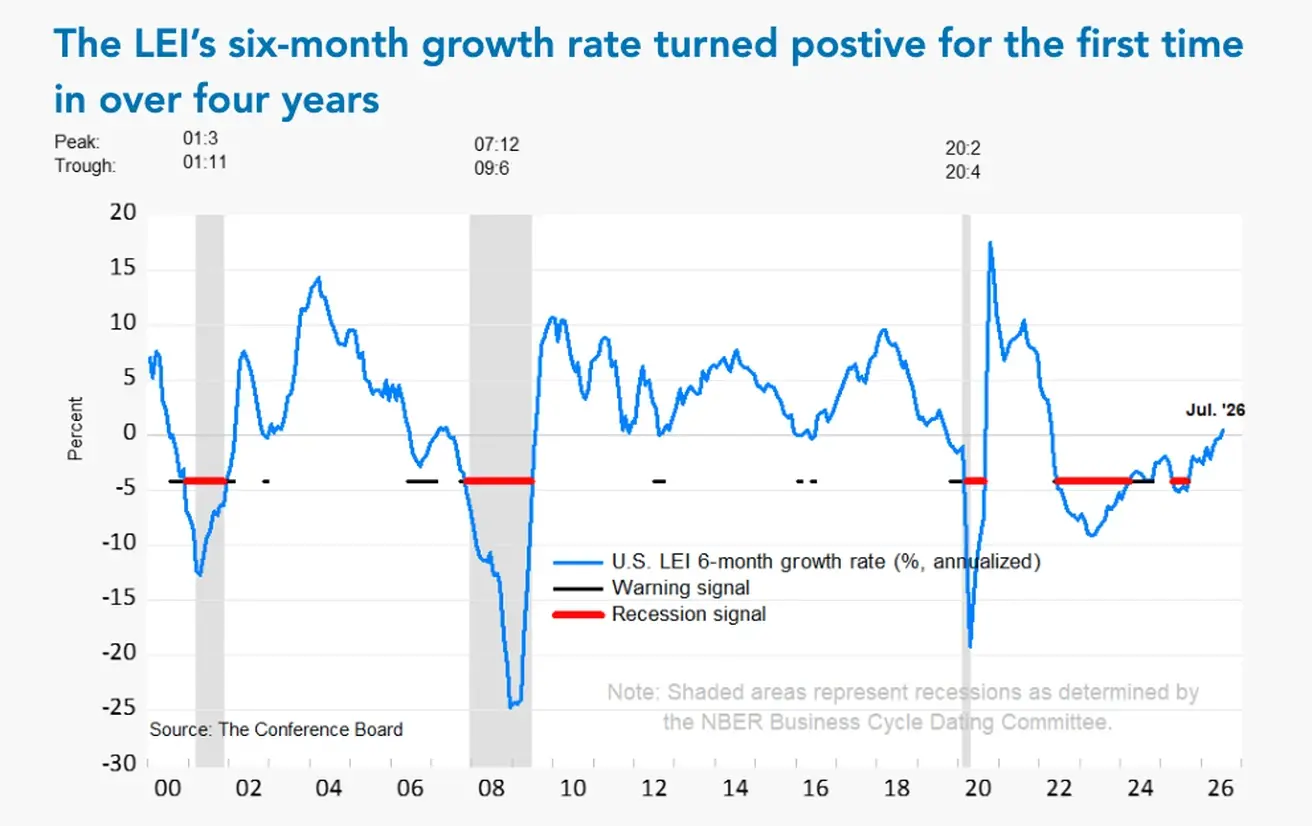
What's particularly interesting here is that in 2022–2024 the six-month growth rate of the LEI stayed below the recession-signal threshold (shown in red), yet no recession ever materialized, and the indicator now points to stabilizing and improving prospects for economic activity.
MONETARY POLICY
According to the U.S. Treasury Department, the budget deficit in July 2026 came in at -$432 billion vs. a deficit of $291 billion in the same month of 2025. Over the first 9 months of the current fiscal year, the deficit totaled -$1,799 billion. The federal government operates on a fiscal year that begins October 1.
The largest spending categories for October–July: 1st place – Social Security (1.384trillion),2ndplace–Medicare(0.955 trillion), 3rd place – federal debt servicing costs ($0.931 trillion).
The projected annual interest expense on federal government debt has reached a record $1.38 trillion, roughly 4.2% of GDP — the highest percentage since 1997.
Commentary from investment and research houses warning that high long-term yields pose a risk to the U.S. economy has increasingly appeared in the information space.
U.S. Treasury Secretary Scott Bessent stepped in to reassure markets, saying Washington is prepared to expand buybacks of long-term Treasury bonds (an additional source of demand) and will present a new fiscal consolidation initiative in the coming days. According to him, the Trump administration intends to reduce the deficit by cracking down on fraud and inefficient spending.
The 30-year yield at the 5.30% level has likely become a red line for the U.S. Treasury.
YIELDS AND SPREADS
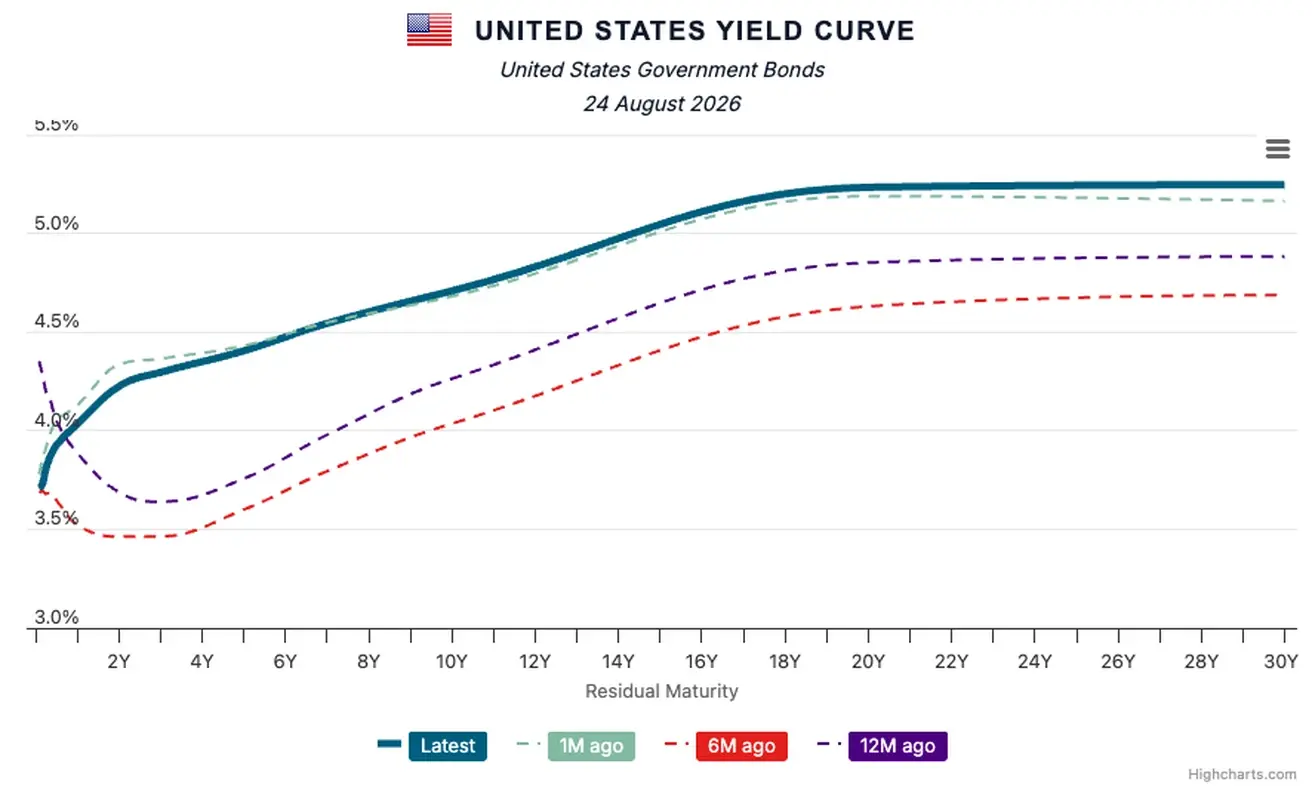
- Market Yield on U.S. Treasury Securities at 10-Year Constant Maturity: 4.71% (previous: 4.68%);
- 2-Year U.S. Treasury Yield: 4.23% (previous: 4.17%);
- ICE BofA BBB US Corporate Index Effective Yield: 5.59% (previous: 5.53%).
- The yield spread between 10-year and 2-year U.S. Treasury securities stands at 48 basis points (previous: 51 bps);
- The yield spread between 10-year and 3-month U.S. Treasury securities stands at 90 basis points (previous: 89 bps).
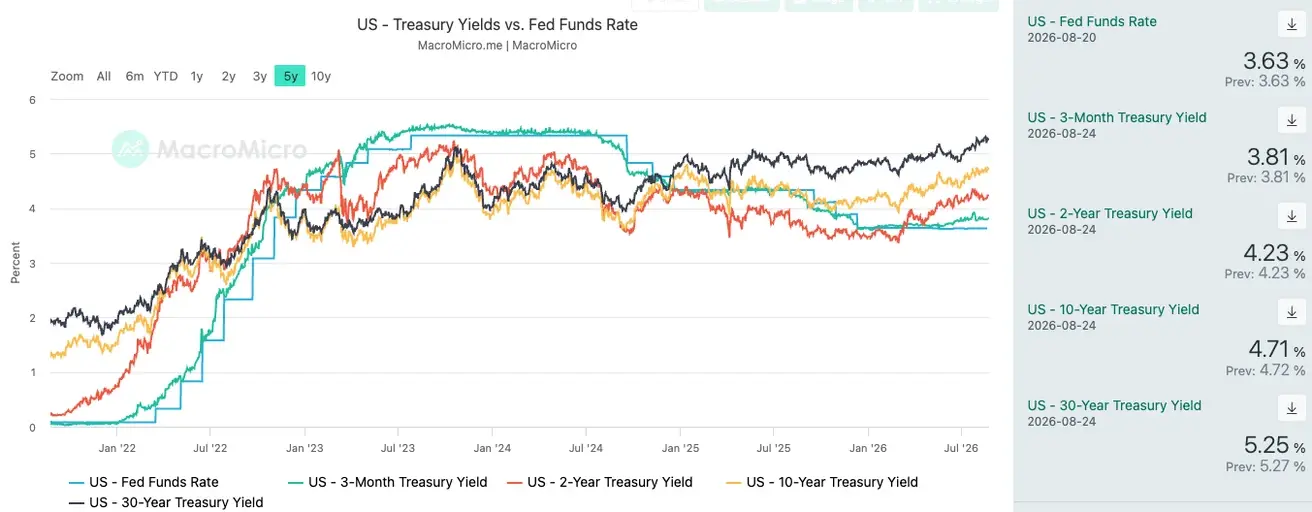
U.S. Treasury Yield Curve:
The cost of a 5-year U.S. Credit Default Swap (CDS) — a market-based measure of sovereign default insurance — 34.18 basis points, compared with 35.73 basis points a week earlier.
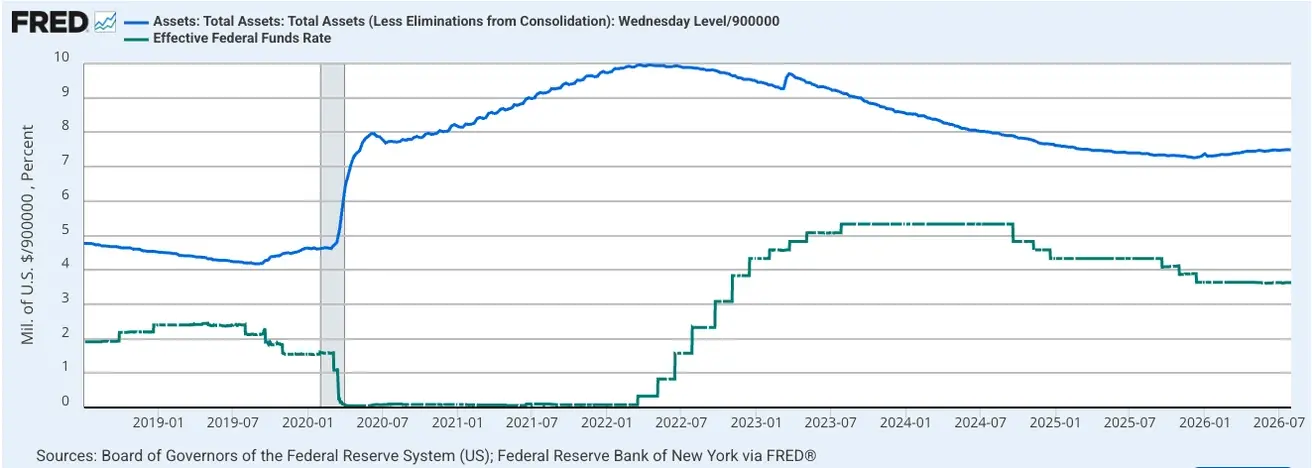
Effective Federal Funds Rate (EFFR): 3.50%–3.75%.
Federal Reserve Balance Sheet: $6.745 trillion, +3.21% since the suspension of quantitative tightening (QT), when the balance sheet stood at $6.535 trillion.
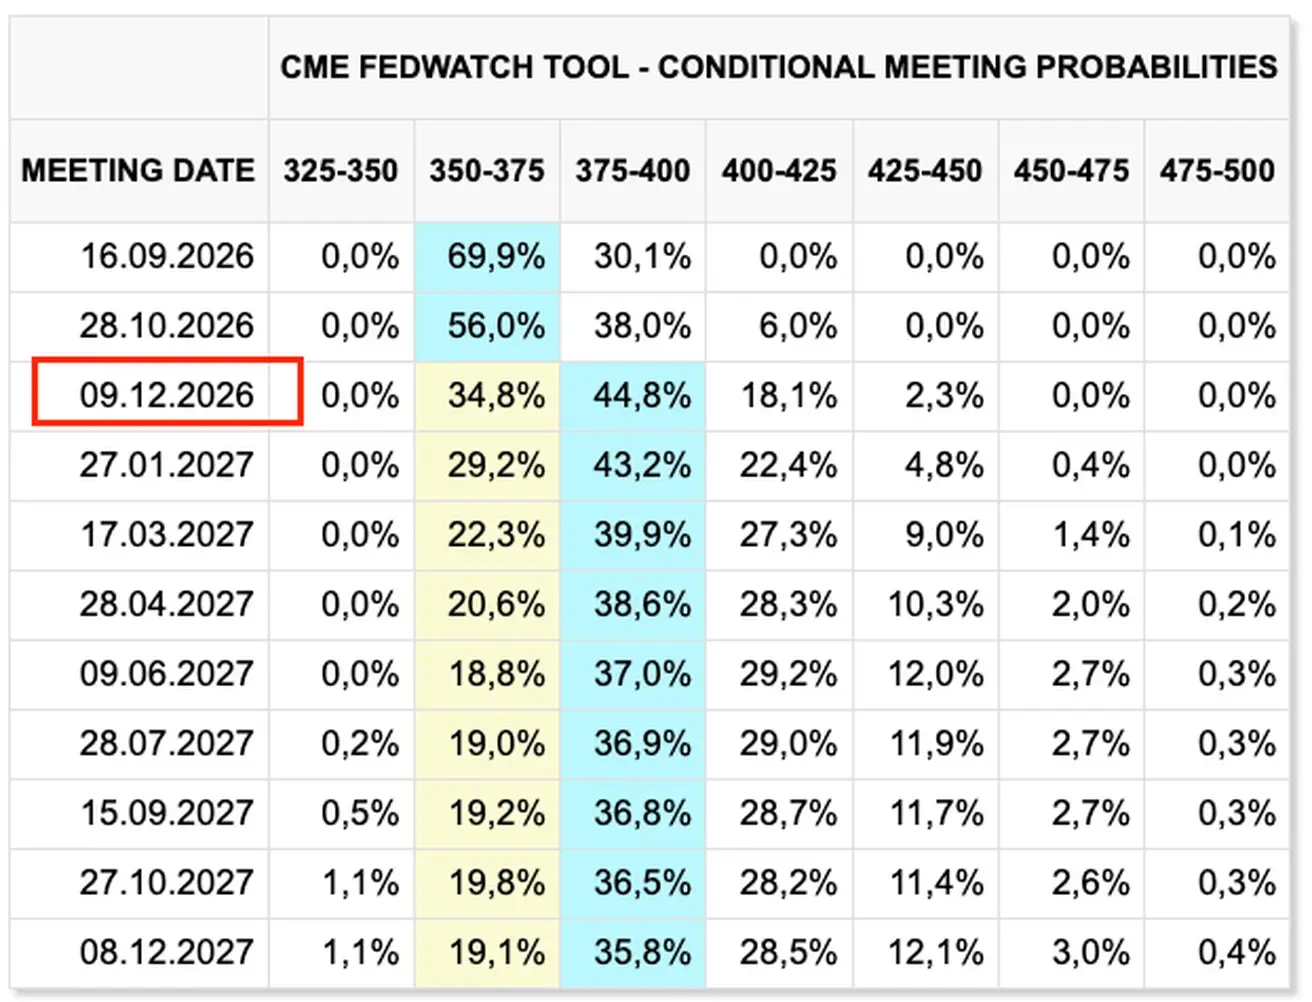
MARKET FORECAST FOR RATE (FEDWATCH)
For the next FOMC meeting (September 16) - expectations have improved; the implied market probability of a rate hike is 38.9% (week ago: 30.1%; three weeks ago: 64.5%):
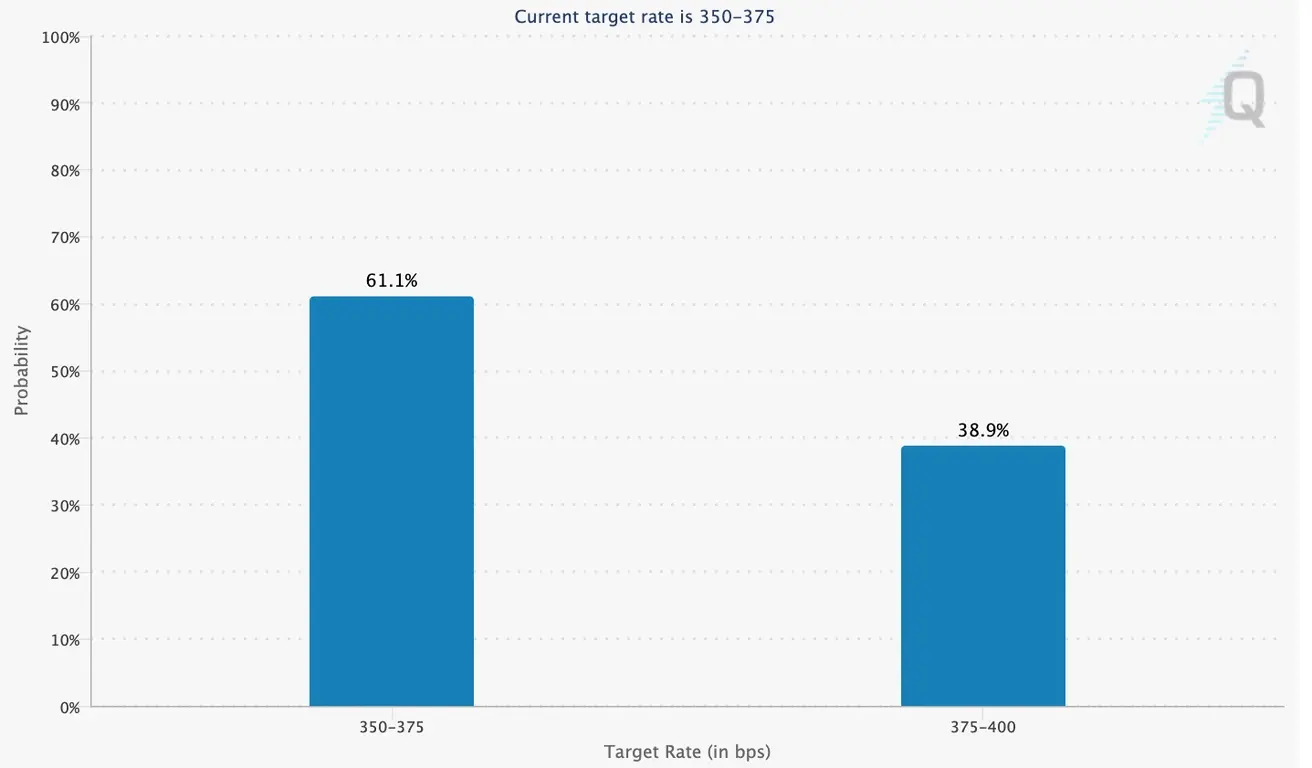
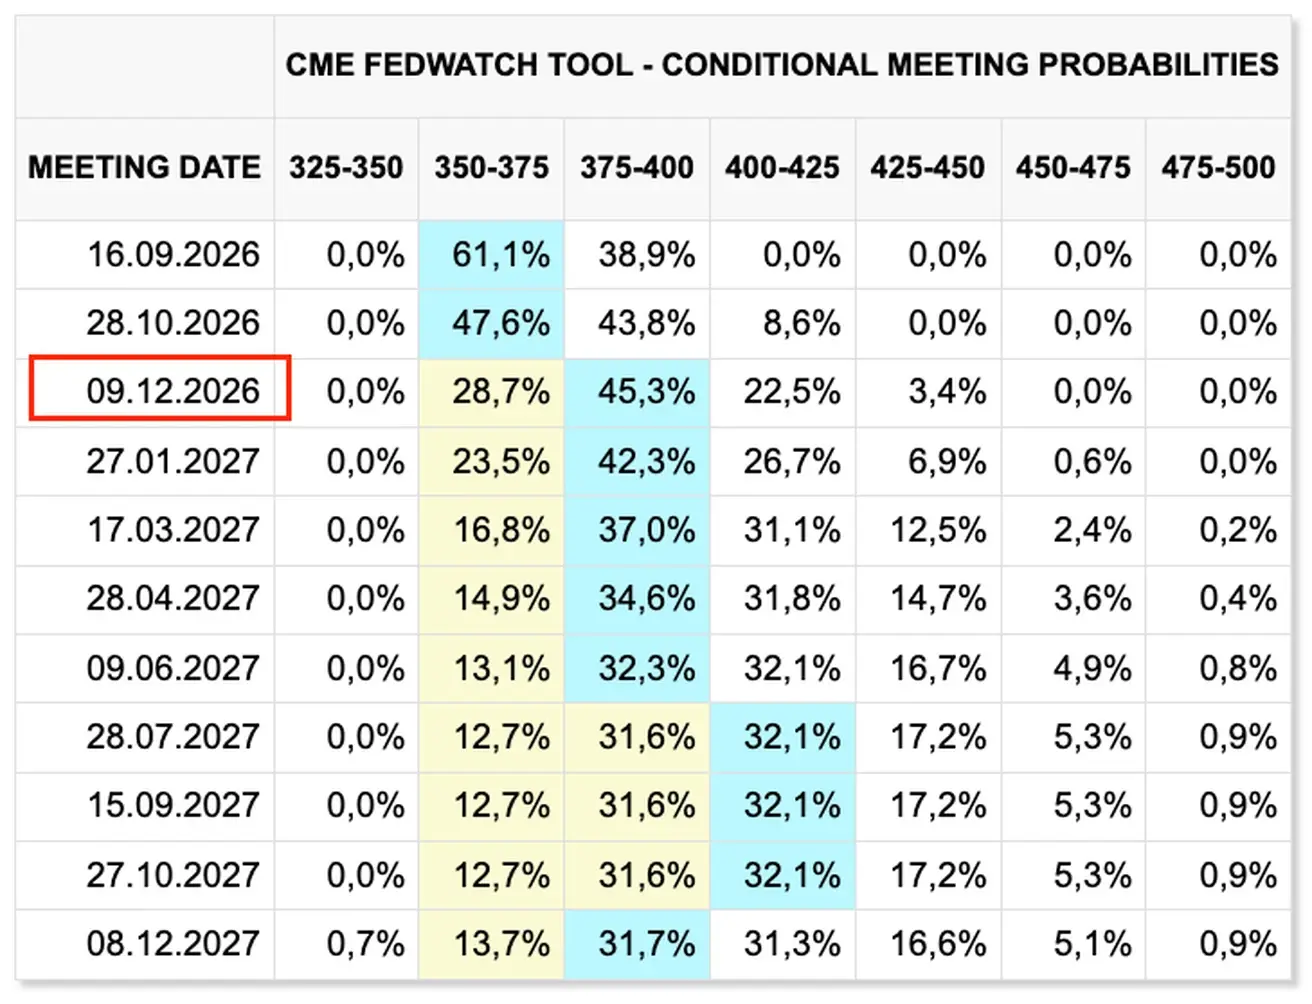
Over the next 12 months, the market now expects a single 25-basis-point rate hike, bringing the target range to 3.75%–4.00% by December of this year.
Today:
A week earlier:
BOND MARKET
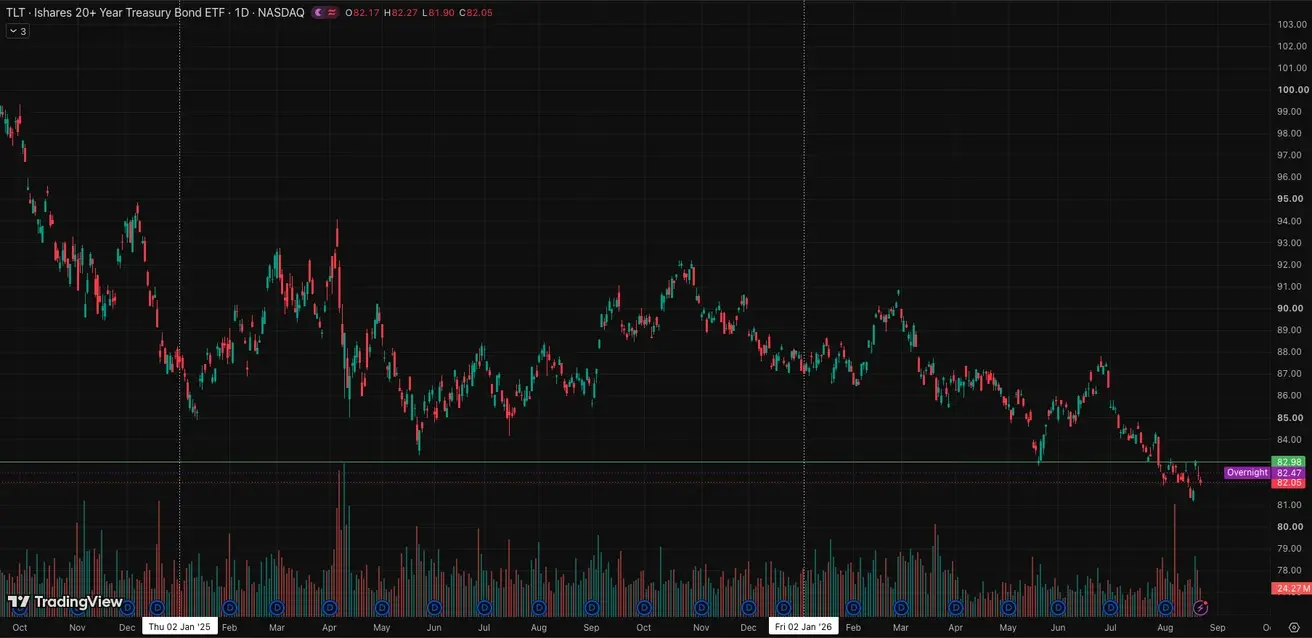
U.S. Treasury Bonds 20+ Years (TLT ETF): +0,01% for the week (weekly close: 82,05); -5,86% year-to-date.
SP500
Weekly performance: -1,43% (week-end close: 7674,37); year-to-date: +12,11%.
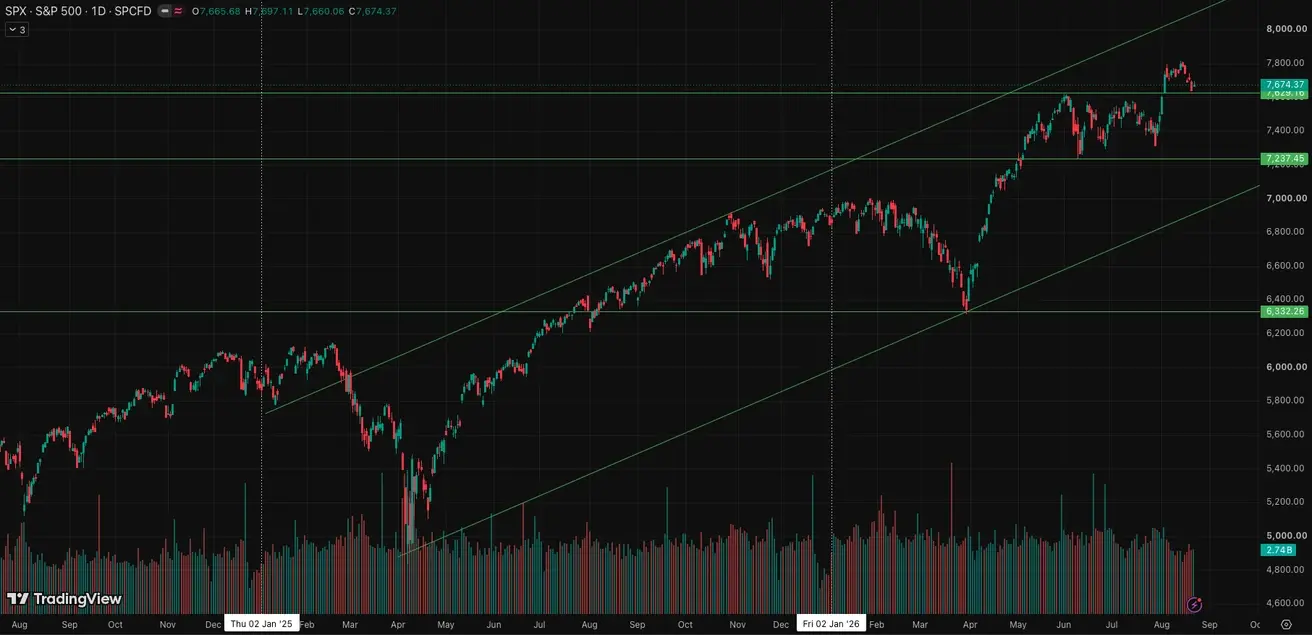
UBS Global Wealth Management raised its year-end S&P 500 target to 8,100.
NASDAQ100
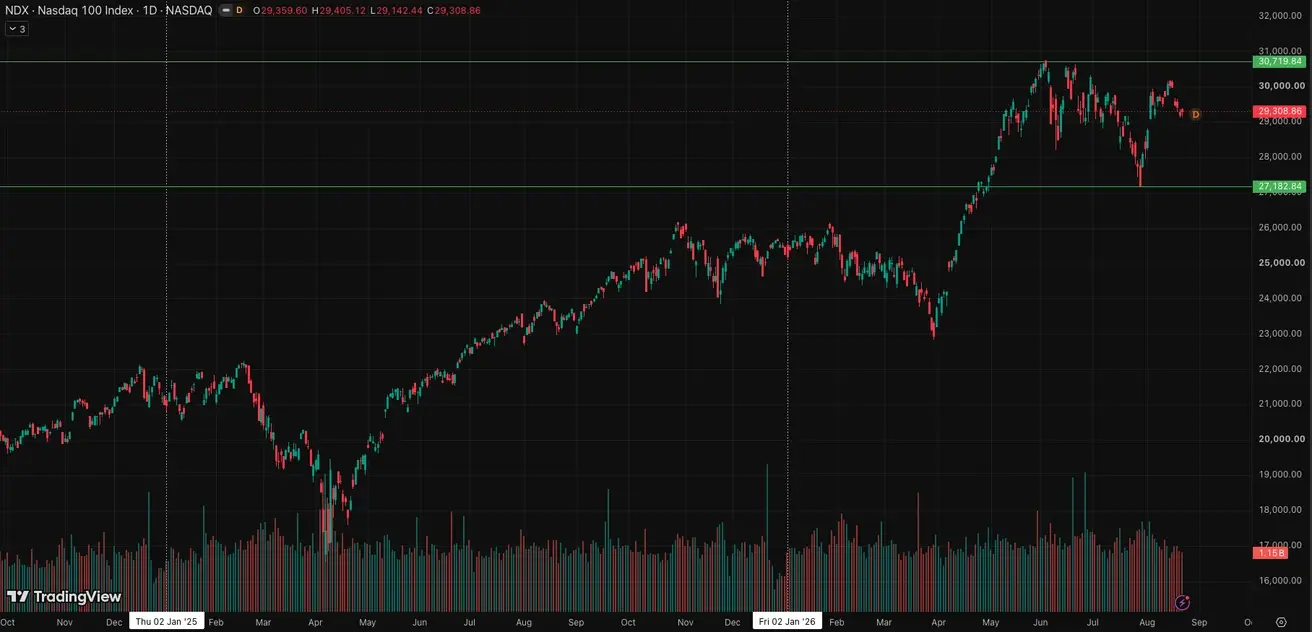
Weekly performance: -2,45% (week-end close: 29308,86); year-to-date: +16,08%.
VIX
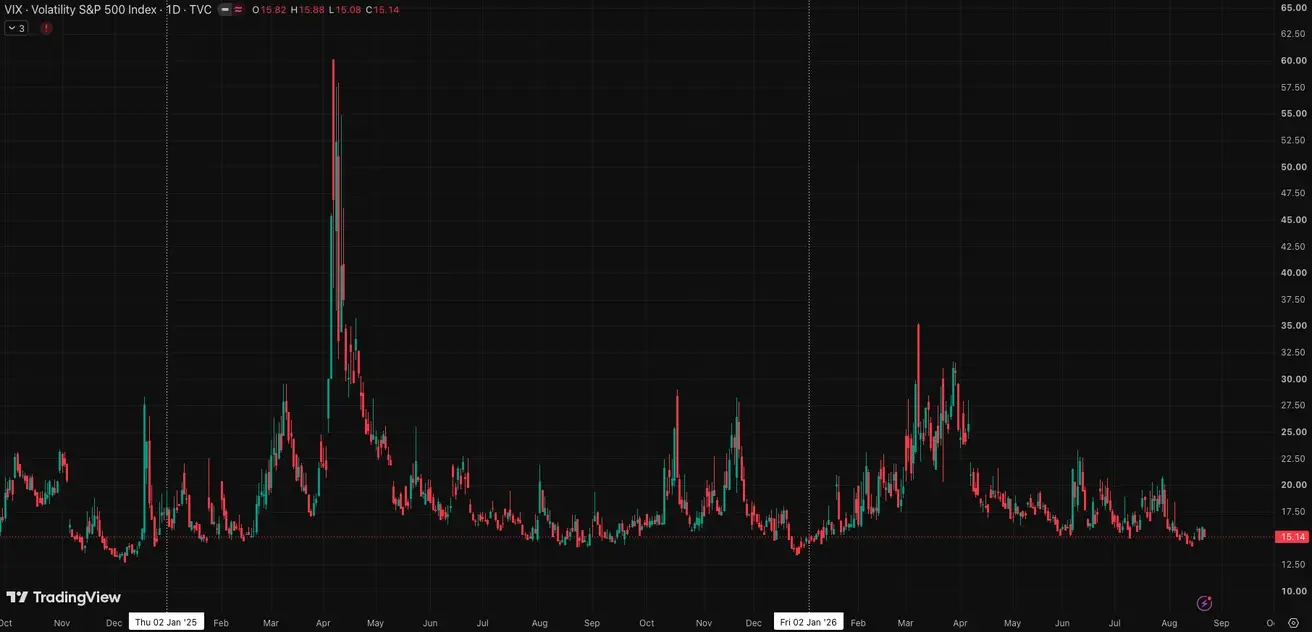
VIX (volatility index): week-end close at 15,14 points.
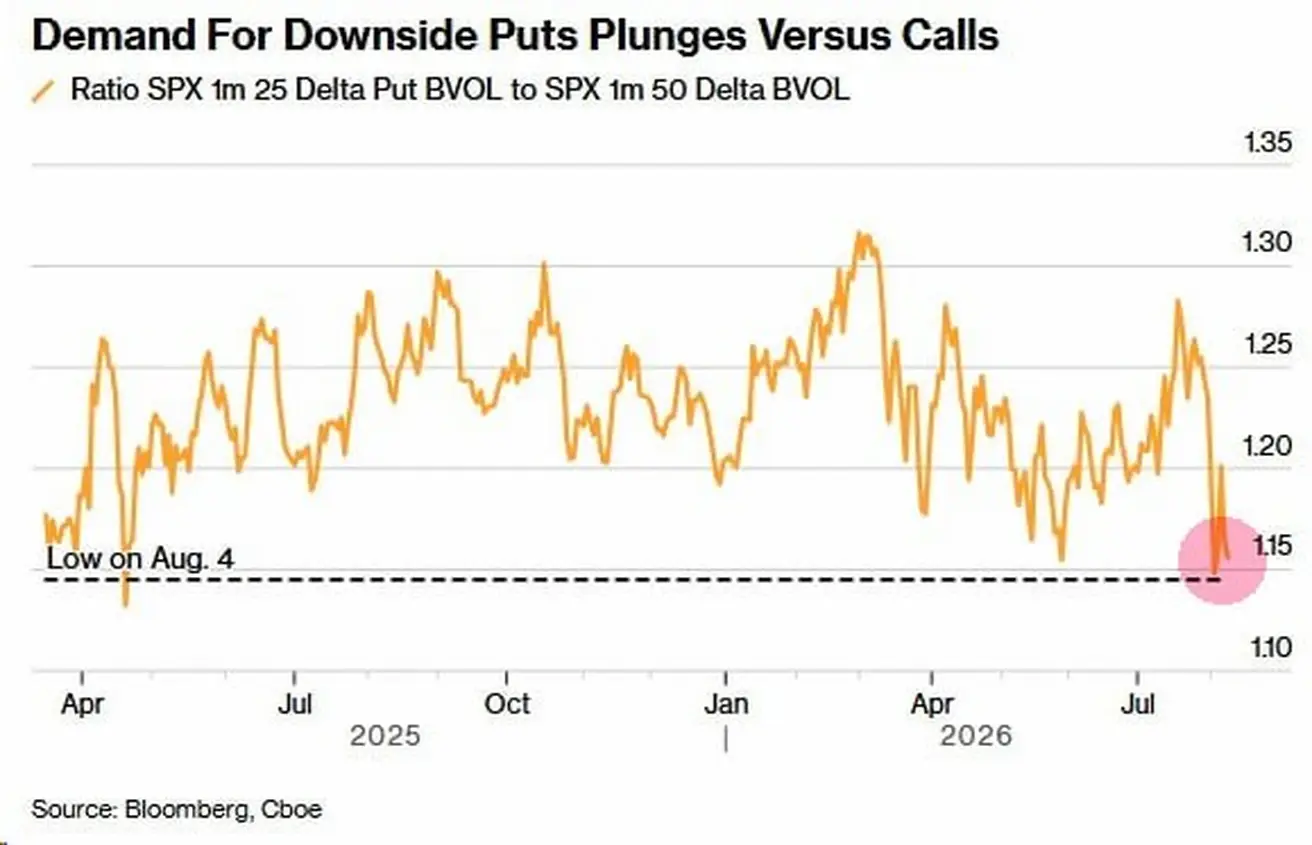
The chart shows the ratio of implied volatility for 25-delta monthly SPX put options to that of 50-delta options. The reading has dropped to around 1.15, close to the early-August lows. This means demand for downside protection has fallen sharply. For the stock market, this is a short-term positive signal — participants aren't pricing in a significant decline (this indicator doesn't reflect longer-term expectations).
Eurozone
- The ECB raised interest rates, while maintaining a hawkish stance as inflationary risks continue to increase;
- Against the backdrop of the conflict in the Middle East, the ECB revised its GDP forecasts downward and raised its inflation projections for the coming years.
Interest Rates
- Deposit Facility Rate: 2.25% (previous: 2.0%);
- Marginal Lending Facility Rate: 2.65% (previous: 2.4%) — the rate at which banks can obtain overnight funding from the central bank;
- Main Refinancing Rate (Policy Rate): 2.40% (previous: 2.15%).
Inflation: Consumer Price Index (CPI) (July)
- Core CPI (YoY): 2.5% (previous: 2.4%);
- Headline CPI: 0.2% (MoM) (previous: -0.1%); 2.9% (YoY) (previous: 2.8%).
Lane (ECB): Eurozone inflation will stay above 3% through the end of this year.
GDP (Q2 2026 Preliminary Estimate)
- QoQ: 0.4% (previous: -0.2%);
- YoY: 1.0% (previous: 0.3%).
Unemployment Rate (June)
- 6.3% (previous: 6.3%).
Industrial Production (June)
- MoM: 0.0% (previous: 0.3% revised);
- YoY: 1.67% (previous: 1.37%).
Purchasing Managers’ Index (PMI) (July)
- Services PMI: 51.7 (previous: 51.6);
- Manufacturing PMI: 52.8 (previous: 52.0);
- S&P Global Composite PMI: 52.0 (previous: 51.9).
EURO STOXX 600 (FXXP1!)
Weekly performance: -0,65% (week-end close: 654,9); year-to-date: 10,25%.
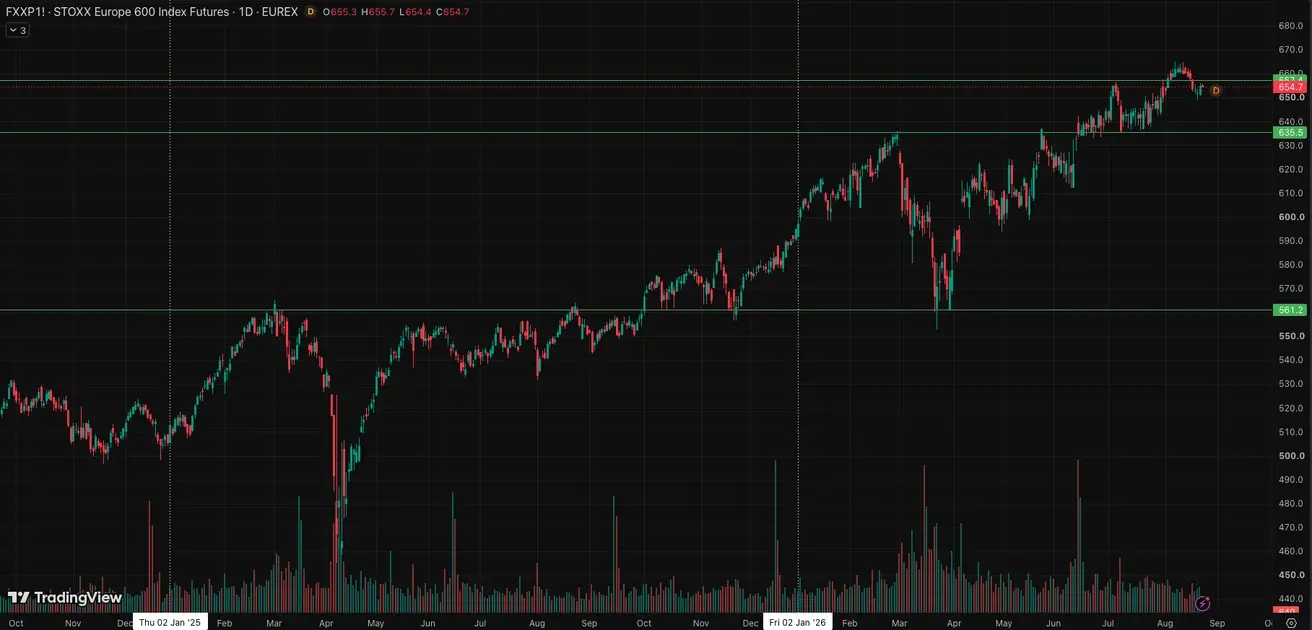
Goldman: raised its 12-month Euro Stoxx 600 target to 695 from 660.
China
China’s economy continues to stabilize, supported by strong export performance, while domestic demand and investment are gradually recovering. Policymakers remain measured and targeted in their approach to economic stimulus.
- Interest rates remain unchanged;
- Monetary policy remains accommodative;
- China reaffirmed its commitment to fiscal support for economic growth under its 2026 plan, including measures to stimulate domestic demand, optimize tax incentives and subsidies, and modernize industrial capacity.
Interest Rates
- 1-Year Loan Prime Rate (medium-term lending): 3.00%;
- 5-Year Loan Prime Rate (benchmark for mortgage lending): 3.50%.
Inflation Indicators (July)
- Consumer Price Index (CPI): -0.1% MoM (previous: -0.3%); 0.5% YoY (previous: 1.0%);
- Producer Price Index (PPI): 3.5% YoY (previous: 4.1%).
Trade Data
- Imports (June): 27.5% YoY (previous: 36.0%);
- Exports (June): 23.9% YoY (previous: 27.0%);
- Trade Balance (USD) (July): $112.5 billion (previous: $125.62 billion).
GDP (Q2 2026)
- QoQ: 0.9% (previous: 1.3%);
- YoY: 4.3% (previous: 5.0%).
Labor Market
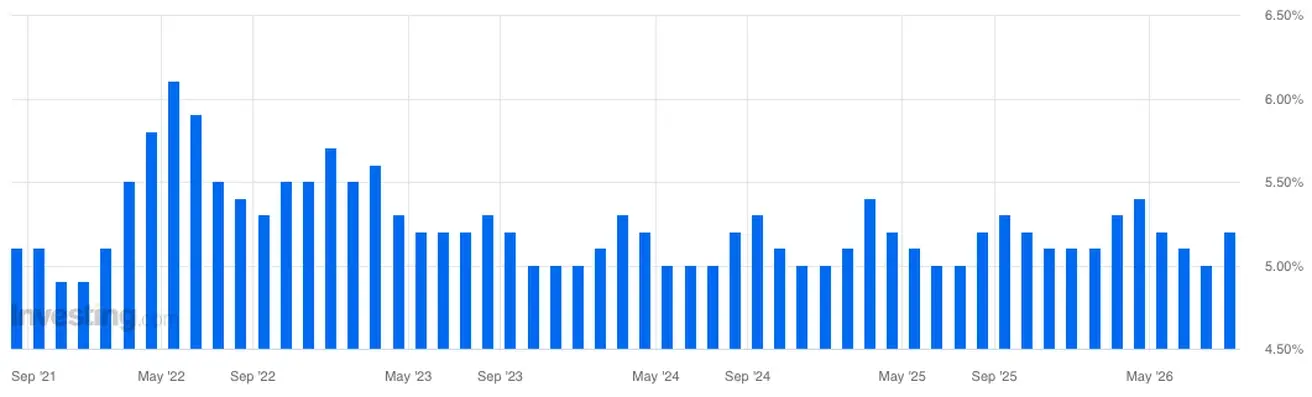
- Unemployment Rate (July): 5.2% (previous: 5.0%).
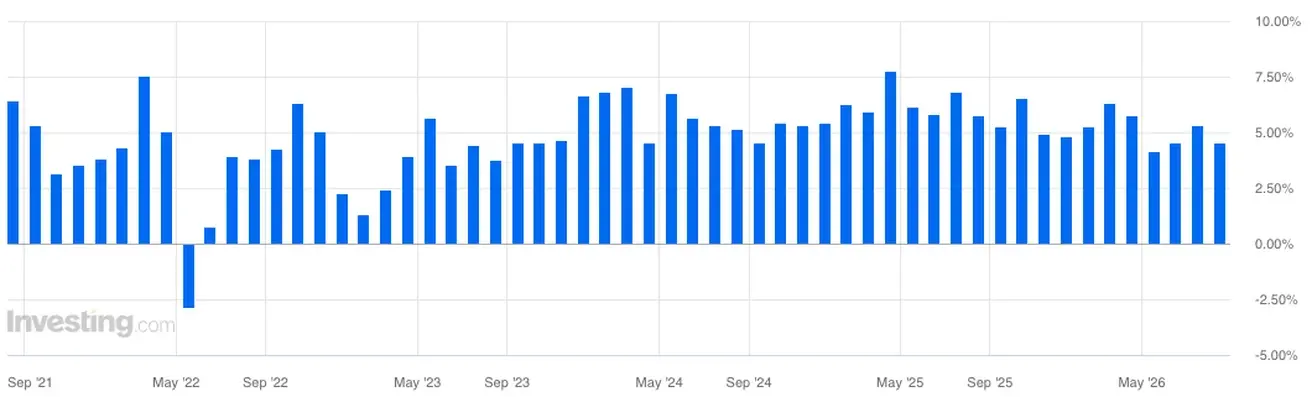
Industrial Activity
- Industrial Production (July, YoY): 4.5% (previous: 5.3%).
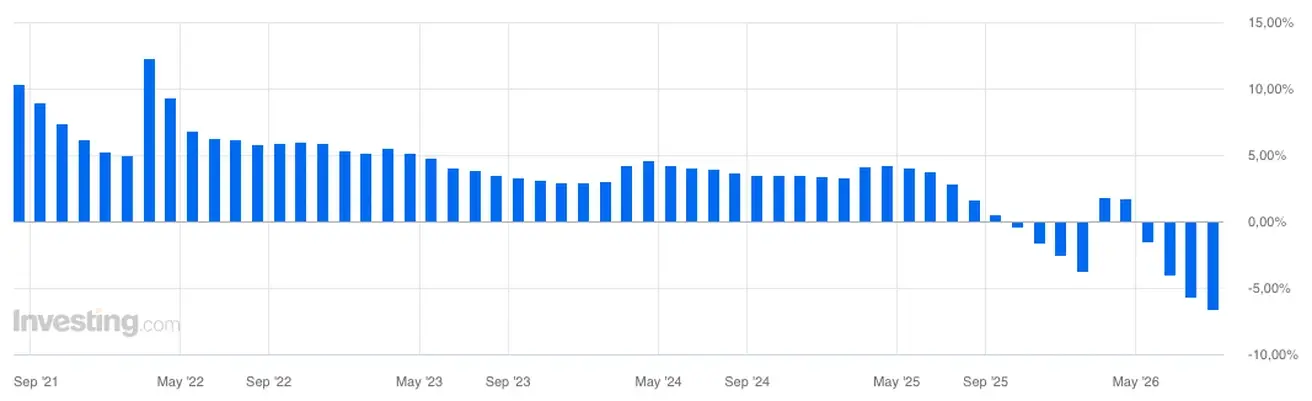
Fixed Asset Investment
- June, YoY: -6.7% (previous: -5.7%).
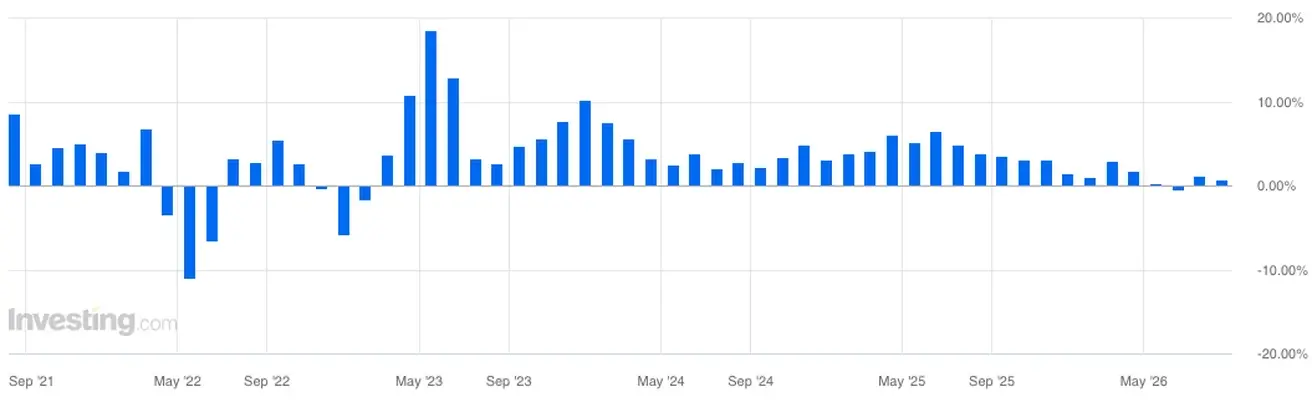
Retail Sales
- June, YoY: 0.6% (previous: 0.9%).
Purchasing Managers’ Indices (PMI) (May)
- Manufacturing PMI: 49.2 (previous: 50.3);
- Non-Manufacturing PMI: 49.0 (previous: 50.2);
- Composite PMI: 49.3 (previous: 50.6).
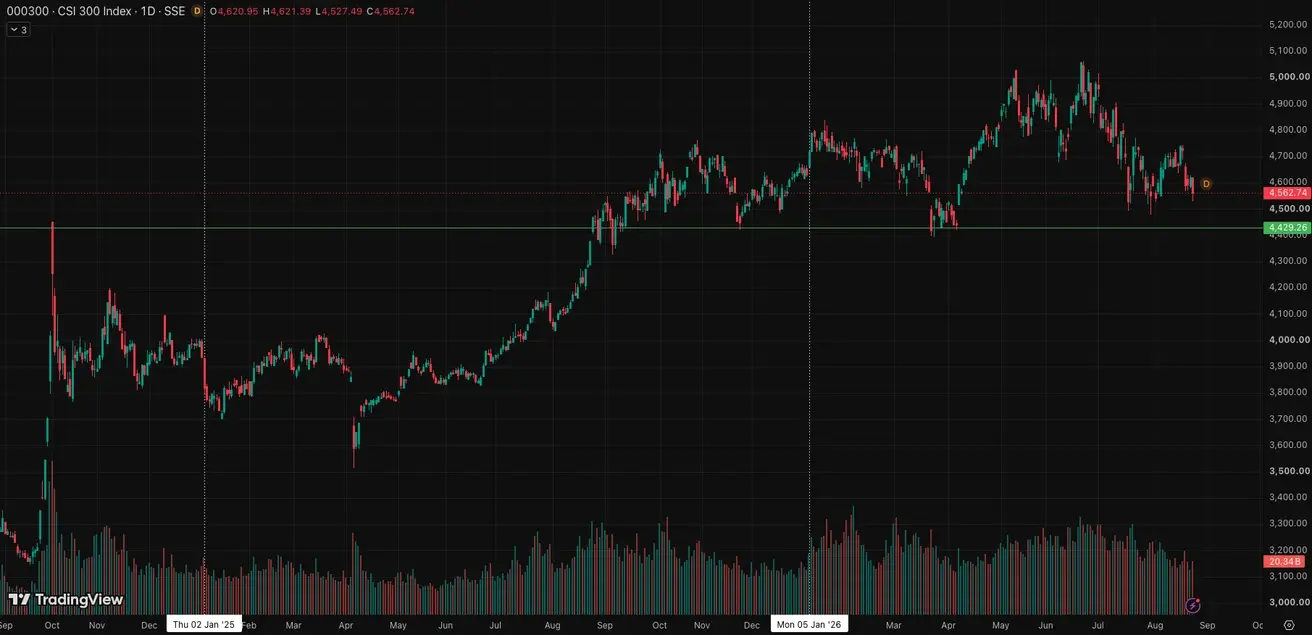
CSI 300 INDEX (000300.HK)
Weekly performance: -1,01% (week-end close: 4618,90); year-to-date: -0,92%.
GOLD FUTURES (GC)
Weekly performance: +5,09% (week close: $4624,5 per troy oz); year-to-date: +6,75%
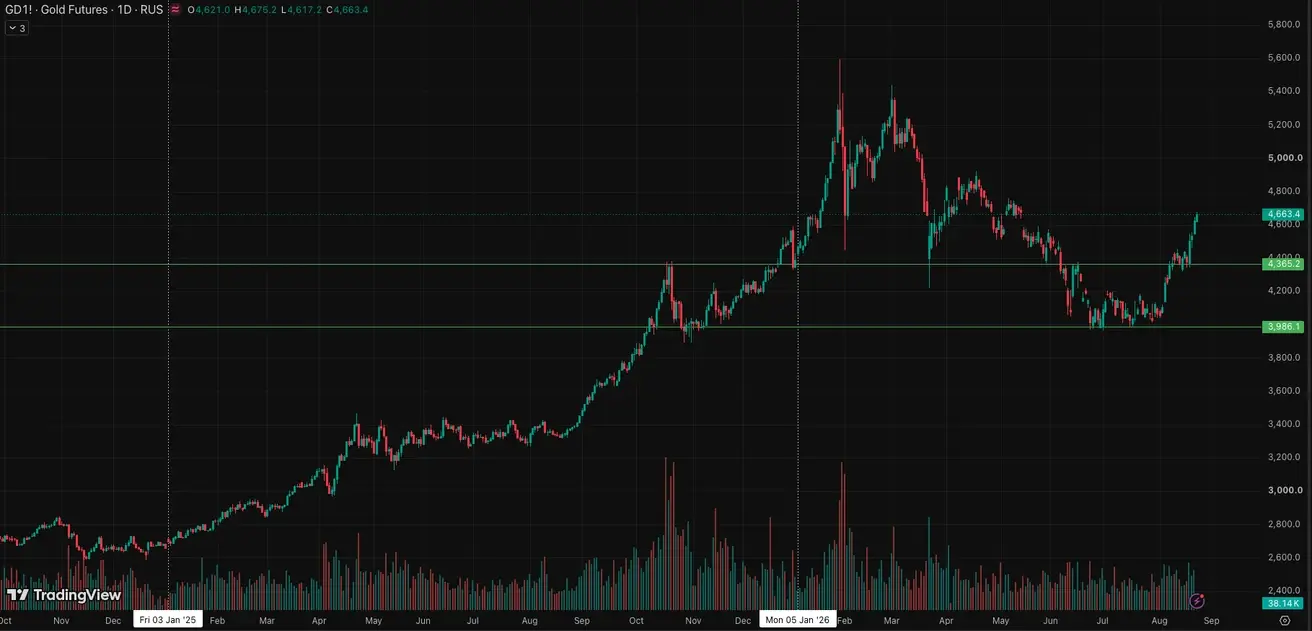
Morgan Stanley forecasts gold rising to $5,000 by 2027, but doesn't rule out reaching that level as early as this year.
OIL FUTURES
Weekly performance: +5,78% (week close: $87,06 per barrel); year-to-date: +51,65%
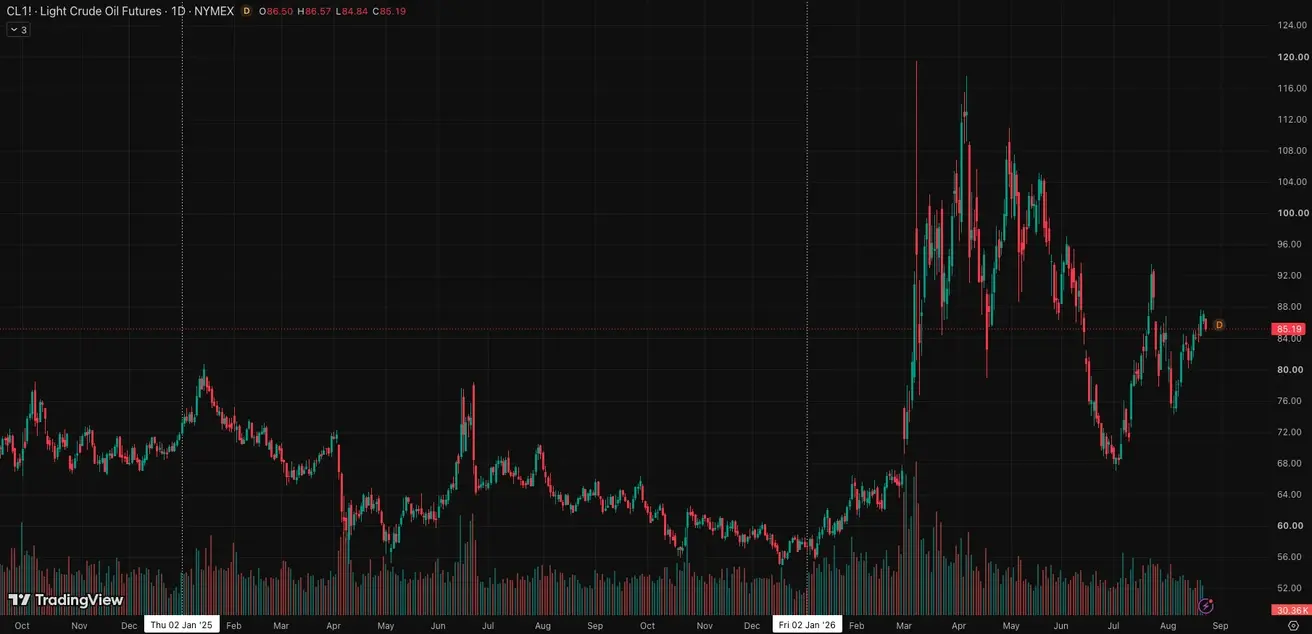
Trump is shifting strategy toward Iran, moving from a military approach to a full economic blockade. Saudi Arabia has likewise severed all economic ties with Iran.
Iran, for its part, has set a deadline of several weeks for the U.S. to fully implement the memorandum of understanding, and has announced that it is shifting from a defensive posture to a fully offensive one, with a readiness to escalate tensions in the Strait of Hormuz.
DOLLAR INDEX FUTURES (DX)
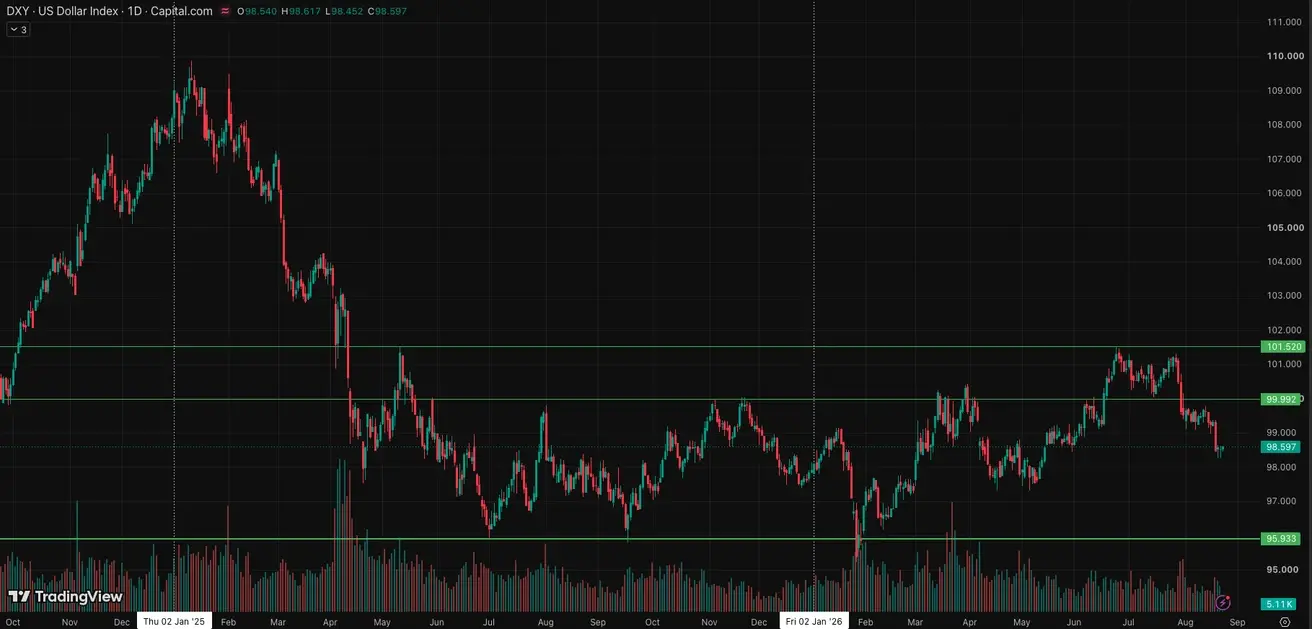
Weekly performance: -0,82% (week close: 98,507); year-to-date: +0,52%.
Crypto Market
At a White House meeting, U.S. President Donald Trump called on Congress to pass the long-awaited digital asset regulation bill, the Clarity Act. A vote is scheduled for September 16. However, many market participants and lawmakers doubt the bill will pass.
The Clarity Act is a comprehensive law that would establish the market structure for the U.S. cryptocurrency industry. Its main goal is to give the industry clear legal footing and divide responsibilities among regulators.
The CEO of Bitcoin Magazine, citing a White House official, reported that if the Senate ultimately fails to pass the CLARITY Act, the SEC and CFTC will jointly present their own clear rules for cryptocurrencies.
Trump also stated that plans to accumulate "significant" amounts of BTC and other cryptocurrencies were discussed at the meeting.
Amid the discussions, the crypto market posted strong gains, with record short-liquidation volumes.
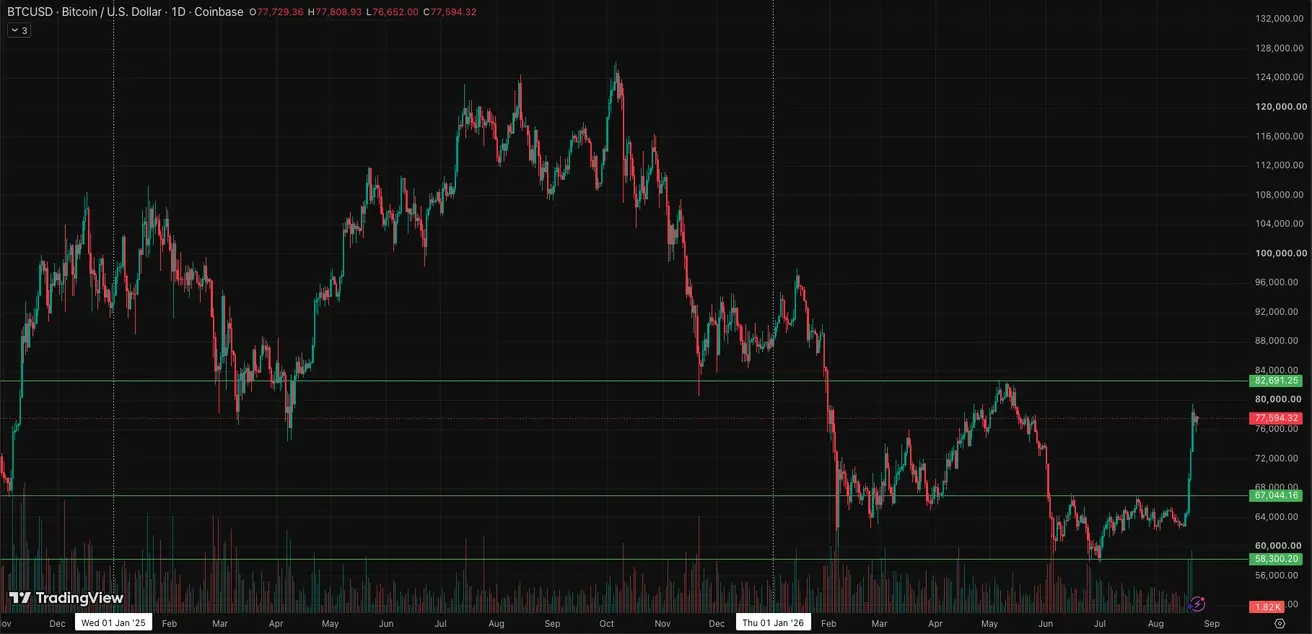
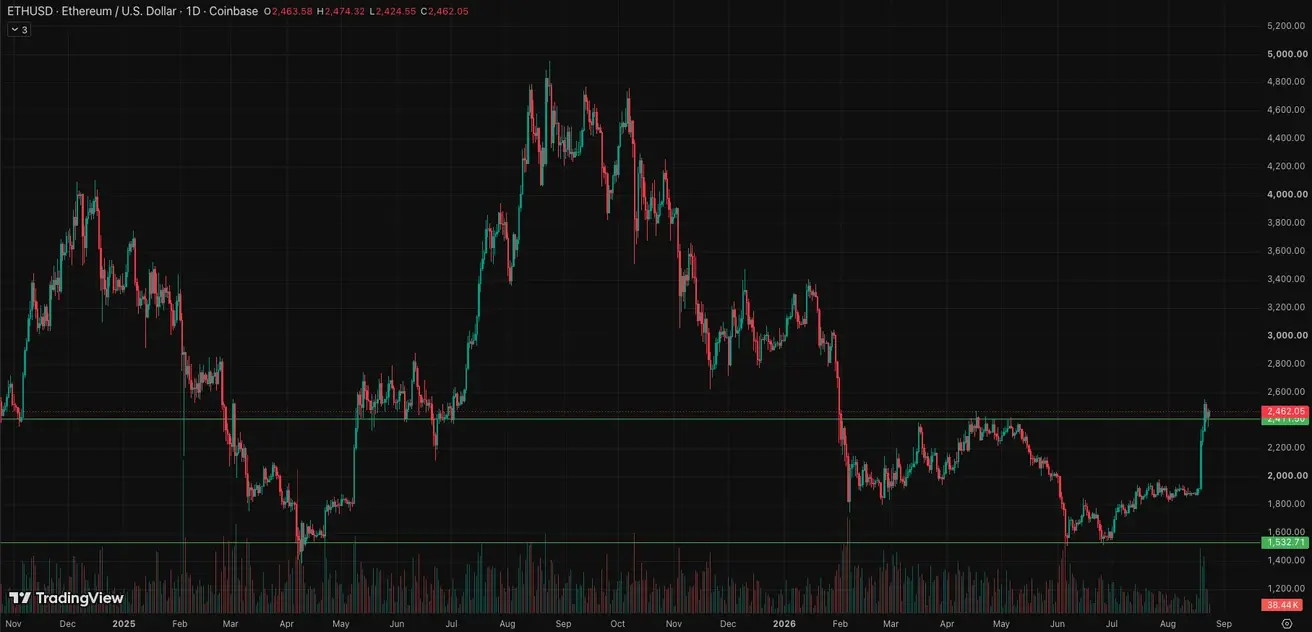
On August 19, a wave of forced short covering began: roughly $2.7 billion in short positions were liquidated over 24 hours. Bitcoin accounted for about $1.4 billion of that, and Ethereum for roughly $1.1 billion. More than $1 billion in BTC shorts were liquidated in about one hour alone.
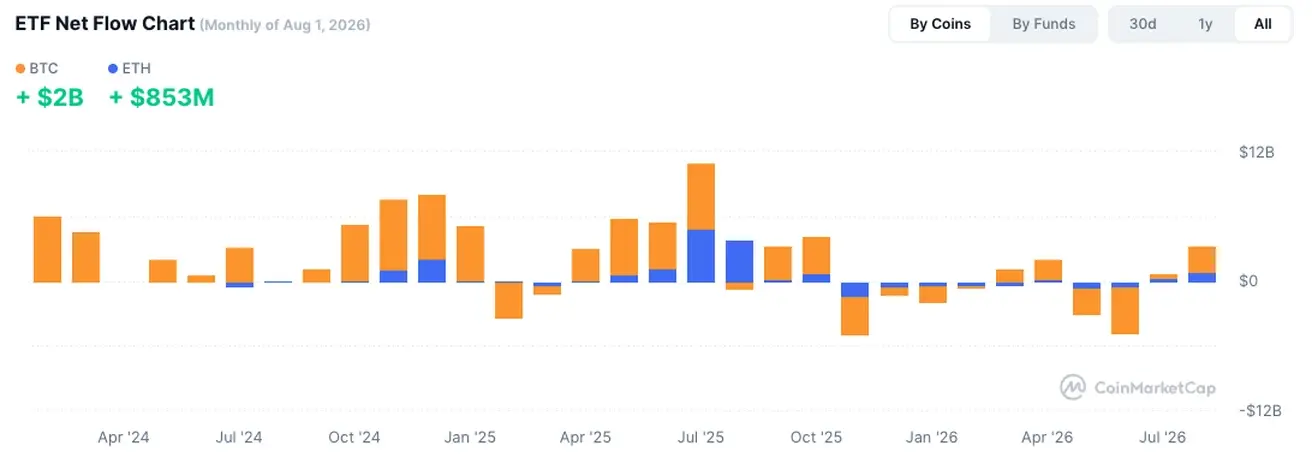
After liquidations of this size, some of the technical fuel for further gains has already been used up. Going forward, the key questions are whether net ETF inflows continue and whether short interest rebuilds following the short squeeze.
BTC FUTURES
Weekly performance: +23,70% (week close: $77729,36); year-to-date: -11,39%.
ETH FUTURES
Weekly performance: +31,44% (week close: $2463,39); year-to-date: -17,17%.
TOTAL CRYPTOCURRENCY MARKET CAPITALIZATION
Total crypto market capitalization: $2,63 trillion (vs $2,18 trillion a week earlier) (coinmarketcap.com).
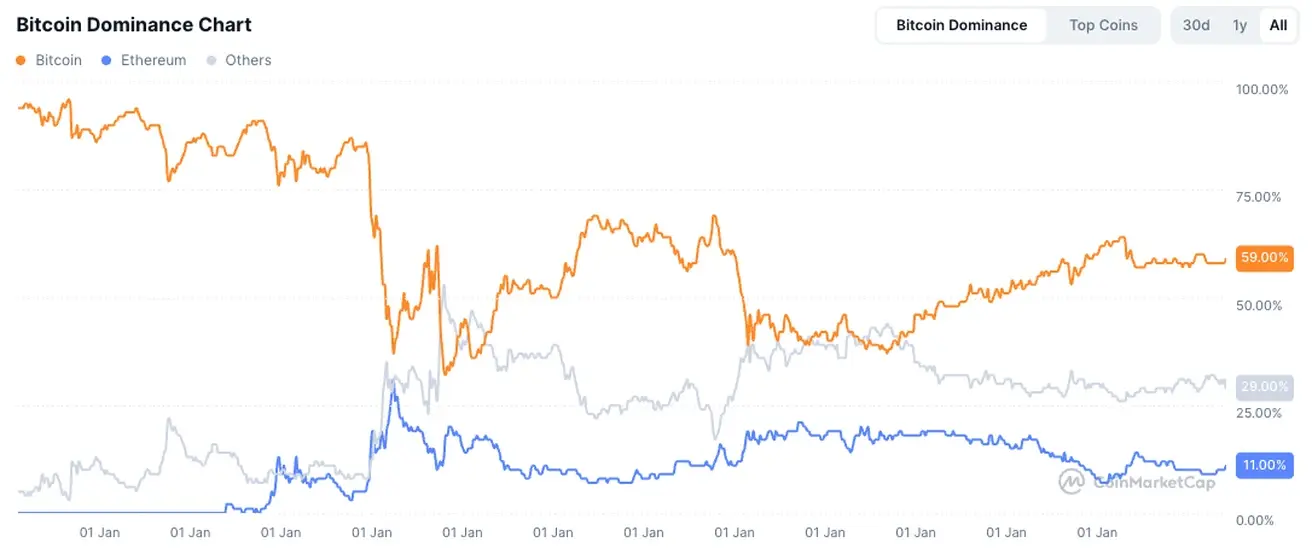
Crypto asset market shares:
- Bitcoin 59,3% (prev. (58,5%)
- Ethereum 11,3% (prev. 10,5%)
- Others 29,4% (prev. 31,0%)