Lietuvių
 Русский
 Қазақша
 Eesti
EestiJanuary 12–18, 2026: Weekly economic update
Key market updates

Over the past week, market sentiment remained moderately positive amid the release of key U.S. macroeconomic data.
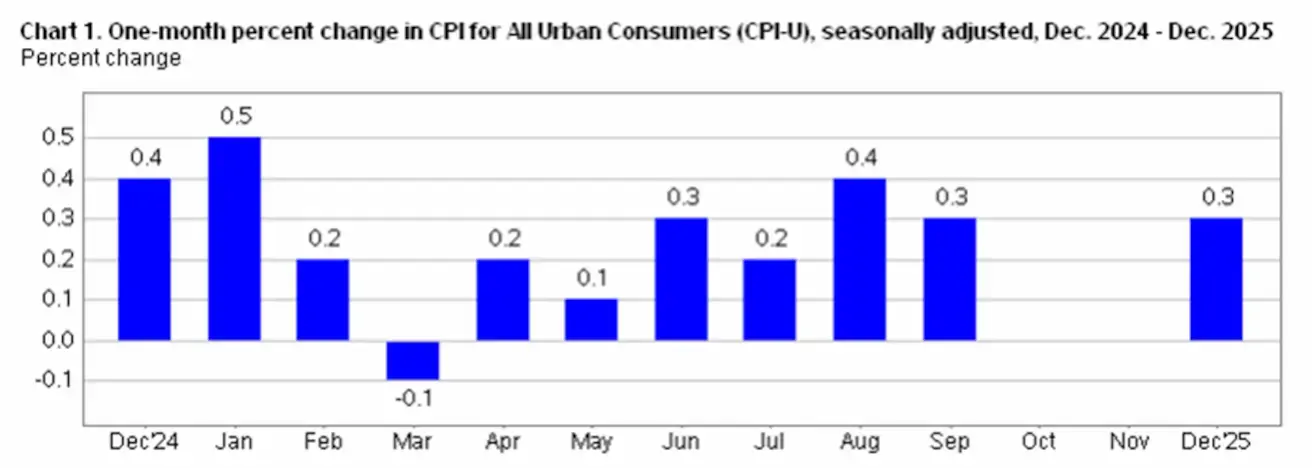
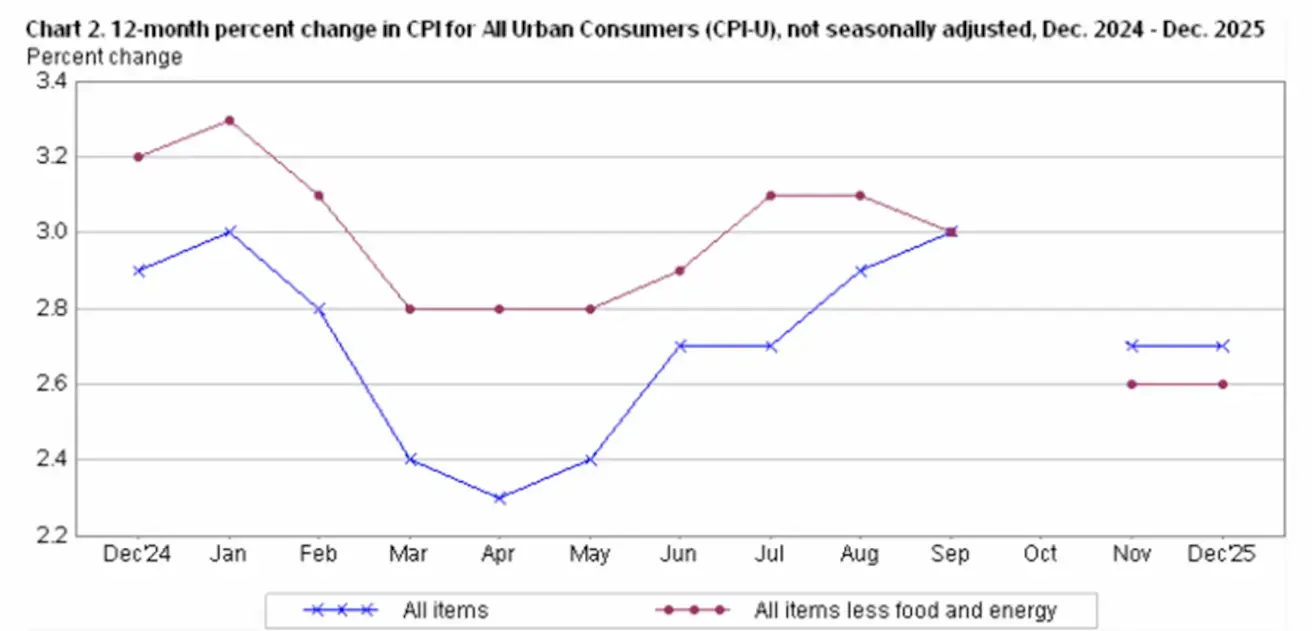
All CPI components came in unchanged relative to the November release and below market expectations. Headline CPI increased by 2.7% year-on-year and by 0.3% in December. The primary driver of the monthly increase was the shelter price index, which rose by 0.4% in December. Energy prices increased by 0.3%.
Overall, the data point to the absence of a renewed inflationary impulse. This backdrop is consistent with the Federal Reserve’s baseline scenario: price pressures are easing, yet inflation remains above target. This explains the regulator’s cautious communication and the lack of signals toward a rapid easing of monetary policy.
The current official GDP estimate (Atlanta Fed GDPNow) for Q4 remains elevated at 5.3%.
United States
- The policy rate remains unchanged; communication remains cautious.
- Monetary policy stance: moderately restrictive → transitioning toward neutral.
- The Fed continues to strike a balance: supporting markets while avoiding signals of rapid rate cuts.
- U.S. macroeconomic data reinforce the soft-landing scenario: economic growth remains above potential, inflation is decelerating, and the labor market is cooling without signs of recession.
Macroeconomic Statistics
INFLATION: CONSUMER PRICE INDEX (SEPTEMBER):
- Core CPI: (m/m) 0.2% (prev: 0.2%); (y/y) 2.6% (prev: 2.6%)
- CPI: (m/m) 0.3% (prev: 0.3%); (y/y) 2.7% (prev: 2.7%).
PRODUCER PRICE INDEX (NOVEMBER):
- PPI (m/m): 0.2%, prev: 0.6%
- Core PPI (m/m): 0.3%, prev: 0.1%.
INFLATION EXPECTATIONS (MICHIGAN) (DECEMBER):
- 12-month inflation expectations: 4.2%, prev: 4.1%
- 5-year inflation expectations: 3.4%, prev: 3.2%.
CORE PERSONAL CONSUMPTION EXPENDITURES PRICE INDEX (SEPTEMBER)
(the Federal Reserve’s preferred inflation gauge):
- (m/m): 0.2%, prev: 0.2%; (y/y): 2.8%, prev: 2.9%.
GDP (U.S. Bureau of Economic Analysis, BEA) (Q3 2025, annualized, advance estimate): +4.3% (Q2 2025: +3.8%). GDPNow Indicator of the Federal Reserve Bank of Atlanta (Q4): 5.3% (prev: 5.1%):
BUSINESS ACTIVITY INDEX (PMI) (DECEMBER):
(Above 50 indicates expansion; below 50 indicates contraction)
- Services sector: 52.5 (prev: 52.9);
- Manufacturing sector: 51.8 (prev: 51.8);
- S&P Global Composite: 52.7 (prev: 53.0).
LABOR MARKET (BLS) (December)
- Unemployment rate: 4.4% (prev: 4.6%);
- Total number of individuals receiving unemployment benefits in the U.S.: 1,884K (prev: 1,914K, revised);
- Initial jobless claims: 198K (prev: 208K);
- Change in nonfarm payrolls: 37K (prev: 64K);
- Change in private nonfarm payrolls: 37K (prev: 69K);
- Average hourly earnings (y/y): 3.8% (prev: 3.5%);
- Number of job openings (JOLTS): 7.146M (prev: 7.227M).
MONETARY POLICY
Fed officials’ messaging was mixed:
- Stephen I. Miran (Trump administration representative): The policy rate should be cut by more than 1 percentage point in 2026, with an optimal cumulative annual reduction of around 1.5%.
- Alberto Musalem (St. Louis Fed): inflation should not yet be expected to return to 2%, and there is no basis for further rate cuts in the near term, as inflation remains above target.
- Effective Federal Funds Rate (EFFR): 3.50%–3.75%;
- Federal Reserve Balance Sheet: USD 6.5813T, + 0.71% since the suspension of quantitative tightening (USD 6.535T).
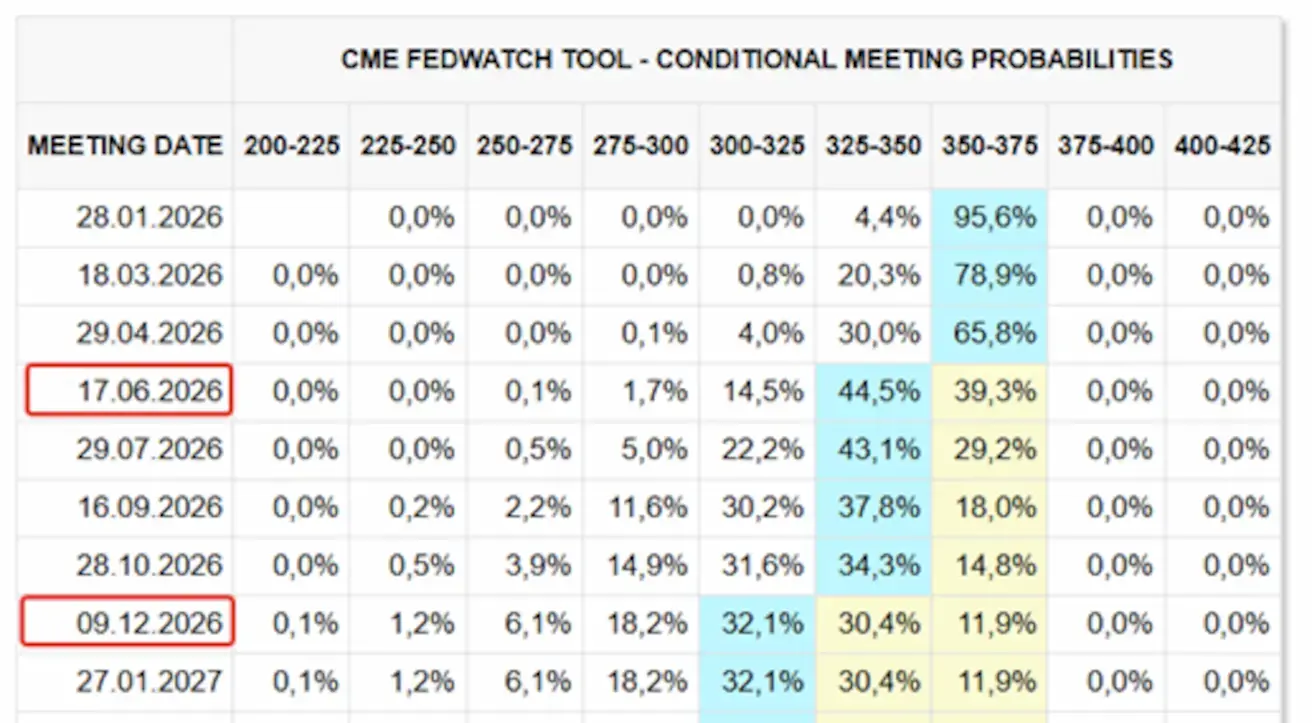
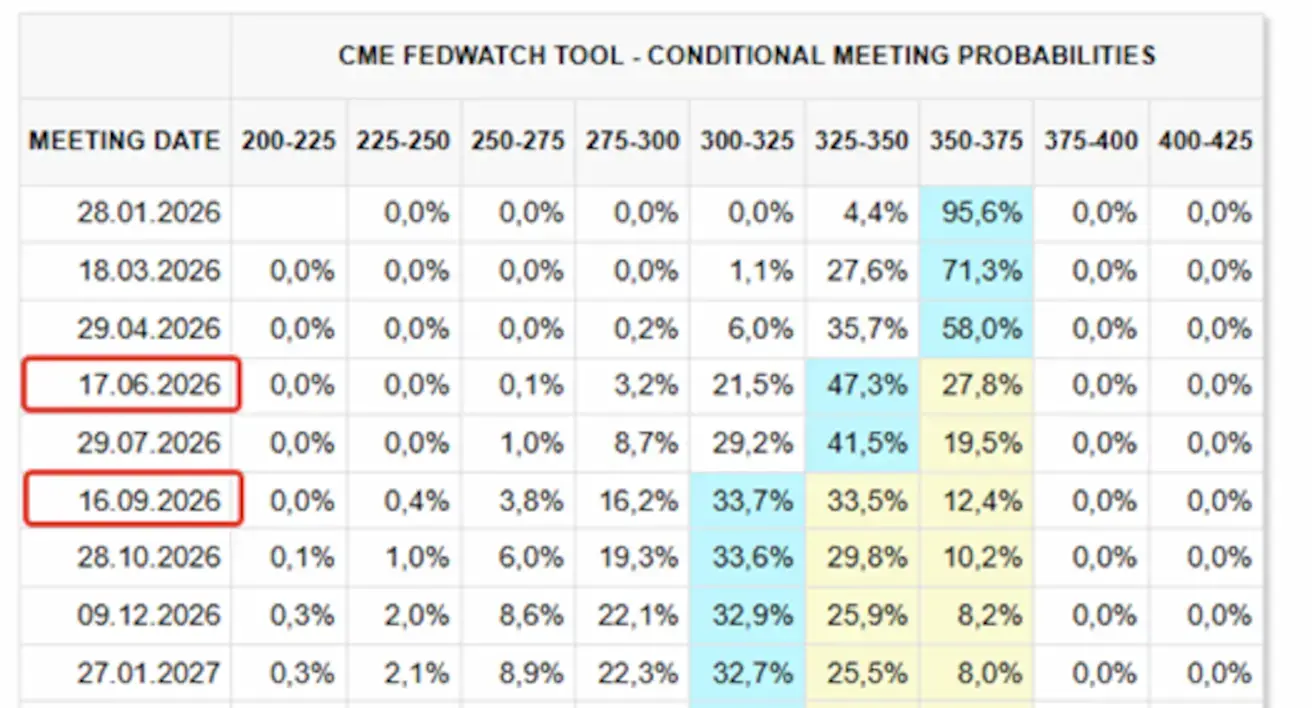
MARKET FORECAST FOR RATE (FEDWATCH)
Next FOMC Meeting (January 28): the implied probability of a 25 basis point rate cut stands at 4.43%.
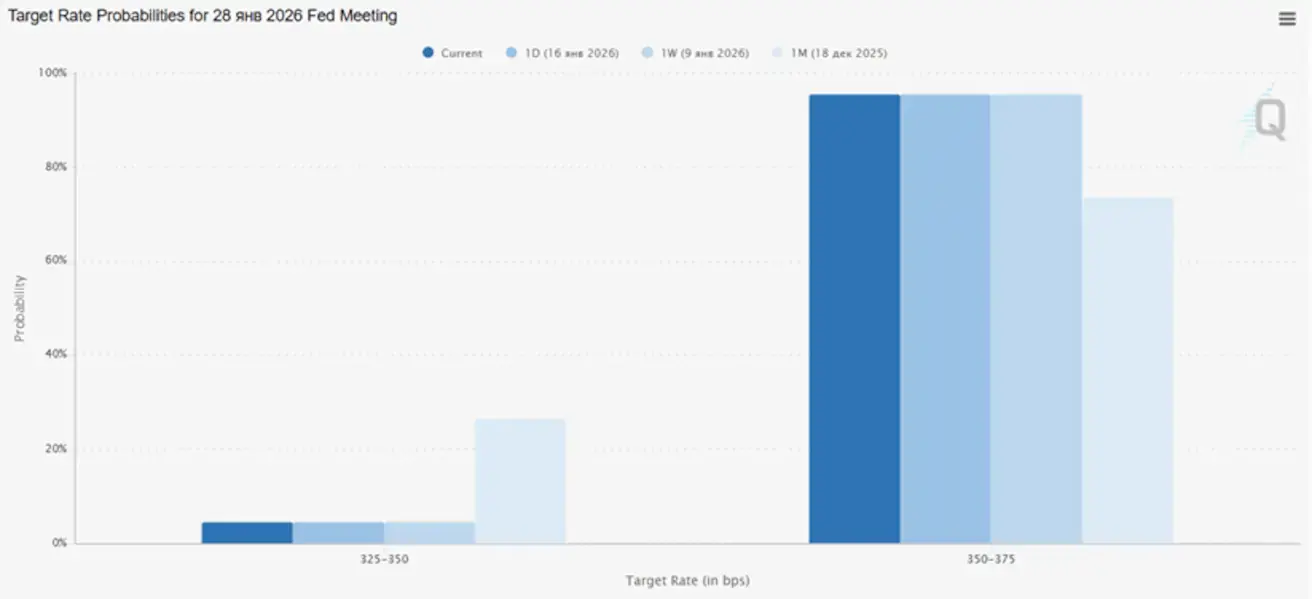
12-Month Outlook: The market is pricing in two 25 bp rate cuts, bringing the policy rate to a 3.00–3.25% range. The first cut is expected in July, following three FOMC meetings.
Today:
А week earlier:
Market
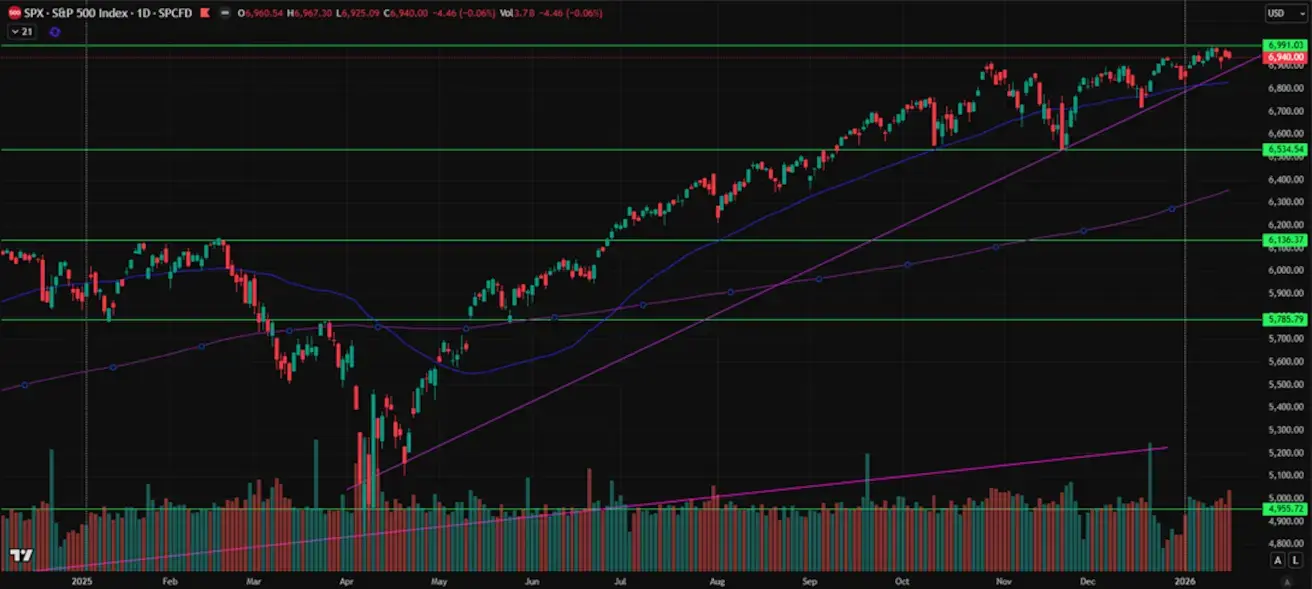
SP500
Weekly performance: −0.38% (week-end close at 6,940.00); year-to-date: +1.38%.
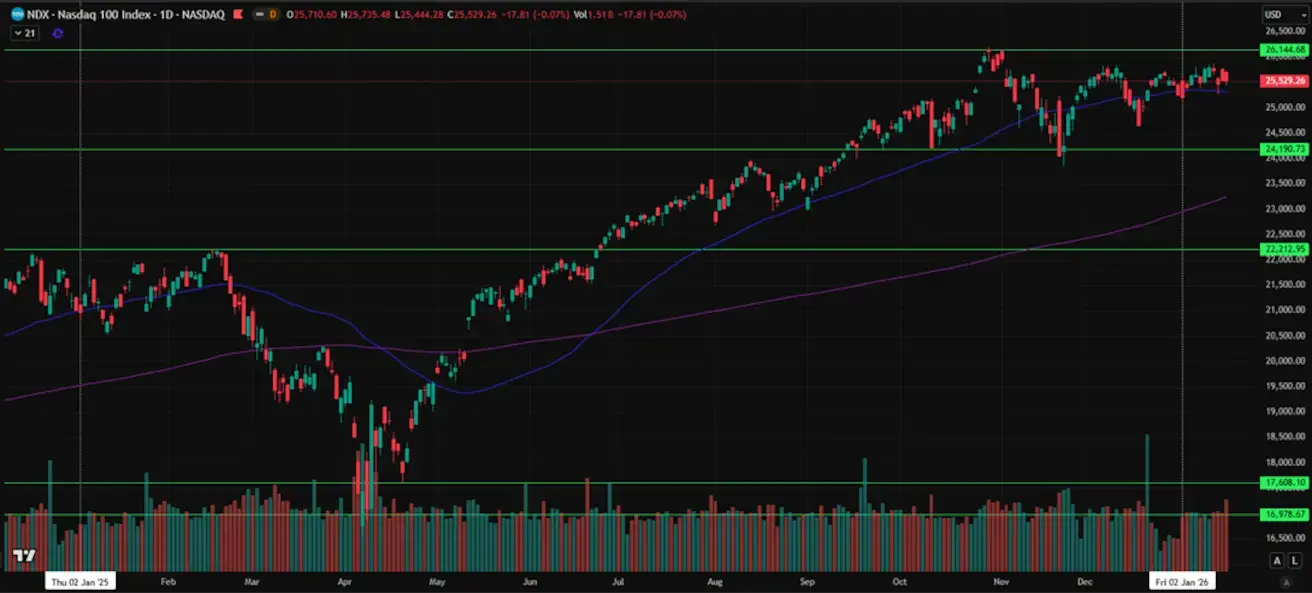
NASDAQ100
Weekly performance: −0.92% (week-end close at 25,529.26); year-to-date: +1.11%.
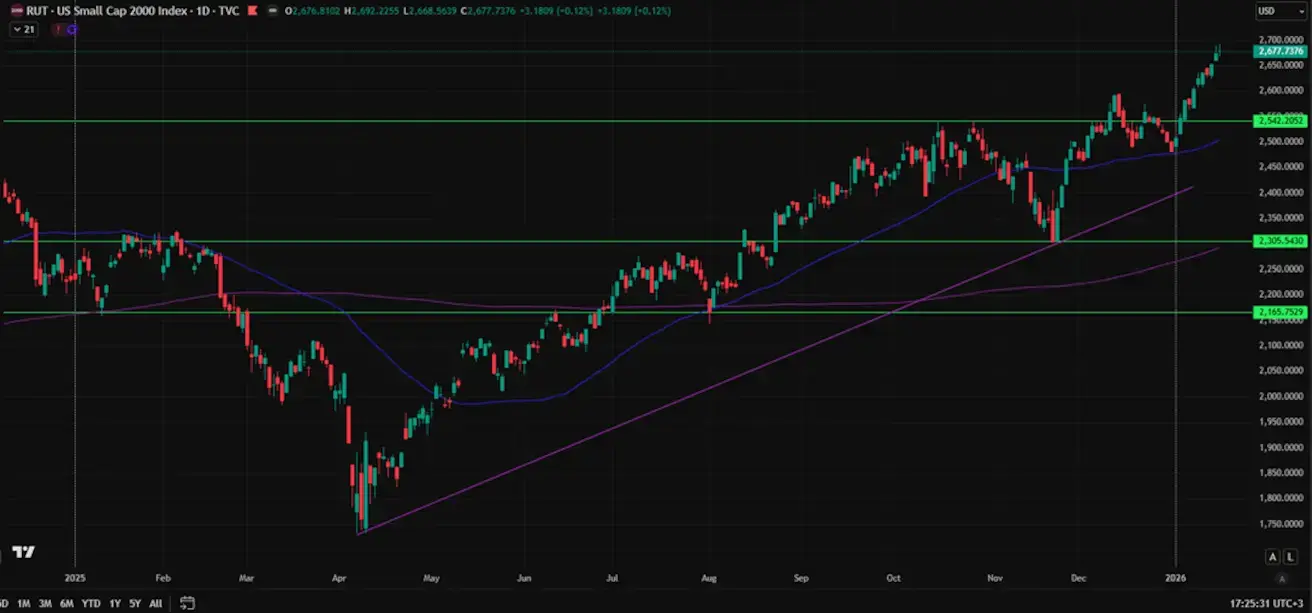
RUSSEL 2000 (RUT)
Weekly performance: +2.04% (week-end close at 2,677.73); year-to-date: +7.89%. Risk appetite remains intact.
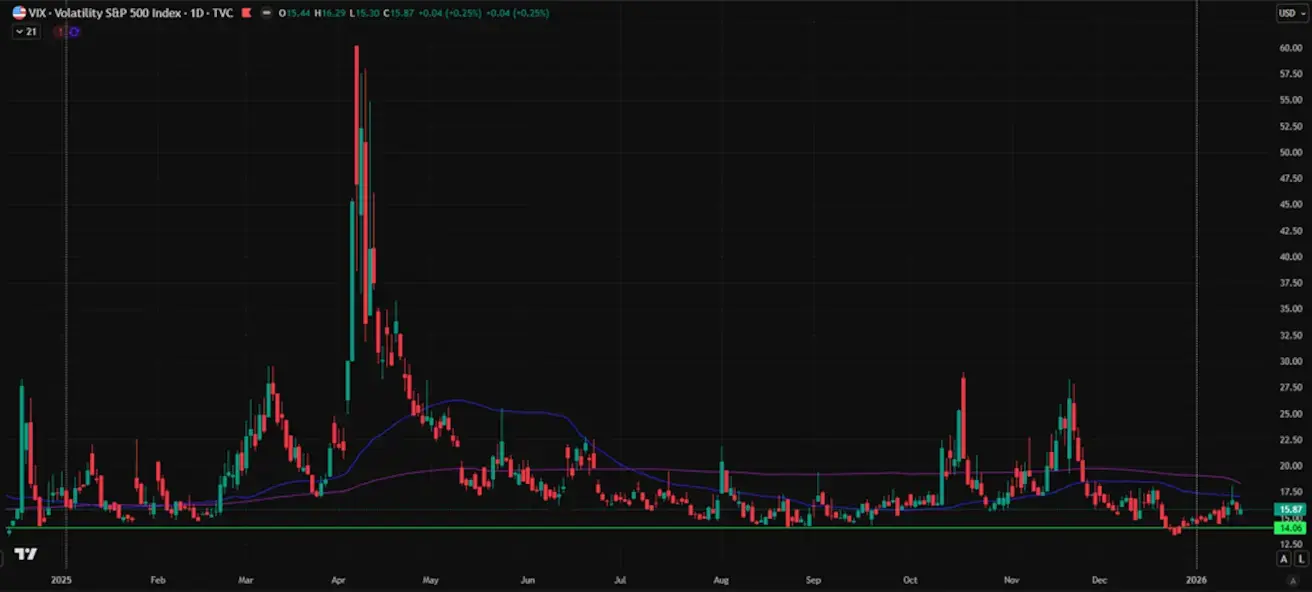
VIX
The VIX volatility index is 15,87.
The chart of consensus expectations for S&P 500 EPS growth in 2026:
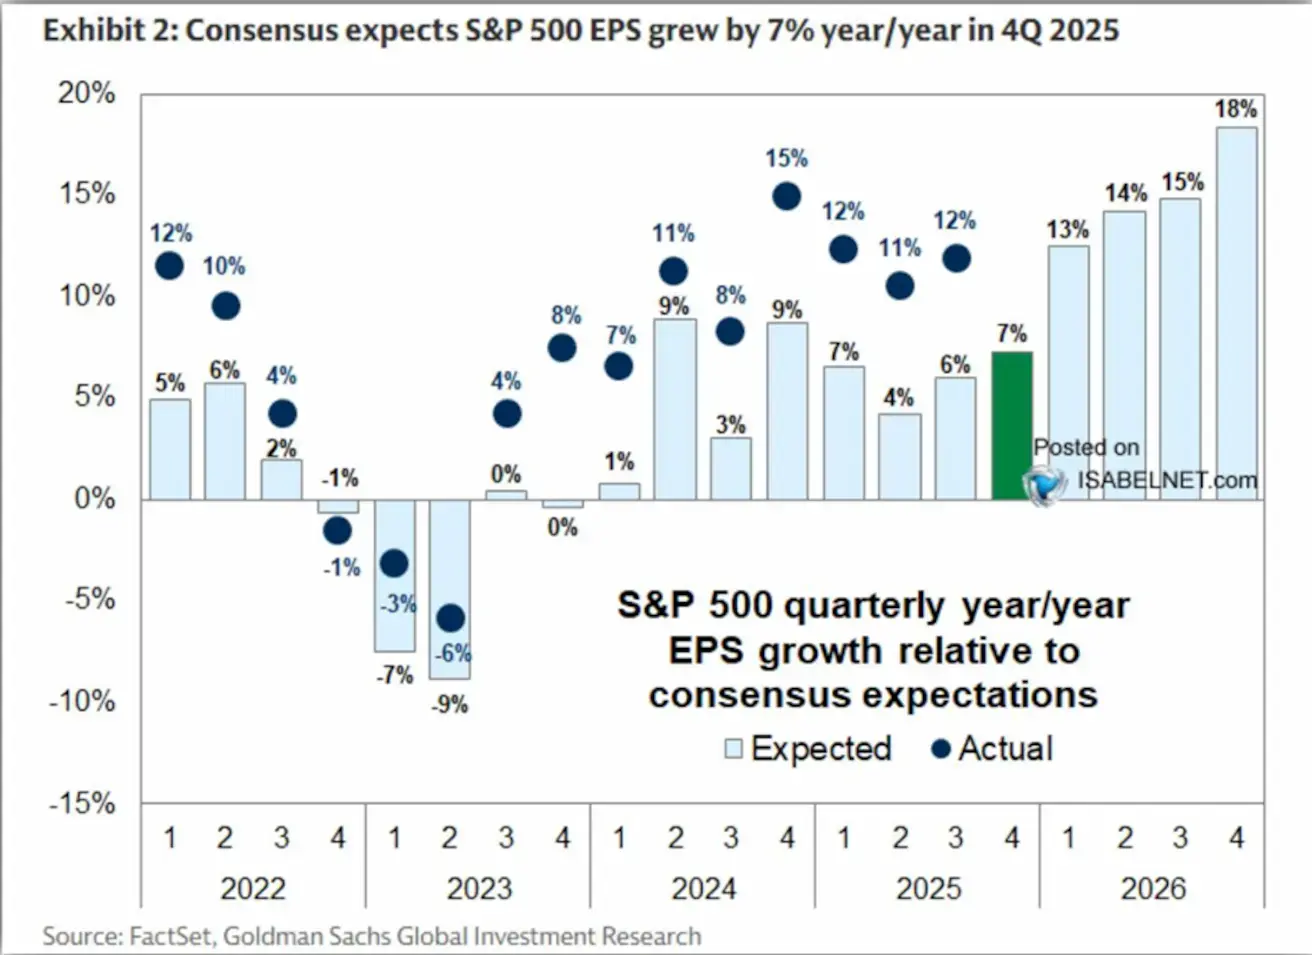
The consensus is optimistic, with EPS forecasts pointing to double-digit growth (13–18%), which supports current equity market valuations.
Eurozone
- The policy rate remains unchanged; inflation is under control.
- Monetary policy stance is neutral, with the balance of risks shifting from inflation toward economic weakness.
- As trade tensions ease, the ECB has revised its GDP and inflation forecasts upward for the coming years.
- Europe is stabilizing but continues to lag the U.S. in terms of growth momentum.
Interest Rates:
- Deposit facility rate: 2.0% (previous: 2.0%)
- Marginal lending facility rate: 2.4% (previous: 2.4%), the rate at which banks can access overnight liquidity from the central bank
- Short-term (policy) rate: 2.15% (previous: 2.15%).
Inflation (November CPI):
- Core CPI (YoY): 2.3% (previous: 2.4%)
- CPI: (MoM) 0.2% (previous: −0.3%); (YoY) 2.0% (previous: 2.1%).
GDP (Q3, final estimate):
- Quarter-on-quarter: 0.3% (previous: 0.1%)
- Year-on-year: 1.4% (previous: 1.5%).
Unemployment Rate (December): 6.23% (previous: 6.4%).
Purchasing Managers’ Indices (PMI, December):
- Services: 52.4 (previous: 52.6).
- Manufacturing: 48.8 (previous: 49.2).
- S&P Global Composite: 51.5 (previous: 51.9).
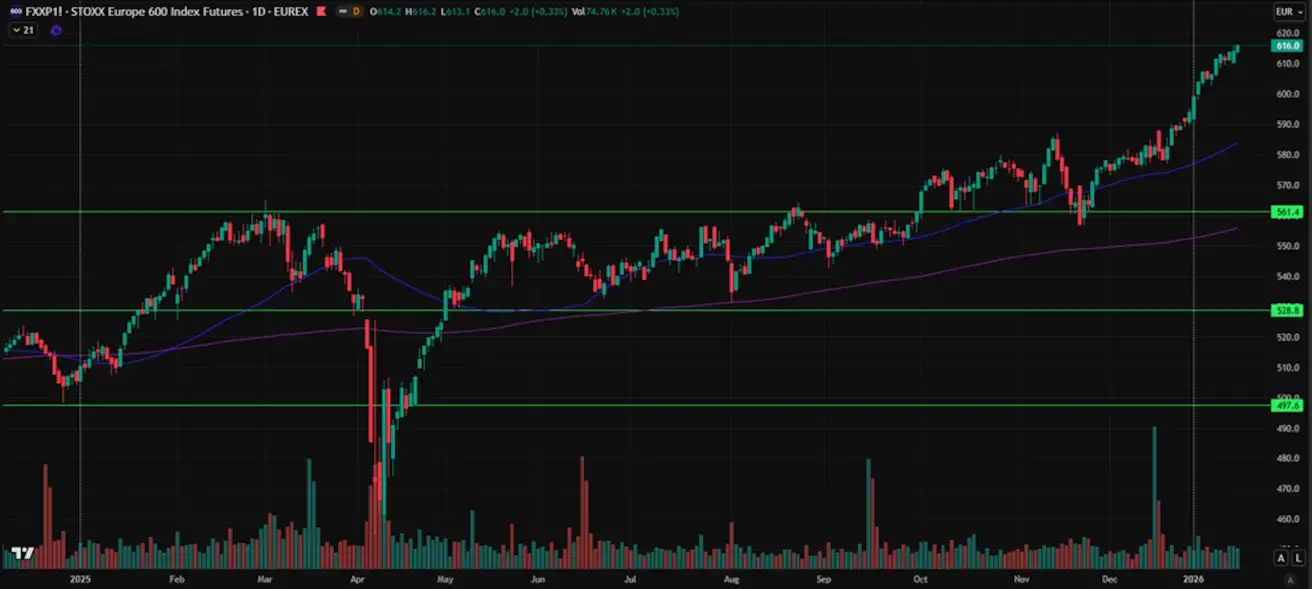
EURO STOXX 600
Weekly performance: +0.72% (week-end close at 616.0); year-to-date: +3.70%.
The primary contribution last week came from a strong rally in defense-sector equities. Demand is also supported by more attractive valuations than those in the U.S. technology sector.
European indices largely ignored President Trump’s threats to impose 10% tariffs on imports from key European countries, including major economies such as Germany and France, from February 1, over “disagreements regarding Greenland.”
China The economy is stabilizing on the back of exports, while domestic demand and investment remain weak; policy support remains targeted and cautious.
- Policy rates remain unchanged;
- Monetary policy stance is accommodative;
- China has confirmed the continuation of fiscal support for economic growth under its 2026 plan, including measures to stimulate domestic demand, optimize tax incentives and subsidies, and modernize industry.
Interest Rates:
- 1Y Loan Prime Rate (medium-term lending): 3.00%.
- 5Y Loan Prime Rate (five-year benchmark, relevant for mortgage pricing): 3.50%.
Inflation Indicators (December):
- Consumer Price Index (CPI), MoM: 0.2% (previous: −0.1%); YoY: 0.8% (previous: 0.7%).
Producer Prices and Activity Indicators:
- Producer Price Index (PPI), YoY: −1.9% (previous: −2.2%).
- Unemployment rate (December): 5.1% (previous: 5.1%).
- Industrial production (November), YoY: 4.8% (previous: 4.9%).
- Fixed asset investment (December), YoY: −3.8% (previous: −2.6%).
- Retail sales (December), YoY: 0.9% (previous: 1.3%).
External Trade (December):
- Imports (December), YoY: 5.7% (previous: 1.9%).
- Exports (December), YoY: 6.6% (previous: 5.9%).
- Trade balance (USD, December): USD 114,30 billion (previous: USD 111,68 billion).
Purchasing Managers’ Indices (PMI, November):
- Manufacturing: 49.2 (previous: 49.0).
- Non-manufacturing: 49.0 (previous: 49.0).
- Composite PMI: 49.5 (previous: 50.1).
CSI 300 INDEX
Weekly performance: −0.57% (week-end close at 4,731.87); year-to-date: +2.20%.
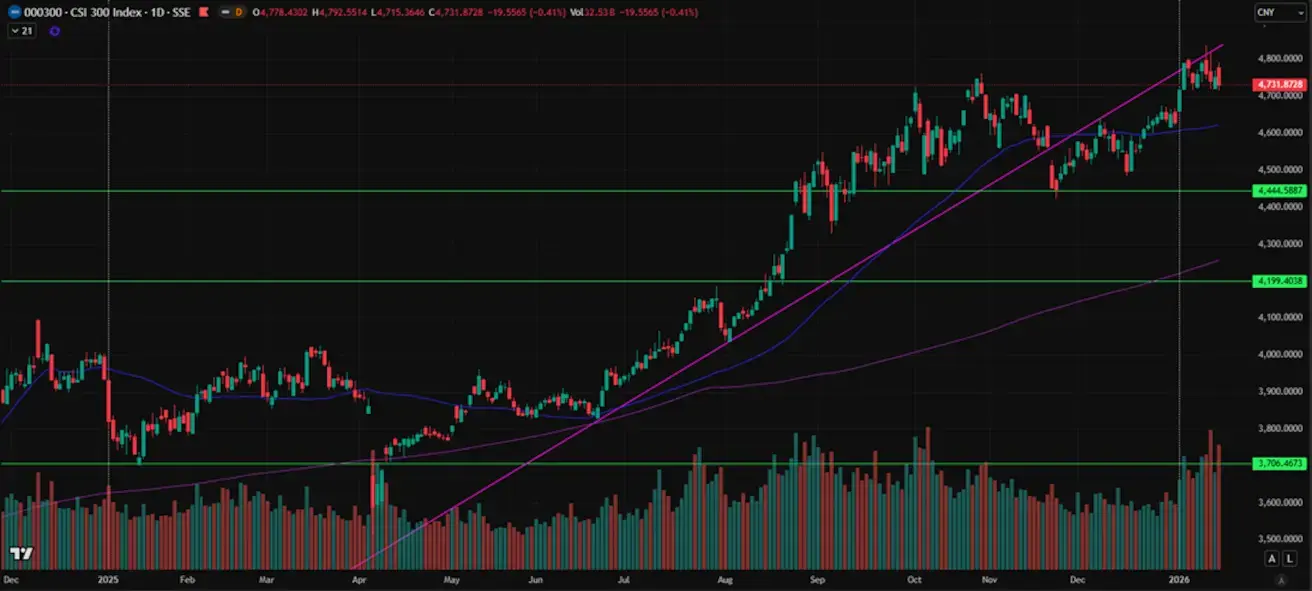
China’s technology sector outperformed the broader market index:
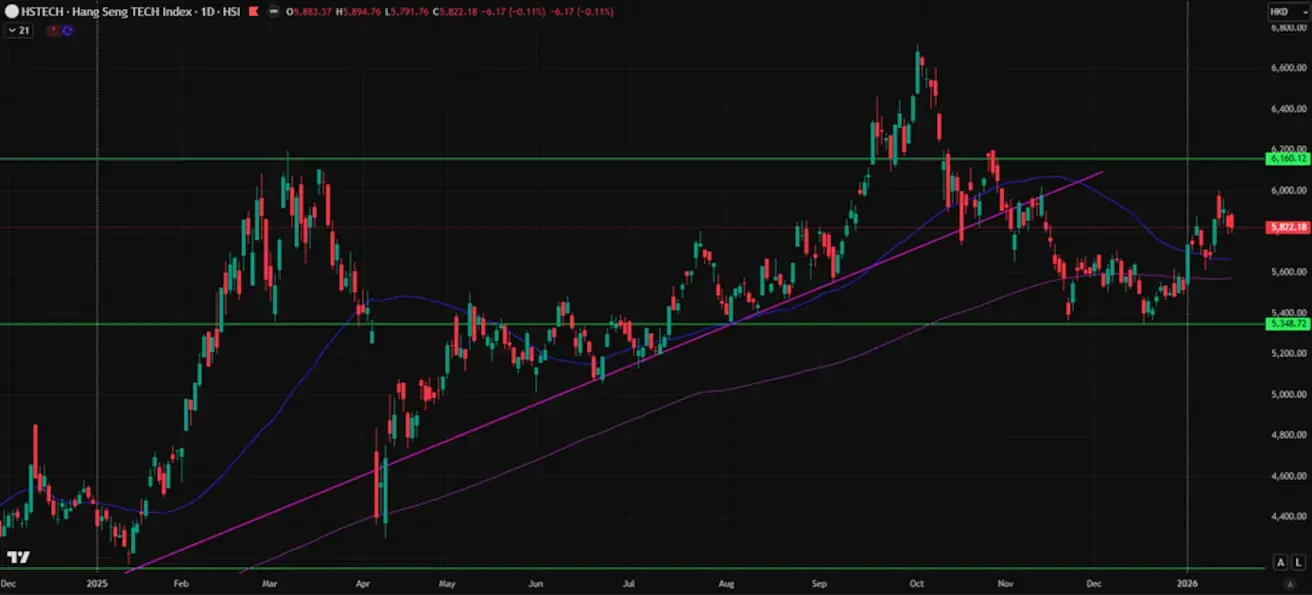
HANG SENG TECH INDEX (HSTECH.HK)
Weekly performance: +2.37% (week-end close at 5,822.18); year-to-date: +5.55%.
Updated World Bank forecasts (compared with the June projections):
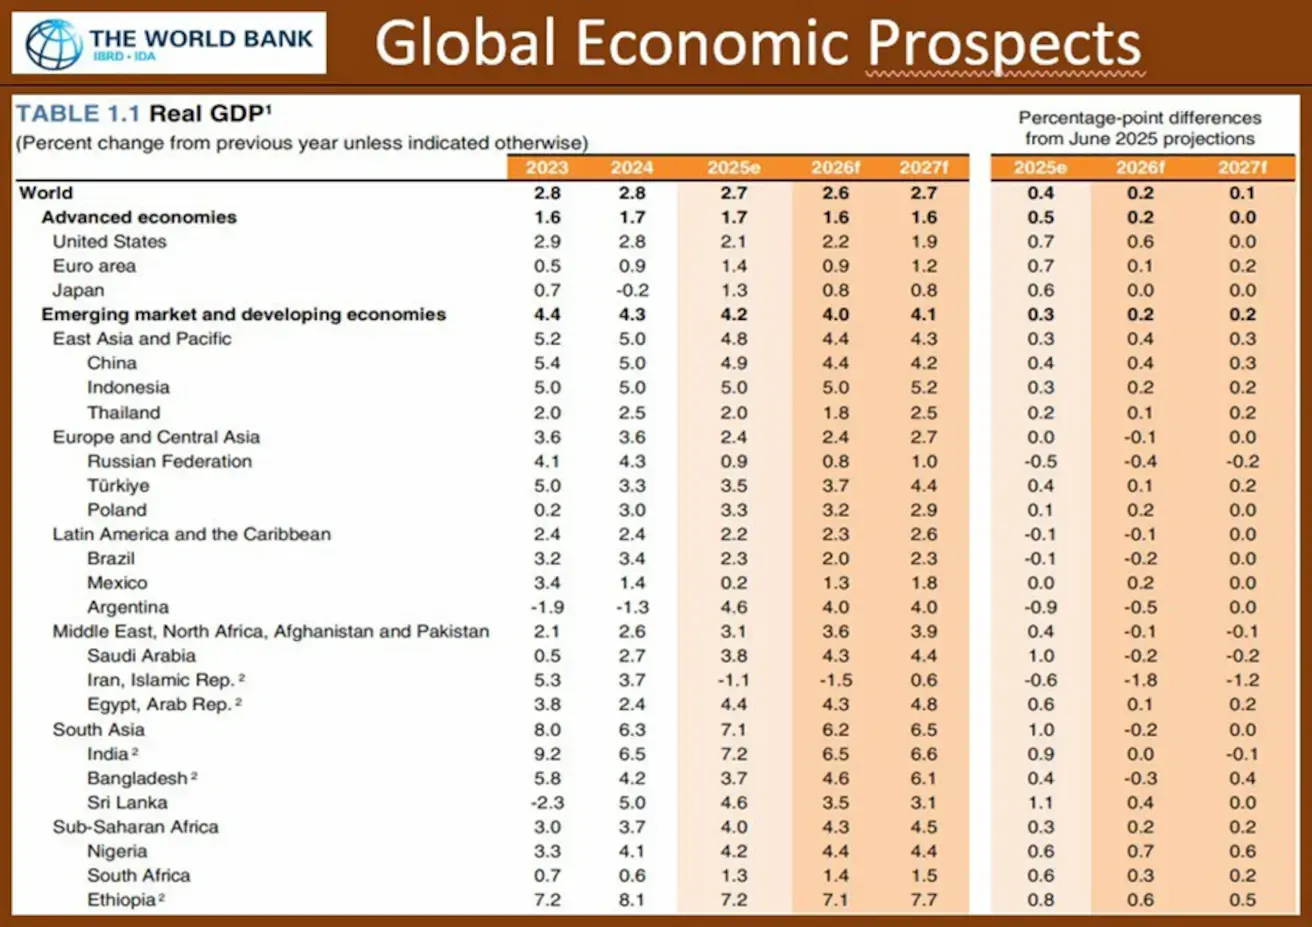
- Global economic growth in 2026 is projected at 2.6% (vs. 2.4%)
- China: 4.4% (vs. 4.0%)
- United States: 2.2% (vs. 1.6%)
- Eurozone: 0.9% (vs. 0.8%).
BOND MARKET: yields and spreads do not point to a deep recession or systemic risk.
U.S. Treasuries 20+ Years (ETF TLT): weekly performance: −0.15% (week-end close at 87.8); year-to-date: +0.73%.
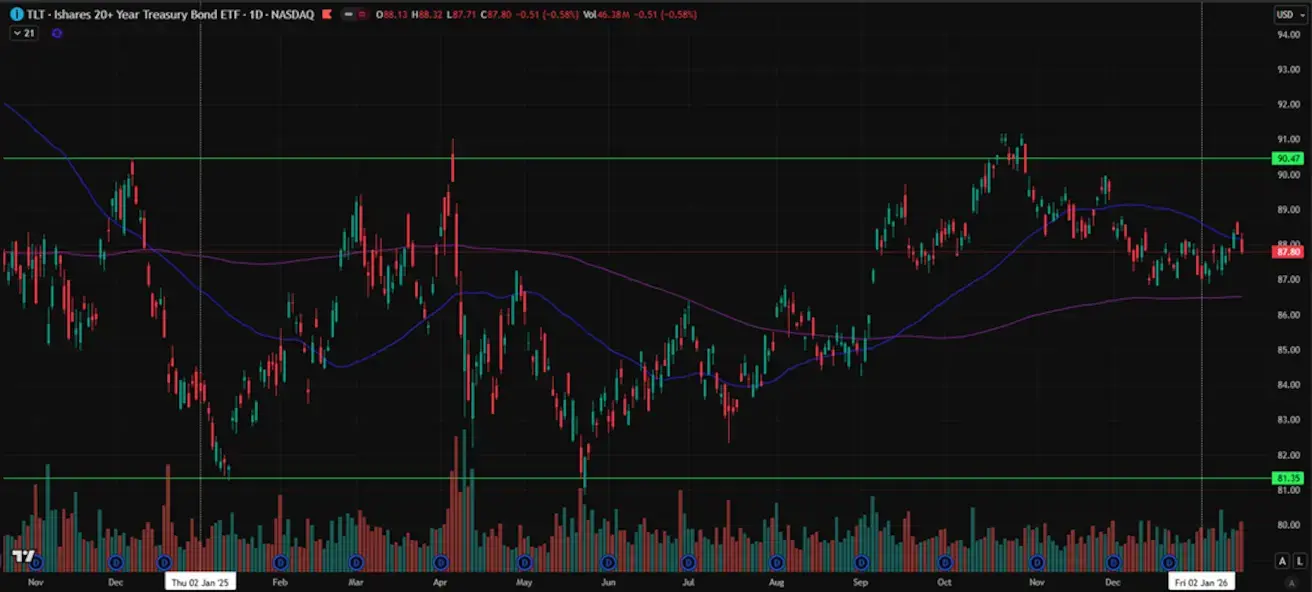
YIELDS AND SPREADS
- Market Yield on U.S. Treasury Securities at 10-Year Constant Maturity: 4.23% (previous: 4.17%); 2-year Treasury yield: 3.60% (previous: 3.54%).
- ICE BofA BBB US Corporate Index Effective Yield: 5.00% (previous: 5.04%).
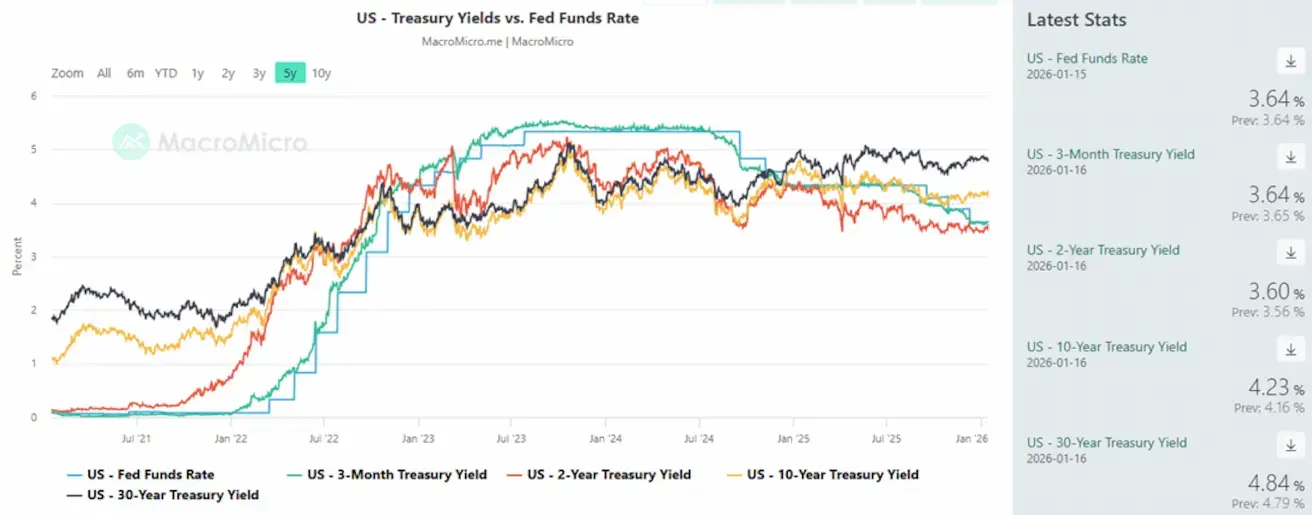
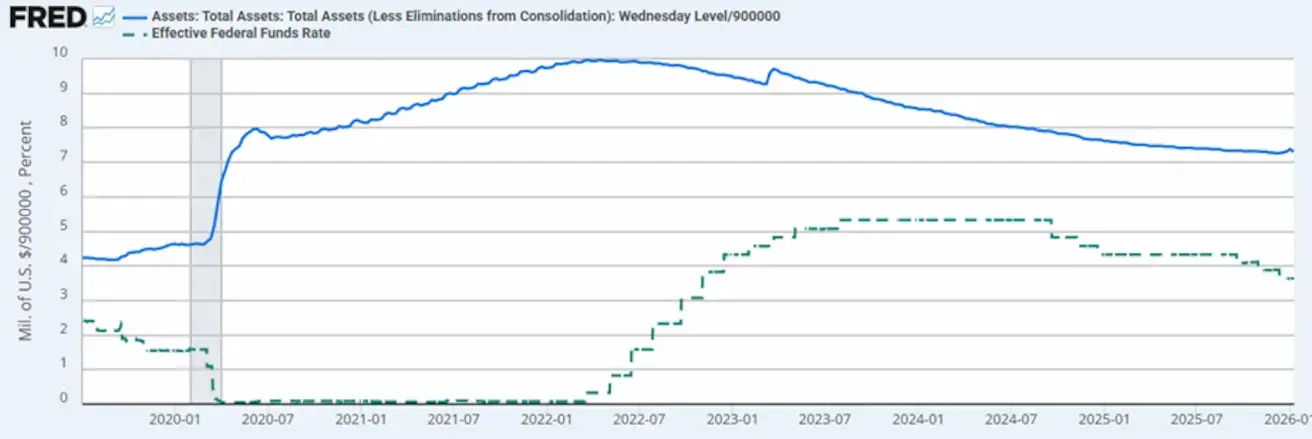
The yield curve chart shows convergence between 2-year Treasury yields and the effective federal funds rate (EFFR). This indicates that the market views the current Fed policy rate as close to its fair (neutral) level, with no expectations of sharp moves higher or lower over the coming year.
- 10Y–2Y U.S. Treasury yield spread: 63 basis points (previous: 63 bps).
- 10Y–3M U.S. Treasury yield spread: 59 basis points (previous: 57 bps). U.S. 5-Year Credit Default Swap (CDS): 26,09 bps, down from 26,54 bps last week, indicating stable sovereign credit risk.
GOLD FUTURES (GC)
Weekly performance: +1.83% (week-end close at USD 4,601.1 per troy ounce); year-to-date: +6.21%.
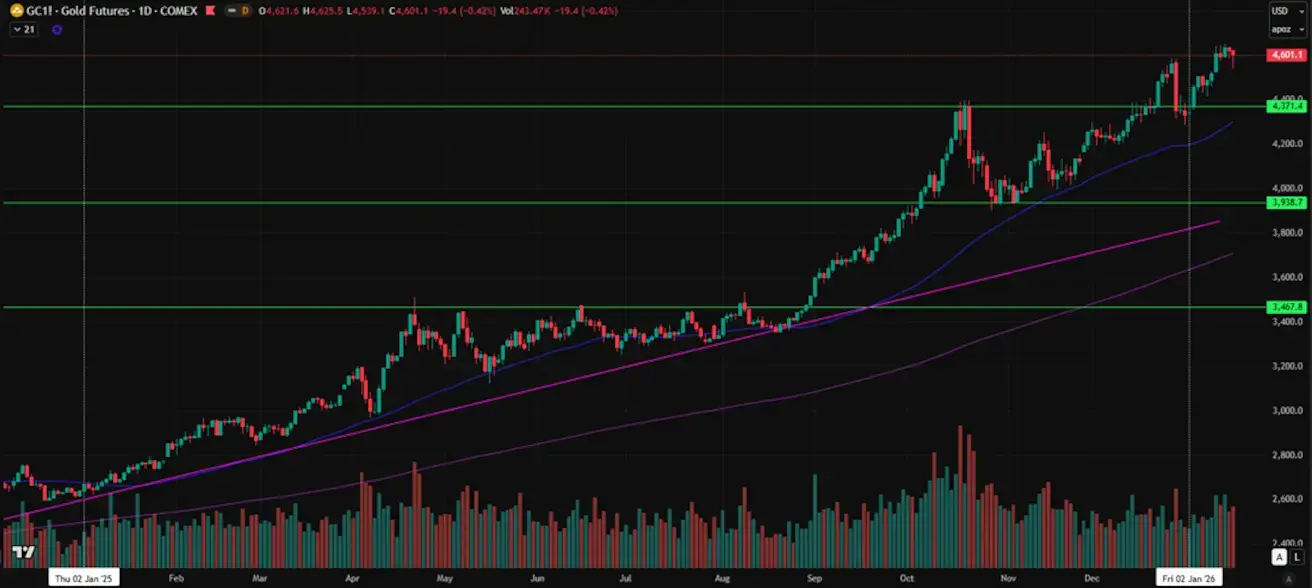
Gold prices continue to rise amid sustained central bank demand and rapid global debt growth, amid persistent geopolitical uncertainty.
DOLLAR INDEX FUTURES (DX)
Weekly performance: +0.29% (week-end close at 99.185); year-to-date: +1.21%.
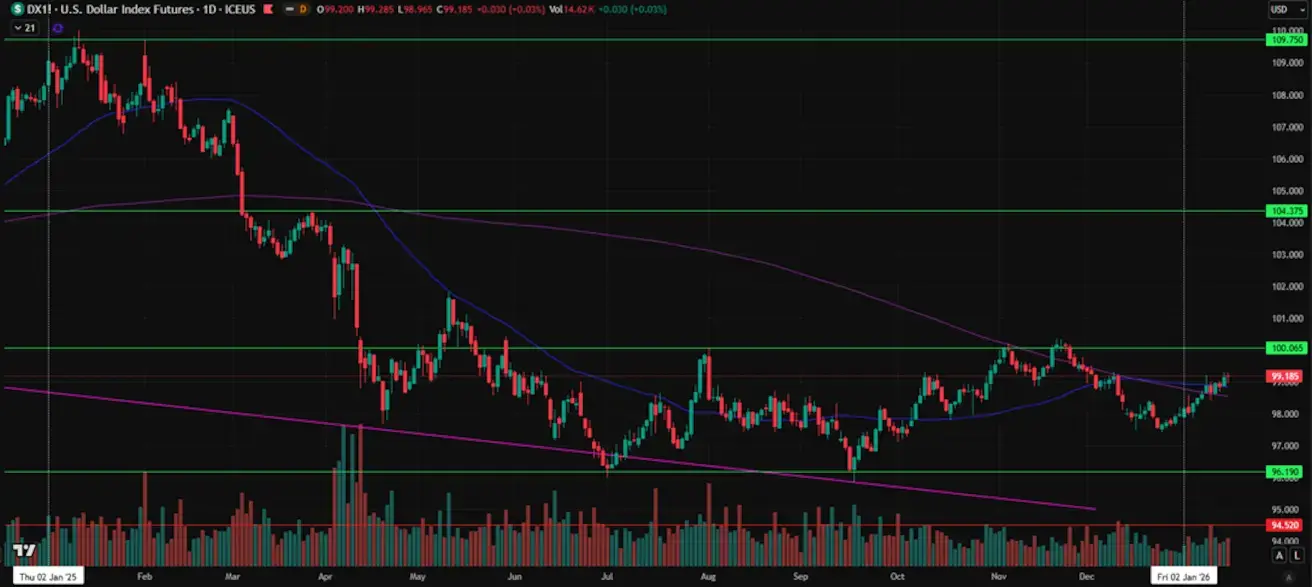
Following its decline at the end of 2025, the U.S. dollar has entered a phase of stabilization and partial recovery. Expectations of a more neutral Federal Reserve policy limit the upside for further appreciation, while not creating sustained downside pressure on the USD, continuing to support interest in gold and commodity assets.
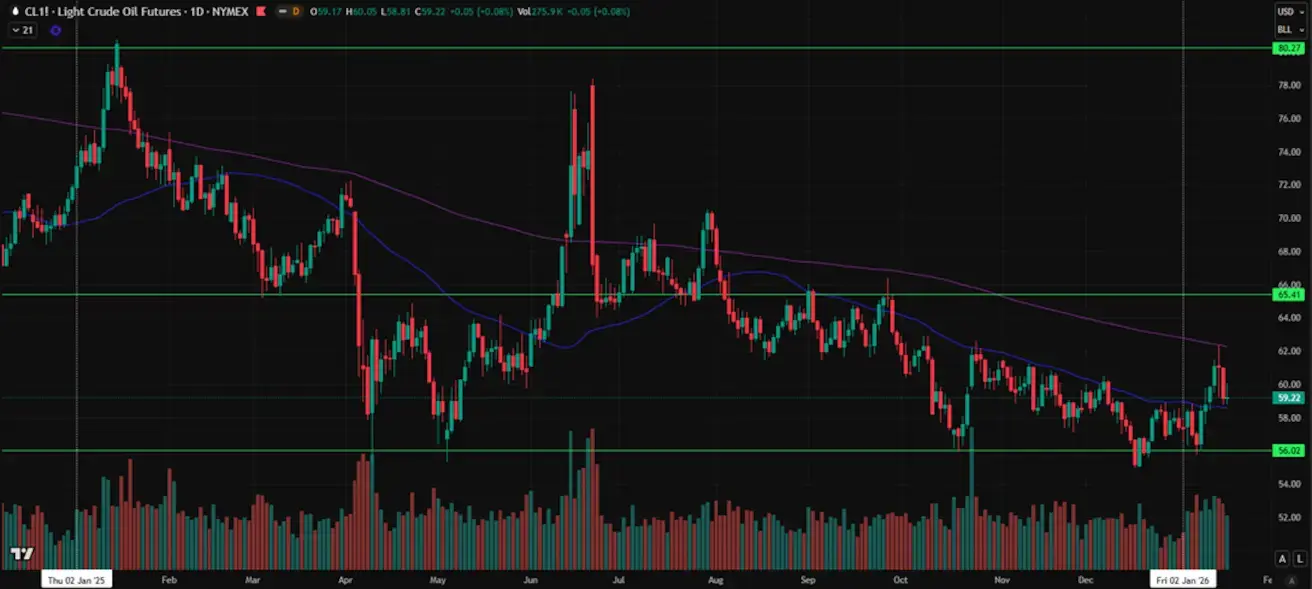
OIL FUTURES
Weekly performance: +0.75% (week-end close at USD 59.22 per barrel); year-to-date: +3.25%.
- Oil supply growth projections remain in place;
- OPEC+ plans to pause further increases in supply;
- Geopolitical risks in the Middle East—protests and rising tensions in Iran—are heightening supply concerns.
The crypto market is evolving in an increasingly institutional manner: infrastructure expansion, bank participation, and inflows of on-chain liquidity are shaping a more mature market with no signs of speculative overheating.
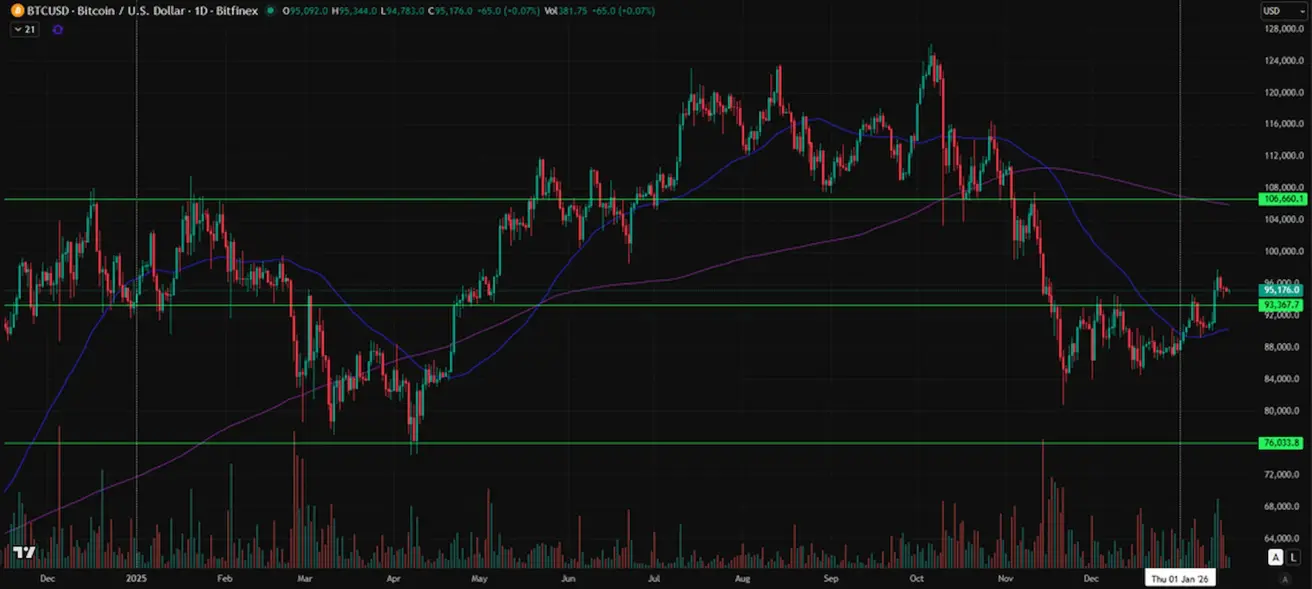
BTC FUTURES
Weekly performance: +6.81% (week-end close at USD 97,176.0); year-to-date: +10.78%.
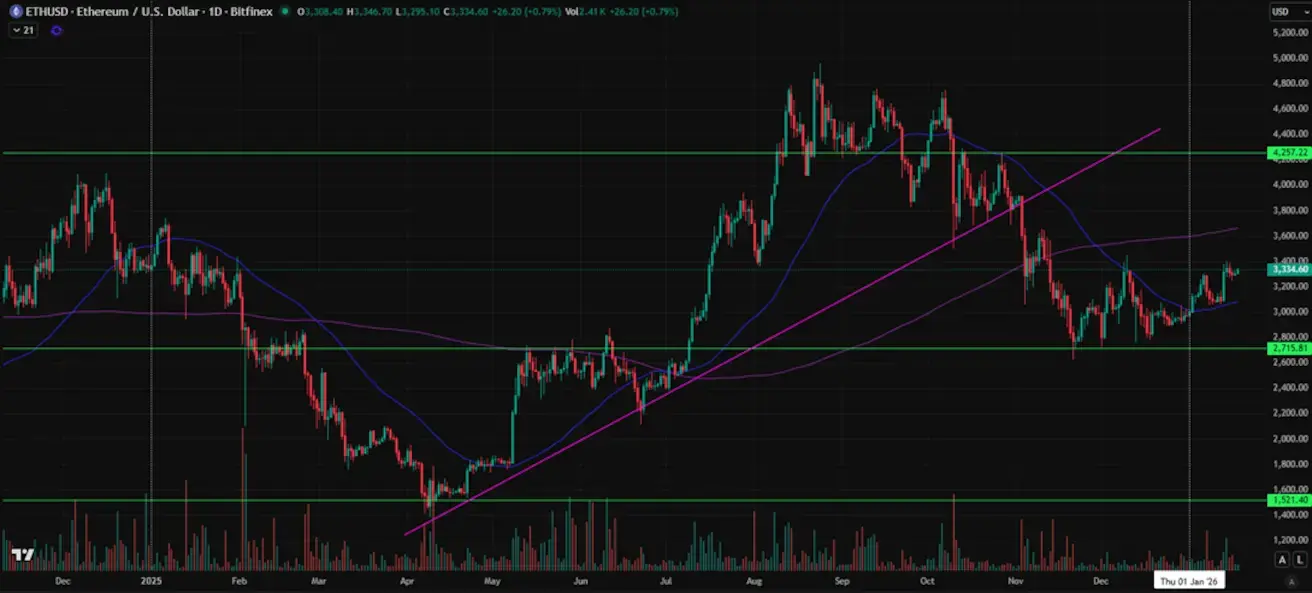
ETH FUTURES
Weekly performance: +6.80% (week-end close at USD 3,335.0); year-to-date: +12.74%.
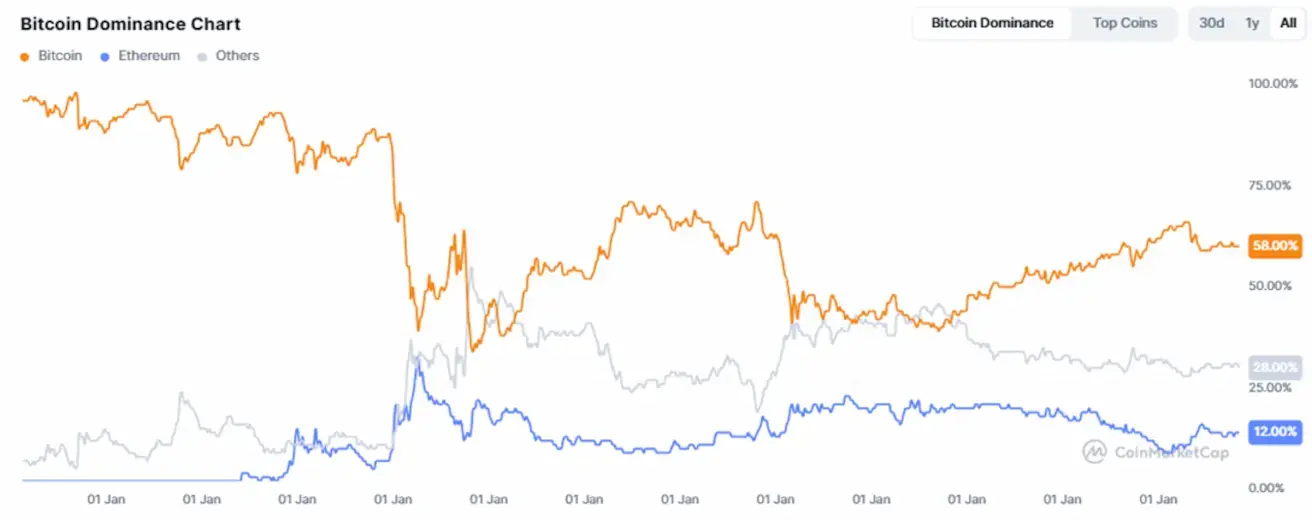
TOTAL CRYPTOCURRENCY MARKET CAPITALIZATION
$3,23T (vs. $,10T a week earlier, CoinMarketCap)
Market Share by Asset:
- Bitcoin: 58.9% (previous: 58.4%)
- Ethereum: 12.5% (12,1%)
- Other cryptocurrencies: 28,6% (previous: 29,5%).
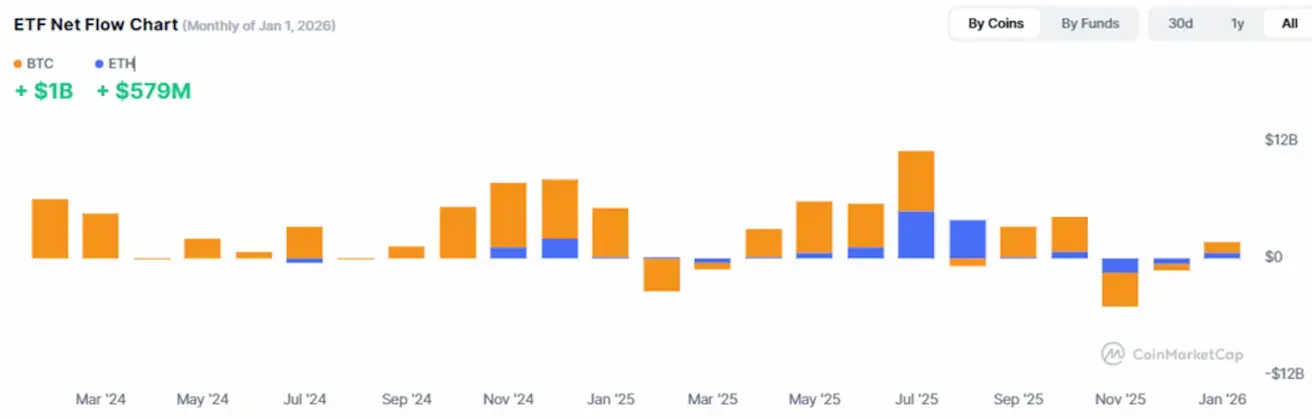
ETF Net Flows Chart: