Lietuvių
 Русский
 Қазақша
 Eesti
EestiJuly 21 - 25, 2025: Weekly economic update
Key market updates

MACROECONOMIC STATISTICS
INFLATION
- Core Consumer Price Index (CPI) (m/m) (June): 0.2% (previous: 0.1%)
- Consumer Price Index (CPI) (m/m) (June): 0.3% (previous: 0.1%)
- Core Consumer Price Index (CPI) (y/y) (June): 2.9% (previous: 2.8%)
- Consumer Price Index (CPI) (y/y) (June): 2.7% (previous: 2.4%)
INFLATION EXPECTATIONS (MICHIGAN)
- 12-month expected inflation (May): 4.5% (prev: 5.0%)
- 5-year expected inflation (April): 3.4% (prev: 4.0%) GDP (U.S. Bureau of Economic Analysis, BEA) — Q2 2025 Annualized, Preliminary Estimate: 3.0% (Q1 2024: –0.5%)
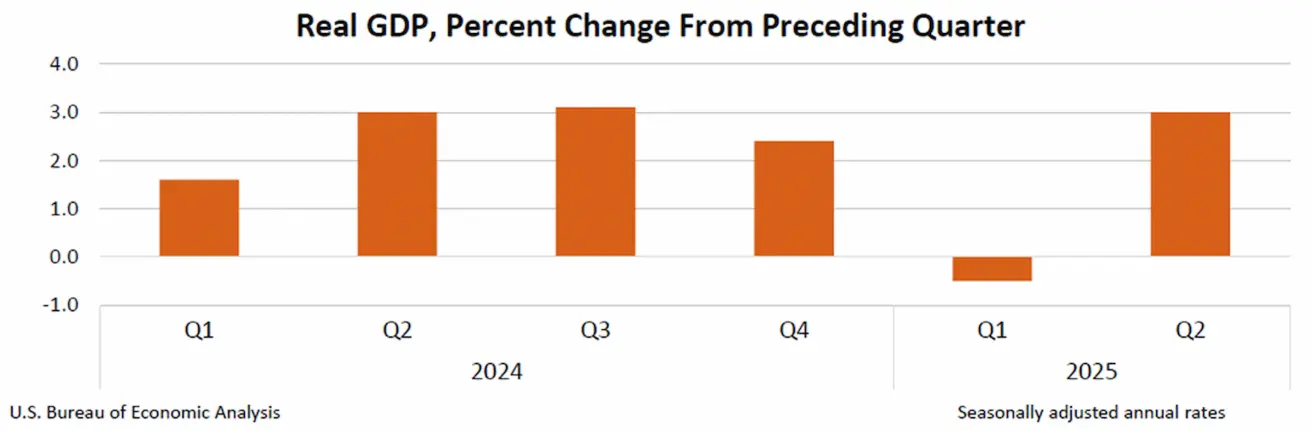
The real GDP growth in the second quarter was primarily driven by a decline in imports—which are subtracted in GDP calculations—and an increase in consumer spending. These gains were partially offset by a decrease in investment and exports.
Atlanta Fed GDPNow Estimate (Q2): 2.1% (vs. 2.4%)
Business Activity Index (PMI):
(Above 50 indicates expansion; below 50 indicates contraction)
- Services sector (July): 55.2 (previous: 52.9)
- Manufacturing sector (July): 49.8 (previous: 52,0, revised)
- S&P Global Composite (July): 54.6 (previous: 52.9)
LABOR MARKET:
- Unemployment rate (June): 4.2% (previous: 4.1%)
- Nonfarm payroll employment change (June): 73K (previous: 144K revised)
- Change in US private nonfarm payrolls (June): 83K (prev: 137K)
- Average hourly earnings (June, y/y): 3.9% (previous: 3.8%)
- JOLTS job openings (May): 7.769M (vs. 7.395M)
MONETARY POLICY
- Federal Funds Effective Rate (EFFR): 4.25% - 4.50% (unchanged)
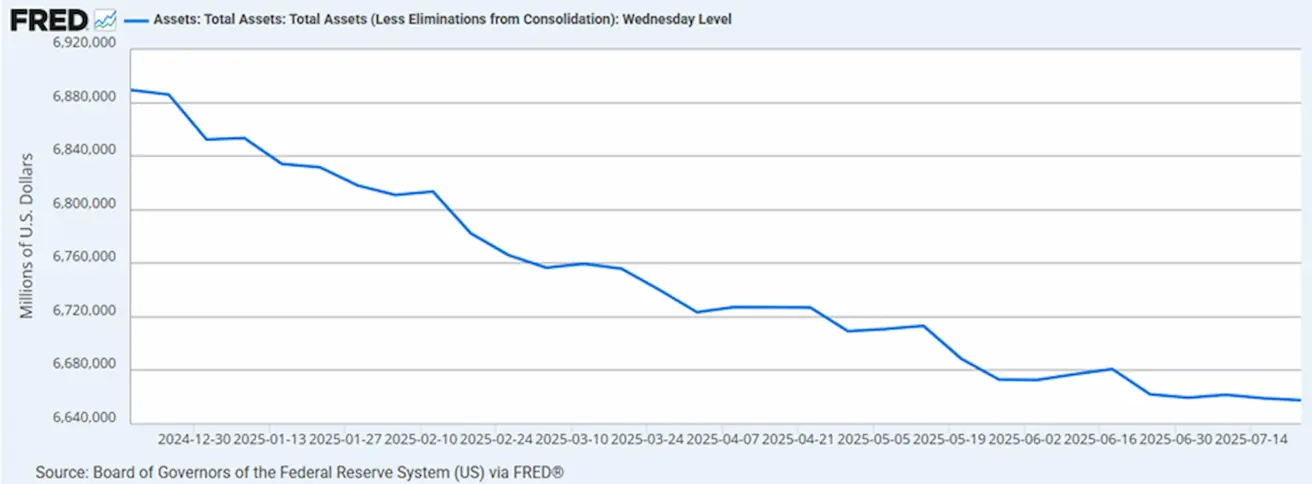
- Federal Reserve balance sheet increased: $6.42T (vs. previous week: $6.67T)
MARKET FORECAST FOR RATE
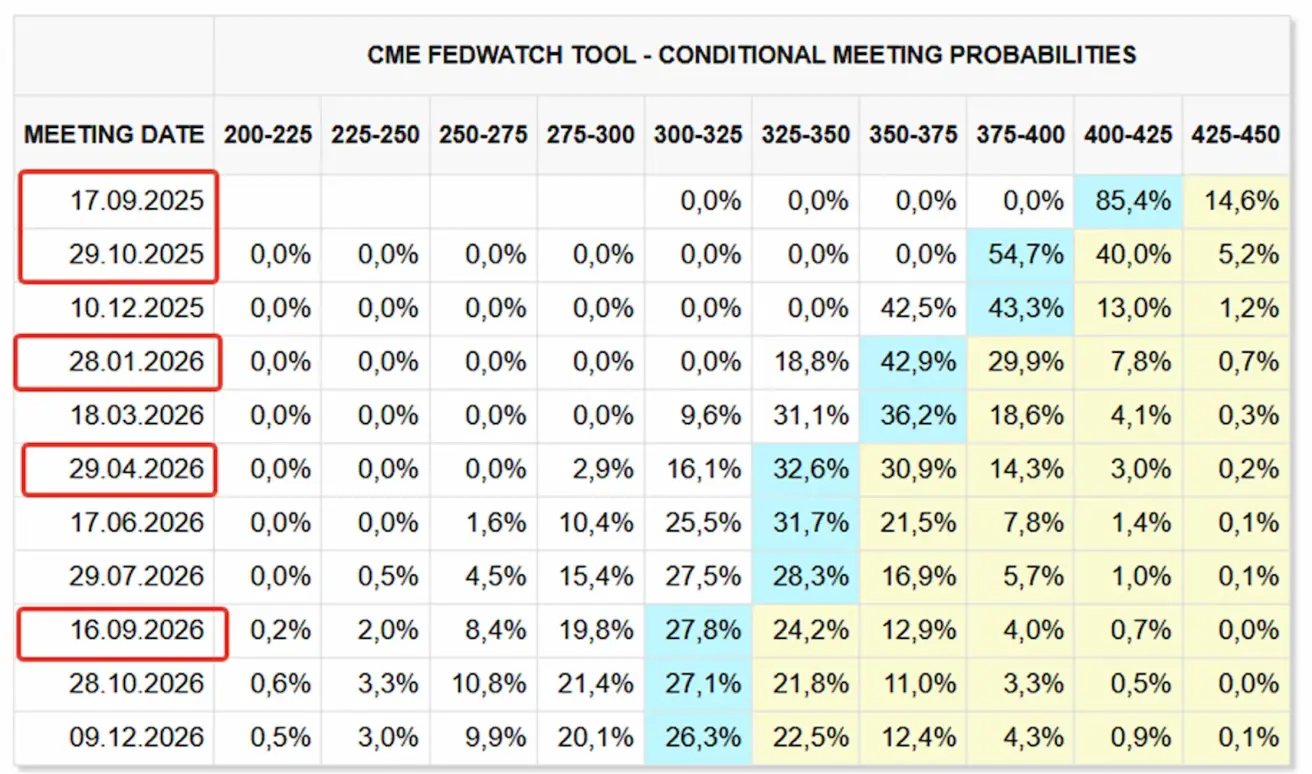
Today:
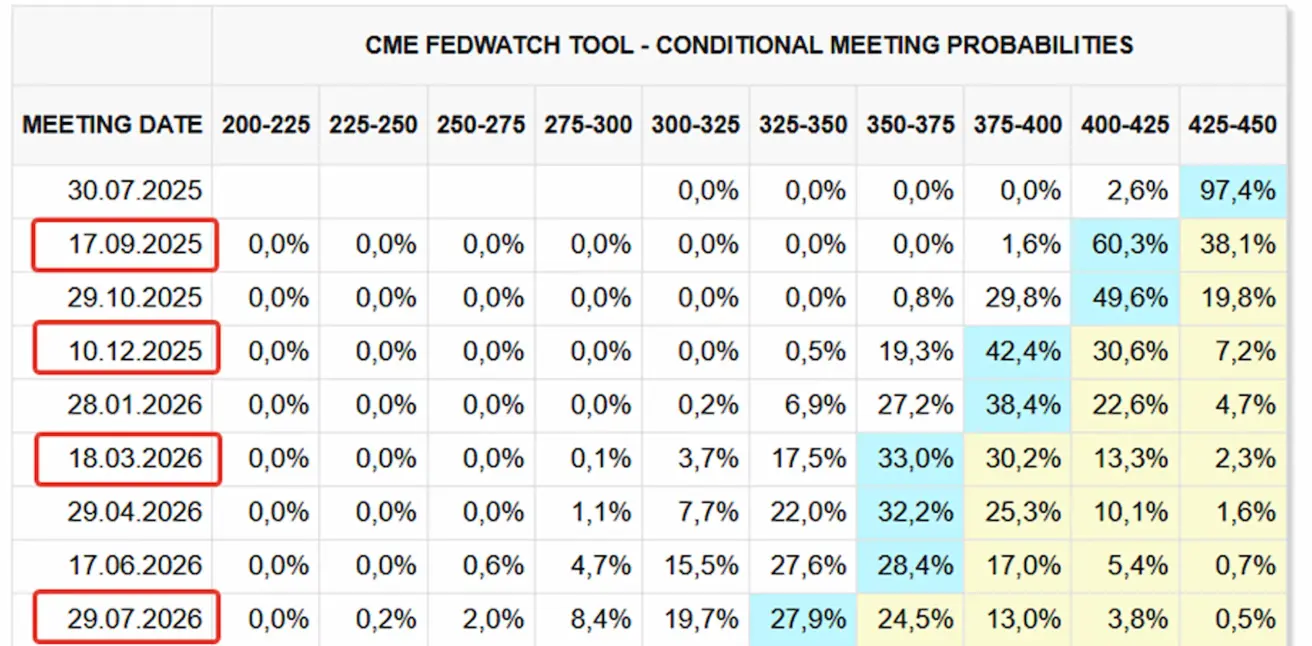
А week earlier:
Commentary
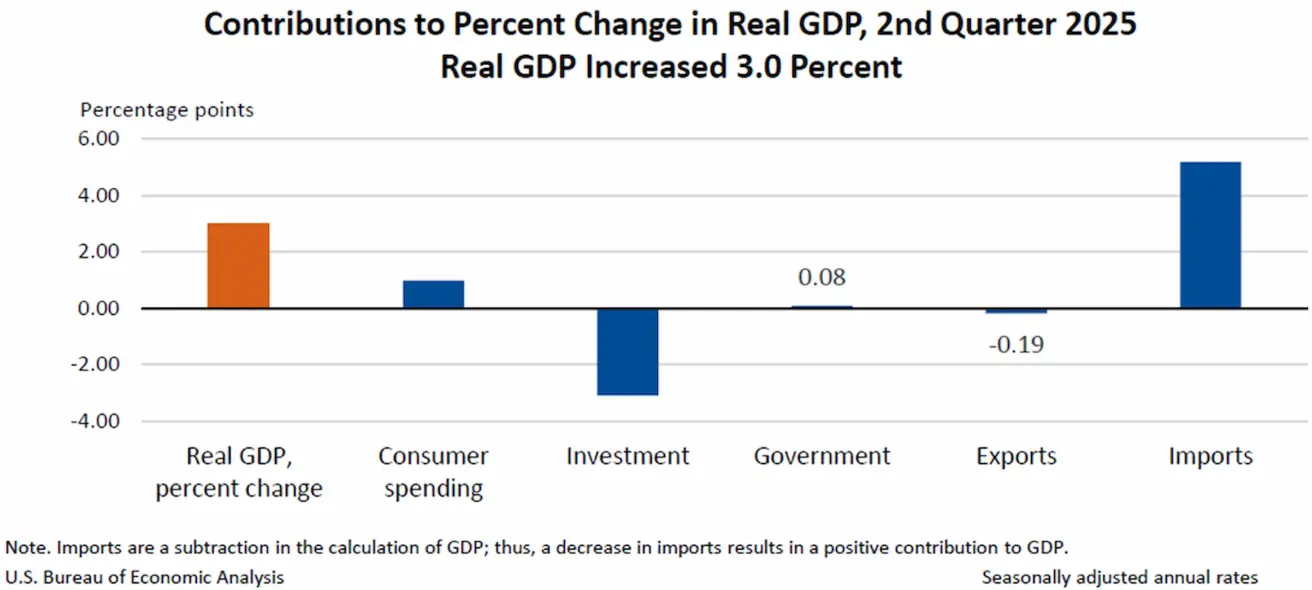
Real gross domestic product (GDP) increased at an annual rate of 3.0% in the second quarter of 2025 (April through June), following a 0.5% decline in the first quarter.
The Q2 GDP growth was primarily driven by a reduction in imports—which are subtracted in GDP calculations—and a rise in consumer spending. These gains were partially offset by declines in investment and exports.
The Federal Reserve kept its benchmark interest rate unchanged at 4.25–4.50%, while continuing with balance sheet reduction.
On one hand, the latest employment data point to weakness in the labor market, increasing the likelihood of a Fed rate cut in September.
On the other hand, although overall inflation remains only slightly above target, the broader inflationary backdrop is still elevated. In addition, core personal consumption expenditures are rising, posing risks to a rate cut and potentially compelling the Fed to keep rates unchanged.
Previously, the Fed’s baseline scenario pointed to two rate cuts by year-end. However, Powell’s tone at the latest meeting was more hawkish—he emphasized that inflationary pressures may prove more persistent, and more time may be needed before making a well-informed decision.
Market expectations according to FedWatch:
- Next meeting (September 30): The estimated probability of a rate cut is 87.4%.
- Over the next 12 months: Markets are pricing in five 25 bps cuts, bringing the target range down to 3.00–3.25%.
- By year-end: Expectations still point to two rate cuts.
Market
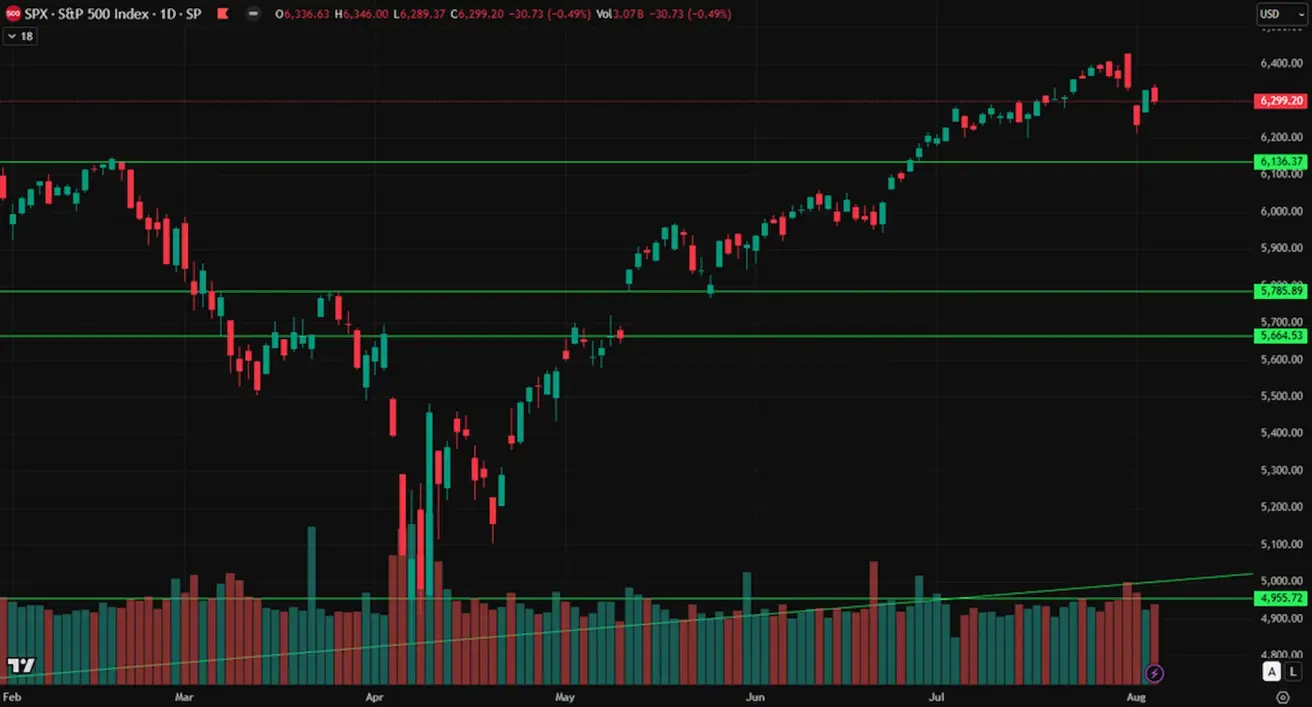
SP500
Weekly: -2.36% (weekly close: 6238,0), 2025 YTD: +5.67%
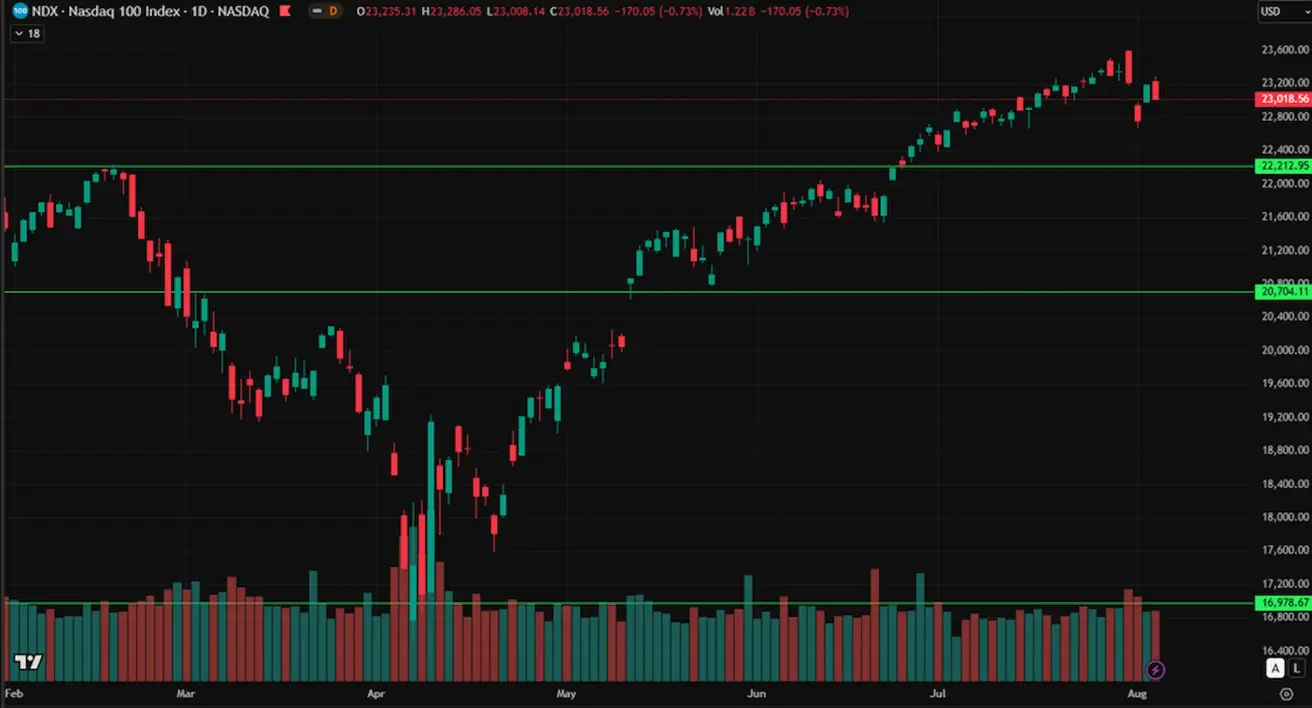
NASDAQ100
Weekly: +2.19% (weekly close: 23763.31), YTD: +7.78%.
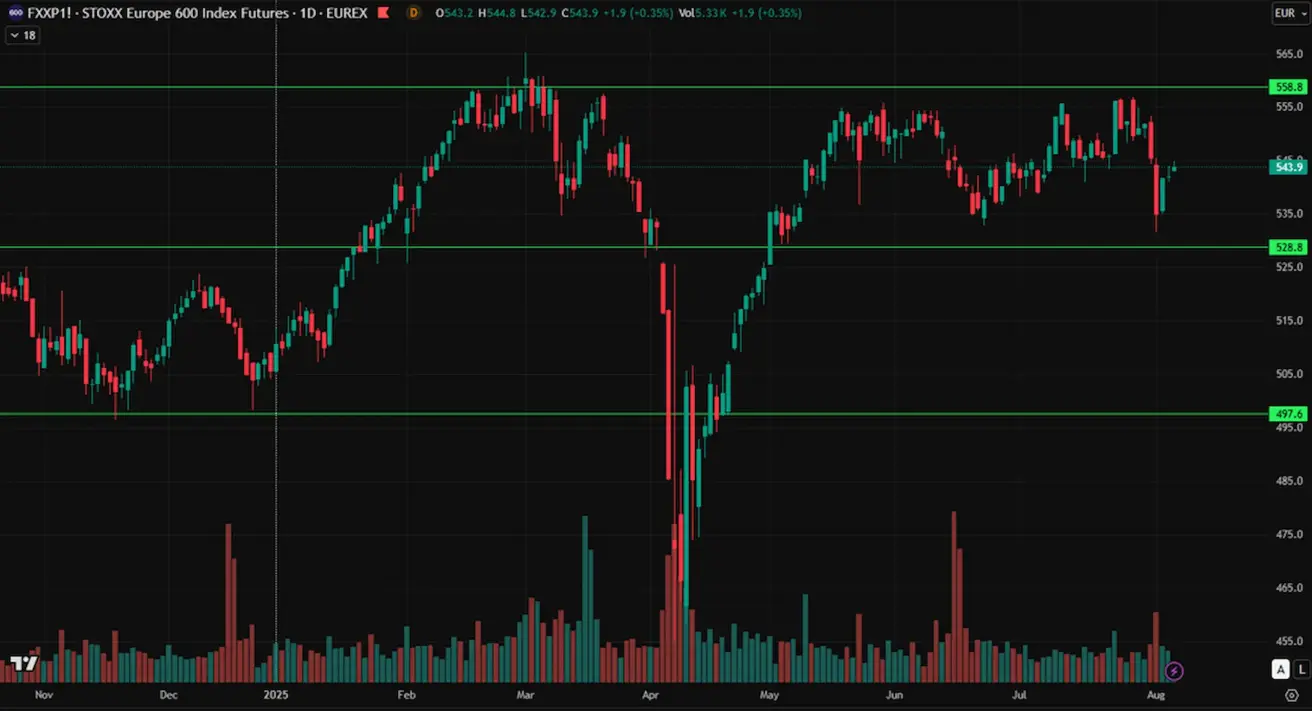
Euro Stoxx 600
Weekly performance: -3.17%, with a closing level of 534.9. YTD: +5.8%
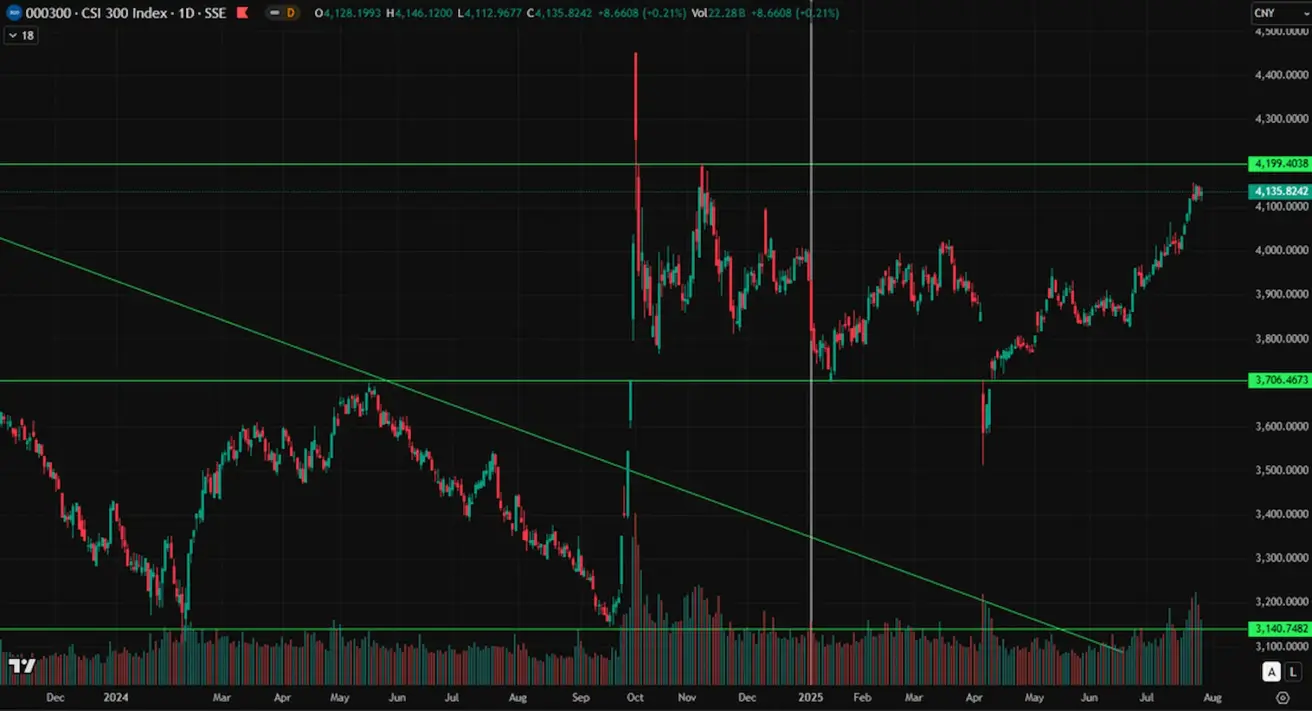
CSI Index
Weekly performance: +1.95% (weekly close: 4127), YTD: +4.99%
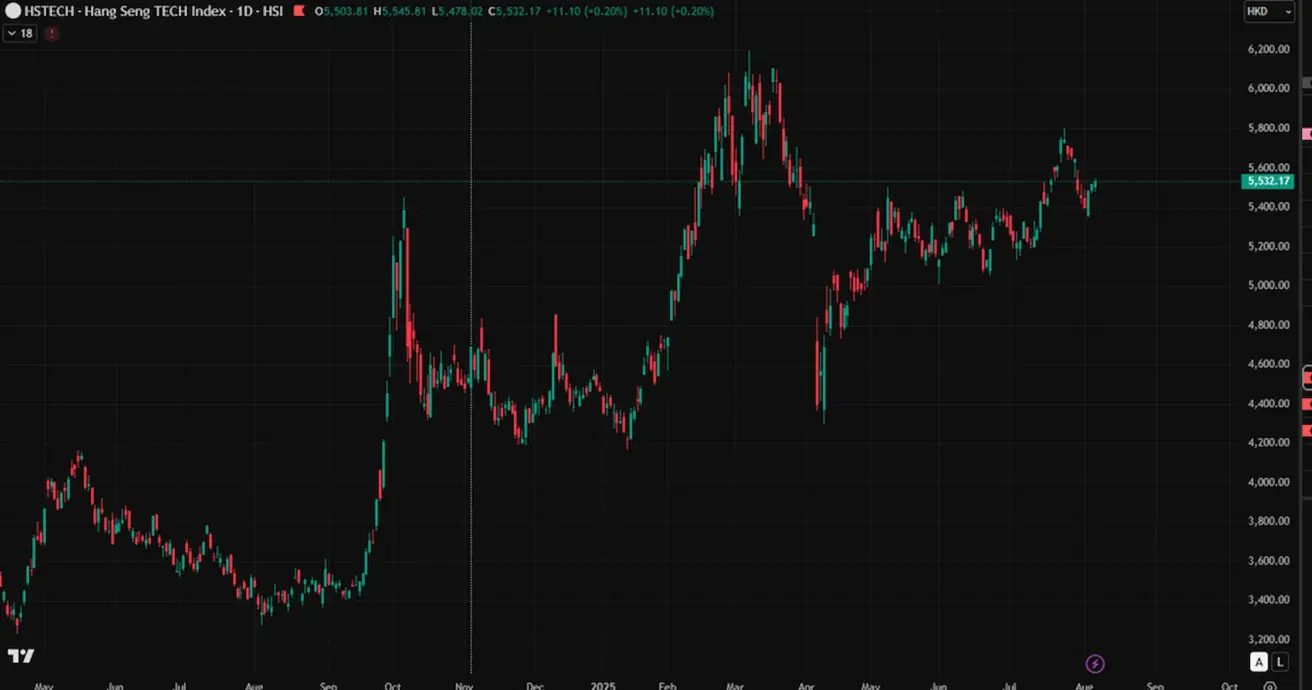
Hang Seng TECH Index
Weekly performance: -4.93% (weekly close: 5397), YTD: +21.64%
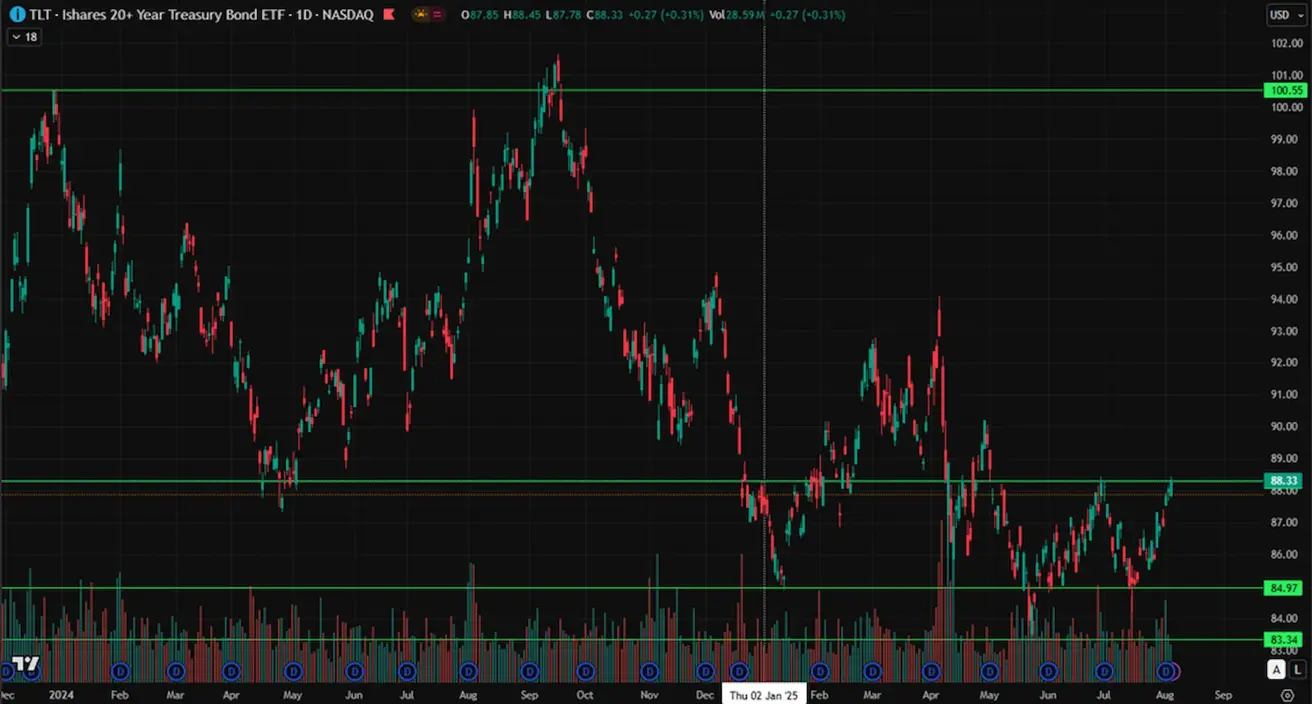
BOND MARKET
Yields declined over the course of the week. Long-Term U.S. Treasuries (ETF: TLT 20+): +1.61% (weekly close at 87.82). Year-to-date (2025): +0.02%
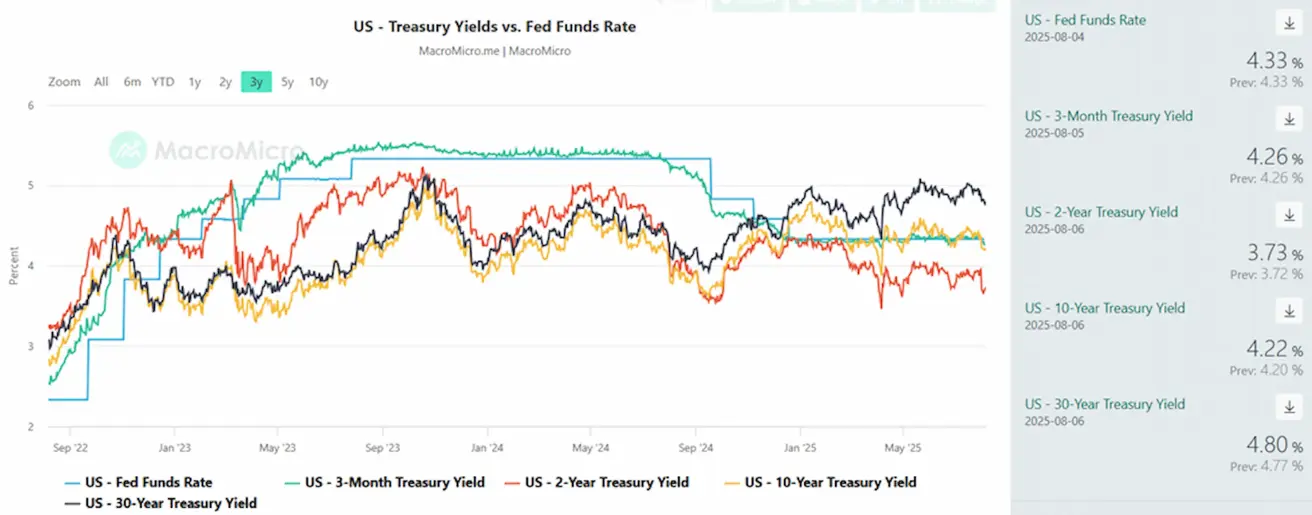
YIELDS AND SPREADS 2025/06/30 vs 2024/07/07
- Market Yield on 10-Year U.S. Treasuries: 4.22% (vs. 4.39%)
- ICE BofA BBB U.S. Corporate Index Effective Yield: 5.13% (vs. 5.28%)
- Yield Spread: 10-year vs. 2-year Treasuries: 49.0 vs. 46.0 bps
- Yield Spread: 10-year vs. 3-month Treasuries: -4.0 vs. 3.0 bps
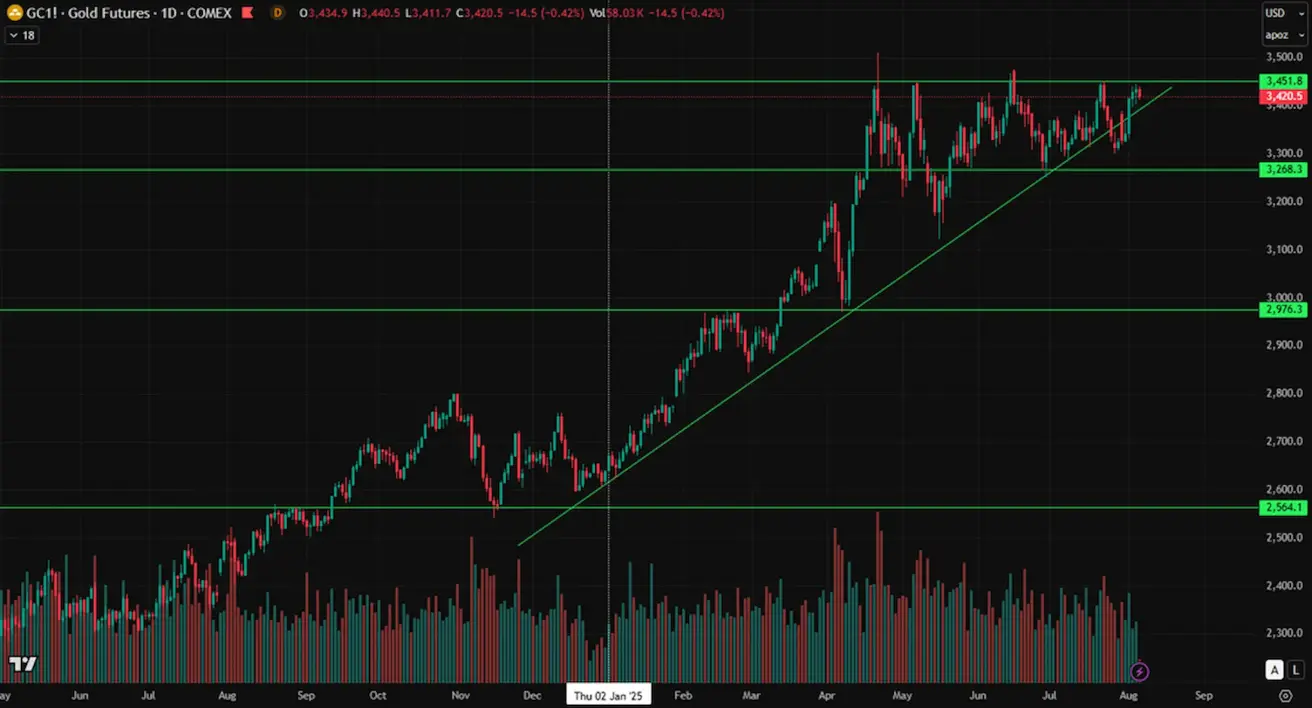
GOLD FUTURES (GC)
Weekly performance: +2.32%. Week’s closing price: $3,416 per troy ounce. Year-to-date (YTD) performance: +29.34%.
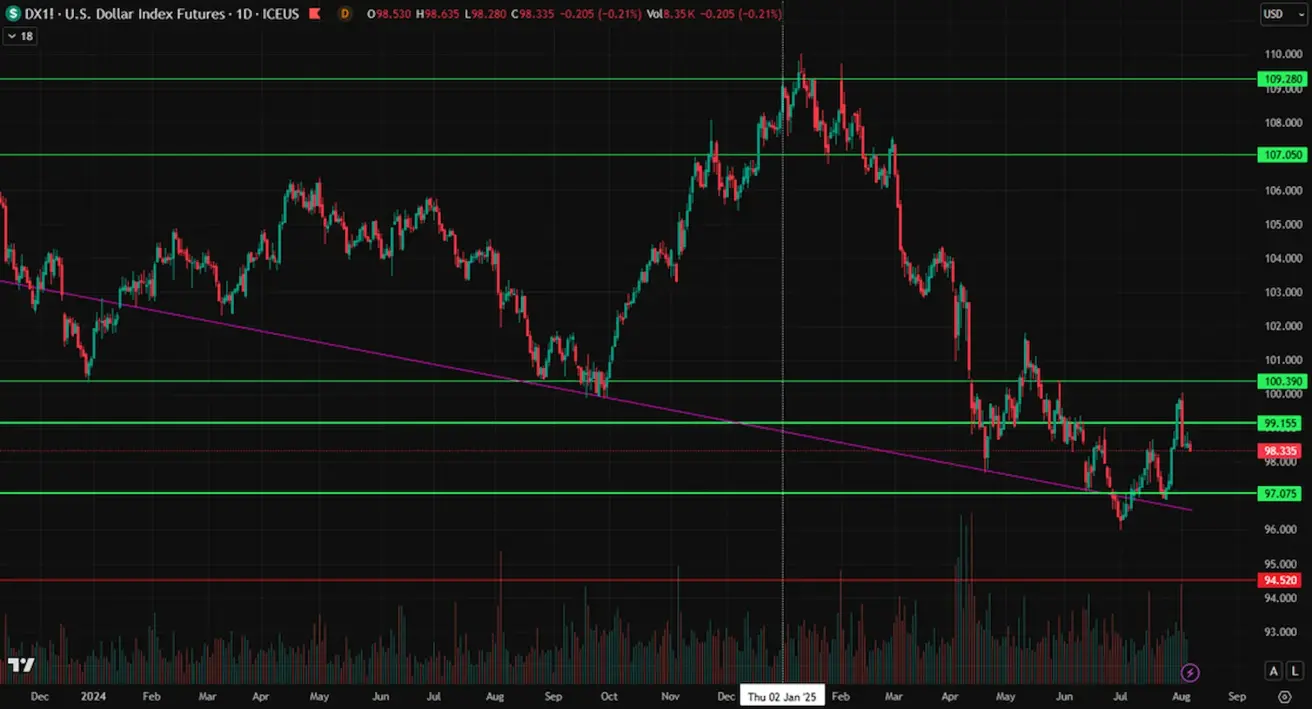
DOLLAR INDEX FUTURES (DX)
Weekly performance: +1.07%. Week’s closing level: 98.475. Year-to-date (2025) performance: –9.10%
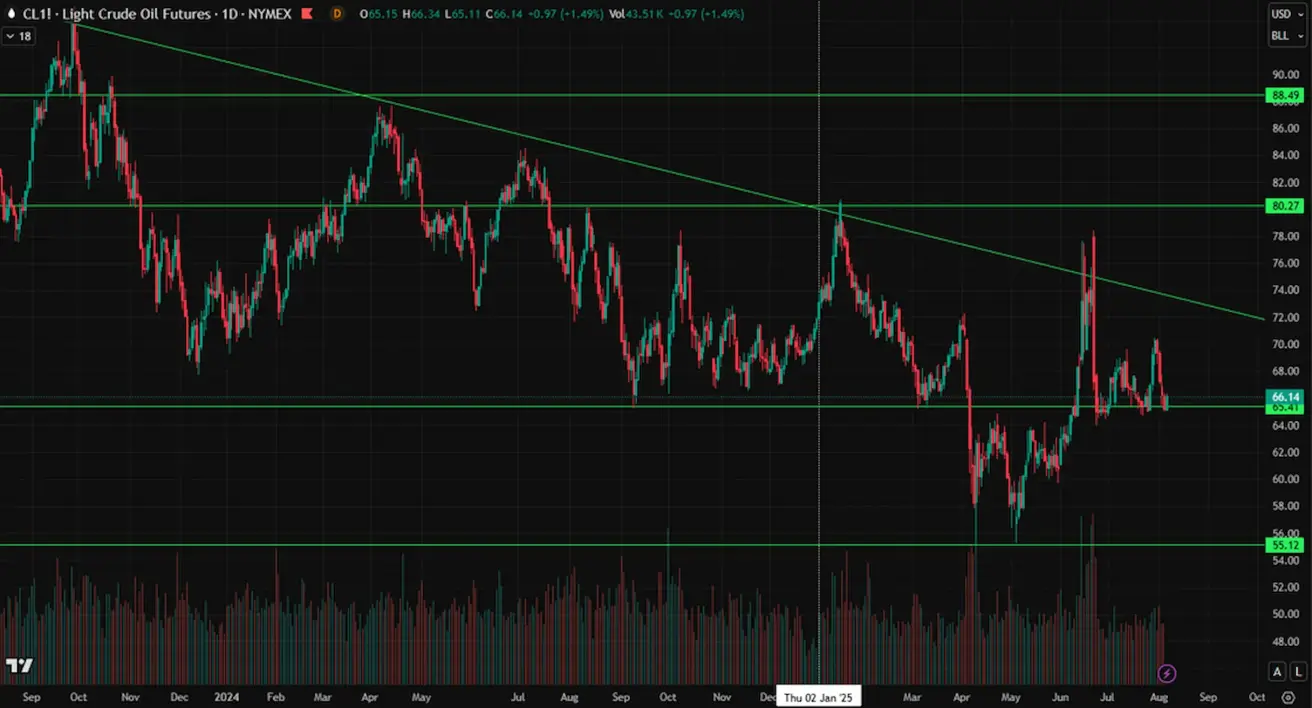
OIL FUTURES
Weekly performance: +3.37%. Week’s closing price: $67.26 per barrel. Year-to-date (YTD) performance: –6.39%.
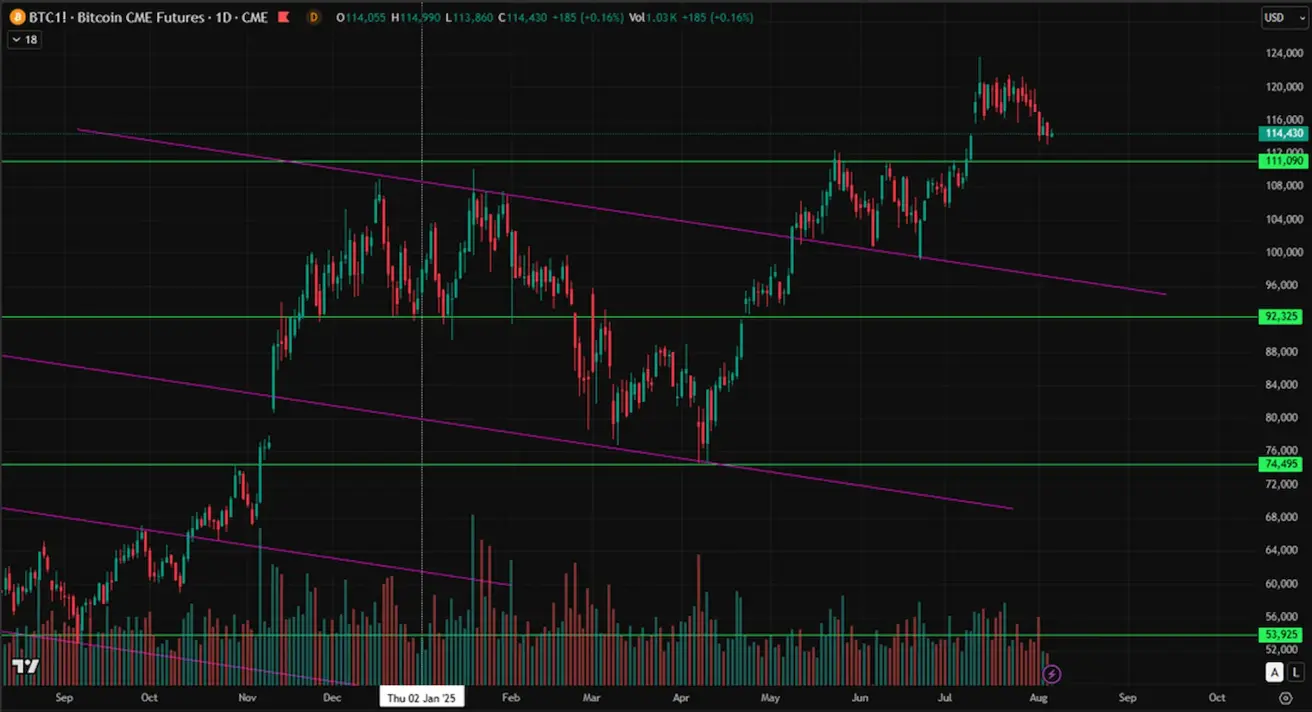
BTC FUTURES
Weekly performance: -3.41%. Week’s closing price: $114,265. Year-to-date (2025) performance: +19.94%
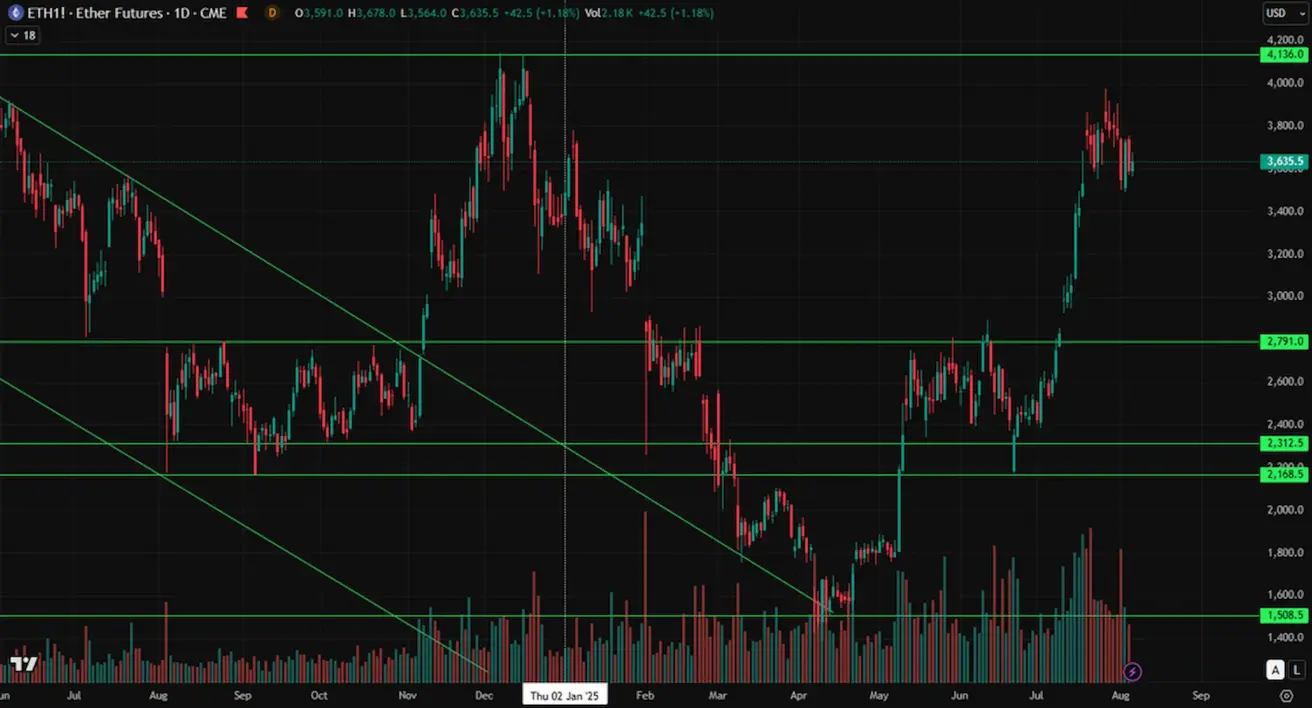
ETH FUTURES
Weekly performance: -5.7%. Week’s closing price: $3,533. Year-to-date (2025) performance: +4.40%.
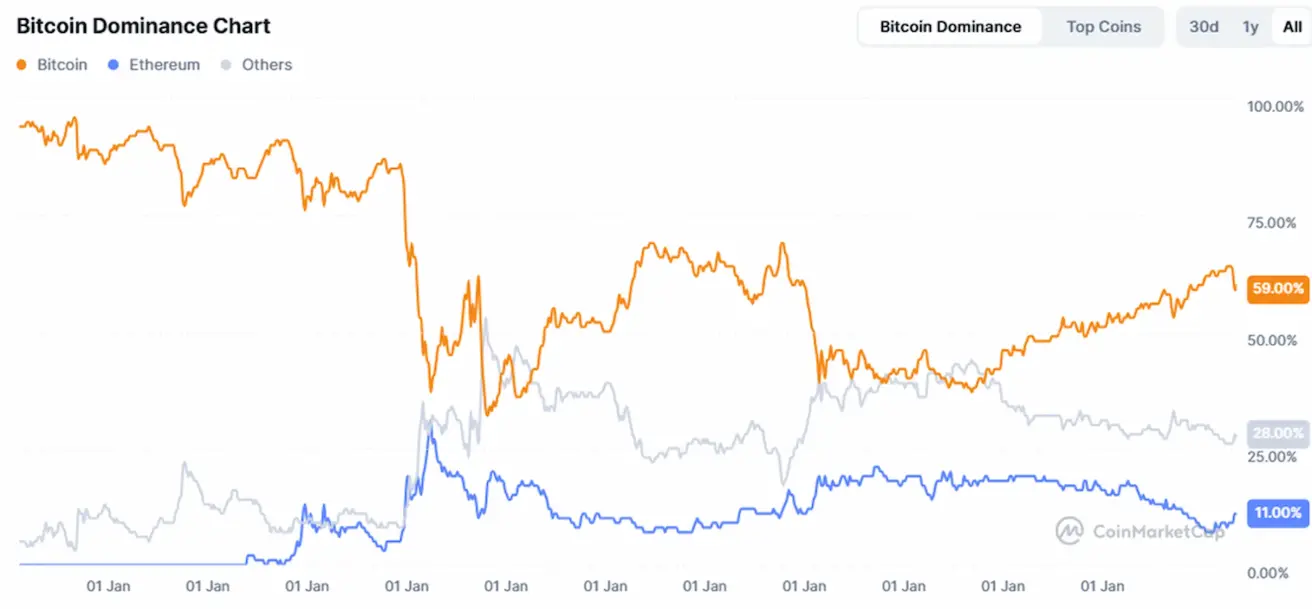
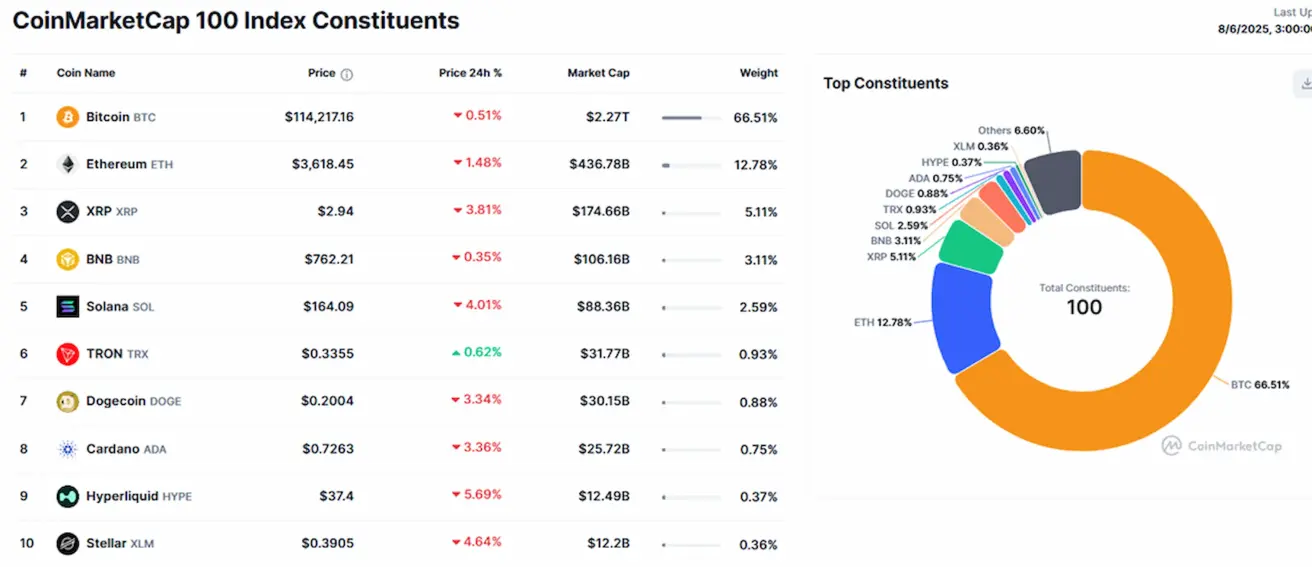
Cryptocurrency Market Overview
- Cryptocurrency Market Capitalization: $3.72 trillion (vs. $3.95 trillion a week earlier) — source: coinmarketcap.com.
- Bitcoin dominance: 61.1% (previously 59.9%)
- Ethereum dominance: 11.7% (previously 11.9%)
- Other cryptocurrencies: Relatively stable at 27.2% (vs. 28.2%)