 Lietuvių
 Русский
 Қазақша
 Eesti
EestiMarch 16 – 22, 2026: Weekly economic update
Key market updates

The Federal Reserve kept rates unchanged at 3.50–3.75% and stated that no cuts will be considered until clear and tangible progress on inflation is achieved.
A rate hike was discussed during the meeting; however, it was emphasized that this scenario is not the baseline. Powell pointed to a rise in short-term inflation driven by energy shocks and maintained the outlook for a single rate cut in 2026. Meanwhile, the swaps market (FedWatch) does not anticipate any rate cuts this year.
The European Central Bank (ECB) also held rates steady but revised its inflation forecasts upward while lowering its GDP growth projections. The rhetoric of ECB officials is shifting toward a more hawkish monetary stance.
The People’s Bank of China (PBoC): rates remain unchanged. Government spending in January–February increased by 6% — the fastest pace since 2022. Authorities are placing greater emphasis on fiscal stimulus.
The conflict in the Middle East remains without a clear path to resolution. As a result, equity indices and bond markets are under pressure.
United States (key takeaways):
- Rates unchanged; communication remains cautious;
- Monetary policy stance is moderately restrictive;
- U.S. macro data continues to support a soft-landing scenario, with rising inflation risks, a cooling labor market without signs of recession, and no immediate need for rate cuts.
INFLATION: CONSUMER PRICE INDEX (FEBRUARY):
- Core CPI: (m/m) 0.2% (prev: 0.3%); (y/y) 2.5% (prev: 2.5%).
- CPI: (m/m) 0.3% (prev: 0.2%); (y/y) 2.4% (prev: 2.4%).
PRODUCER PRICE INDEX (FEBRUARY):
- PPI (m/m): 0.7%, prev: 0.5%.
- Core PPI (m/m): 0.5%, prev: 0.8% (revised):
INFLATION EXPECTATIONS (MICHIGAN) (FEBRUARY):
- 12-month inflation expectations: 3.4%, prev: 4.0%.
- 5-year inflation expectations: 3.3%, prev: 3.3%.
U.S. GDP Deflator (QoQ): 3.8% (previous: 3.7%)
U.S. GDP (Bureau of Economic Analysis, BEA) — Q4 2025, annualized (second estimate): +0.7% (Q3 2025: +4.4%).
Atlanta Federal Reserve GDPNow Indicator (the “real-time” estimate of official GDP before its release): 2.3% (previous: 2.2%).
BUSINESS ACTIVITY INDEX (PMI) (FEBRUARY):
(Above 50 indicates expansion; below 50 indicates contraction)
- Services sector: 51.7 (prev: 52.7);
- Manufacturing sector: 51.2 (prev: 52.4);
- S&P Global Composite: 51.9 (prev: 53.0).
LABOR MARKET (BLS) (FEBRUARY)
- Unemployment rate: 4.3% (prev: 4.4%);
- Total number of continuing jobless claims in the U.S.: 1,857K (prev: 1,850K);
- Initial jobless claims: 205K (prev: 213K);
- Change in nonfarm payroll employment: 130K (prev: 48K);
- Change in private nonfarm payroll employment: 172K (prev: −64K);
- Average hourly earnings (y/y): 3.7% (prev: 3.8%);
- JOLTS job openings: 6.542M (prev: 6.928M).
MONETARY POLICY
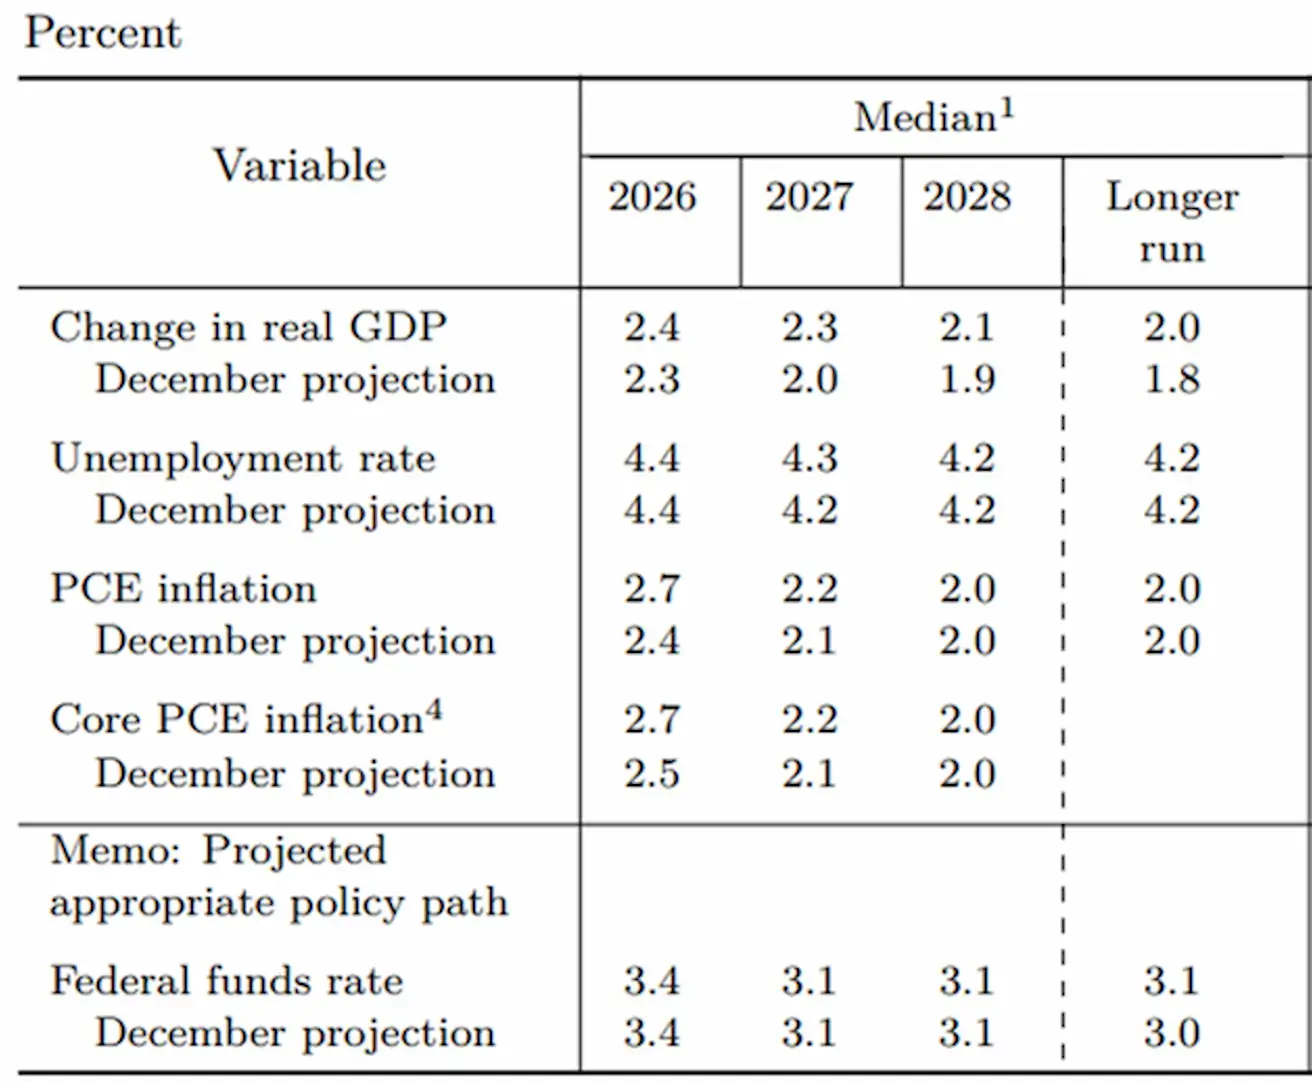
The Committee revised its 2026 GDP growth forecast upward to 2.4% and increased its inflation expectations to 2.7% for both PCE and Core PCE (personal consumption expenditures). The policy rate (EFFR) projection remains unchanged: one 0.25% cut in 2026 to a range of 3.25–3.50%, followed by one additional cut in 2027 to 3.00–3.25%, with this range maintained over the longer term.
The focus has shifted toward inflation, which remains above target, shows signs of renewed acceleration (PCE: 2.8–3.0%), and may rise further due to energy prices and tariffs. Against this backdrop, the labor market is showing signs of cooling (declining labor demand and weak job growth). However, it does not yet warrant immediate monetary easing. Accordingly, the risks of premature easing are currently assessed as elevated.
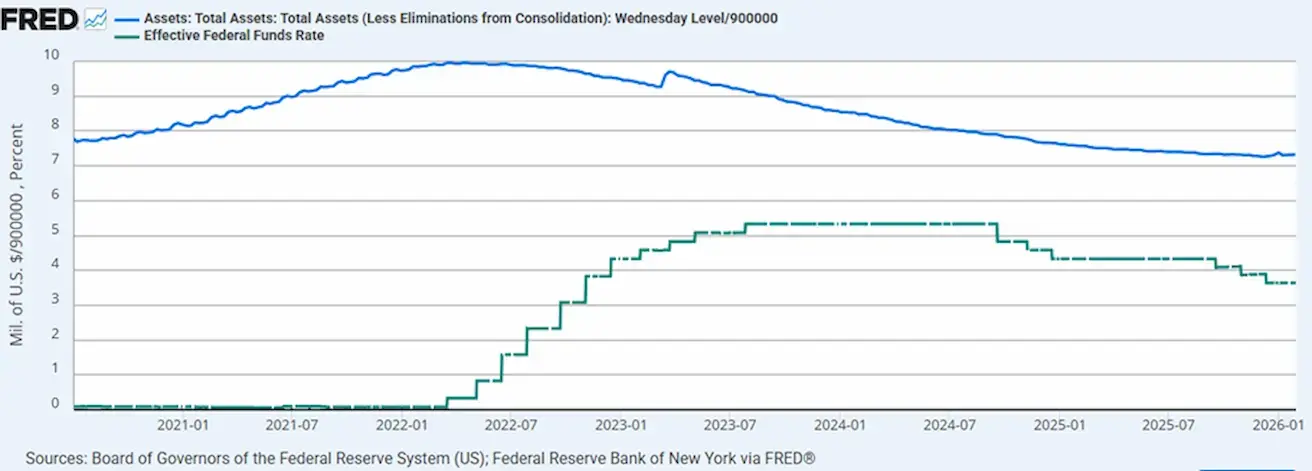
Effective Federal Funds Rate (EFFR): 3.50%–3.75%;
The Federal Reserve’s balance sheet stands at $6.657 trillion, up 1.87% since the suspension of QT ($6.535 trillion):
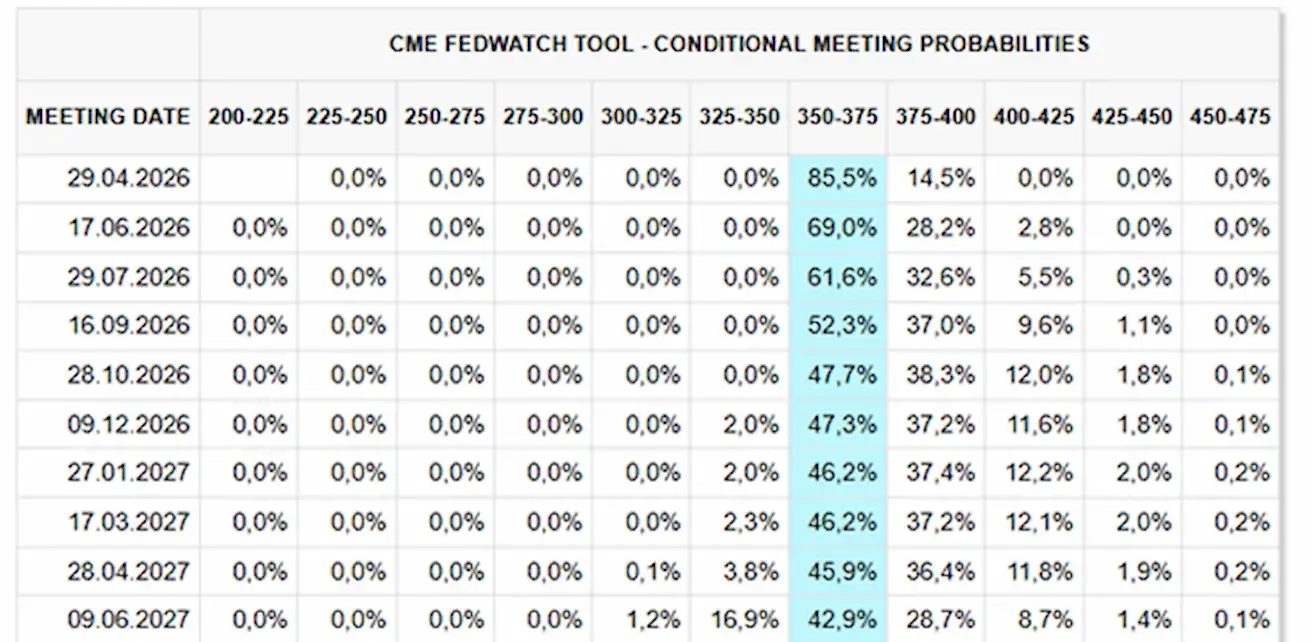
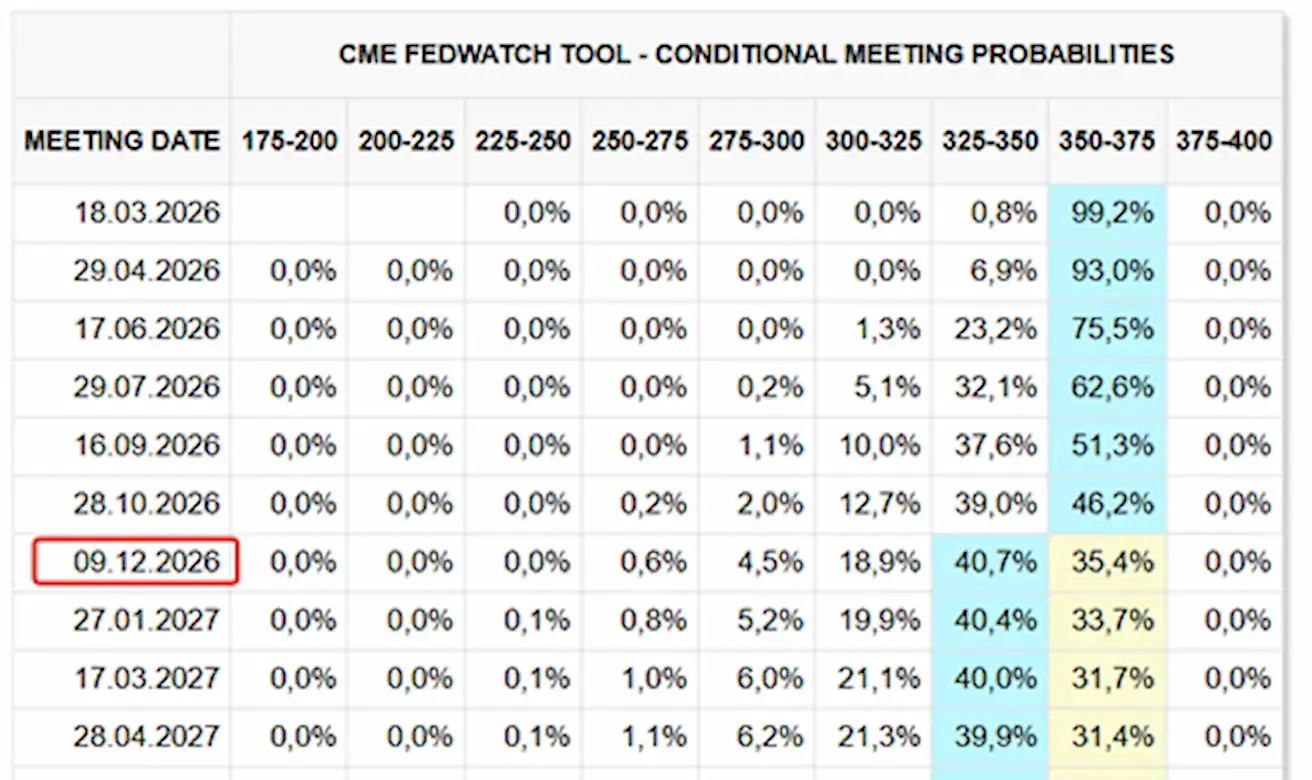
MARKET FORECAST FOR RATE (FEDWATCH)
For the upcoming meeting (April 29), the estimated probability of holding rates is 85.5%, while the probability of a hike is 14.5%.
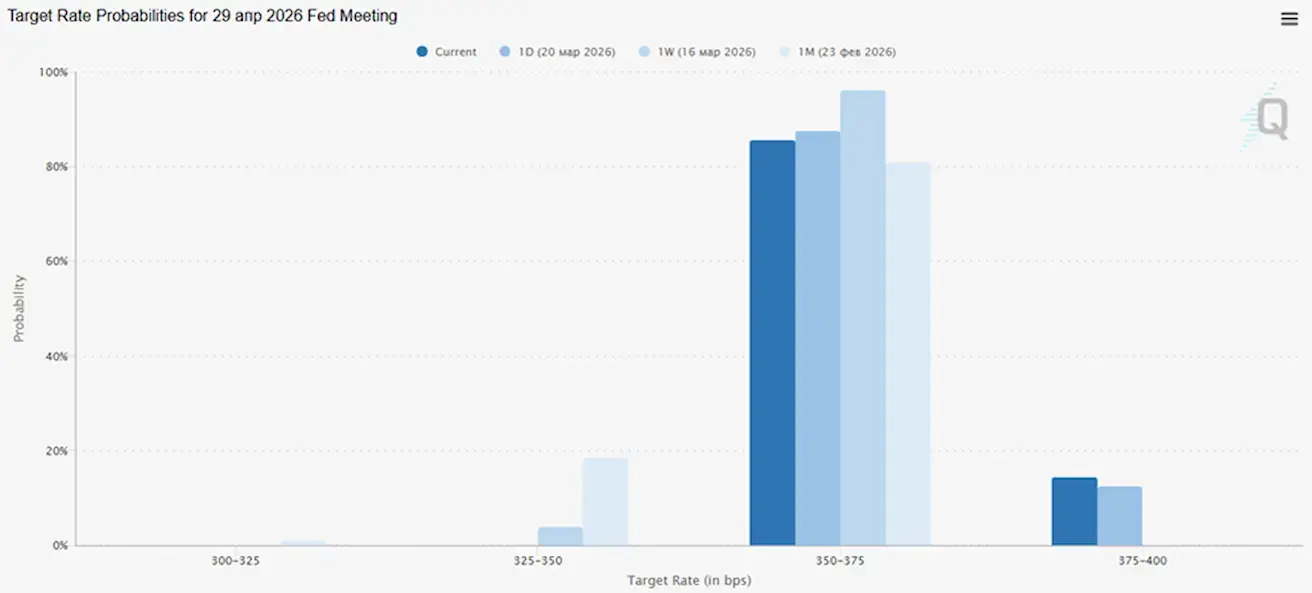
Over the next 12 months, the market is no longer pricing in any rate cuts.
Today:
А week earlier:
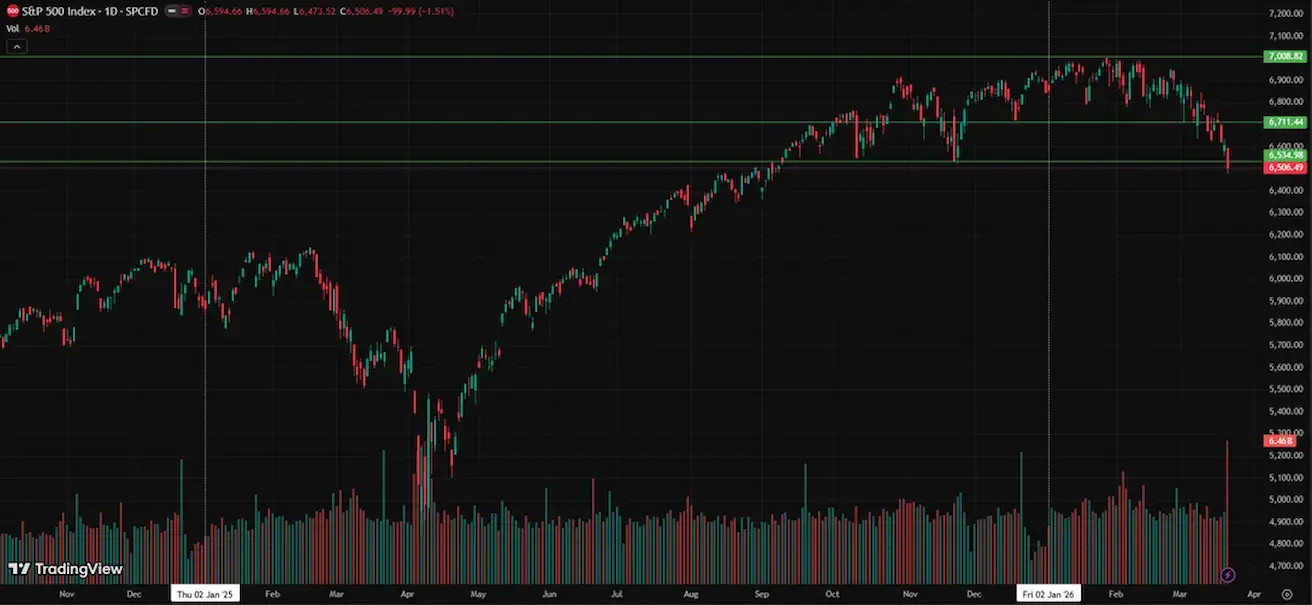
SP500
Weekly performance: –1.90% (week-end close at 6506,49); year-to-date: -4,95%.
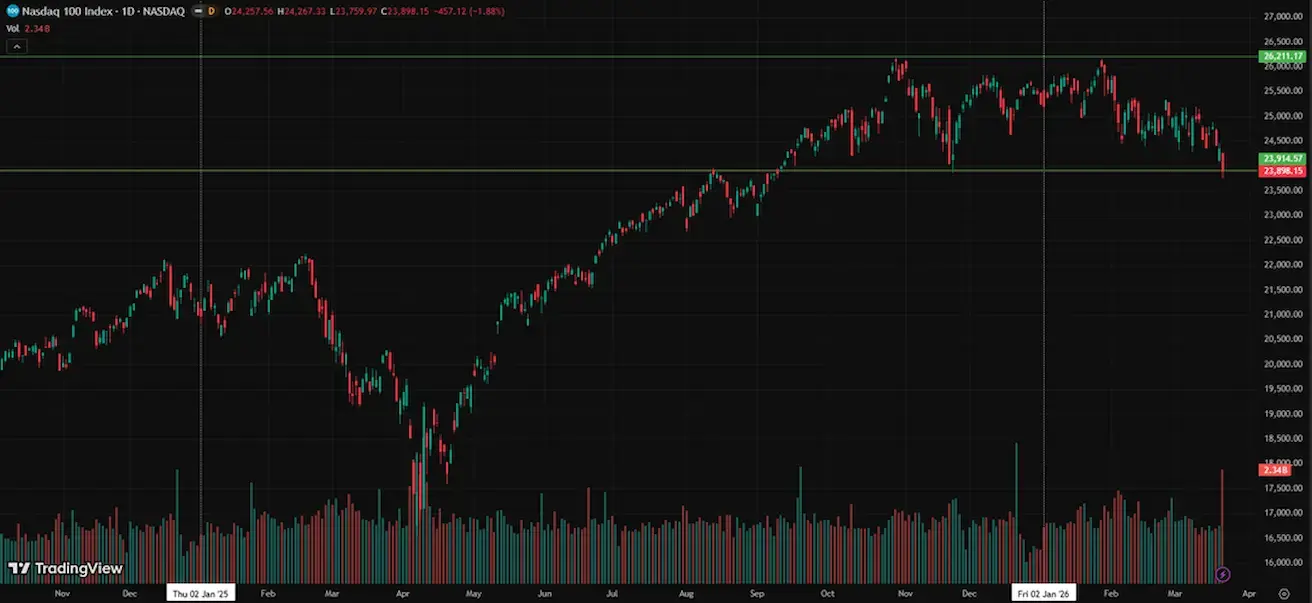
NASDAQ100
Weekly performance: -1,98% (week-end close at 23898,15); year-to-date: -5,35%.
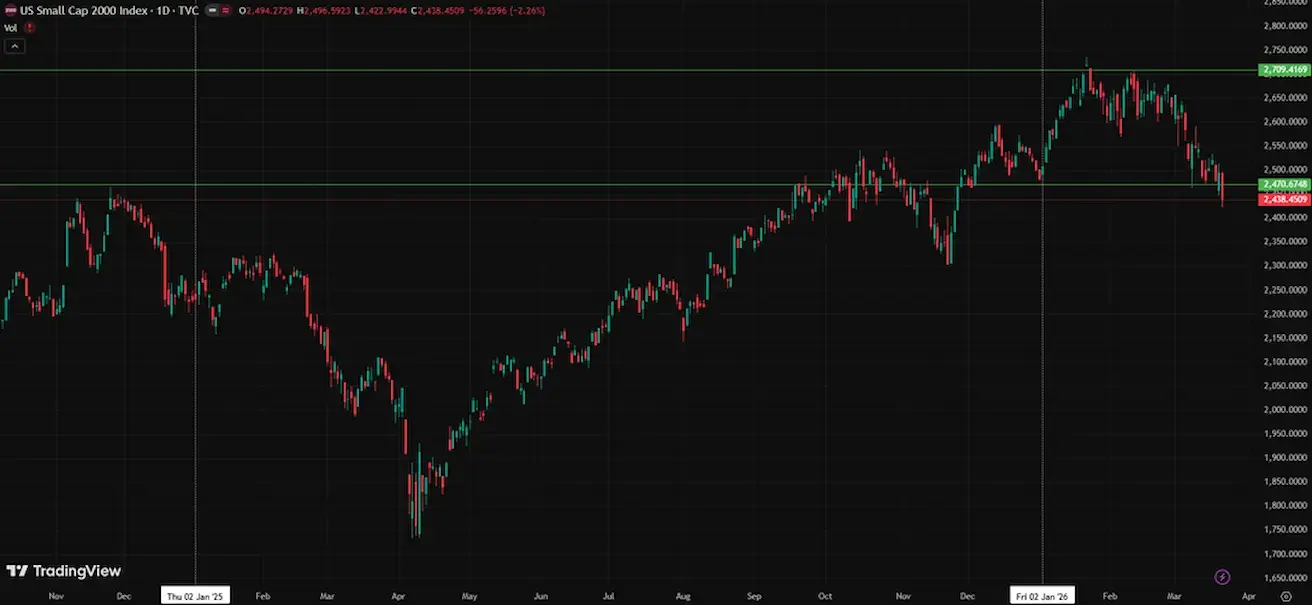
RUSSEL 2000 (RUT)
Weekly performance: -1,68% (week-end close at 2438,45); year-to-date: -1,75%.
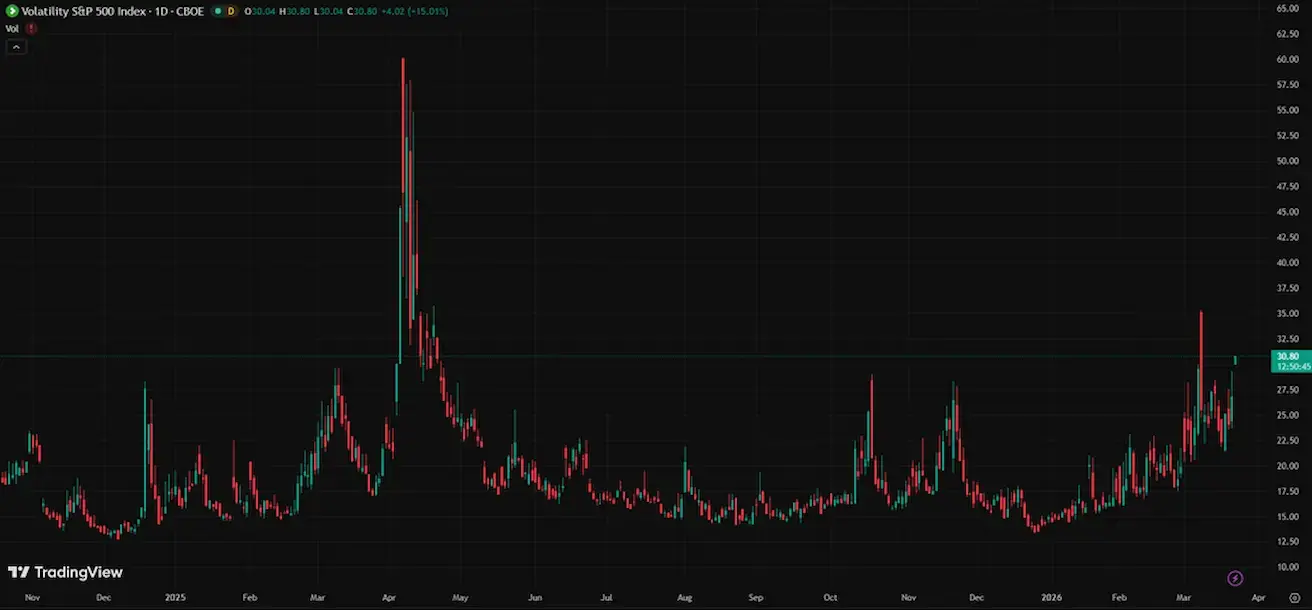
VIX
VIX (Volatility Index): 30,82
Eurozone
- Rates remain unchanged for now, but inflation risks are rising;
- The monetary policy stance is neutral, though the balance of risks is tilted toward inflation;
- Amid the escalation of the conflict in the Middle East, the ECB has revised its GDP growth forecasts downward and increased its inflation projections for the coming years.
ECB Meeting: rates were kept unchanged; however, the war in the Middle East is expected to have a significant short-term impact on inflation through higher energy prices.
According to updated ECB staff projections:
- In the baseline scenario, headline inflation is expected to average 2.6% in 2026, 2.0% in 2027, and 2.1% in 2028. Compared to the December projections, inflation has been revised upward, particularly for 2026;
- Core inflation (excluding energy and food) is projected to average 2.3% in 2026, 2.2% in 2027, and 2.1% in 2028 — also above the December forecasts;
- Economic growth is expected to average 0.9% in 2026, 1.3% in 2027, and 1.4% in 2028, implying a downward revision, especially for 2026;
- At the same time, low unemployment, a resilient private sector financial position, and government spending on defense and infrastructure are expected to continue supporting growth;
- Policy decisions will be guided by underlying inflation.
Interest rates:
- Deposit facility rate: 2.0% (prev. 2.0%);
- Marginal lending facility: 2.4% (prev. 2.4%);
- Main refinancing (key) rate: 2.15% (prev. 2.15%).
Inflation: Consumer Price Index (CPI) (February):
- Core CPI (YoY): 2.4% (prev. 2.2%);
- CPI (MoM): 0.6% (prev. -0.6%, revised);
- CPI (YoY): 1.9% (prev. 1.7%).
GDP (Q4, final):
- QoQ: 0.3% (prev. 0.3%);
- YoY: 1.3% (prev. 1.4%).
Unemployment rate (February): 6.10% (prev. 6.20%).
PMI (February):
- Services: 51.9 (prev. 51.8);
- Manufacturing: 49.5 (prev. 49.4);
- S&P Global Composite: 51.9 (prev. 51.9).
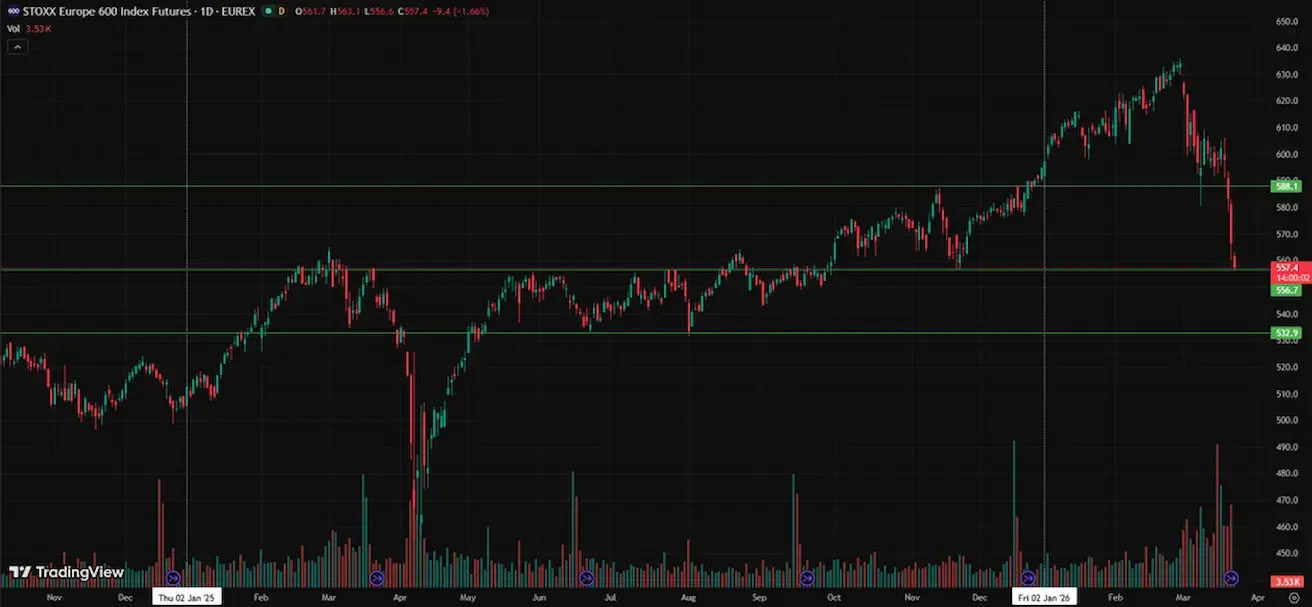
EURO STOXX 600 (FXXP1!)
Weekly performance: -4,85% (Week-end close: 566,8); Year-to-date: -4,58%.
China
The economy is stabilizing on the back of exports, while domestic demand and investment remain weak; stimulus measures are targeted and cautious.
- Rates remain unchanged;
- The monetary policy stance is accommodative;
- China has announced the continuation of fiscal support for economic growth under its 2026 plan.
PBoC meeting: rates unchanged.
Government spending in January–February increased by 6% — the fastest pace since 2022.
Interest rates:
- 1Y Loan Prime Rate: 3.00%;
- 5Y Rate: 3.50%.
Inflation indicators (February):
- CPI: MoM 0.1% (prev. 0.2%); YoY 1.3% (prev. 0.2%);
- PPI YoY: -0.9% (prev. -1.4%).
GDP (Q4, final):
- QoQ: 1.2%;
- YoY: 4.5%.
Unemployment rate (February): 5.3%.
- Industrial production (February, YoY): 6.3%.
- Fixed asset investment (January, YoY): -3.8%.
- Retail sales (January, YoY): 0.9%.
Trade:
- Imports: 19.8%;
- Exports: 21.8%;
- Trade balance: $213.62 billion.
PMI:
- Manufacturing: 49.0;
- Non-manufacturing: 49.5;
- Composite: 49.5.
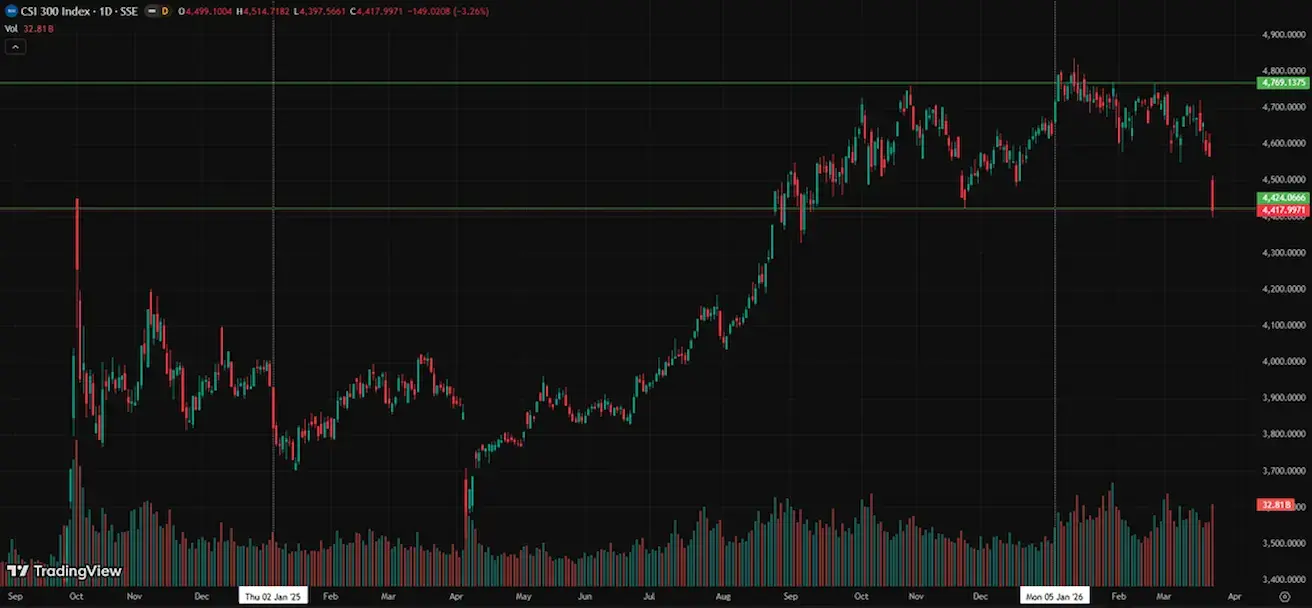
CSI 300 INDEX (000300.HK)
Weekly performance: -2,19%.
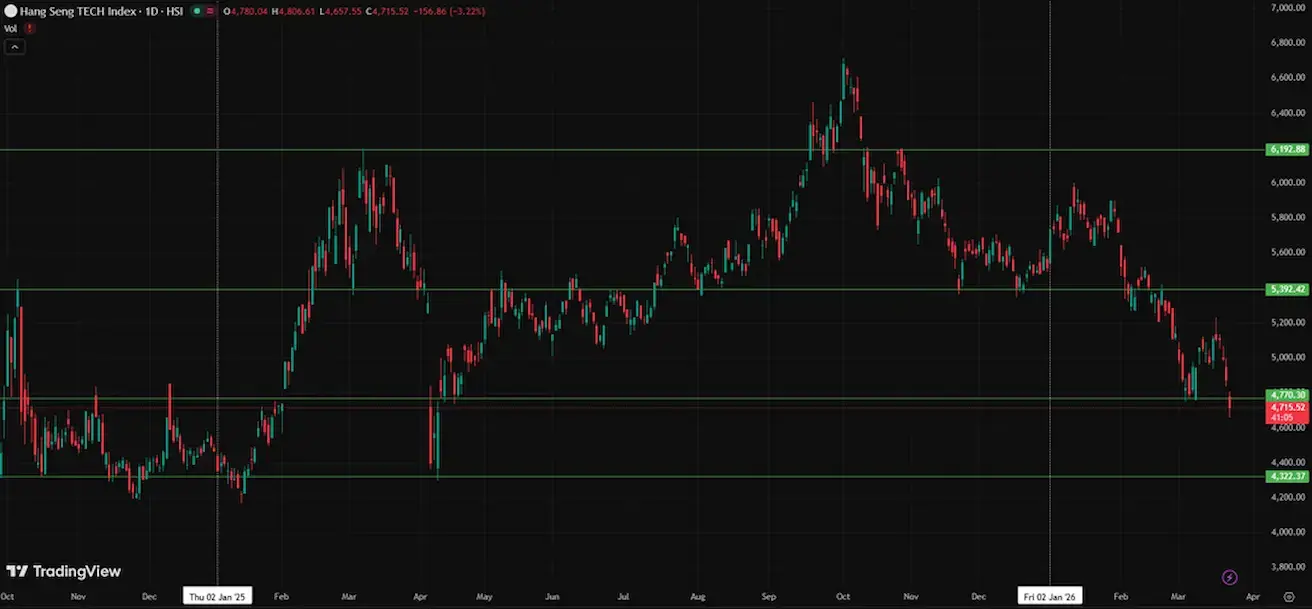
Hang Seng TECH Index (HSTECH)
Weekly performance: -2,12%.
BOND MARKET
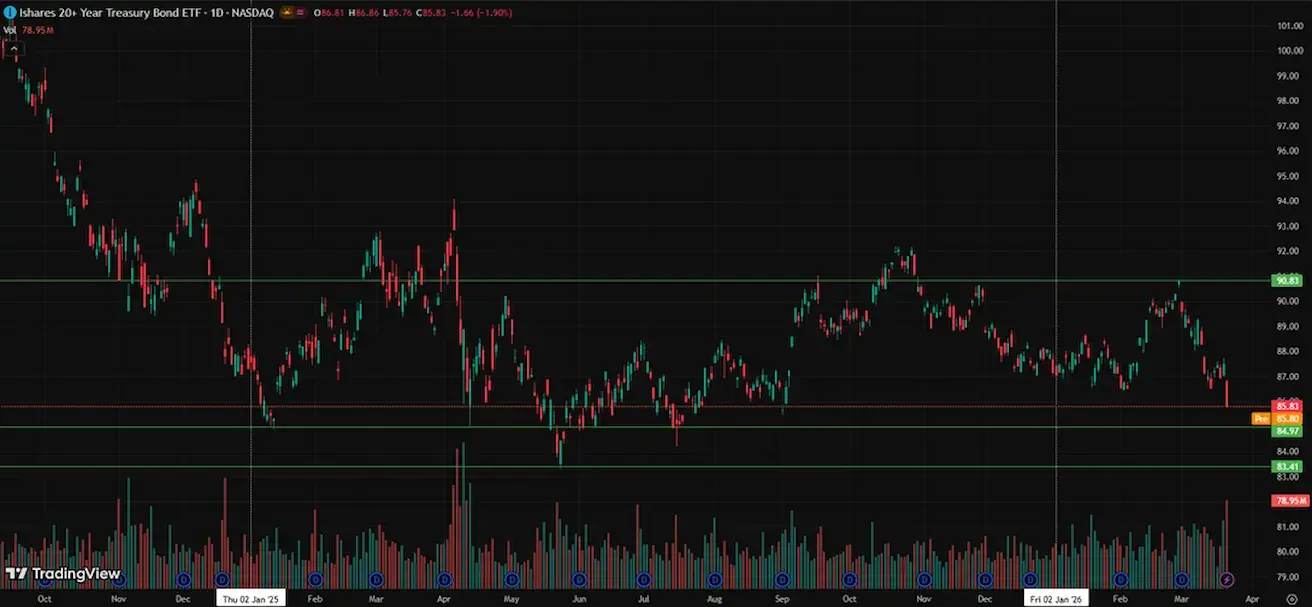
U.S. Treasury bonds 20+ years (ETF TLT): weekly performance: -0.82%.
YIELDS AND SPREADS
Since the onset of the conflict, yields have continued to rise across the entire curve, particularly at the long end, indicating increasing inflation expectations.
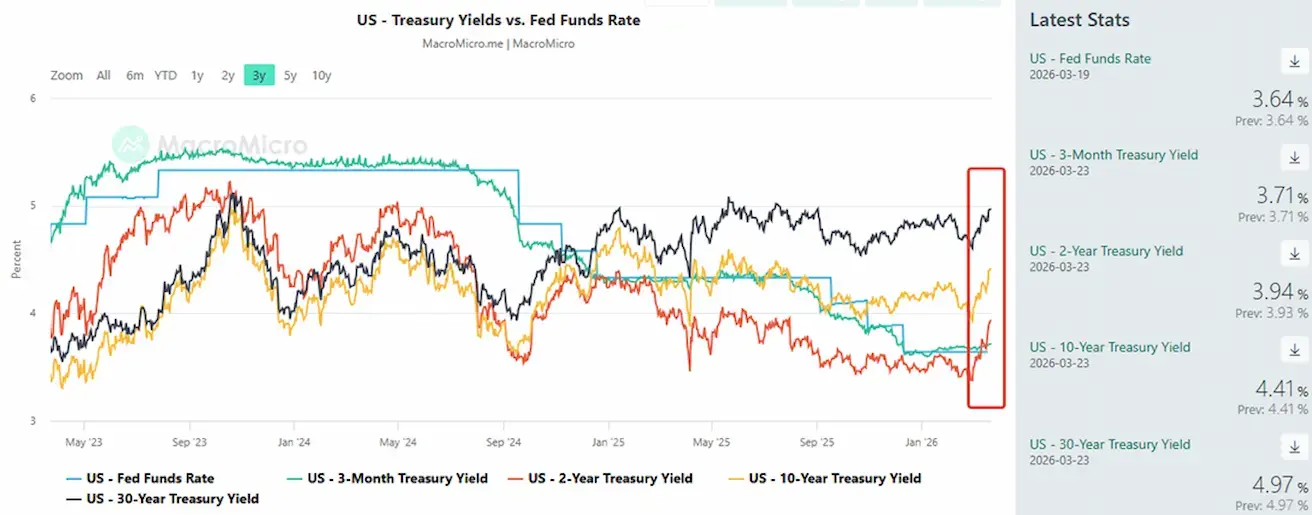
Market Yield on U.S. Treasury Securities at 10-Year Constant Maturity: 4.41%;
2-year Treasury yield: 3.94%.
- ICE BofA BBB US Corporate Index Effective Yield: 5.29%;
- 10Y–2Y spread: 47 bps;
- 10Y–3M spread: 70 bps.
CDS (5Y): 37.35 bps.
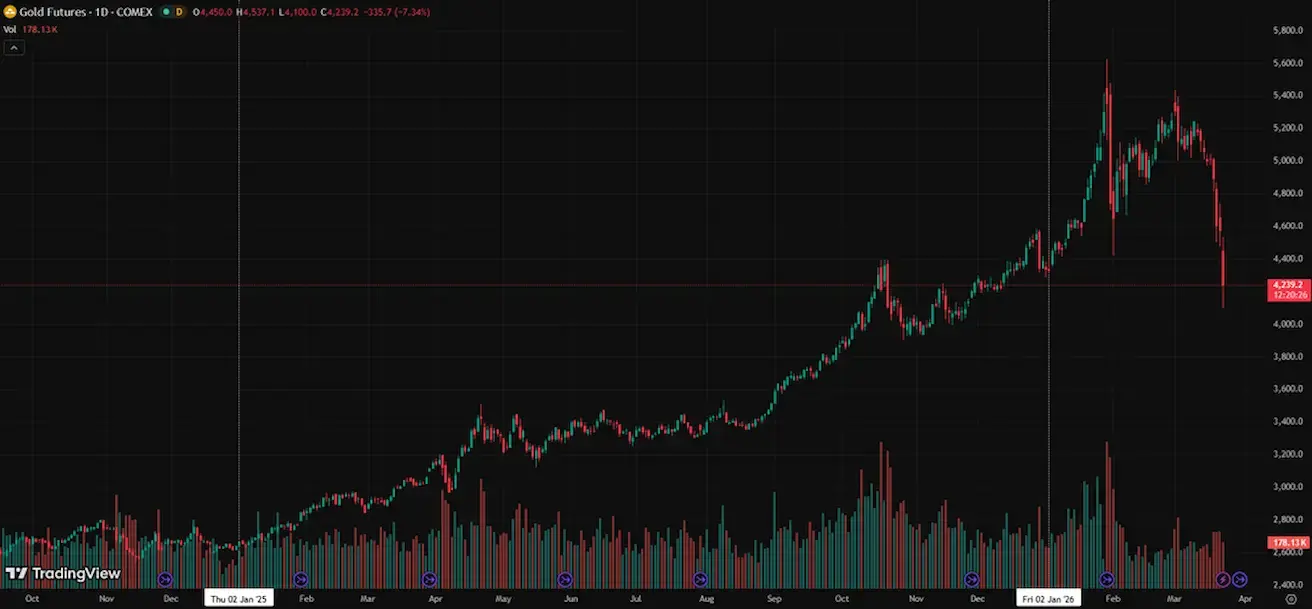
GOLD FUTURES (GC)
Weekly performance: -9,62% (week close: $4574,9 per troy ounce); Year-to-date: +5.60%. Decline since the start of the week: -7.12%.
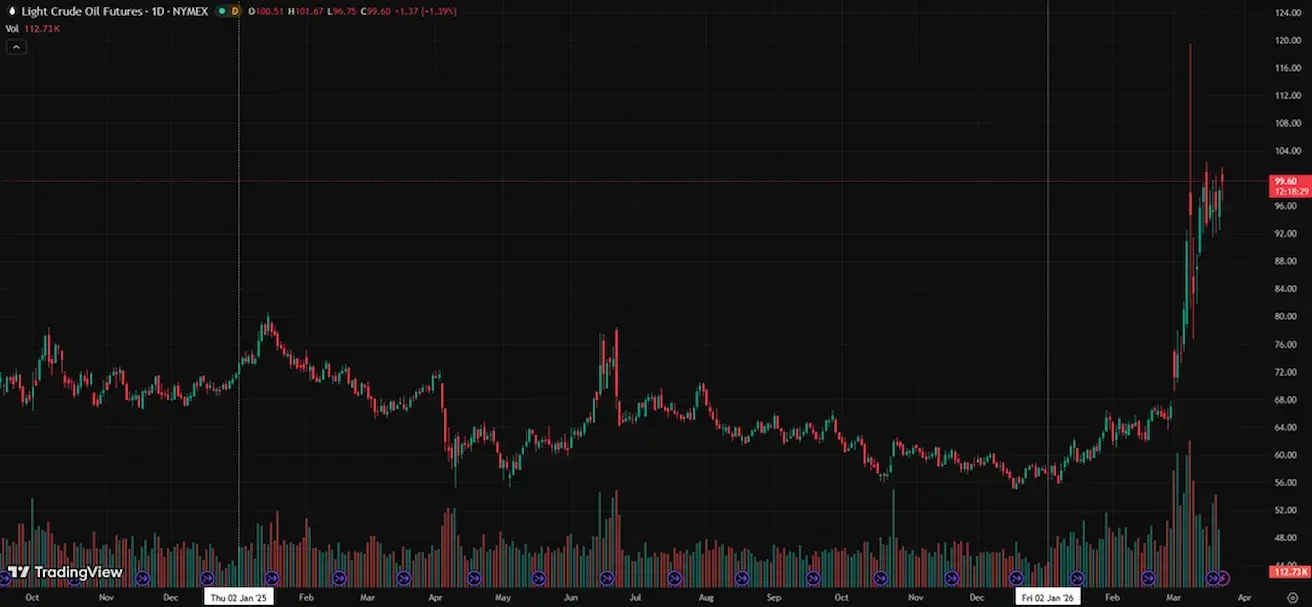
OIL FUTURES
Weekly performance: -0,49% (week-end close: $98,23 per barrel). Year-to-date performance: +71,10%
- IEA member countries have begun drawing on strategic reserves.
- Geopolitical risks in the Middle East may take on a long-term character.
Yemeni Houthis (an Iranian proxy) are threatening to block the Bab el-Mandeb Strait. The chart compares historical oil supply shocks (as a percentage of global supply) and oil price reactions before and after such events (wars and conflicts in the Middle East, etc.):
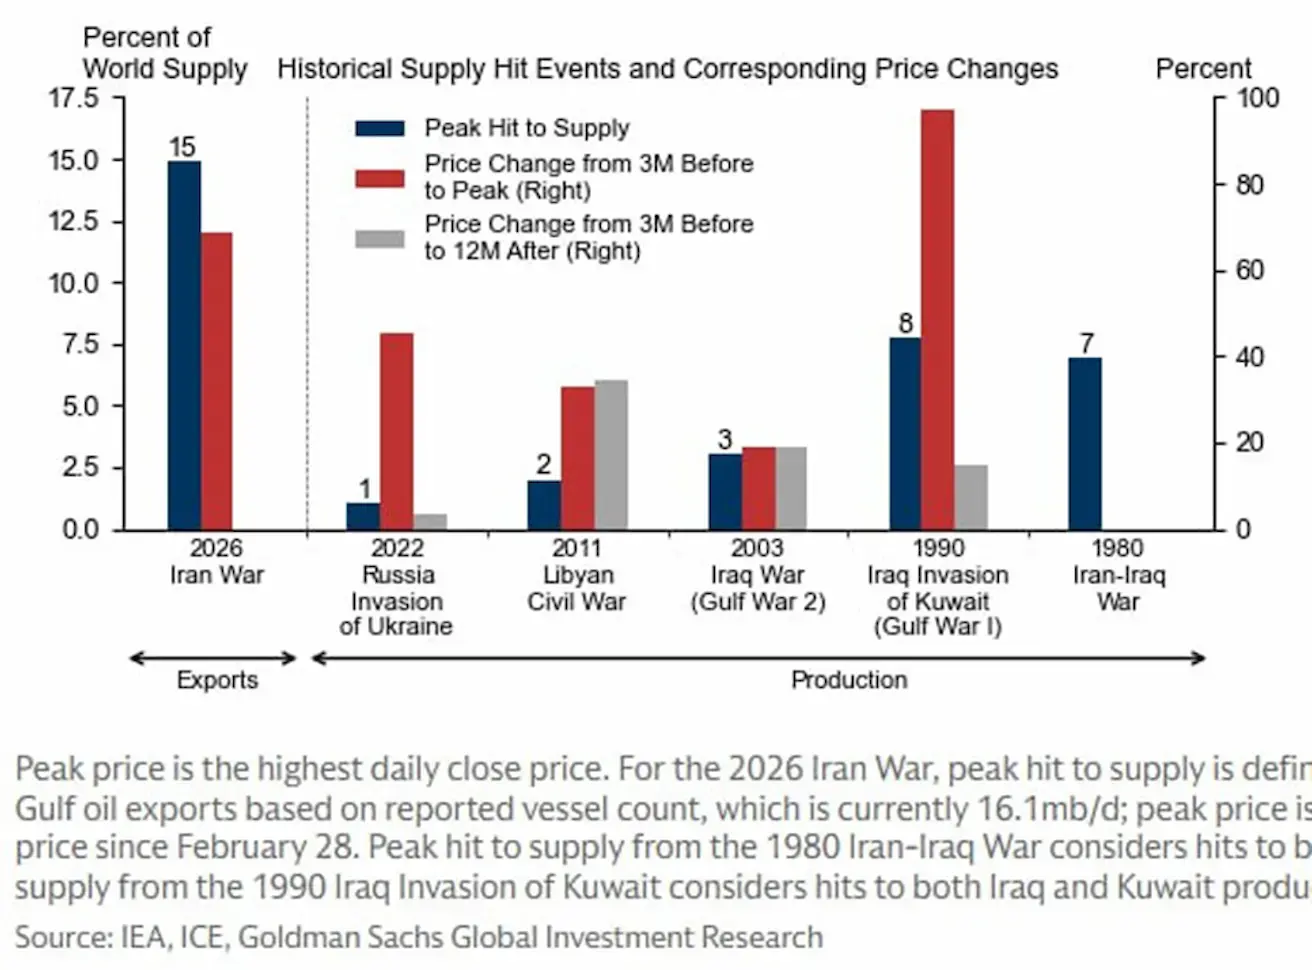
Price dynamics over a 1–3 month horizon after the onset of a conflict:
Even relatively minor supply disruptions (1–3%) can lead to significant price increases. More severe shocks (7–15%) are associated with sharp price spikes (up to ~80–100% growth). In the current case (Iran 2026), the estimated supply disruption is around 15% of global supply (an extremely high level). The market has already begun pricing in higher prices, and historically, such shocks have led to rapid, substantial increases in oil prices.
Price dynamics over a 3–12 month horizon after the onset of a conflict:
In most cases, following the initial price spike, the market partially corrects or stabilizes. Price growth typically slows, and in some instances prices even decline (e.g., Iran–Iraq, Kuwait). While exceptions exist, on average, the impact of such shocks is temporary, provided there is no prolonged disruption to supply.
Historically, even significant oil supply shocks trigger sharp short-term price increases; however, over a 6–12 month horizon, the market generally adapts — through the reallocation of supply flows, increased production, and reduced demand — leading to stabilization or partial price correction.
In the current episode, risks appear more pronounced than in most historical precedents (left-side bars). A potential supply reduction of up to 15% of global output constitutes an extreme shock, and the absence, at present, of a clear U.S. strategy to secure transit through the Strait of Hormuz increases the likelihood of more prolonged disruptions. In such a scenario, market adjustment may take longer, elevating the risk of persistently high oil prices and, consequently, more sustained inflationary pressure on the global economy.
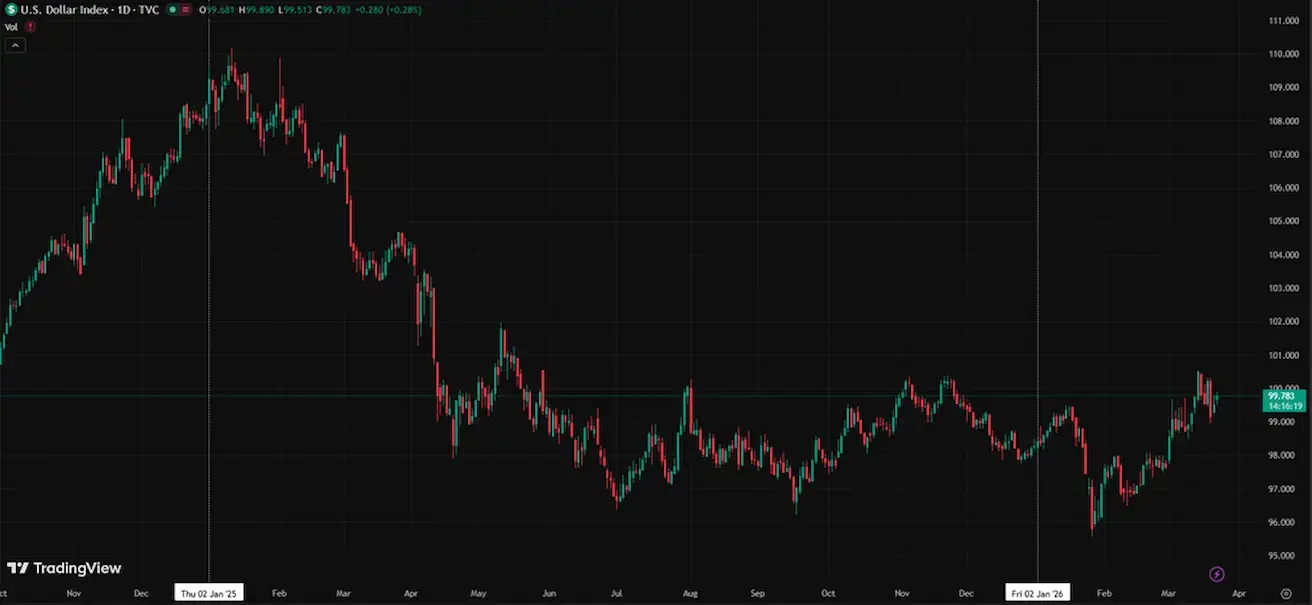
DOLLAR INDEX FUTURES (DX)
Weekly performance: -0,99% (week-end close: 99,503). Year-to-date performance: +1,54%.
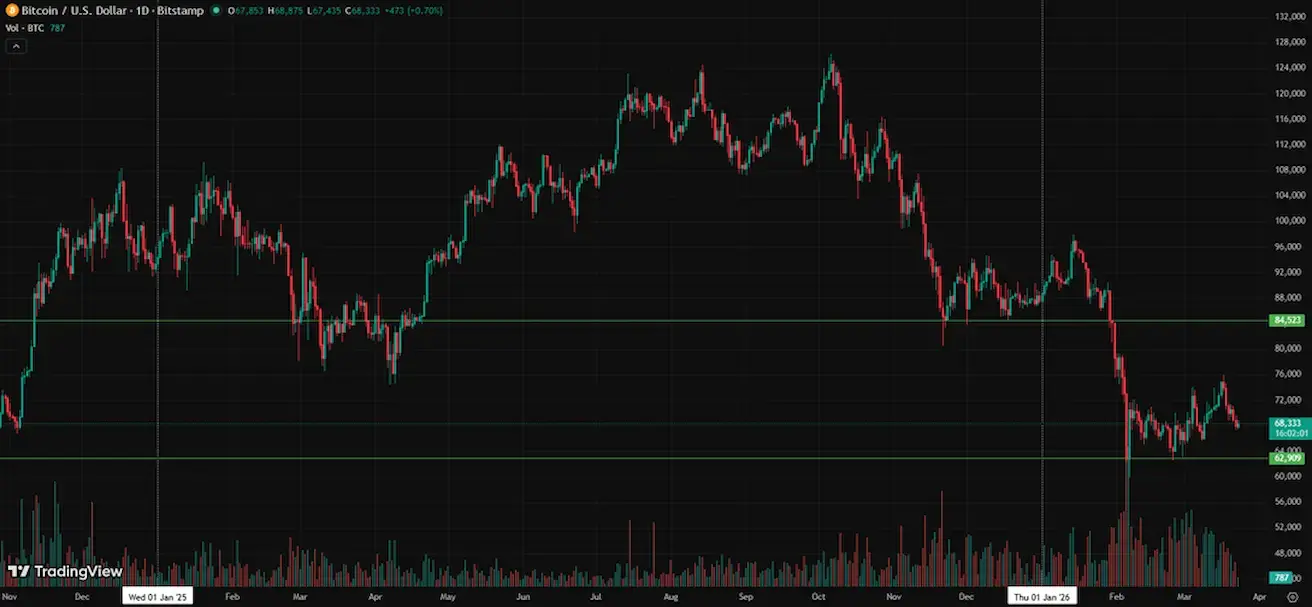
BTC FUTURES
Weekly performance -6,83% (week-end close: $67860); year-to-date: -22,64%.
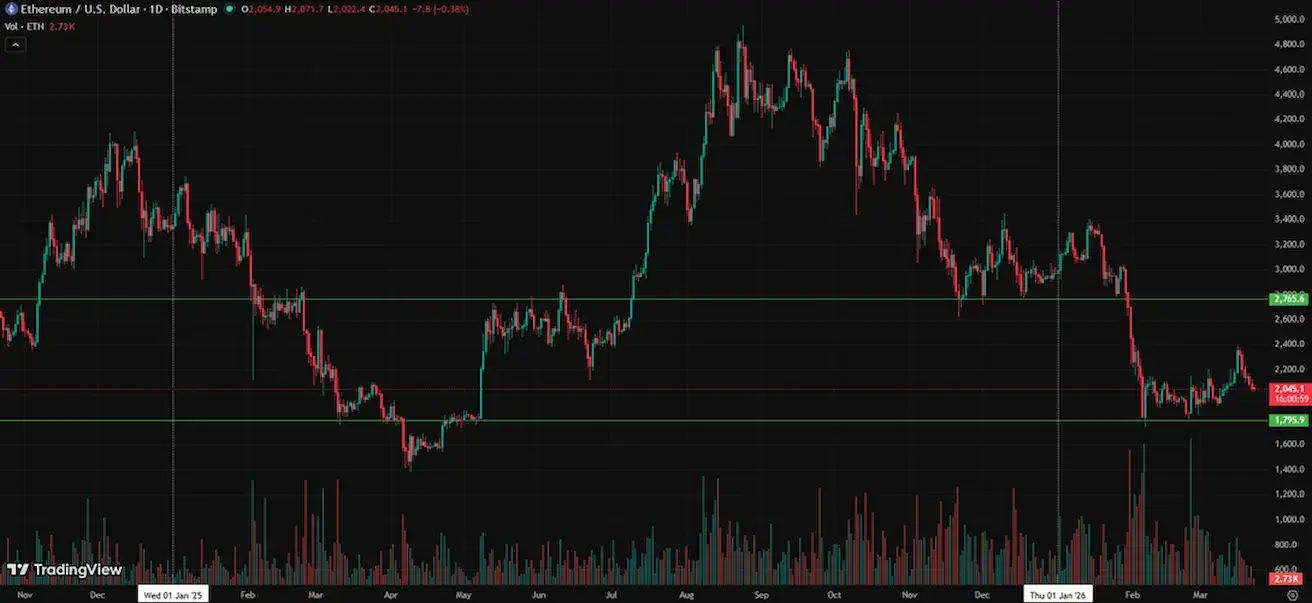
ETH FUTURES
Weekly performance -5,77% (week-end close: $2052,9); year-to-date: -30,97%.
The chart illustrates the realized profit and loss of BTC market participants — that is, the extent to which investors are locking in gains or losses when selling their coins.
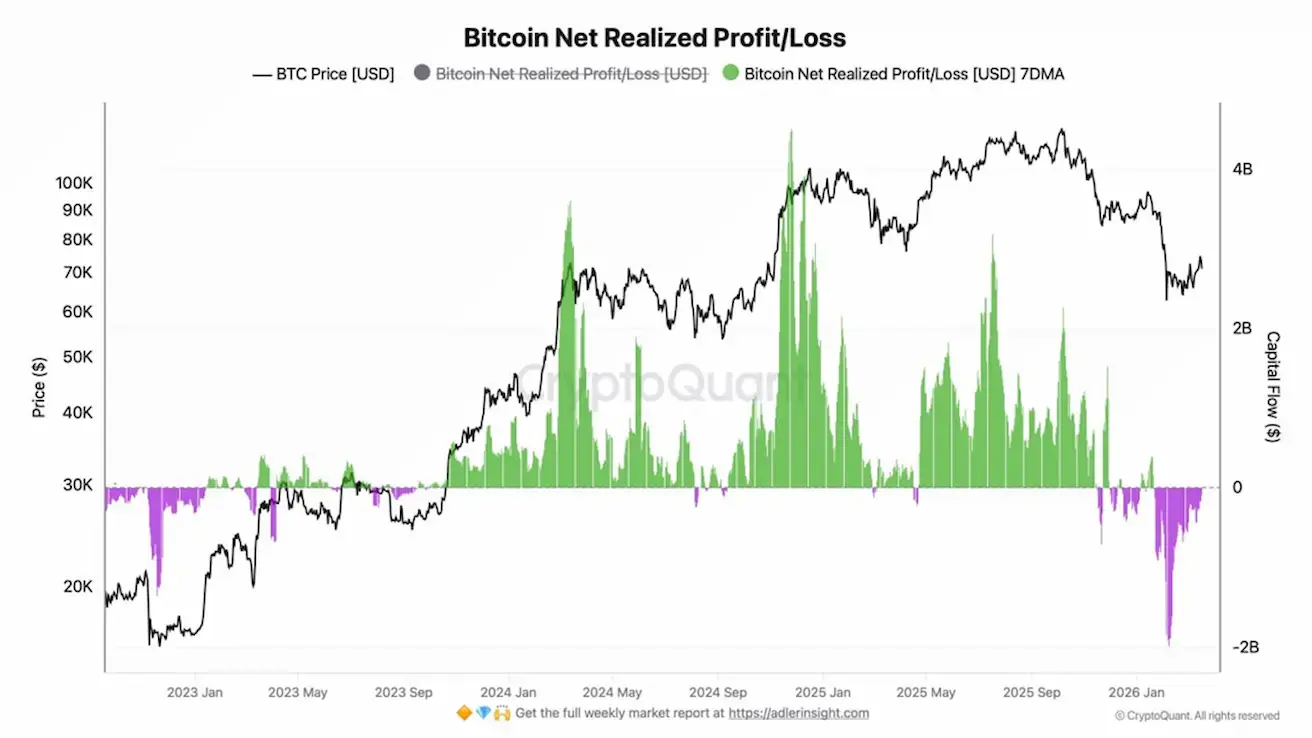
- Green bars — profit-taking
- Purple bars — loss realization
- Black line — BTC price
The market is currently in a phase where some participants are realizing losses following the price decline, but volumes are already decreasing — this may indicate that weaker hands are exiting and that the market is approaching a stabilization phase.
The market has moved past the stage of active profit-taking and entered a phase of cleansing through losses, which historically often occurs closer to local bottoms or consolidation zones.
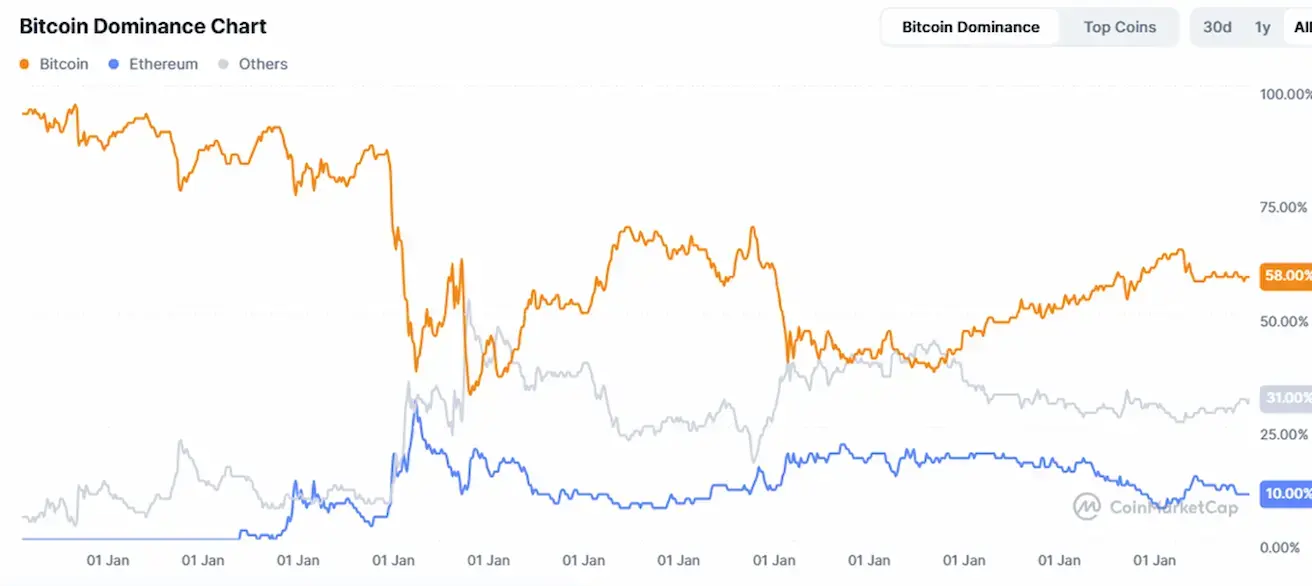
TOTAL CRYPTOCURRENCY MARKET CAPITALIZATION
Total crypto market capitalization: $2,3 trillion (vs $2,5 trillion a week earlier) (coinmarketcap.com).
Crypto asset market shares:
- Bitcoin: 58.3% (58.5%)
- Ethereum: 10.5% (10.9%)
- Others: 31.2% (30.5%).
ETF Net Flows Chart:
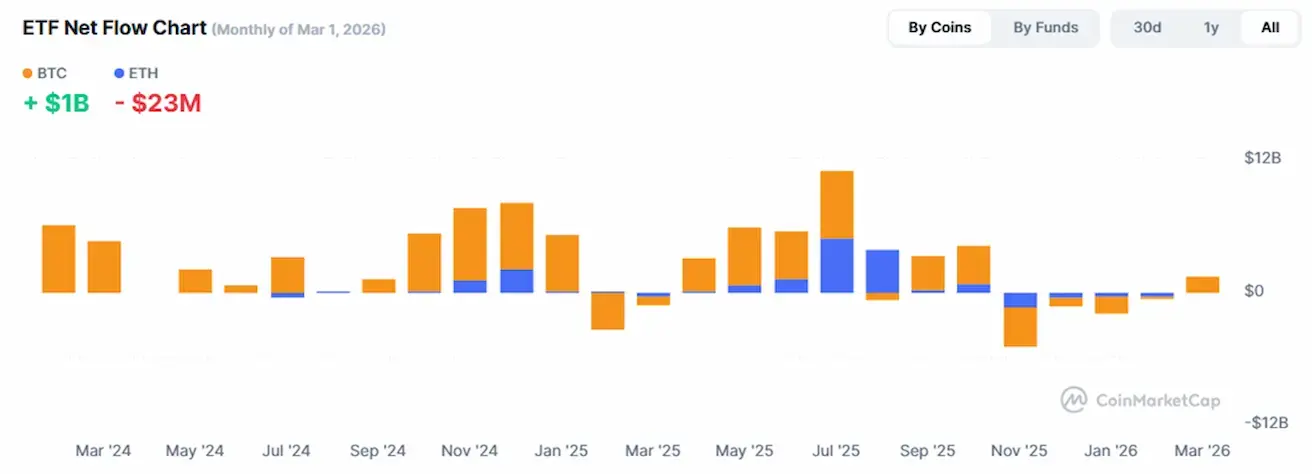
The SEC, jointly with the CFTC, has released a 68-page guidance stating that most cryptocurrencies are NOT considered securities.
A token taxonomy is introduced: stablecoins, digital commodities, and “digital instruments” are classified as non-securities.
Clarifications on mining, protocol staking, and airdrops indicate that, in most cases, they do not fall under securities laws.
Bitwise: institutional demand is recovering:
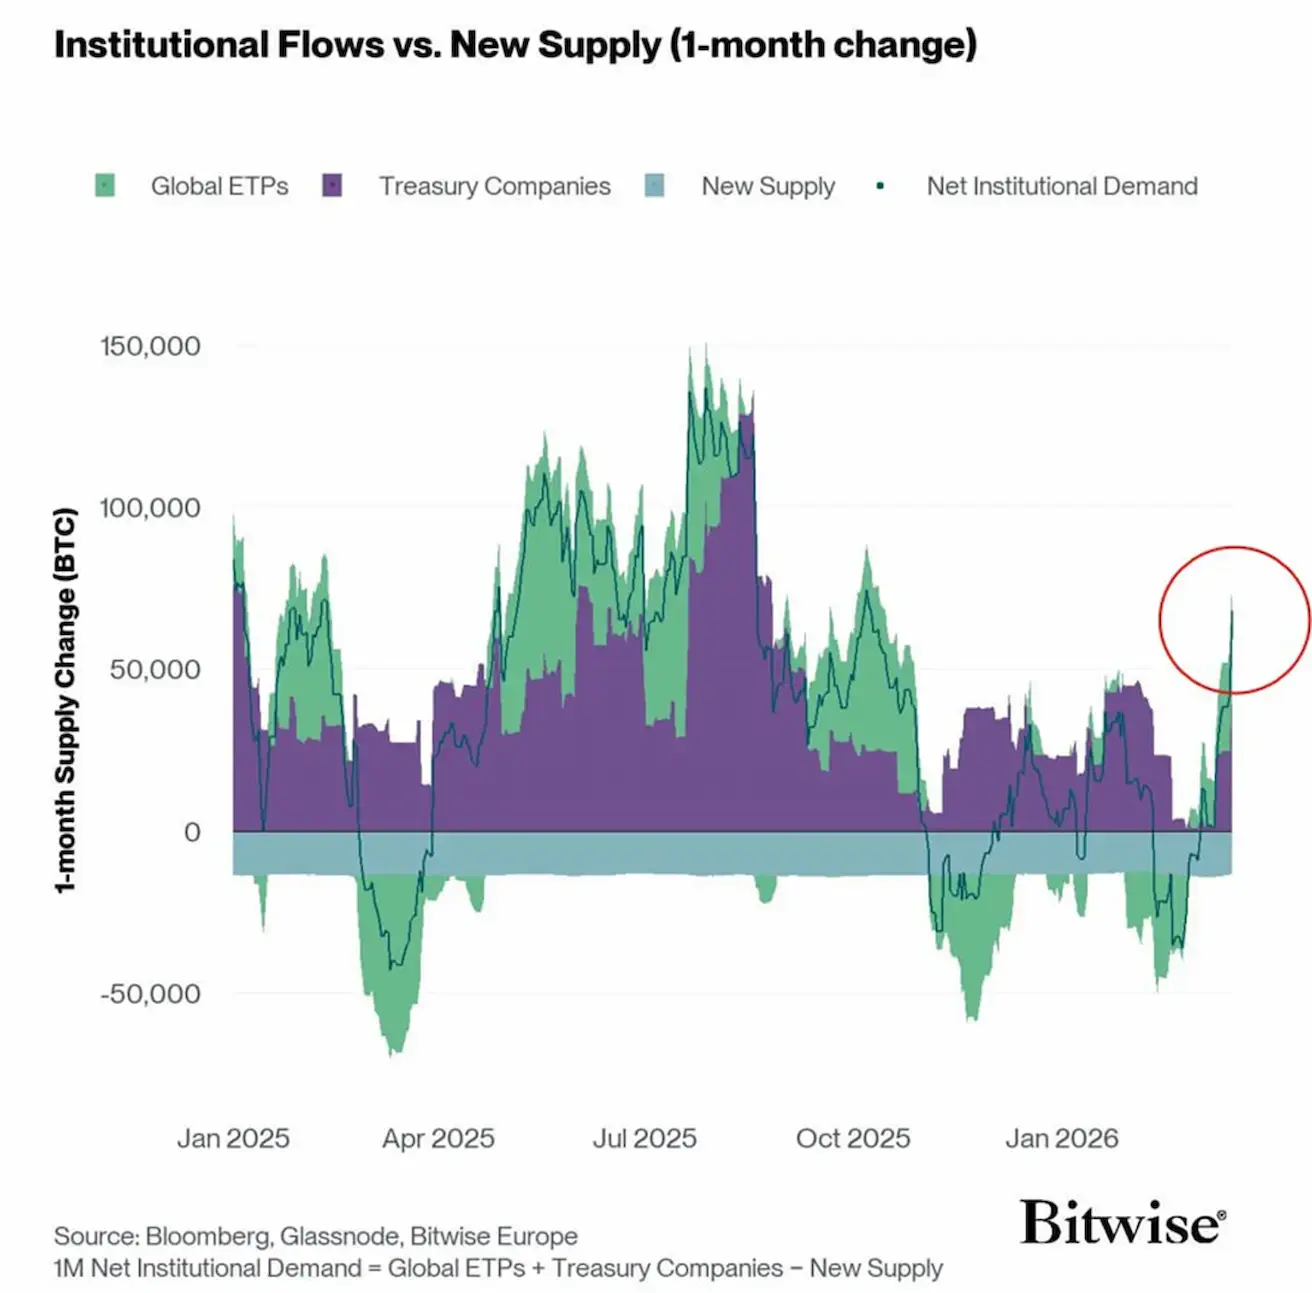
The chart illustrates net institutional demand for Bitcoin (Net Institutional Demand) in comparison to new coin supply. Demand includes purchases via ETFs (green) and corporate treasuries (purple), from which new BTC issuance (blue block) is subtracted.
When total purchases exceed new supply, the indicator moves into positive territory, creating a liquidity shortage and supporting prices. When it falls below, supply pressure emerges.
In the current segment (highlighted on the right), a sharp recovery in institutional demand is evident: inflows once again significantly exceed new BTC issuance. Historically, such phases often coincide with the beginning or continuation of an upward trend, as the market faces constrained supply.