Lietuvių
 Русский
 Қазақша
 Eesti
EestiSeptember 15–19, 2025: Weekly economic update
Key market updates

Macroeconomic Statistics
INFLATION
- Core Consumer Price Index (CPI) (m/m) (August): 0,3% (previous: 0.3%)
- Consumer Price Index (CPI) (m/m) (August): 0.4% (previous: 0.2%)
- Core Consumer Price Index (CPI) (y/y) (August): 3.1% (previous: 2.9%)
- Consumer Price Index (CPI) (y/y) (August): 2.9% (previous: 2.7%)
INFLATION EXPECTATIONS (MICHIGAN)
- 12-month expected inflation (August): 4.8% (prev: 4.8%)
- 5-year expected inflation (August): 3.9% (prev: 3.4%)
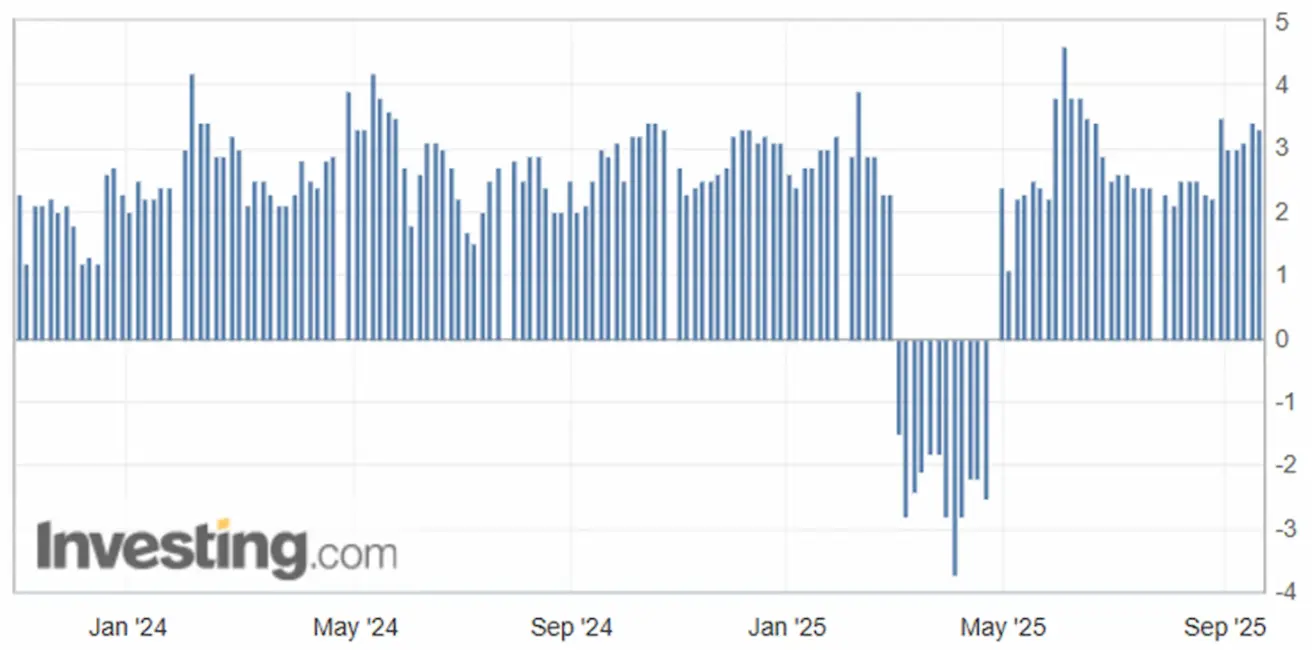
PRODUCER PRICE INDEX (PPI):
- PPI (m/m) (August): -0.1%, prev: 0.7%
- Core PPI (m/m) (August): -0.1%, prev: 0.7%
GDP (U.S. Bureau of Economic Analysis, BEA) (Q2 2025, annualized, second estimate): +3.30% (advance estimate: 3.0%; Q1 2024: – 0.5%):
- Atlanta Fed GDPNow estimate (Q2): 3.3% (vs. 3.1%).
Business Activity Index (PMI):
(Above 50 indicates expansion; below 50 indicates contraction)
- Services sector (August): 54.5 (previous: 55.4)
- Manufacturing sector (July): 53.0 (previous: 53,3)
- S&P Global Composite (August): 54.6 (previous: 55.4)
LABOR MARKET:
- Unemployment rate (August): 4.3% (previous: 4.2%)
- Total number of individuals receiving unemployment benefits: 1.9393K (vs. 1.939K)
- Change in nonfarm payrolls (August): 22K (previously revised: 79K)
- Change in U.S. private nonfarm payrolls (August): 38K (previous: 77K)
- Average hourly earnings (August, y/y): +3.7% (previous: +3.9%)
- JOLTS job openings (August): 7.181M (vs. 7.357M)
- Total number of individuals receiving unemployment benefits in the US: 1,920K (vs 1,927K):
MONETARY POLICY
- Federal Funds Effective Rate (EFFR): 4.00% - 4.25% (unchanged)
- Federal Reserve balance sheet increased: $6,608T (vs. previous week: $6,605T)
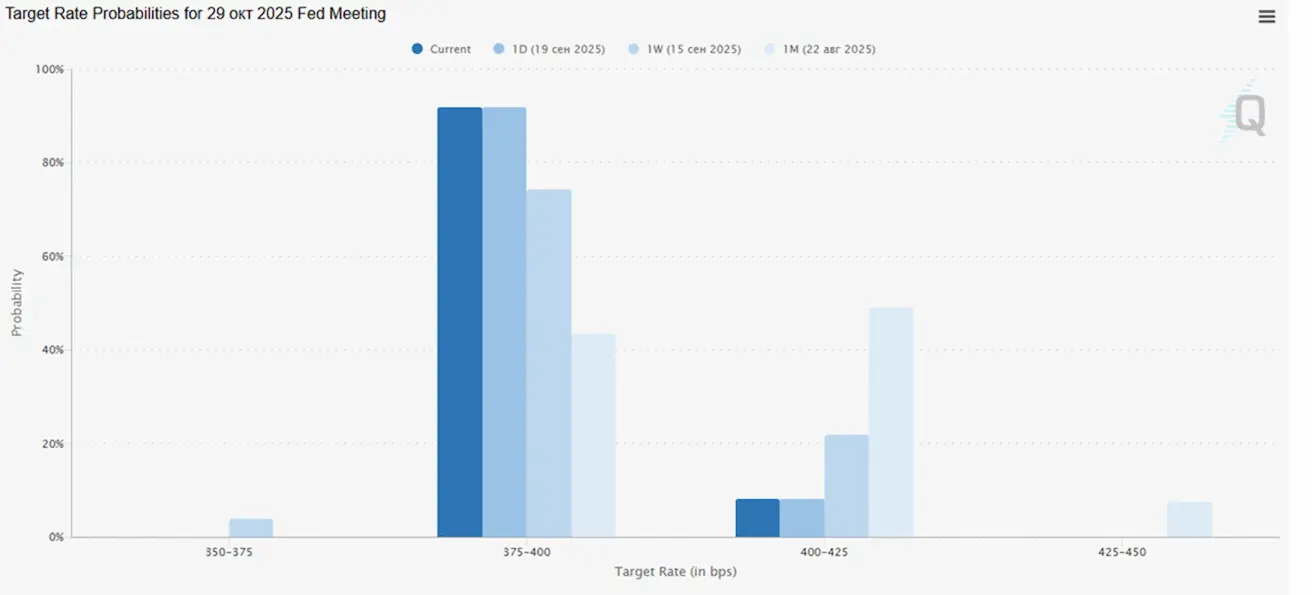
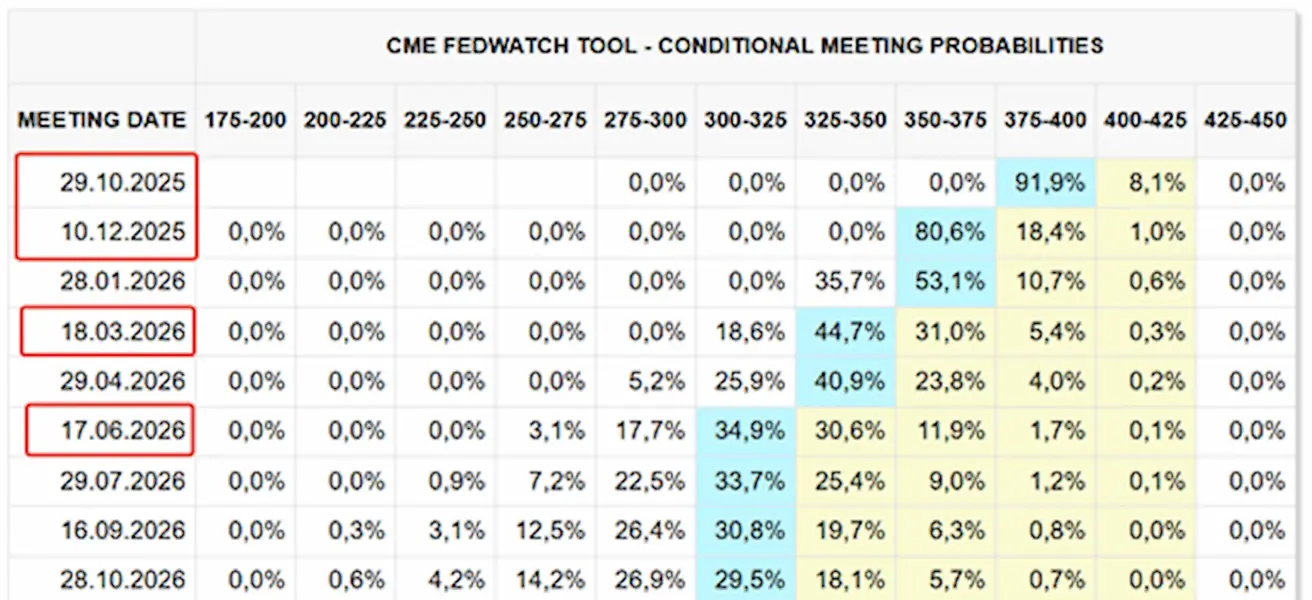
MARKET FORECAST FOR RATE (FEDWATCH)
Today:
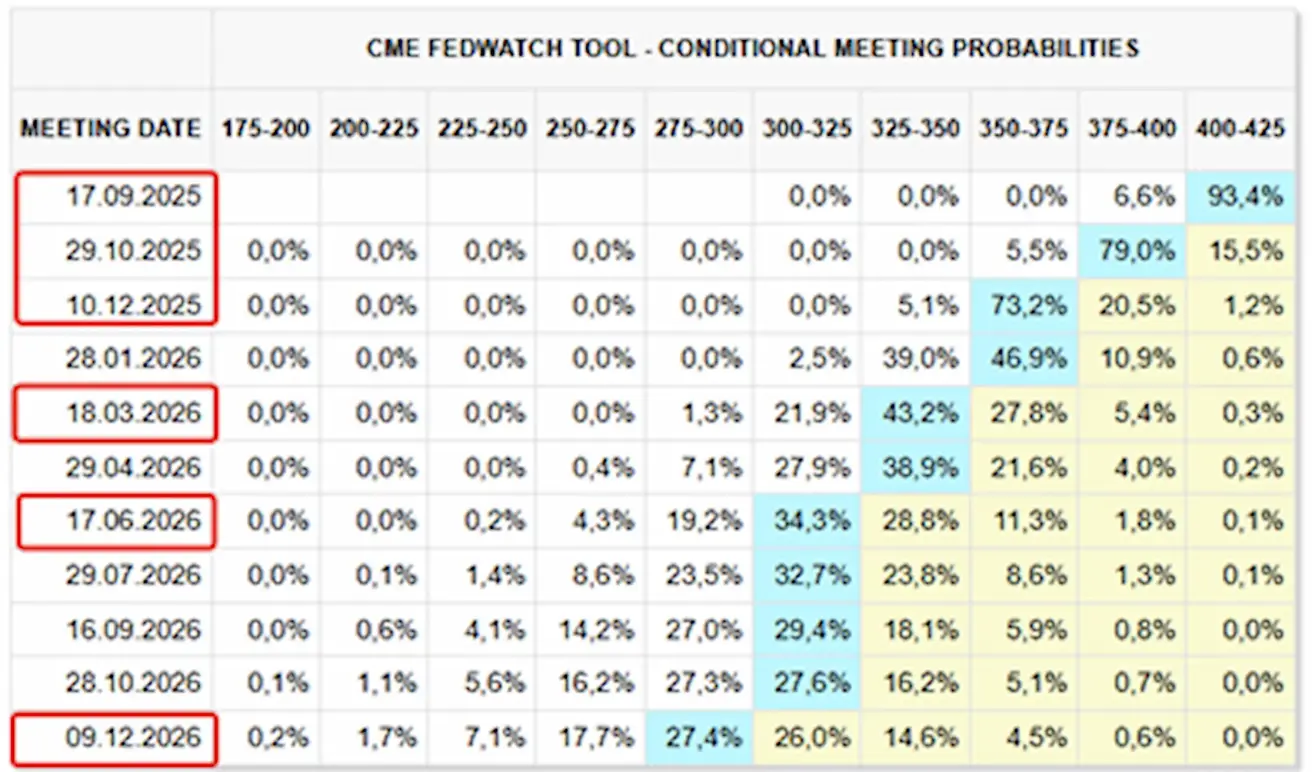
А week earlier:
Commentary
Last week, the major stock exchanges exhibited a positive trend. Following the FOMC meeting, the main U.S. indices continued to climb.
The FOMC cut the federal funds rate by 0.25%, bringing it to the 4.00–4.25% range, while signaling an imminent end to QT and indicating that it will most likely lower rates two more times this year.
Importantly, prior to the FOMC meeting, the Senate confirmed Stephen Miran—an ally of Trump and an advocate for looser monetary policy—to the Federal Reserve Board of Governors. Miran is also known for his supportive stance toward cryptocurrencies.
The Fed’s decision to cut rates came against the backdrop of an upward revision to GDP forecasts and a downward revision to unemployment projections, which on one hand seems logical. On the other, it appears contradictory given that inflation forecasts were raised, while Chair Powell himself noted that unemployment remains at historically low levels.
This discrepancy between the forecasts and the policy decision reinforces the narrative that the Fed may be losing its independence. Under Trump’s policies, this carries the risk of structurally higher inflation.
Market Expectations (FedWatch):
The Fed projects a target rate range of 3.25 – 3.50% for next year, while the swaps market (FedWatch) continues to price at a faster pace of easing — by an additional 0.50% by 2026.
- At the next meeting (October 29): the implied probability of a 0.25% rate cut stands at 91.9%;
- By year-end: two cuts expected;
- Over the next 12 months: four 25 bps cuts, bringing the rate down to the 3.00–3.25% range.
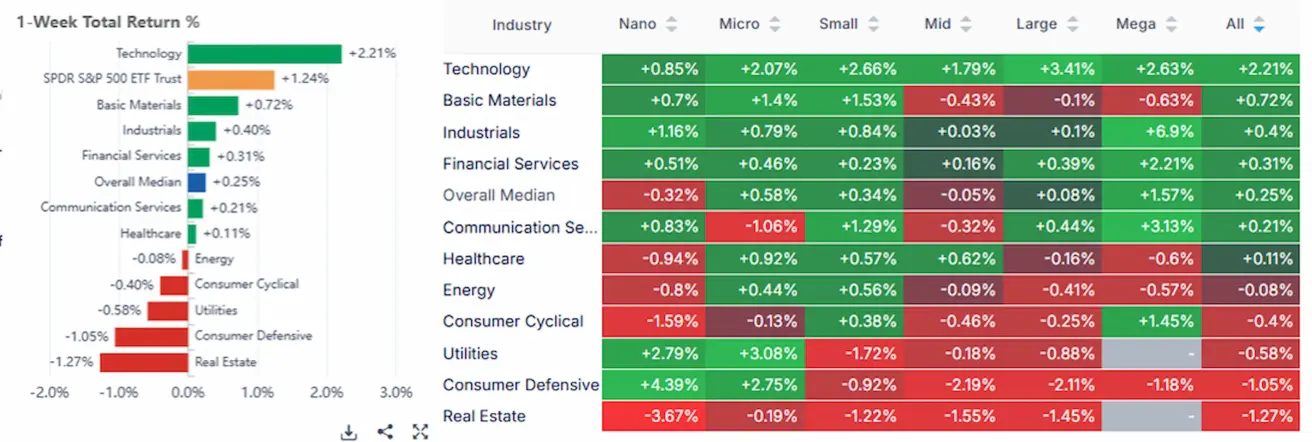
Market
By the end of the week, the median increase stood at +0.25%. Leaders were the technology, basic materials, and industrial sectors, while laggards included consumer staples, real estate, and utilities.
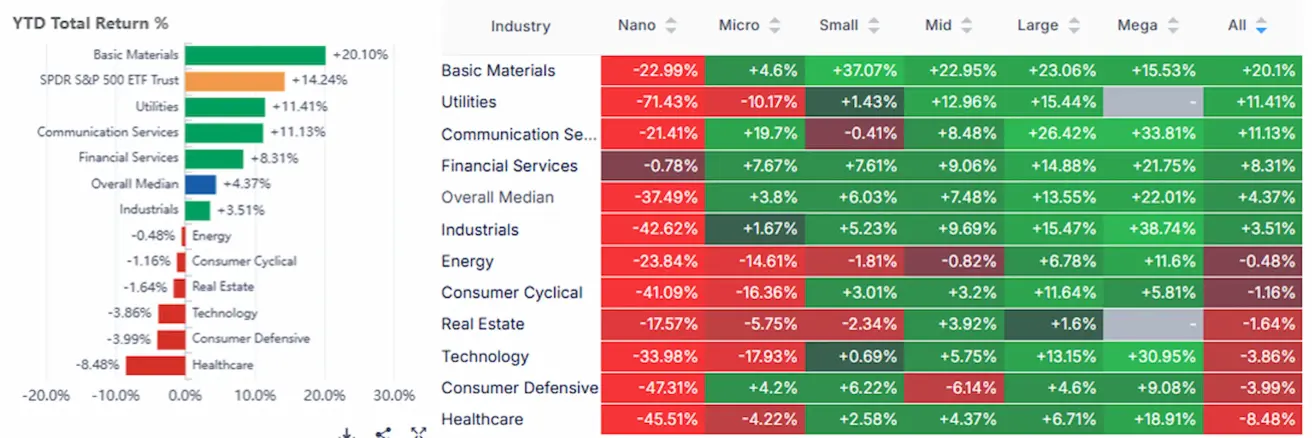
YTD (Year-to-Date): +4.37%. Leaders were basic materials, communication services, and utilities, while laggards included consumer staples, healthcare, and the technology sector.
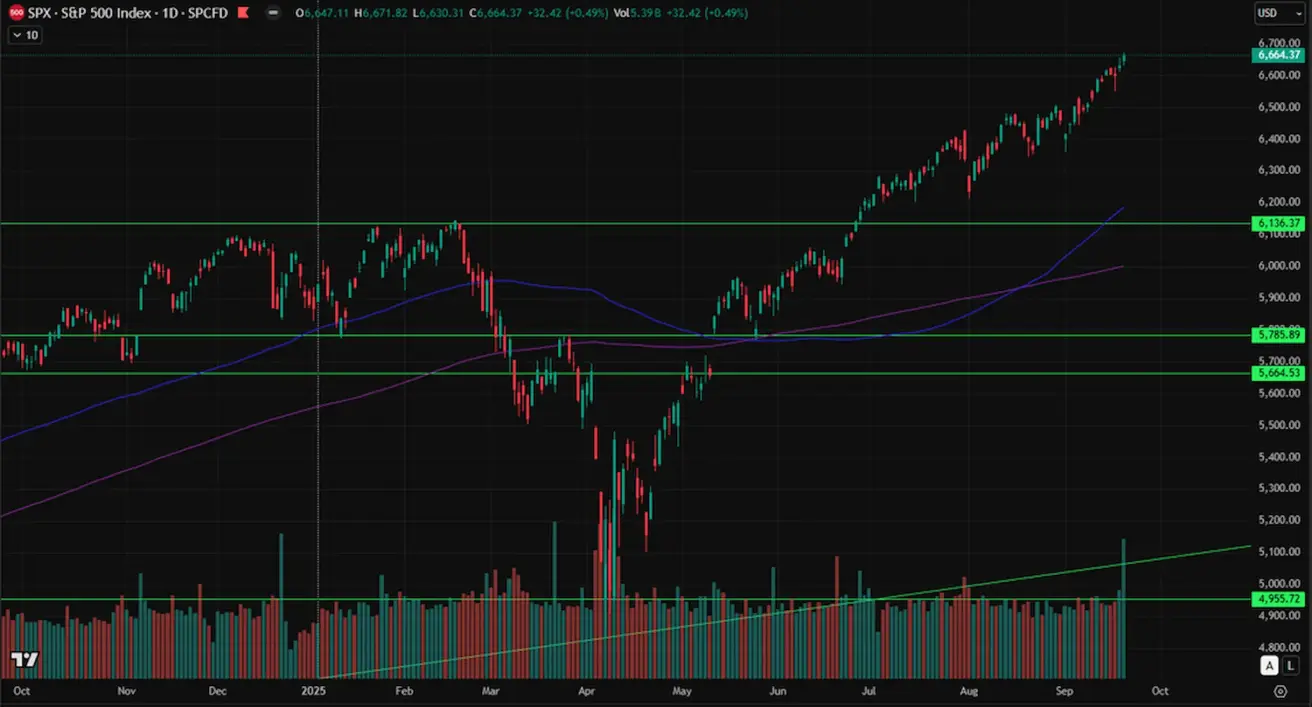
SP500
Weekly gain: +1.22% (week’s close at 6,664.37). Year-to-date 2025: +12.89%.
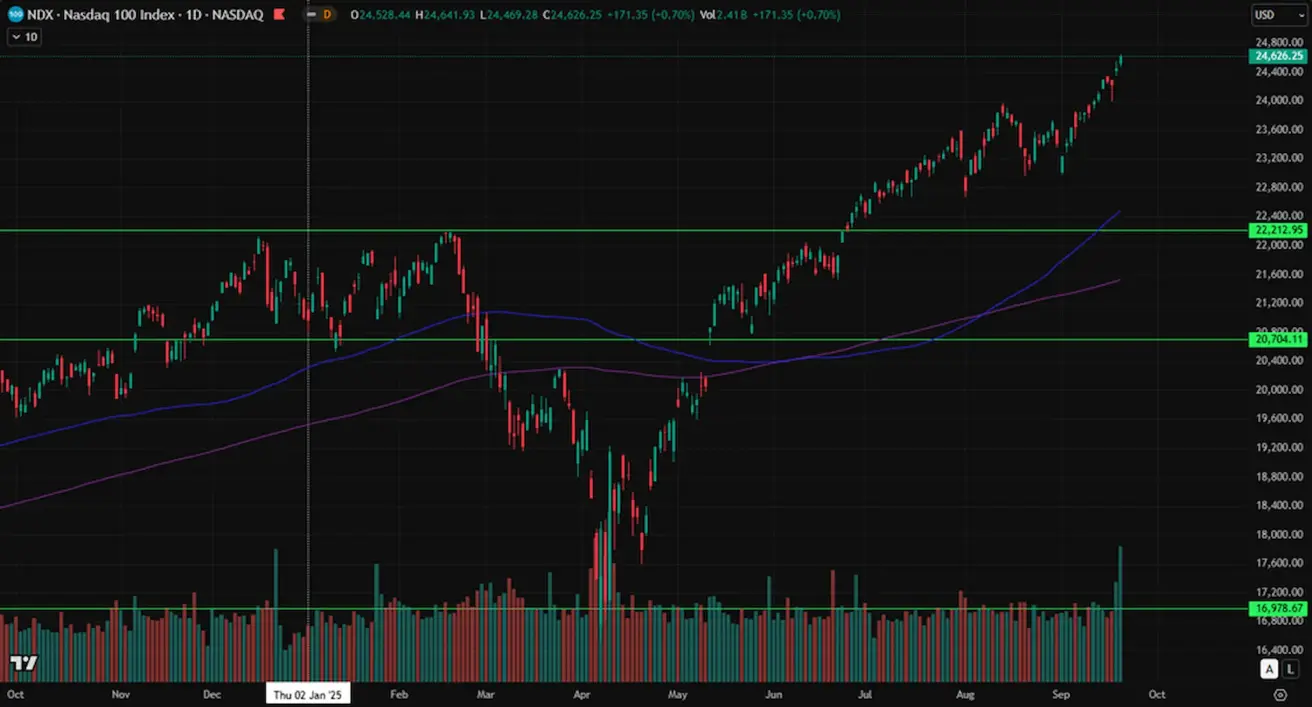
NASDAQ100
Weekly gain: +2.22% (week’s close at 24,626.25). Year-to-date: +16.60%.
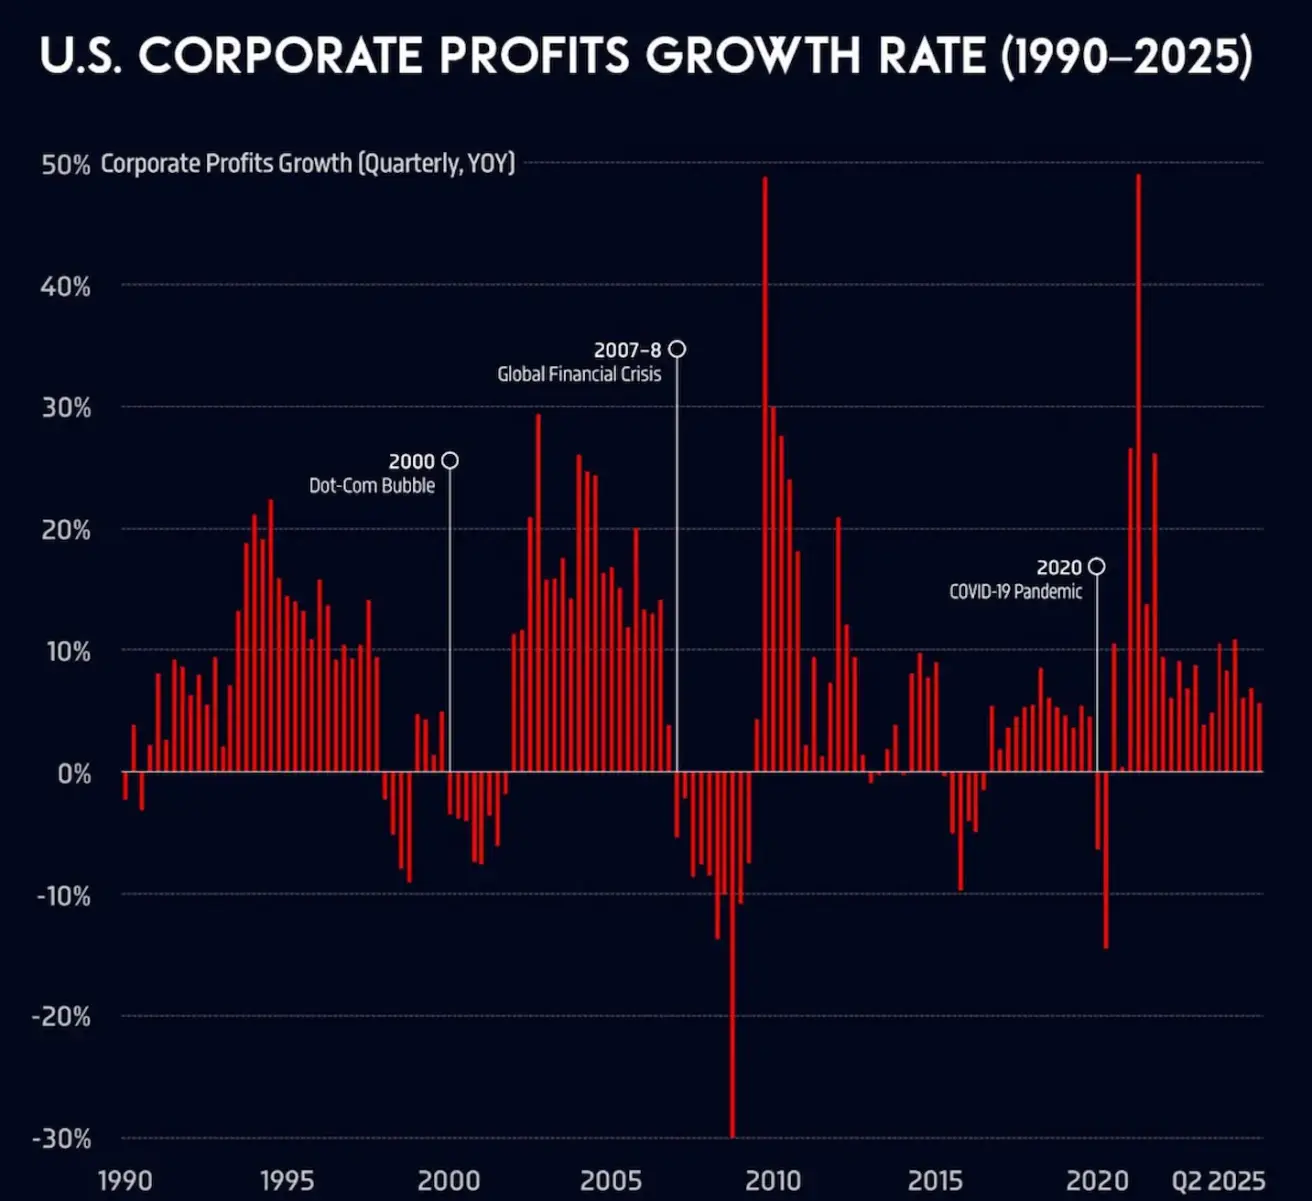
U.S. Corporate Earnings Growth Rates (quarterly, 1990–2025). Annual corporate earnings growth in the United States slowed, decelerating from 10.8% in Q2 2024 to 4.3% in Q2 2025.
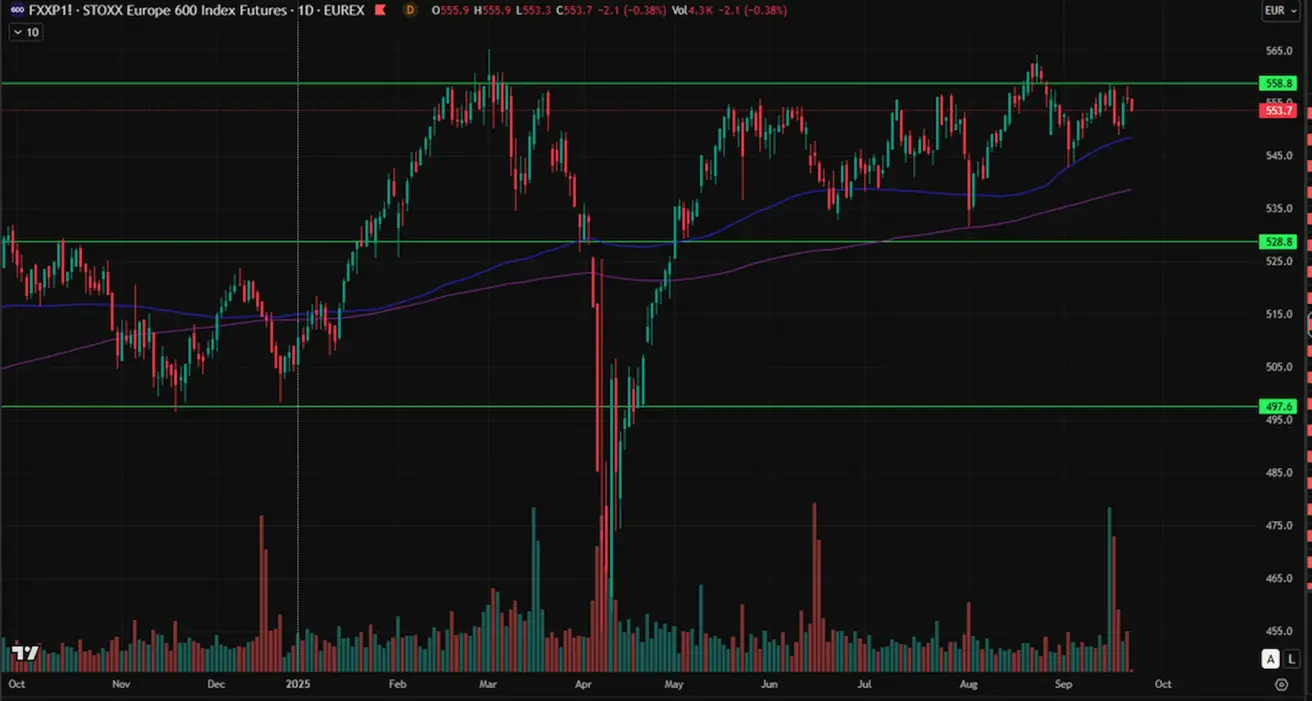
Euro Stoxx 600
Failed to break through resistance. Weekly gain: +0.16% (week’s close at 555.8). Year-to-date increase: +9.93%.
Rating agency Fitch downgraded France’s credit rating from AA– to A+, citing political instability and rising public debt.
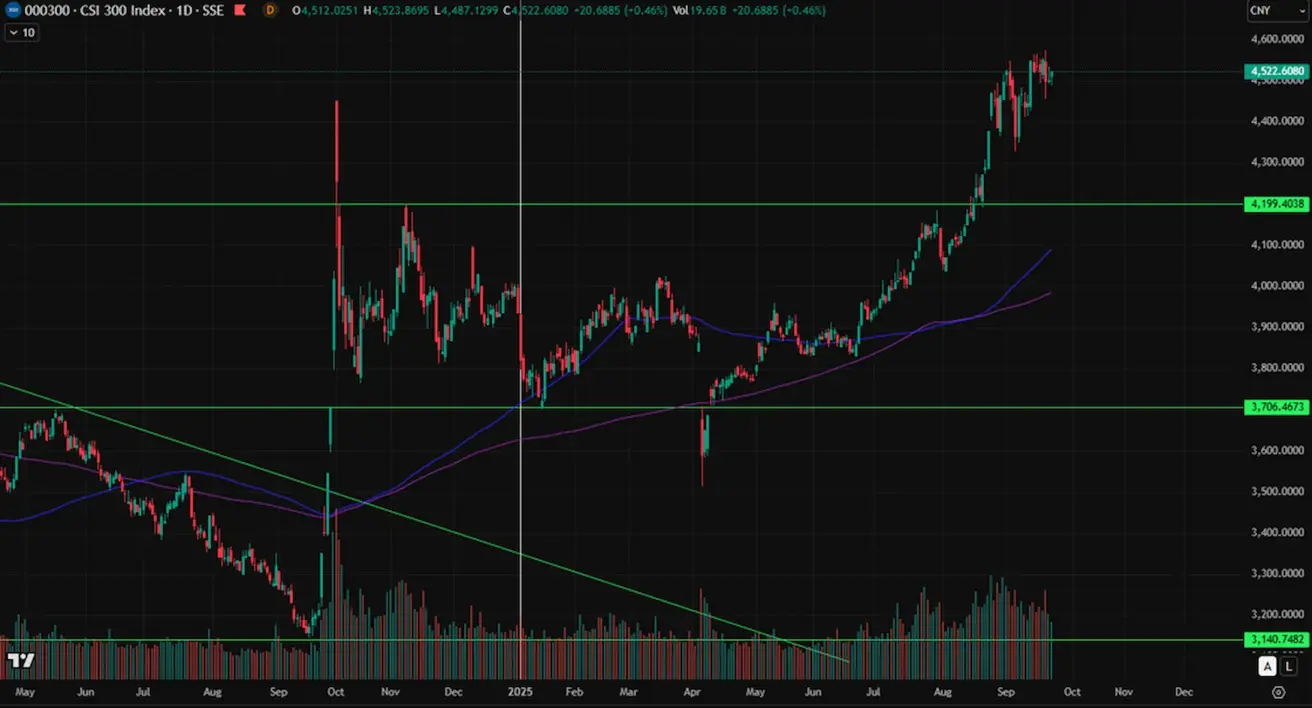
CSI Index
As of Monday: –0.44% (week’s close at 4,501.91). Year-to-date gain: +14.52%.
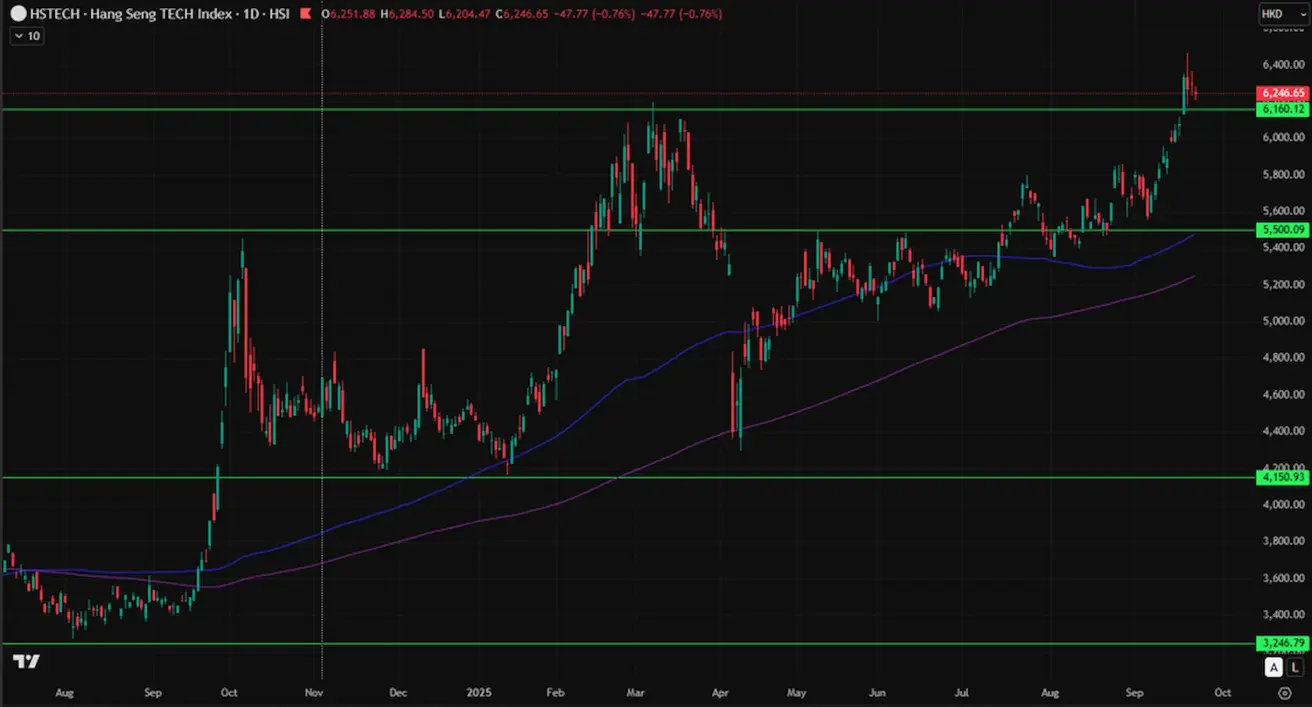
Hang Seng
As of Monday: +3.44% (6,251.75). Year-to-date gain: +40.91%.
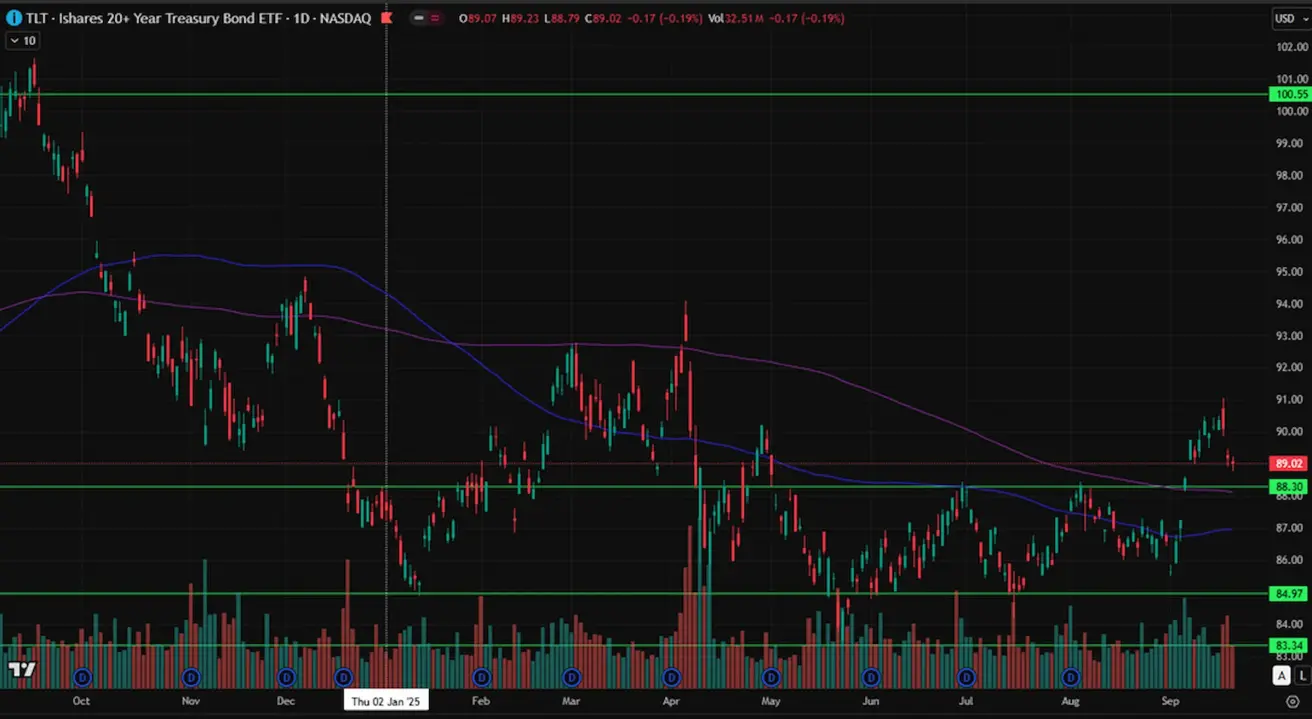
BOND MARKET
By the end of the week, yields rose sharply following the FOMC meeting, despite expectations of rate cuts at the next two meetings. The U.S. Treasury market is signaling future inflation risks. Treasuries 20+ (ETF TLT): Weekly performance: –1.03% (week’s close at 89.02). Year-to-date 2025: +1.39%.
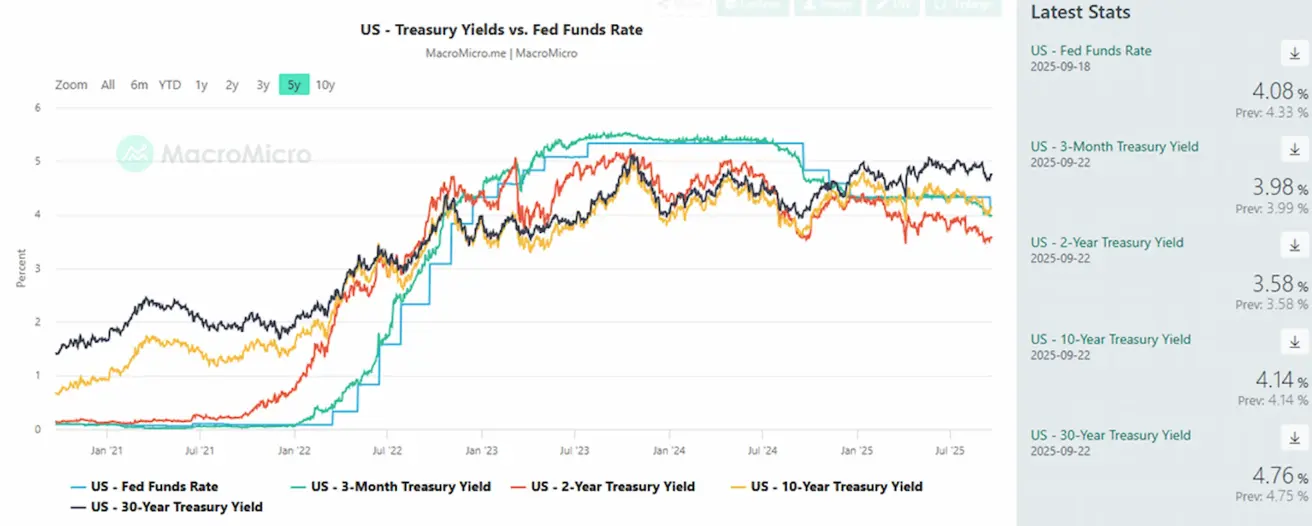
YIELDS AND SPREADS
- Market Yield on U.S. Treasury Securities at 10-Year Constant Maturity: 4.14% (vs. 4.08%);
- ICE BofA BBB U.S. Corporate Index Effective Yield: 4.93% (vs. 4.91%);
- Yield spread between 10-year and 2-year U.S. Treasuries: 56.0 bps vs. 52.0 bps;
- Yield spread between 10-year and 3-month U.S. Treasuries: 16.0 bps vs. 5.0 bps.
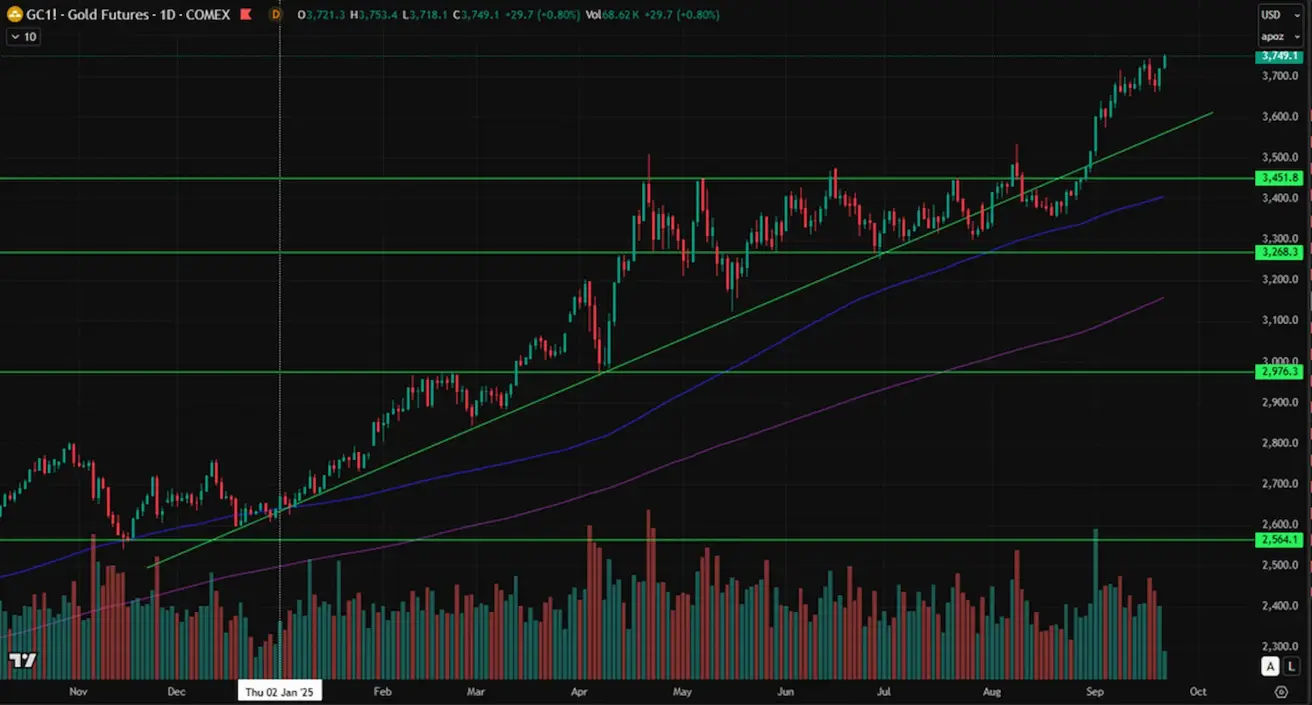
GOLD FUTURES (GC)
Weekly performance: +1.05% (week’s close: $3,719.4/oz). Year-to-date increase: +40.83%.
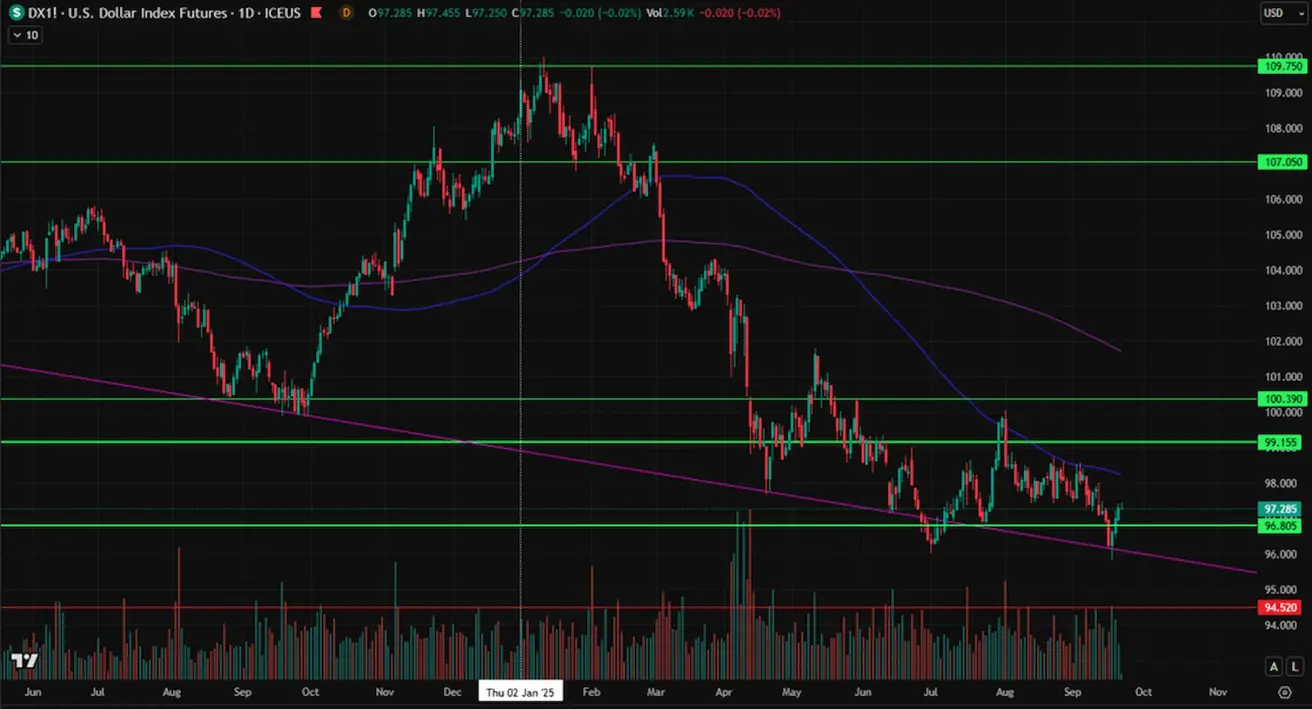
DOLLAR INDEX FUTURES (DX)
Weekly performance: +0.09% (week’s close: 97.305). Year-to-date 2025: –10.18%.
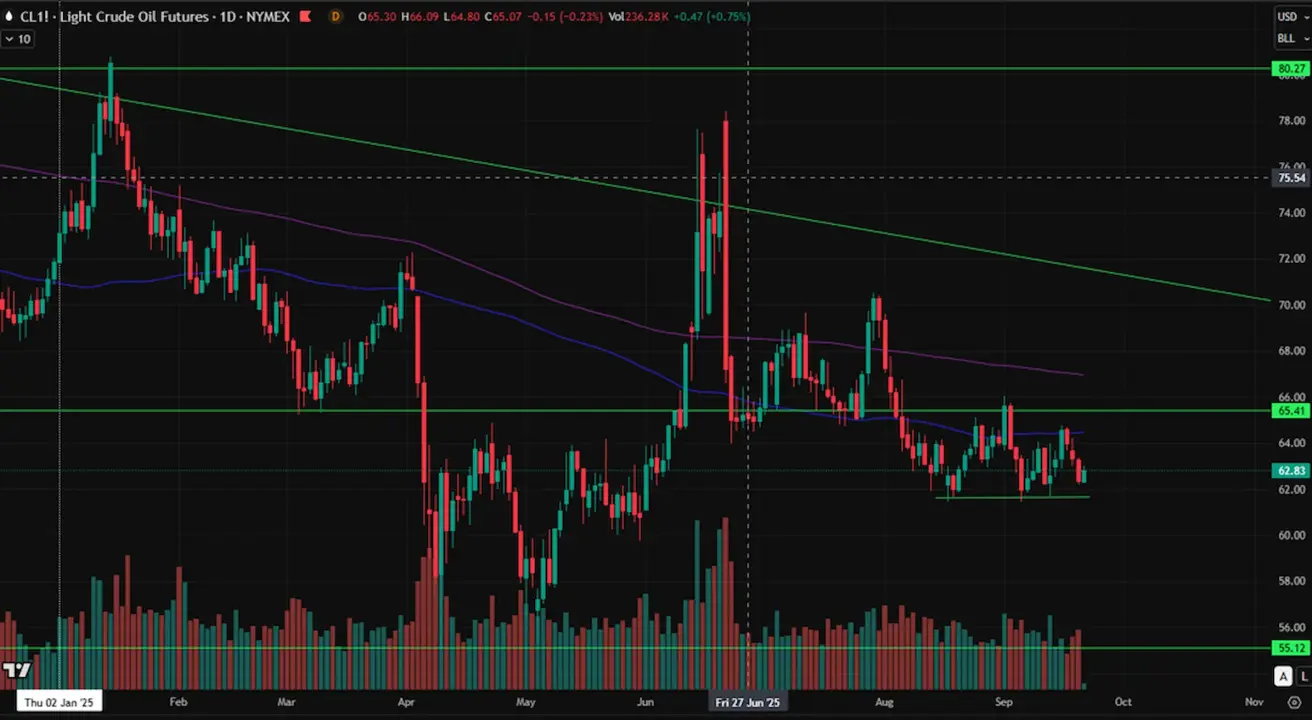
OIL FUTURES
Weekly performance: –0.38% (week’s close: $62.36/barrel). Year-to-date: –13.21%.
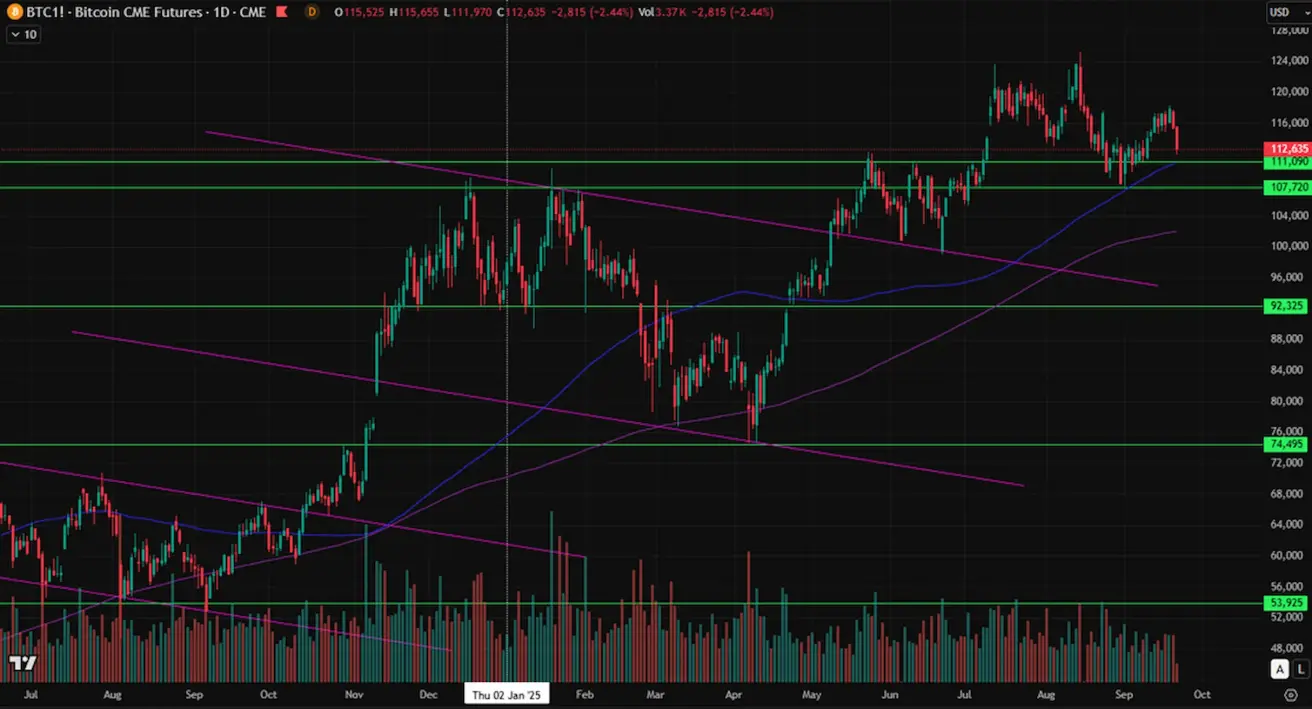
BTC FUTURES
Weekly performance: –1.20% (week’s close: $115,450). Year-to-date 2025: +21.18%.
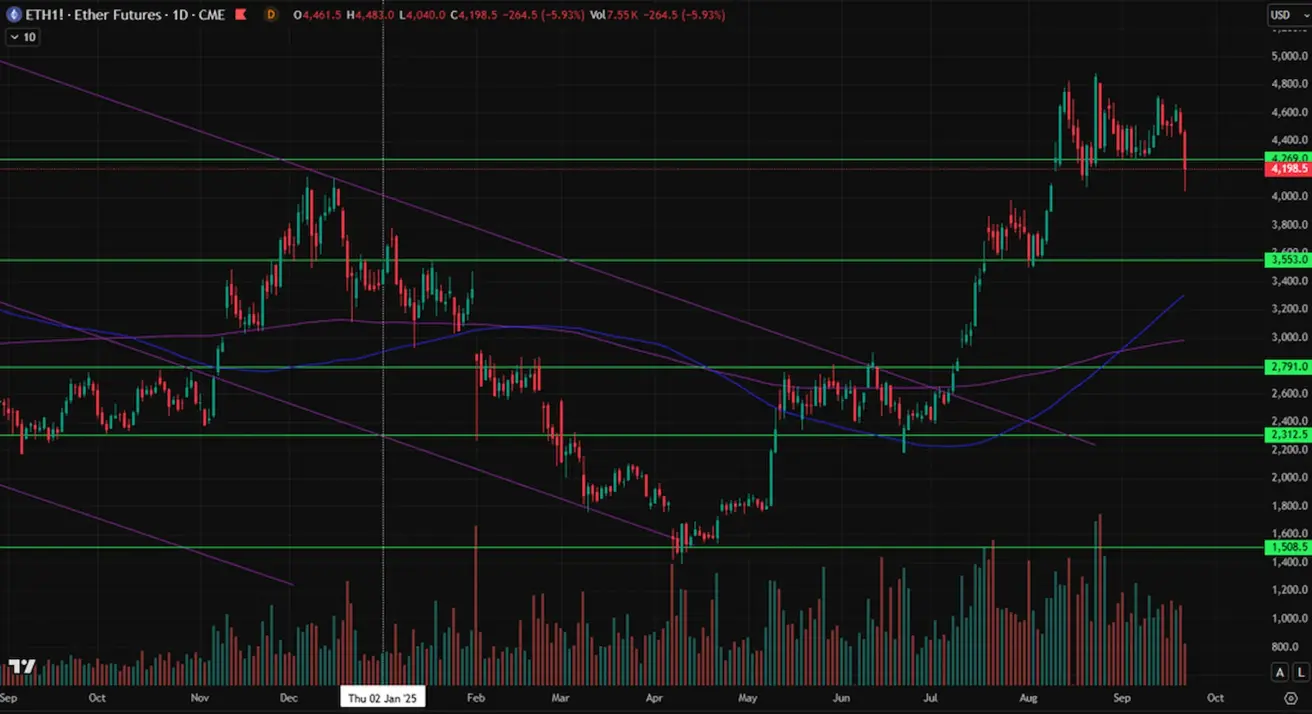
ETH FUTURES
Weekly performance: –5.09% (week’s close: $4,463.00). Year-to-date result: –31.89%.
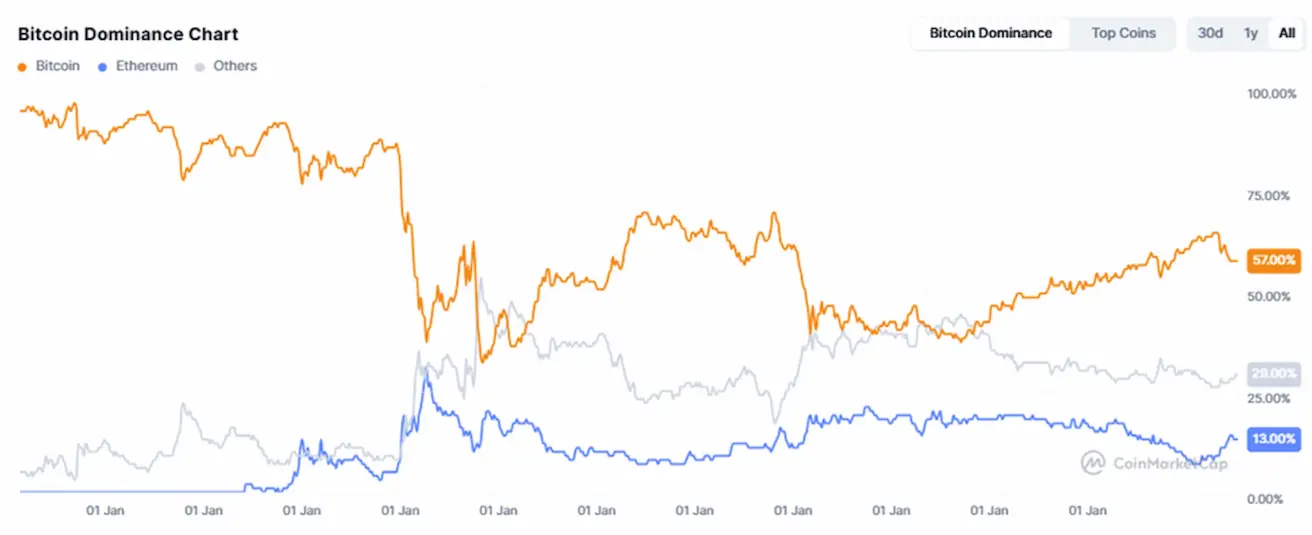
Cryptocurrency Market Capitalization: $3.89 trillion (vs. $4.0 trillion a week earlier) (coinmarketcap.com).
- Bitcoin share: 57.7% (57.4%),
- Ethereum: 13.0% (13.7%),
- others: 29.2% (29.0%).
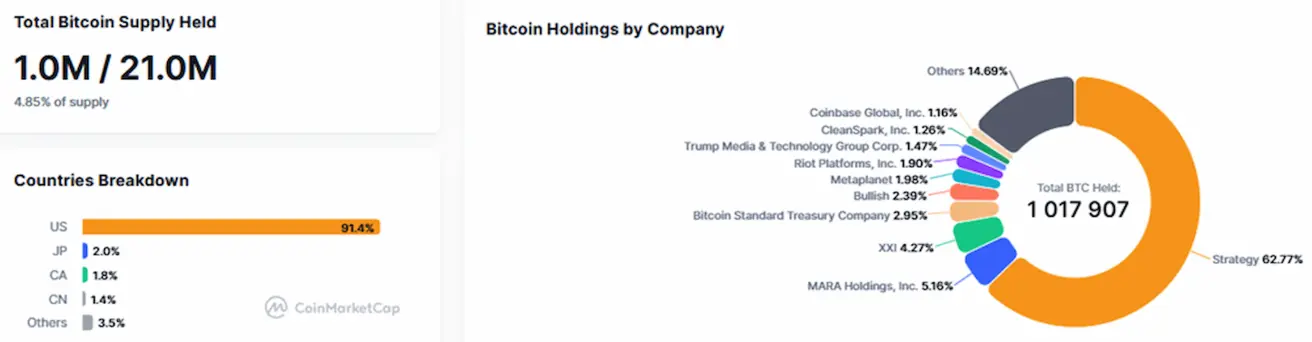
Public companies with Bitcoin Treasury strategies. The share of bitcoins held on corporate balance sheets remained unchanged from the previous week at 4.85% (vs. 4.66%) of total bitcoin supply.
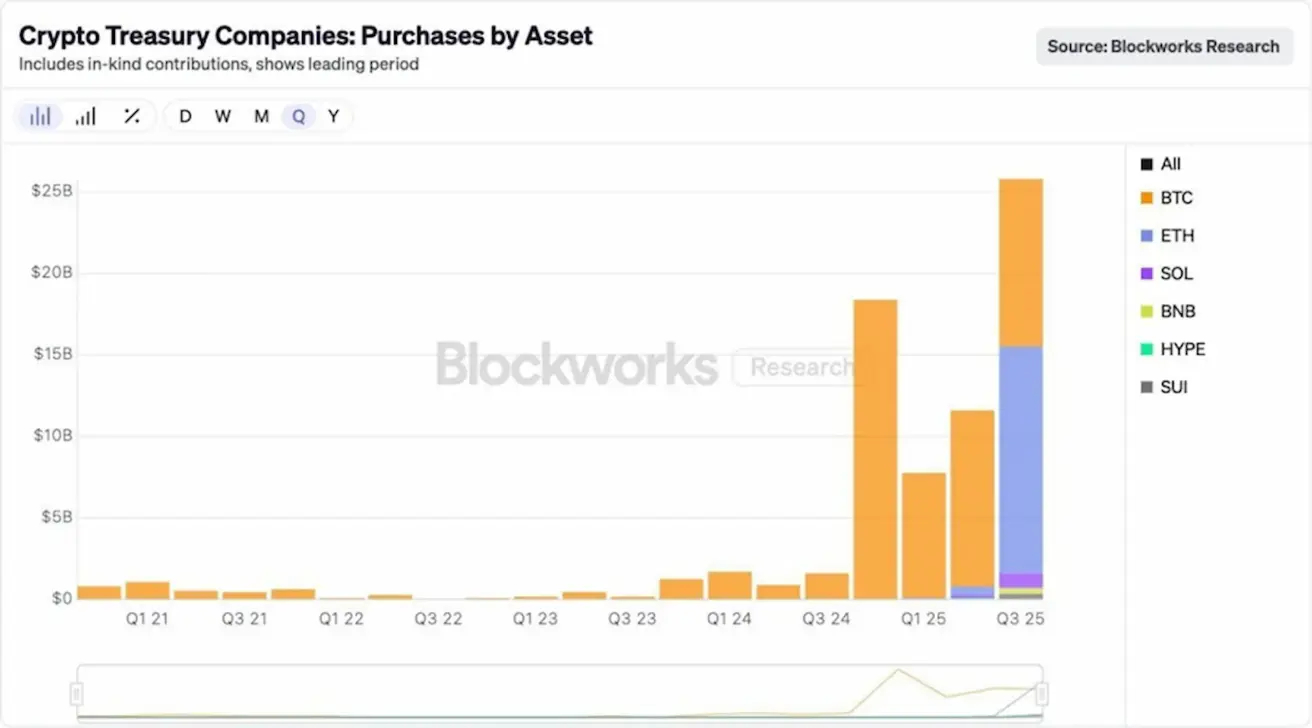
This quarter, digital asset treasuries grew by more than $25 billion, with 54% of the inflows allocated to Ethereum.
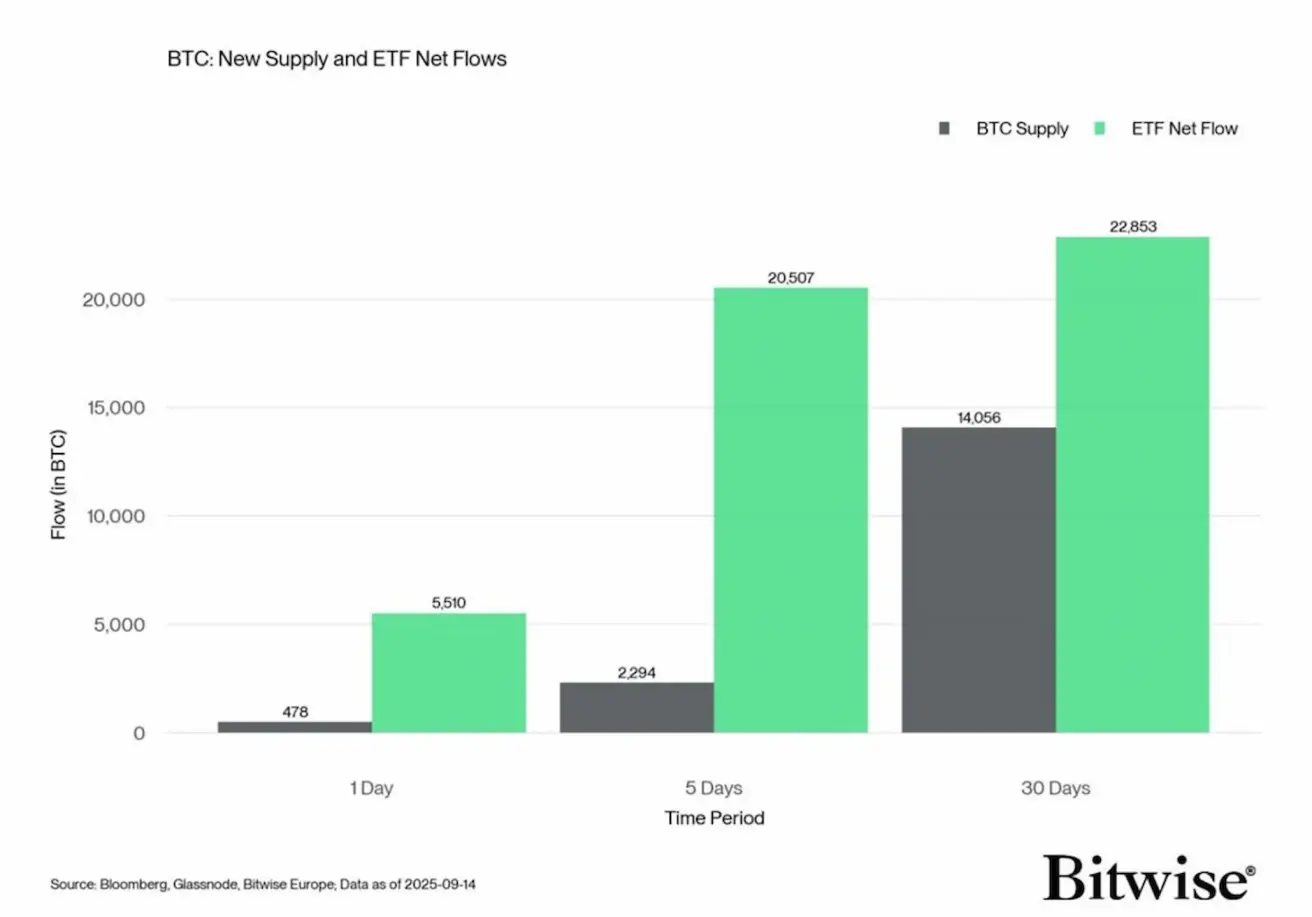
Inflows into U.S. ETFs exceed all new BTC supply.
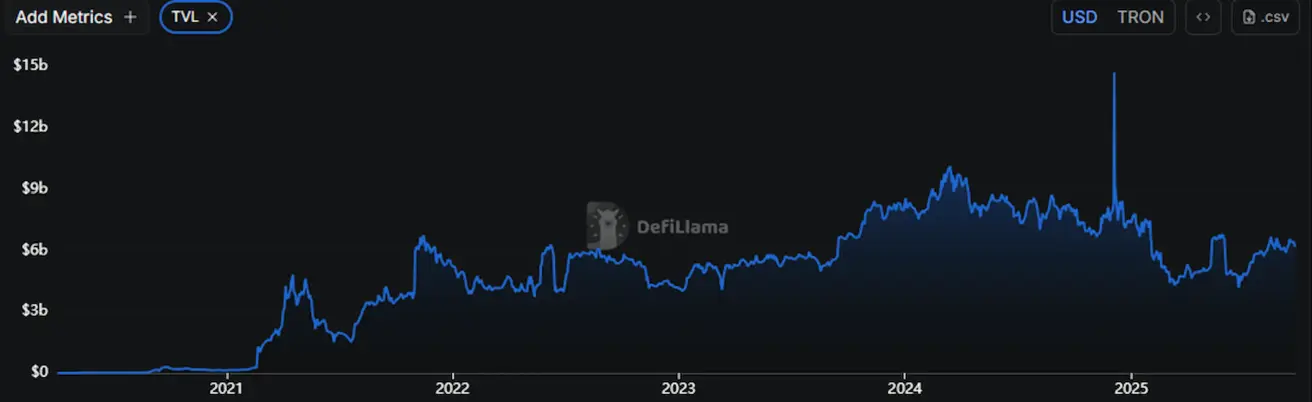
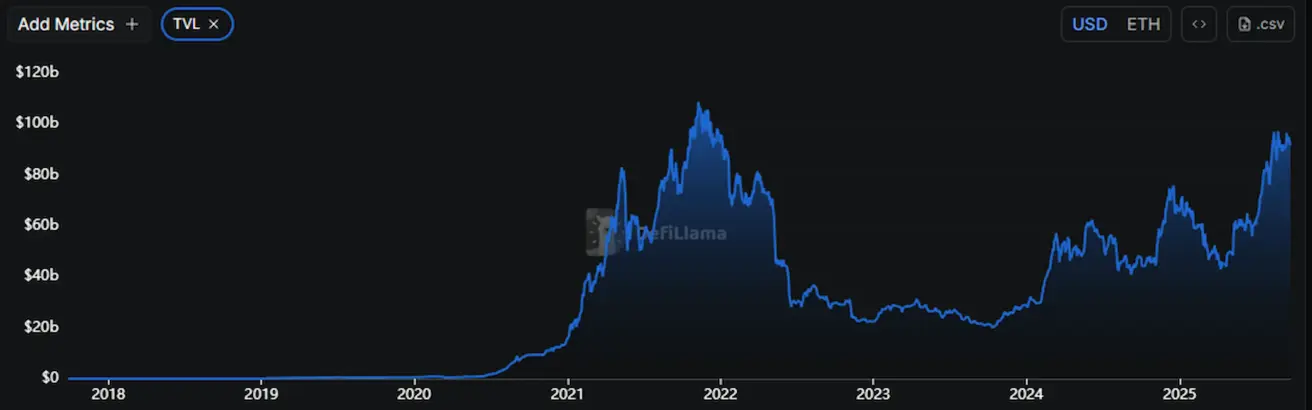
TVL (Total Value Locked — the total amount locked in protocols, i.e., capital actively deployed within the blockchain):
- Ethereum: $91.804 billion (–3.44%).
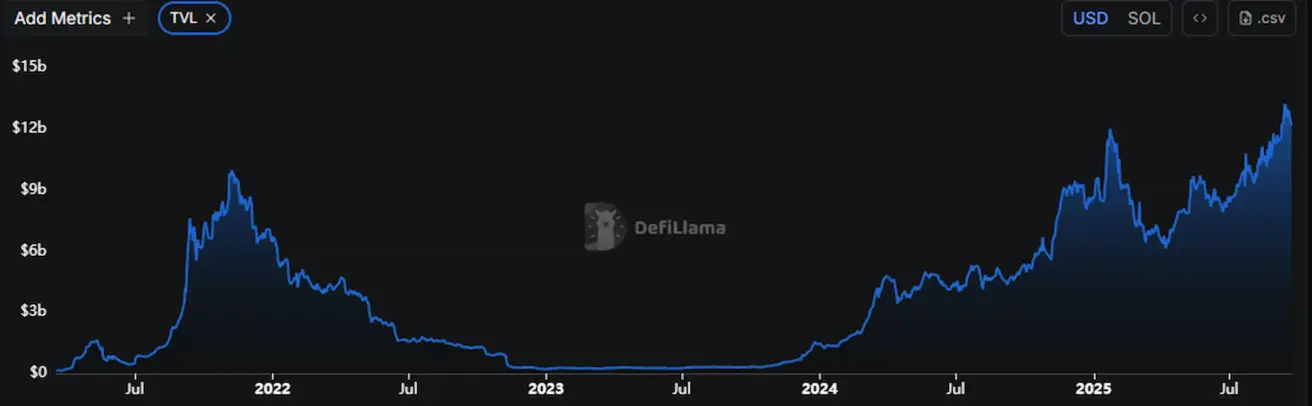
- Solana: $12.186 billion (–2.62%), reaching a new all-time high above $13 billion.
Ethereum: $6.174 billion (–4.14%).