English
 Lietuvių
 Қазақша
 Eesti
Eesti15–19 сентября 2025 года: Еженедельный экономический обзор
Ключевые события на рынке

Макроэкономическая статистика
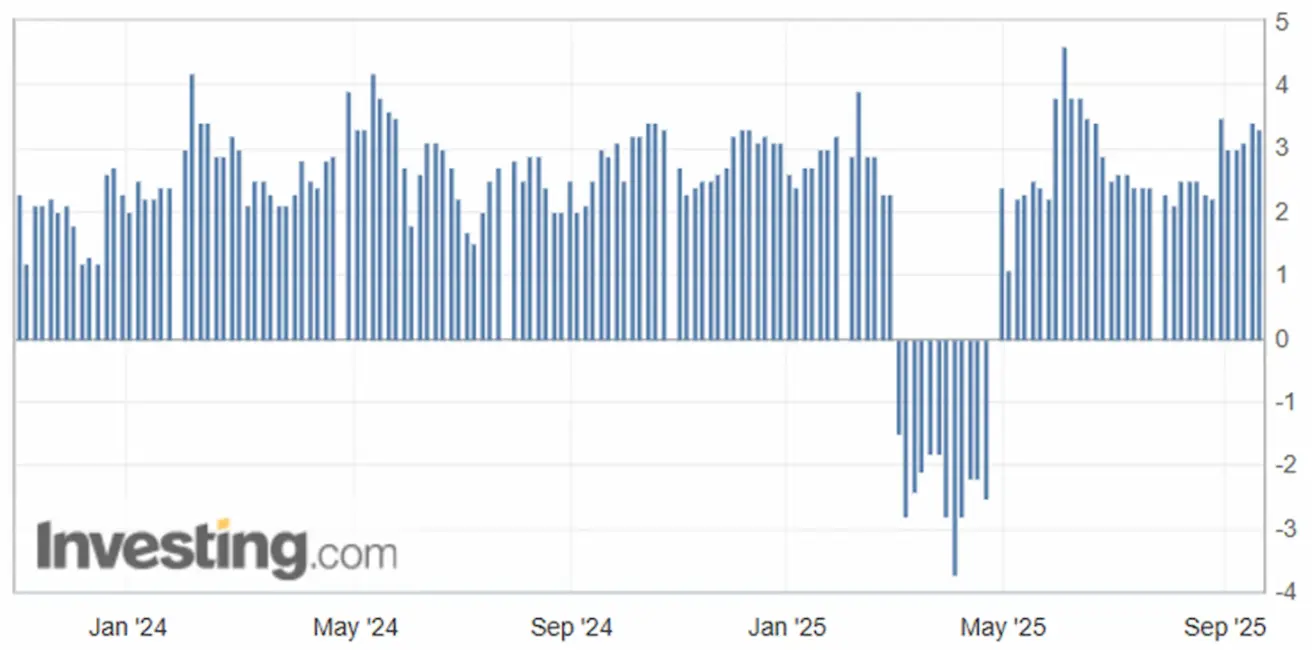
ИНФЛЯЦИЯ
- Базовый индекс потребительских цен (CPI) (м/м) (август): 0,3% (предыдущее значение: 0.3%)
- Индекс потребительских цен (CPI) (м/м) (август): 0.4% (предыдущее значение: 0.2%)
- Базовый индекс потребительских цен (CPI) (г/г) (август): 3.1% (предыдущее значение: 2.9%)
- Индекс потребительских цен (CPI) (г/г) (август): 2.9% (предыдущее значение: 2.7%)
ИНФЛЯЦИОННЫЕ ОЖИДАНИЯ (МИЧИГАН)
- Ожидаемая инфляция на 12 месяцев (август): 4.8% (пред.: 4.8%)
- Ожидаемая инфляция на 5 лет (август): 3.9% (пред.: 3.4%)
ИНДЕКС ЦЕН ПРОИЗВОДИТЕЛЕЙ (PPI):
- PPI (м/м) (август): -0.1%, пред.: 0.7%
- Базовый PPI (м/м) (август): -0.1%, пред.: 0.7%
ВВП (U.S. Bureau of Economic Analysis, BEA) (2 кв. 2025 года, в годовом выражении, вторая оценка): +3.30% (опережающая оценка: 3.0%; 1 кв. 2024 года: – 0.5%):
- Прогноз Atlanta Fed GDPNow (2 кв.): 3.3% (против 3.1%).
Индекс деловой активности (PMI):
(Значение выше 50 указывает на расширение; ниже 50 — на сокращение)
- Сектор услуг (август): 54.5 (предыдущее значение: 55.4)
- Обрабатывающая промышленность (июль): 53.0 (предыдущее значение: 53,3)
- S&P Global Composite (август): 54.6 (предыдущее значение: 55.4)
РЫНОК ТРУДА:
- Уровень безработицы (август): 4.3% (предыдущее значение: 4.2%)
- Общее число лиц, получающих пособие по безработице: 1.9393K (против 1.939K)
- Изменение числа занятых в несельскохозяйственном секторе (август): 22K (ранее пересмотренное: 79K)
- Изменение числа занятых в частном несельскохозяйственном секторе США (август): 38K (предыдущее значение: 77K)
- Средняя почасовая заработная плата (август, г/г): +3.7% (предыдущее значение: +3.9%)
- Вакансии JOLTS (август): 7.181M (против 7.357M)
- Общее число лиц, получающих пособие по безработице в США: 1,920K (против 1,927K):
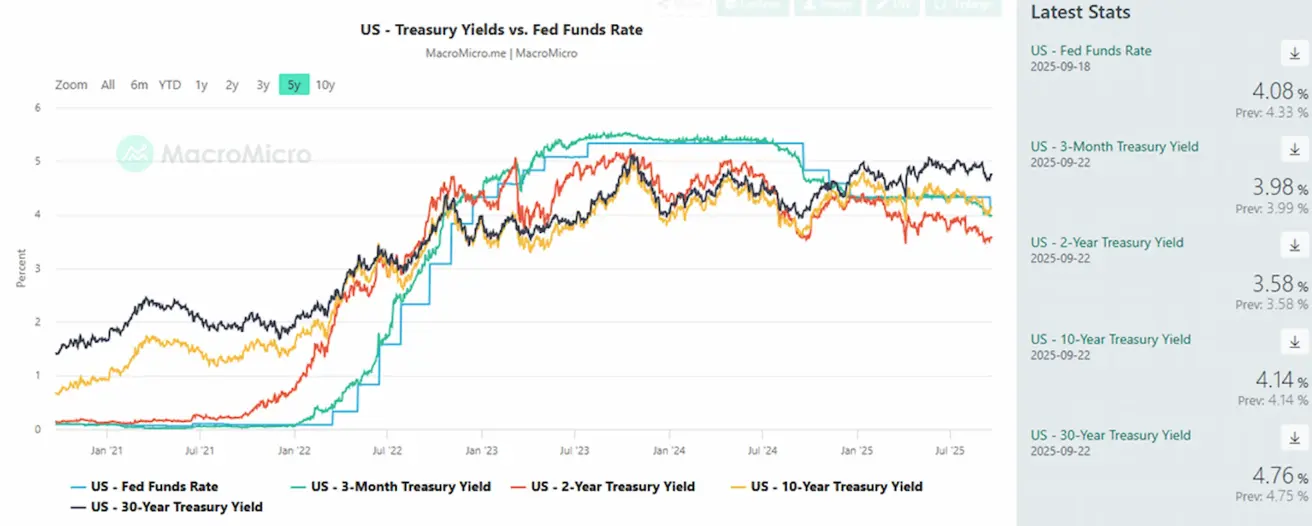
ДЕНЕЖНО-КРЕДИТНАЯ ПОЛИТИКА
- Эффективная ставка по федеральным фондам (EFFR): 4.00%–4.25% (без изменений)
- Баланс Федеральной резервной системы увеличился: $6,608T (против $6,605T неделей ранее)
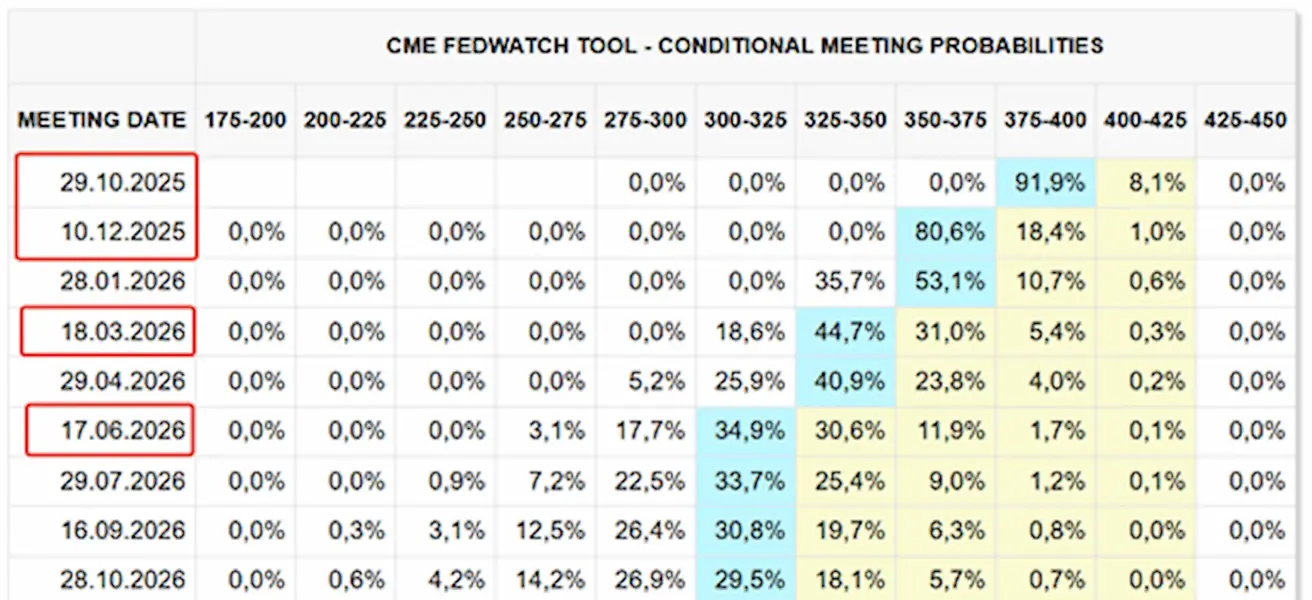
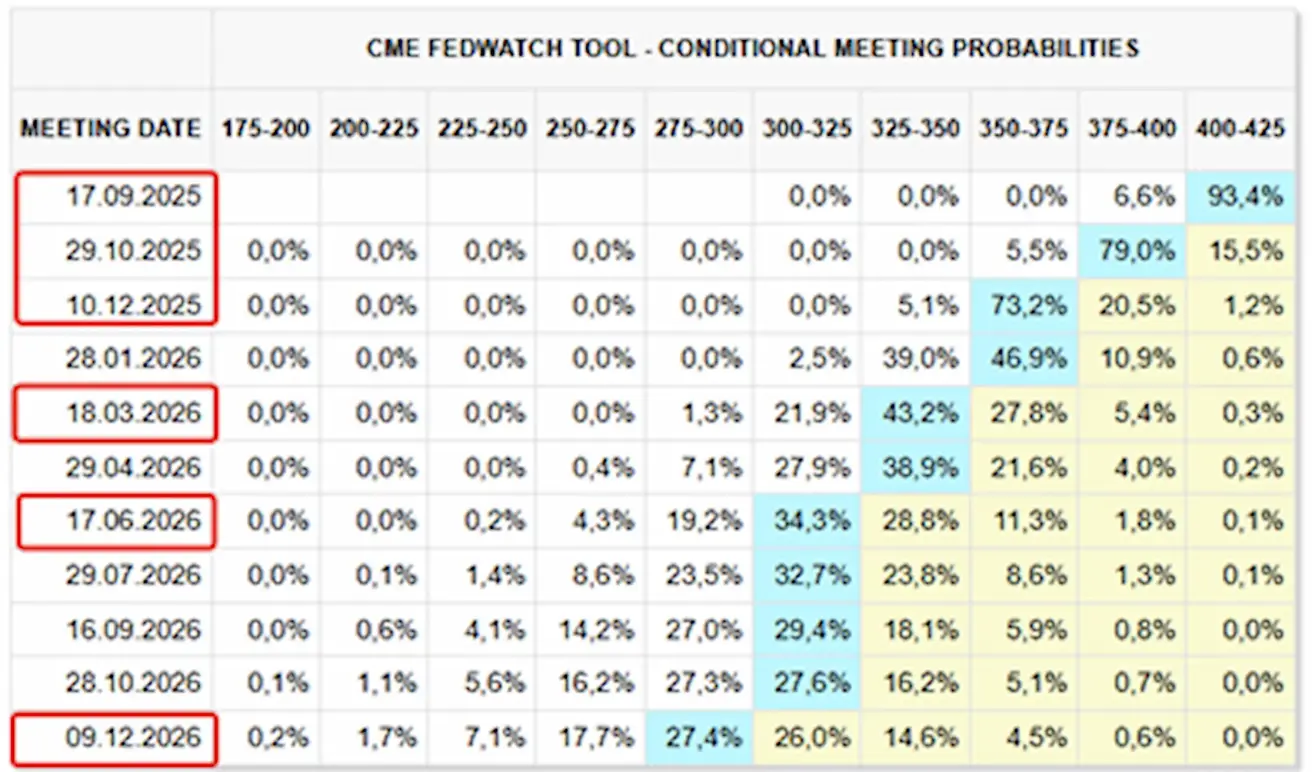
РЫНОЧНЫЕ ОЖИДАНИЯ ПО СТАВКЕ (FEDWATCH)
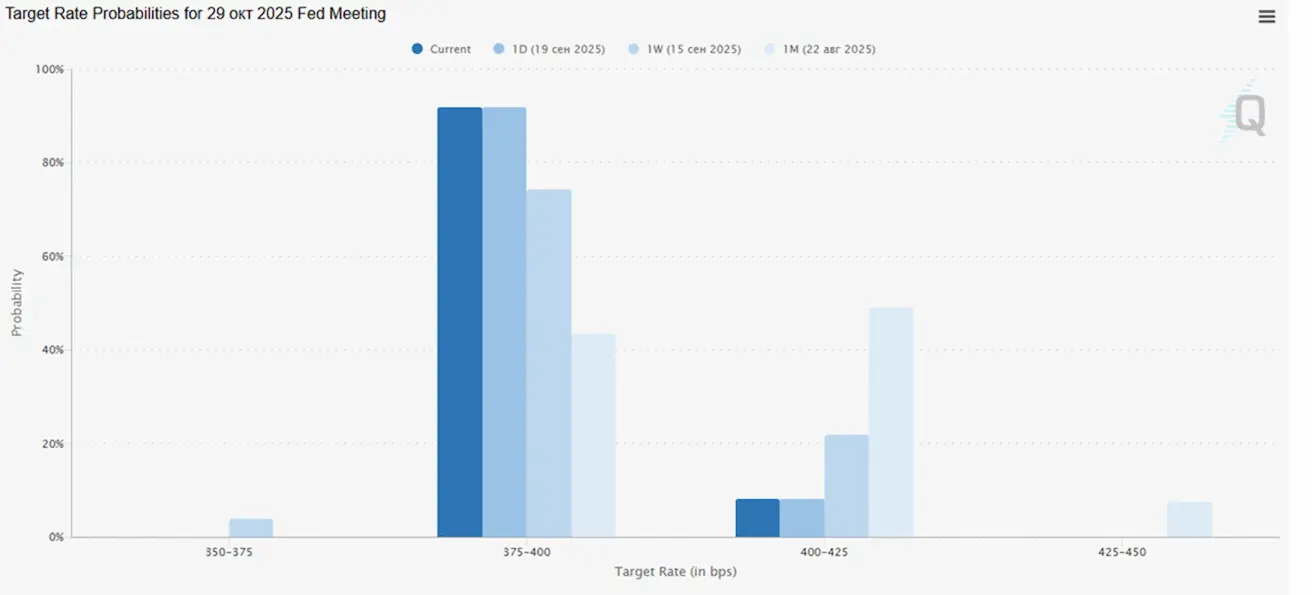
На сегодня:
Неделей ранее:
Комментарий
На прошлой неделе основные фондовые биржи продемонстрировали положительную динамику. После заседания FOMC ключевые индексы США продолжили рост.
FOMC снизил ставку по федеральным фондам на 0.25%, до диапазона 4.00–4.25%, одновременно сигнализируя о скором завершении QT и указывая на высокую вероятность еще двух снижений ставки в этом году.
Важно, что до заседания FOMC Сенат утвердил Стивена Миранa — союзника Трампа и сторонника более мягкой денежно-кредитной политики — в Совет управляющих Федеральной резервной системы. Миран также известен своей поддержкой криптовалют.
Решение ФРС о снижении ставки было принято на фоне повышения прогноза по ВВП и понижения прогноза по безработице, что, с одной стороны, выглядит логично. С другой — противоречиво, учитывая, что прогноз по инфляции был повышен, а председатель Пауэлл сам отметил, что безработица остается на исторически низких уровнях.
Это расхождение между прогнозами и решением по политике усиливает мнение о том, что ФРС может утрачивать независимость. В условиях политики Трампа это создает риск структурно более высокой инфляции.
Рыночные ожидания (FedWatch):
ФРС прогнозирует целевой диапазон ставки 3.25–3.50% на следующий год, в то время как рынок свопов (FedWatch) продолжает закладывать более быстрый темп смягчения — еще на 0.50% к 2026 году.
- На следующем заседании (29 октября): подразумеваемая вероятность снижения ставки на 0.25% составляет 91.9%;
- До конца года: ожидаются два снижения;
- В течение следующих 12 месяцев: четыре снижения по 25 б.п., что приведет ставку в диапазон 3.00–3.25%.
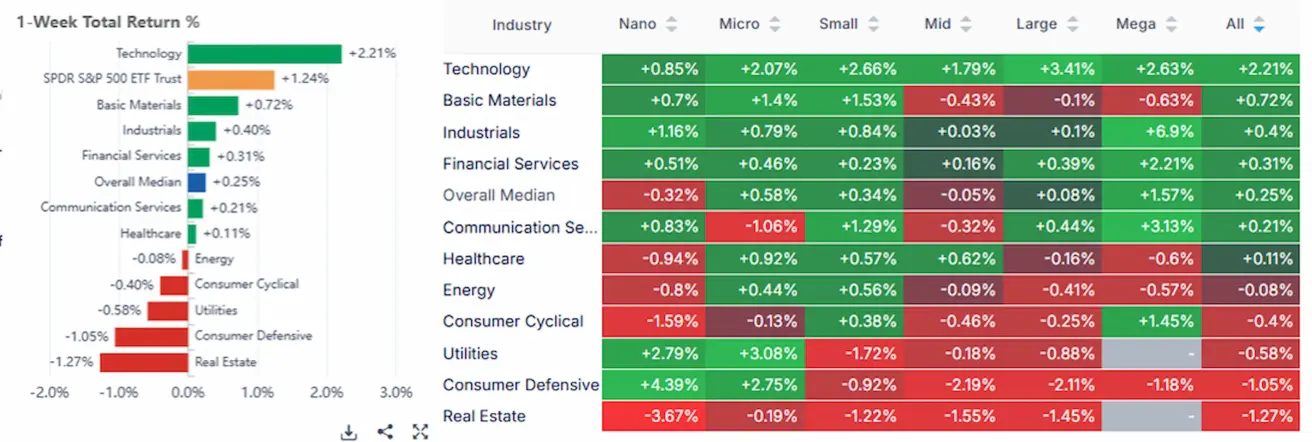
Рынок
К концу недели медианный прирост составил +0.25%. Лидерами стали секторы технологий, сырьевых материалов и промышленности, в аутсайдерах — сектор товаров повседневного спроса, недвижимость и коммунальные услуги.
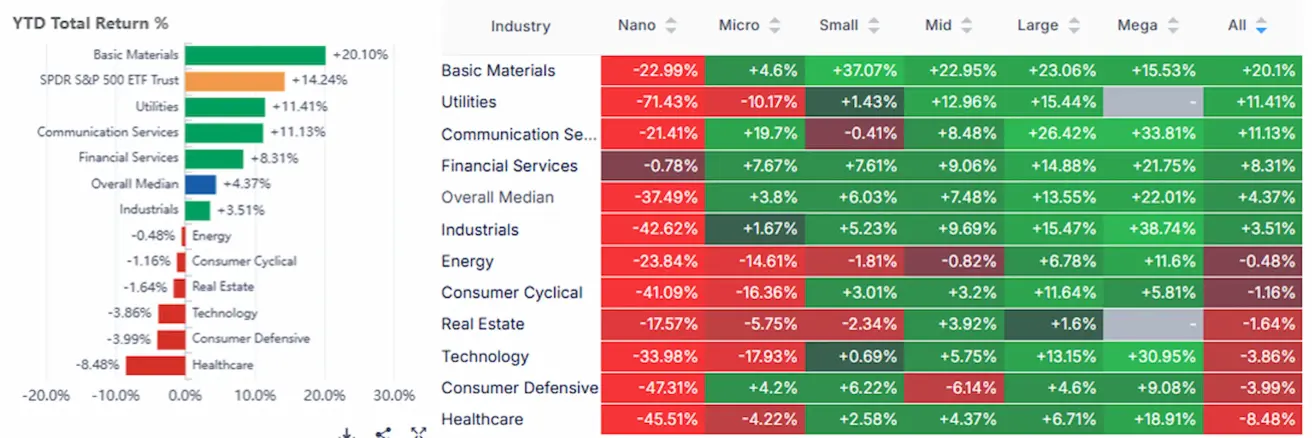
YTD (с начала года): +4.37%. Лидерами выступили сырьевые материалы, коммуникационные услуги и коммунальные услуги, аутсайдерами — товары повседневного спроса, здравоохранение и технологический сектор.
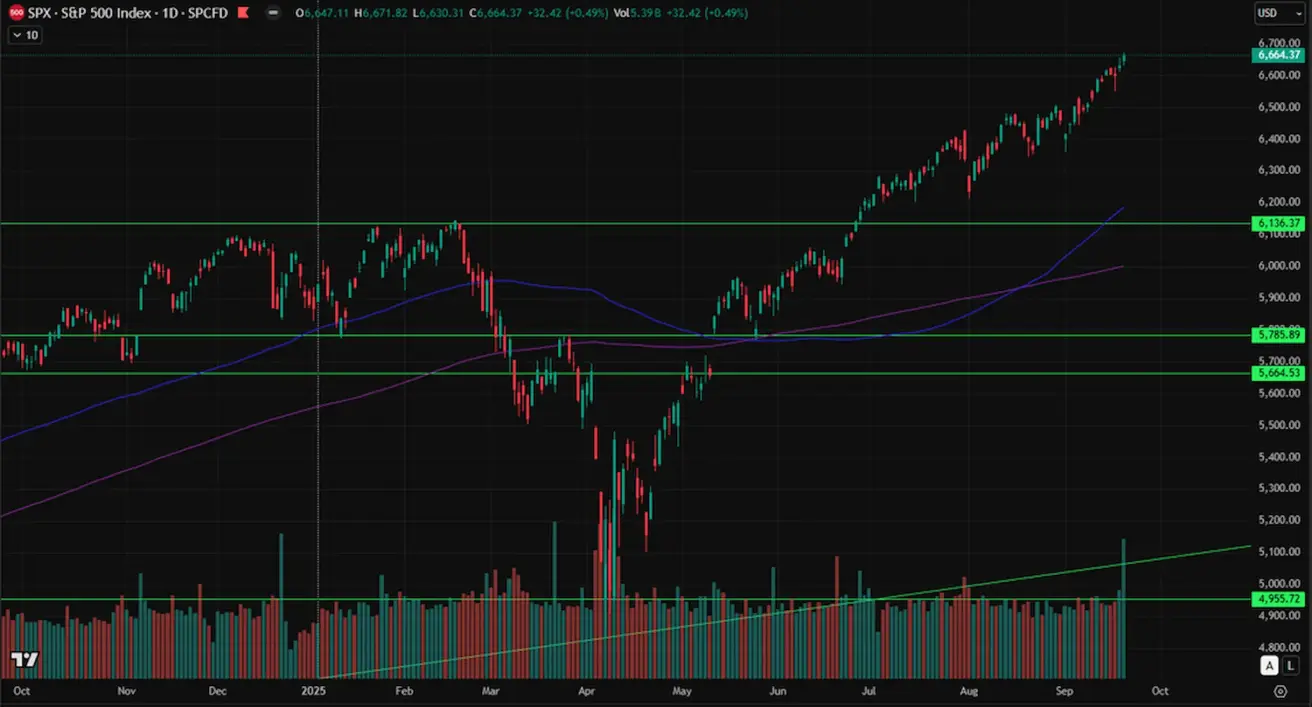
SP500
Недельный рост: +1.22% (закрытие недели на уровне 6,664.37). С начала 2025 года: +12.89%.
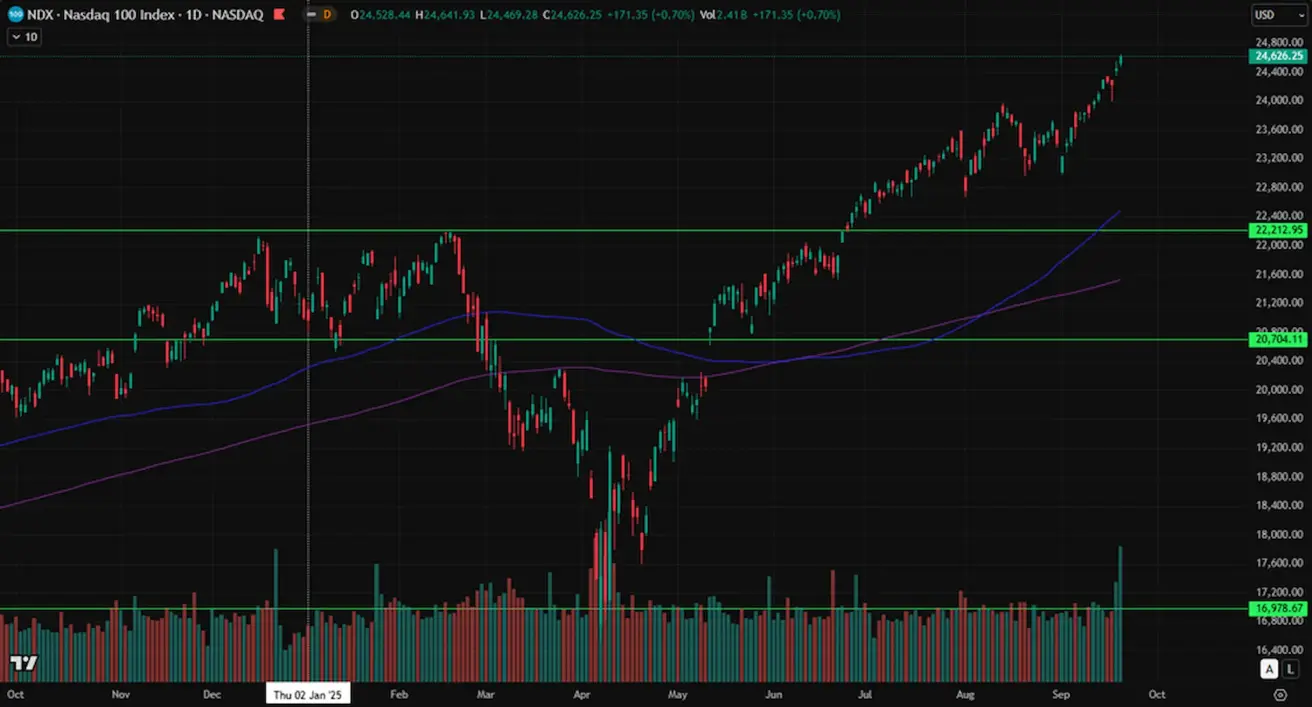
NASDAQ100
Недельный рост: +2.22% (закрытие недели на уровне 24,626.25). С начала года: +16.60%.
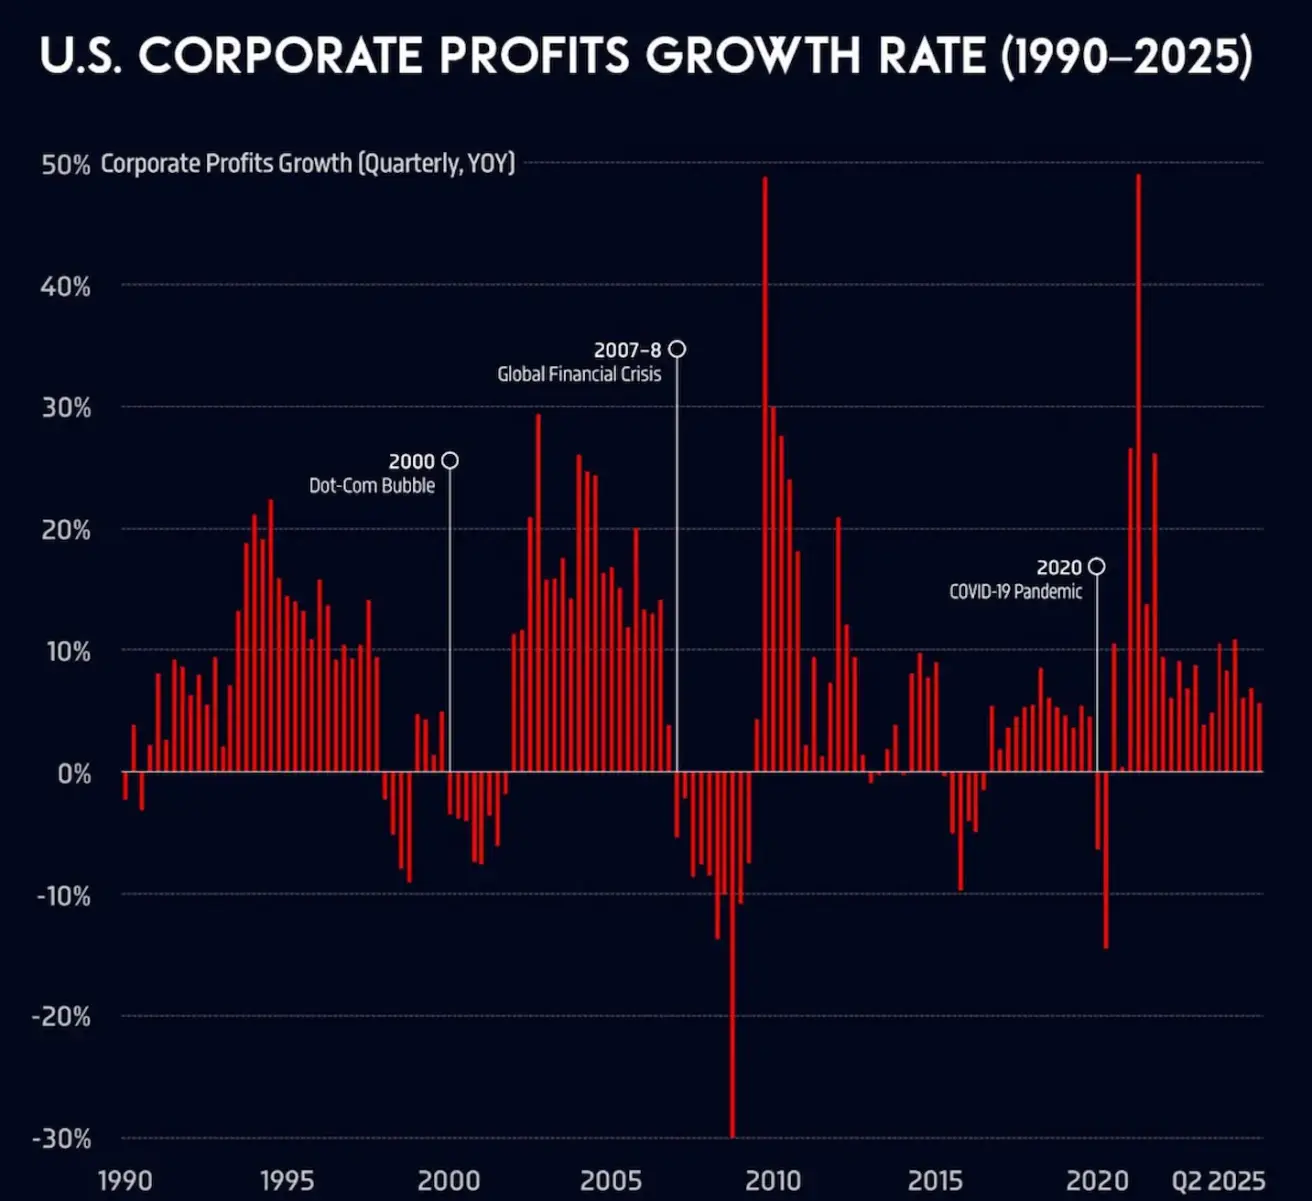
Темпы роста прибыли корпоративного сектора США (помесячно, 1990–2025 годы). Годовой рост корпоративной прибыли в США замедлился — с 10.8% во 2 кв. 2024 года до 4.3% во 2 кв. 2025 года.
Euro Stoxx 600
Не смог пробить уровень сопротивления. Недельный рост: +0.16% (закрытие недели на уровне 555.8). Прирост с начала года: +9.93%.
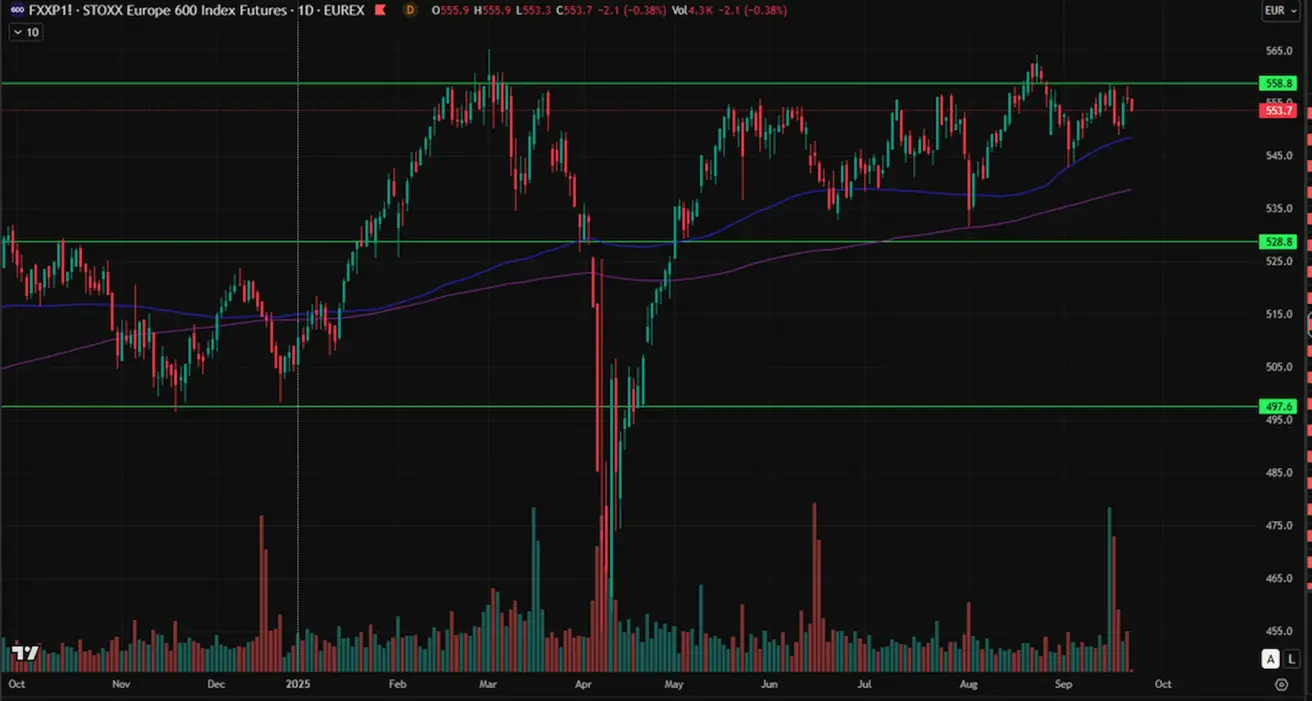
Рейтинговое агентство Fitch понизило кредитный рейтинг Франции с AA– до A+, ссылаясь на политическую нестабильность и рост государственного долга.
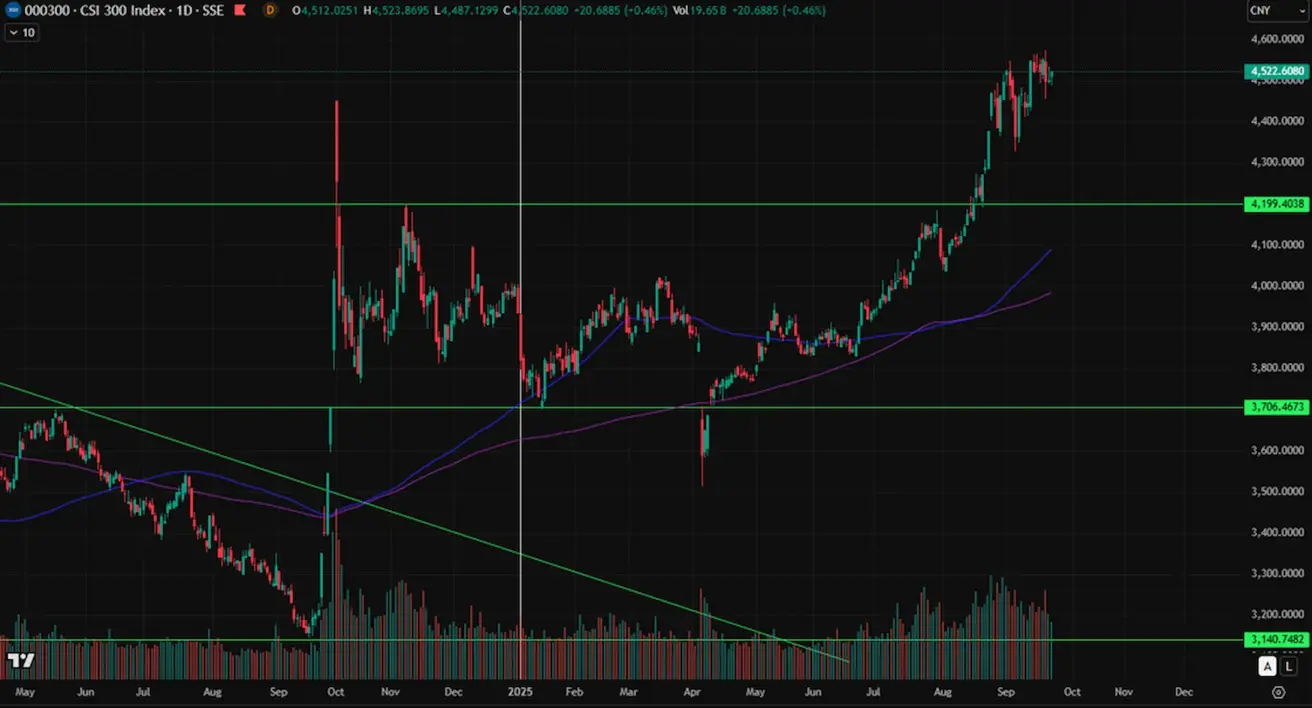
Индекс CSI
На понедельник: –0.44% (закрытие недели на уровне 4,501.91). Рост с начала года: +14.52%.
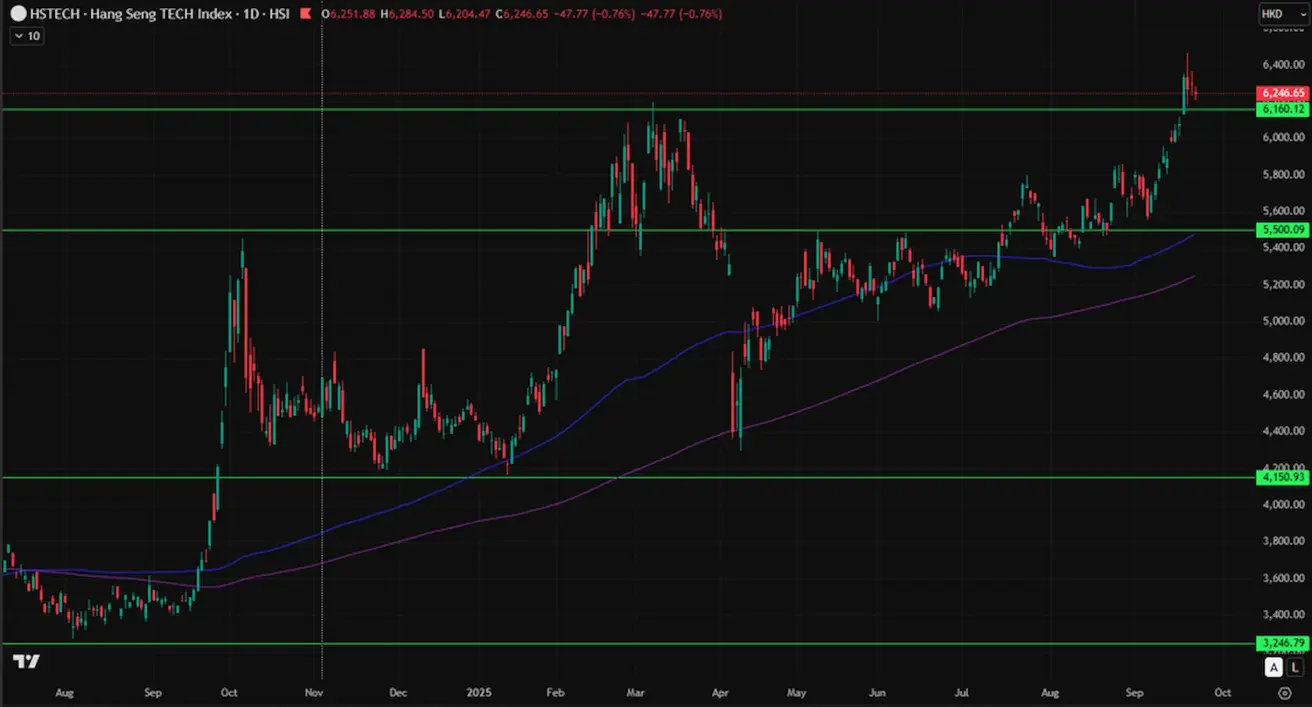
Hang Seng
На понедельник: +3.44% (6,251.75). Рост с начала года: +40.91%.
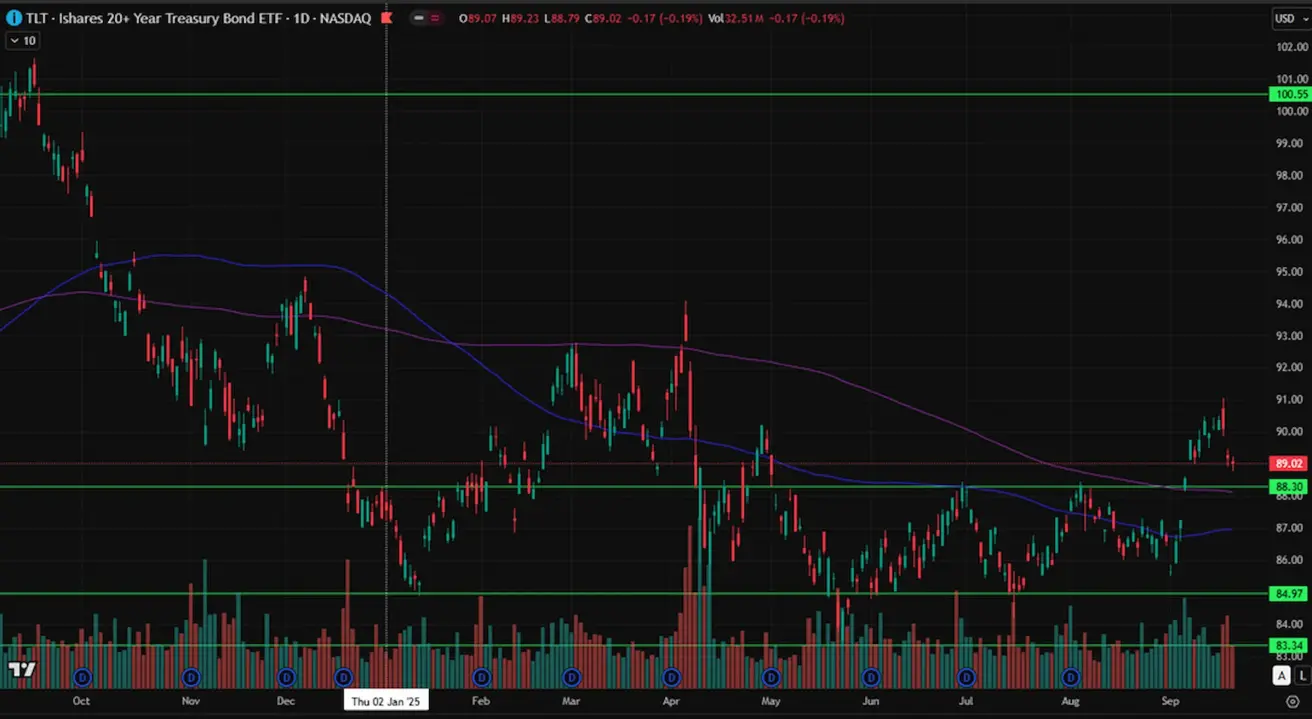
РЫНОК ОБЛИГАЦИЙ
К концу недели доходности резко выросли после заседания FOMC, несмотря на ожидания снижения ставок на двух следующих заседаниях. Рынок казначейских облигаций США сигнализирует о рисках будущей инфляции. Treasuries 20+ (ETF TLT): недельная доходность: –1.03% (закрытие недели на уровне 89.02). С начала 2025 года: +1.39%.
ДОХОДНОСТИ И СПРЕДЫ
- Рыночная доходность 10-летних казначейских облигаций США (постоянный срок до погашения): 4.14% (против 4.08%);
- ICE BofA BBB U.S. Corporate Index Effective Yield: 4.93% (против 4.91%);
- Спред доходностей между 10-летними и 2-летними казначейскими облигациями США: 56.0 б.п. против 52.0 б.п.;
- Спред доходностей между 10-летними и 3-месячными казначейскими облигациями США: 16.0 б.п. против 5.0 б.п.
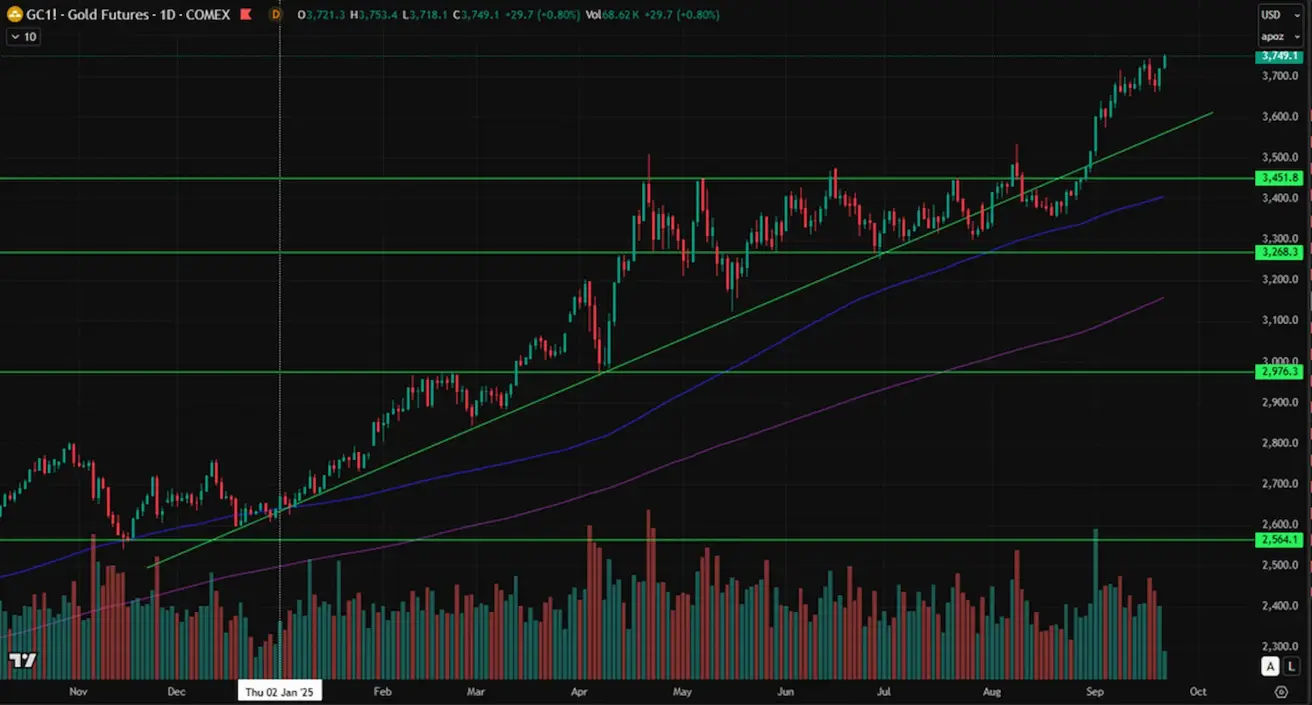
ФЬЮЧЕРСЫ НА ЗОЛОТО (GC)
Недельная доходность: +1.05% (закрытие недели: $3,719.4/oz). Прирост с начала года: +40.83%.
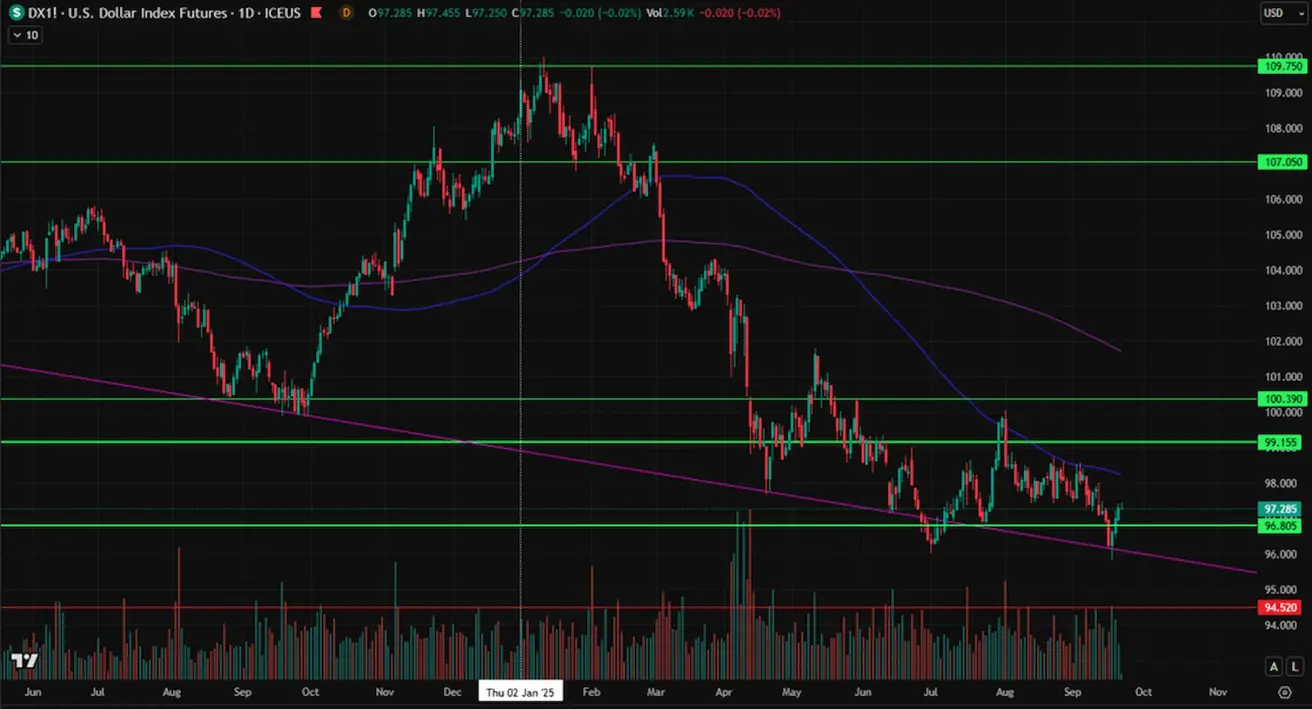
ФЬЮЧЕРСЫ НА ИНДЕКС ДОЛЛАРА (DX)
Недельная доходность: +0.09% (закрытие недели: 97.305). С начала 2025 года: –10.18%.
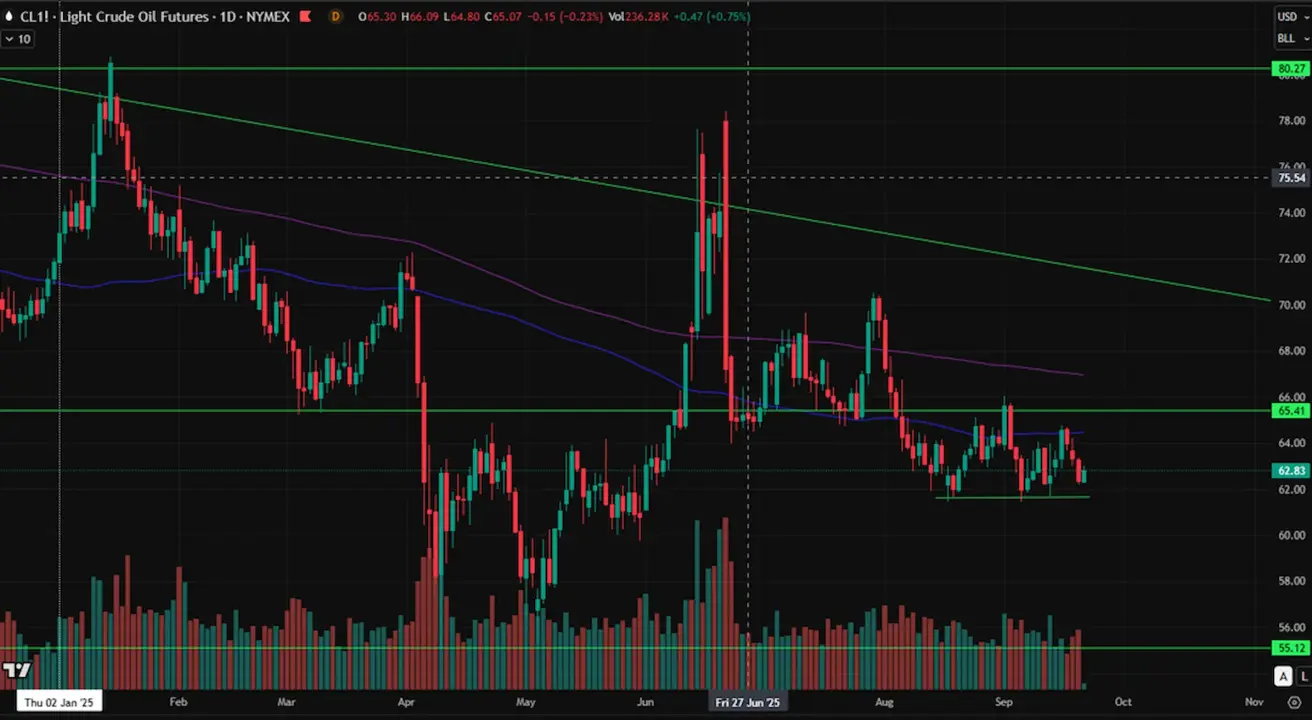
ФЬЮЧЕРСЫ НА НЕФТЬ
Недельная доходность: –0.38% (закрытие недели: $62.36/barrel). С начала года: –13.21%.
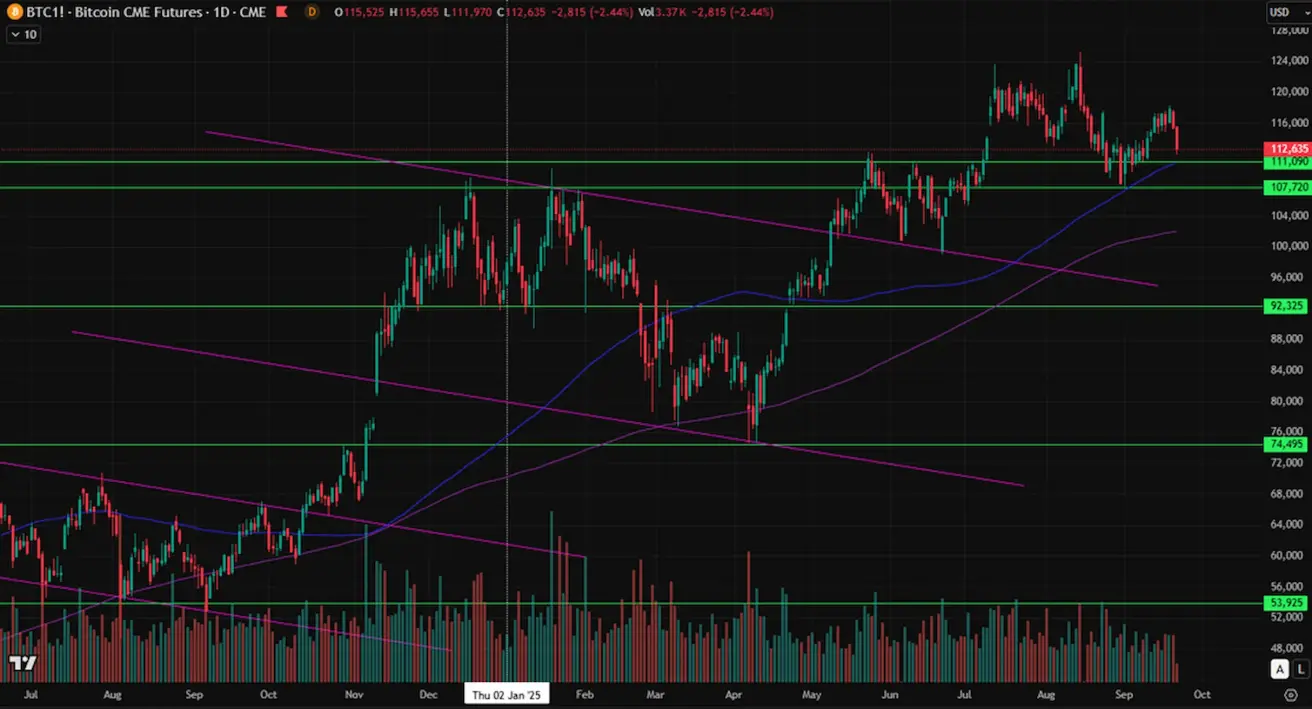
ФЬЮЧЕРСЫ НА BTC
Недельная доходность: –1.20% (закрытие недели: $115,450). С начала 2025 года: +21.18%.
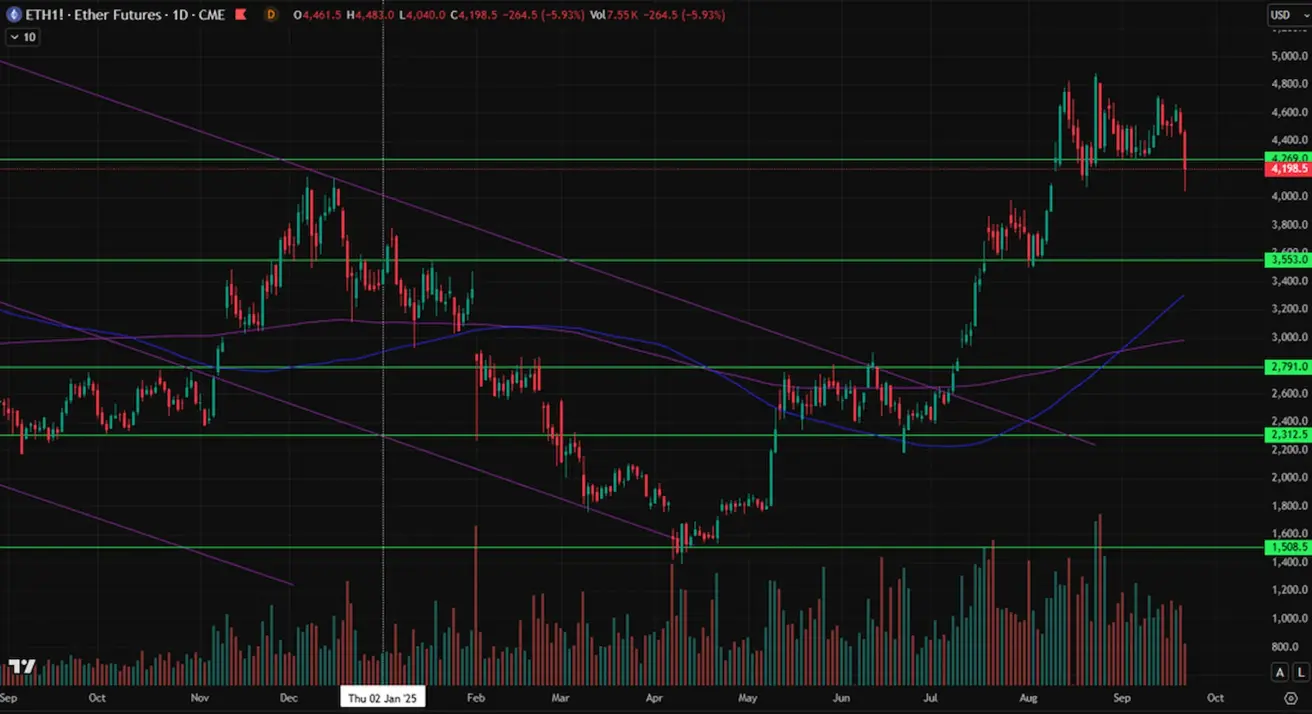
ФЬЮЧЕРСЫ НА ETH
Недельная доходность: –5.09% (закрытие недели: $4,463.00). Результат с начала года: –31.89%.
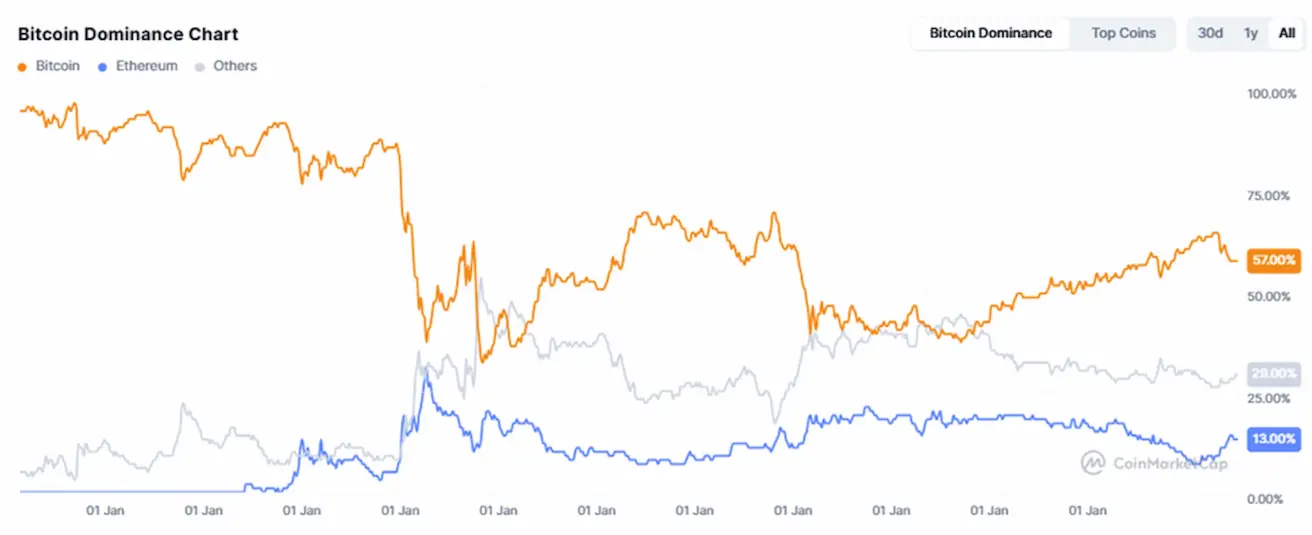
Рыночная капитализация криптовалют: $3.89 trillion (против $4.0 trillion неделей ранее) (coinmarketcap.com).
- Доля Bitcoin: 57.7% (57.4%),
- Ethereum: 13.0% (13.7%),
- прочие: 29.2% (29.0%).
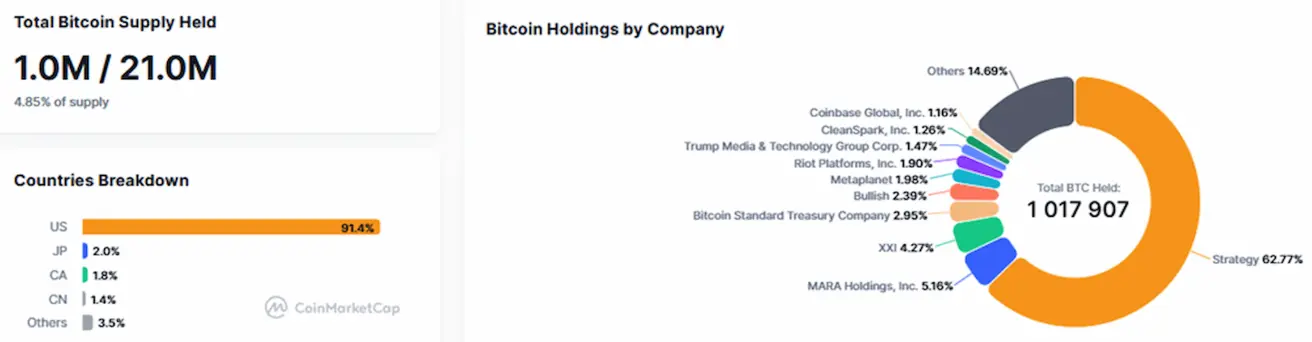
Публичные компании со стратегиями хранения Bitcoin в казначействе. Доля биткоинов, удерживаемых на корпоративных балансах, осталась неизменной по сравнению с предыдущей неделей — 4.85% (против 4.66%) от общего объема предложения биткоина.
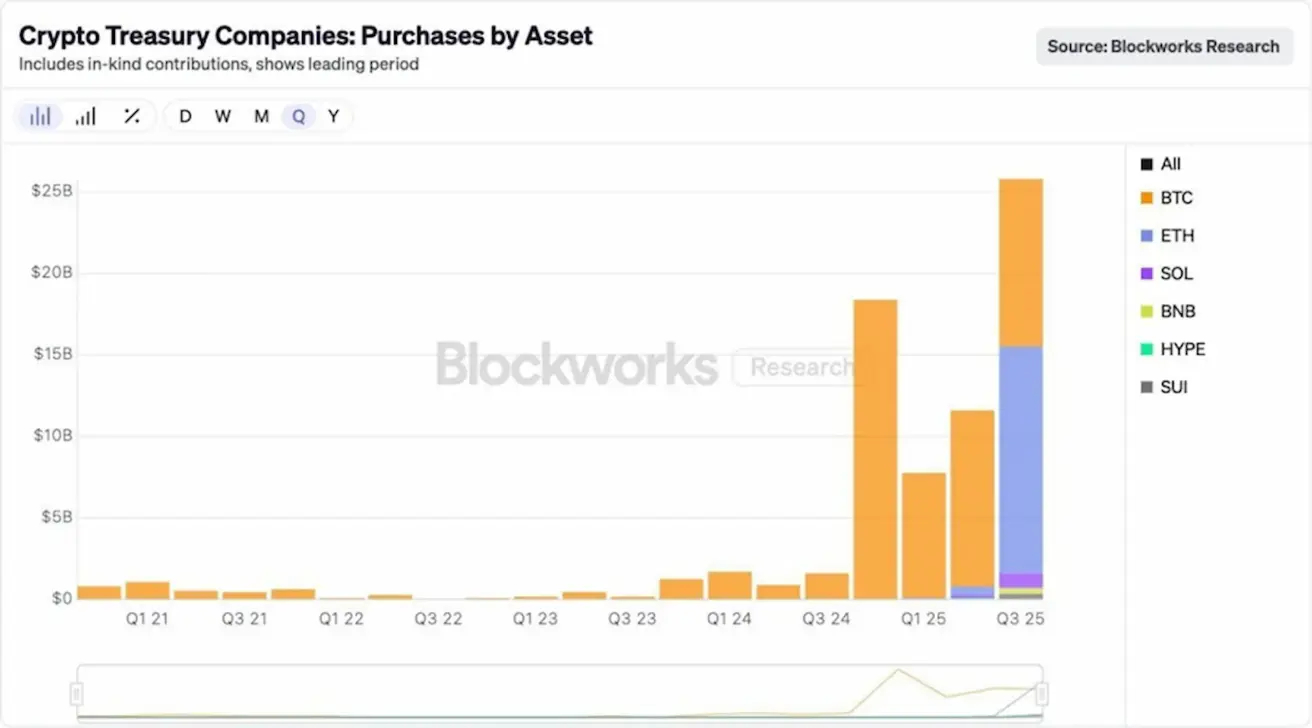
В этом квартале объем цифровых активов в казначействах увеличился более чем на $25 billion, при этом 54% притока было направлено в Ethereum.
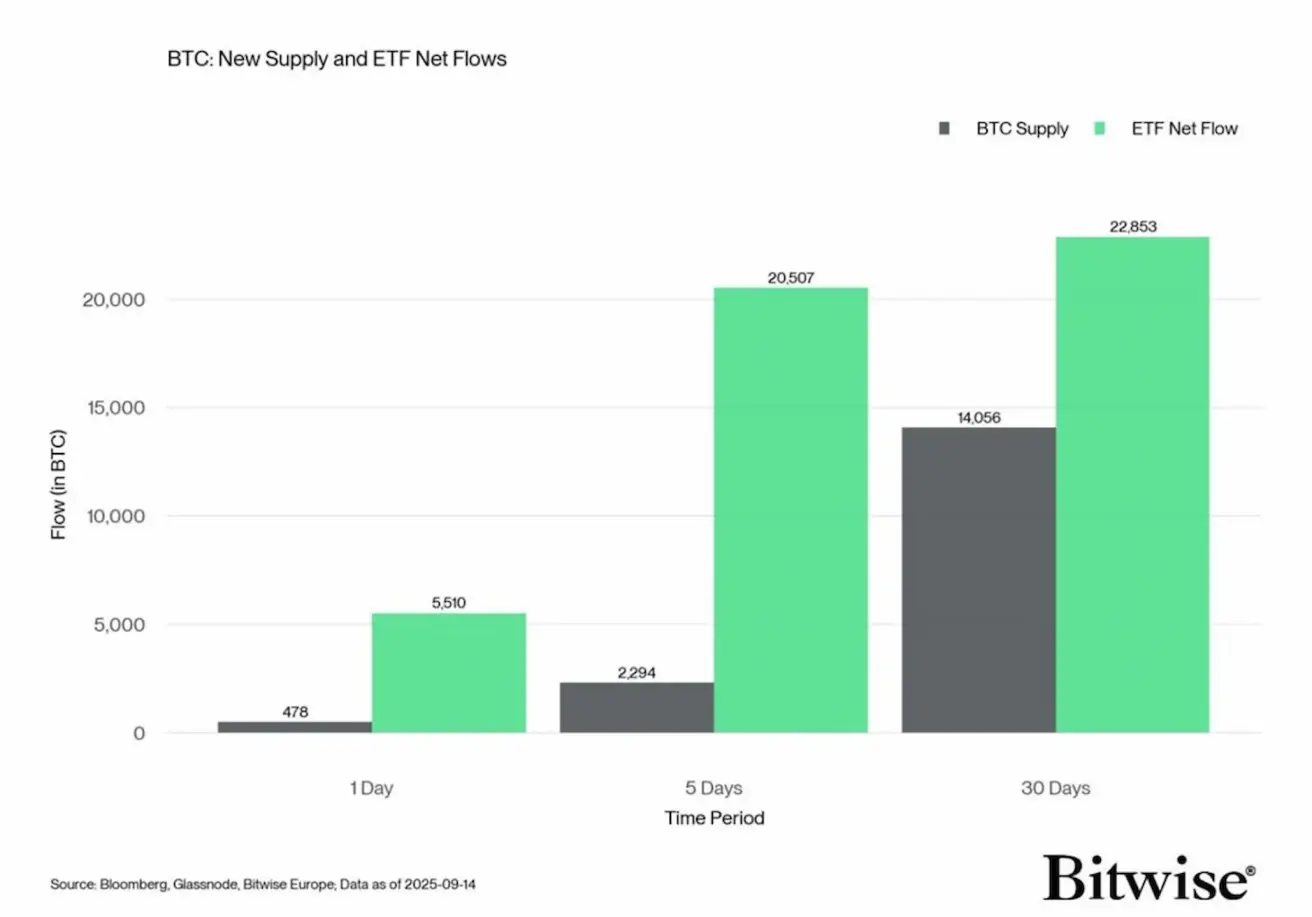
Приток средств в американские ETF превышает весь новый объем предложения BTC.
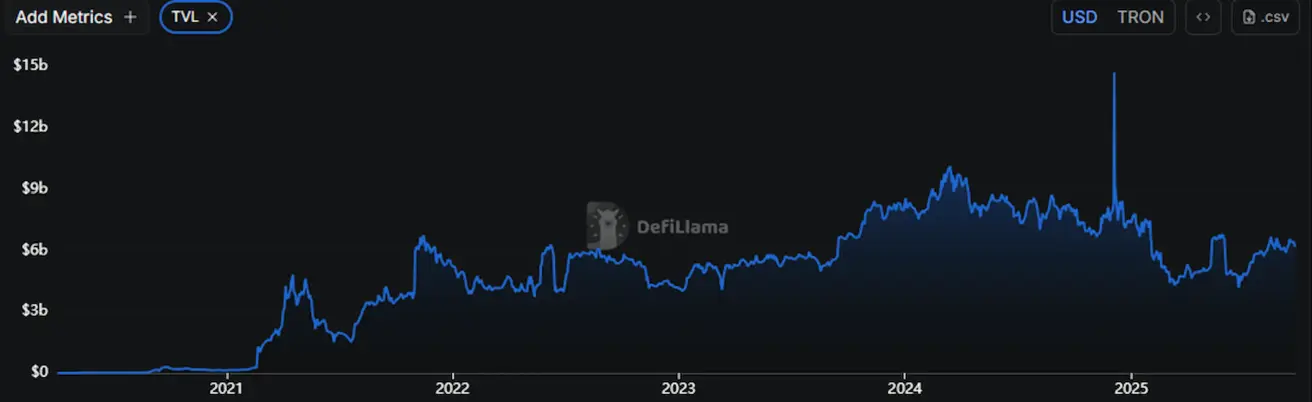
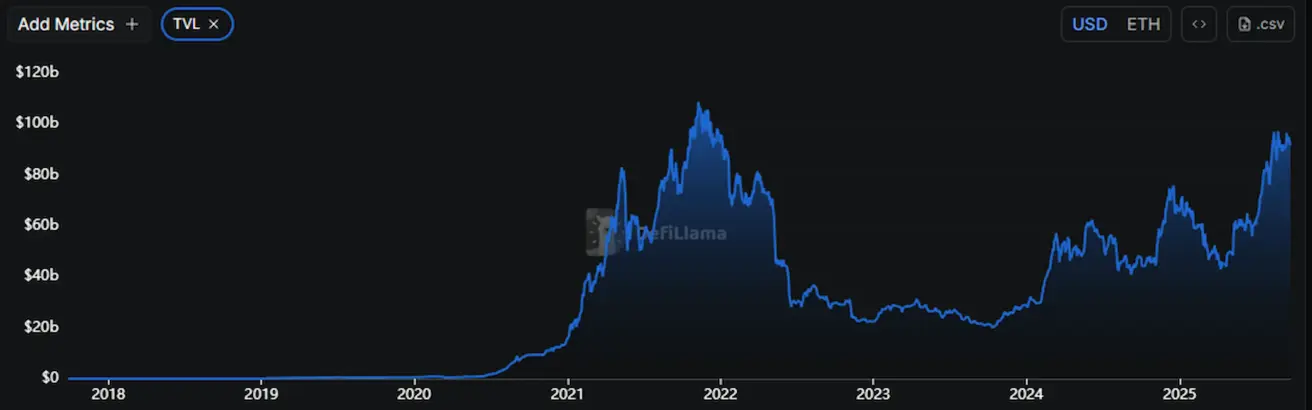
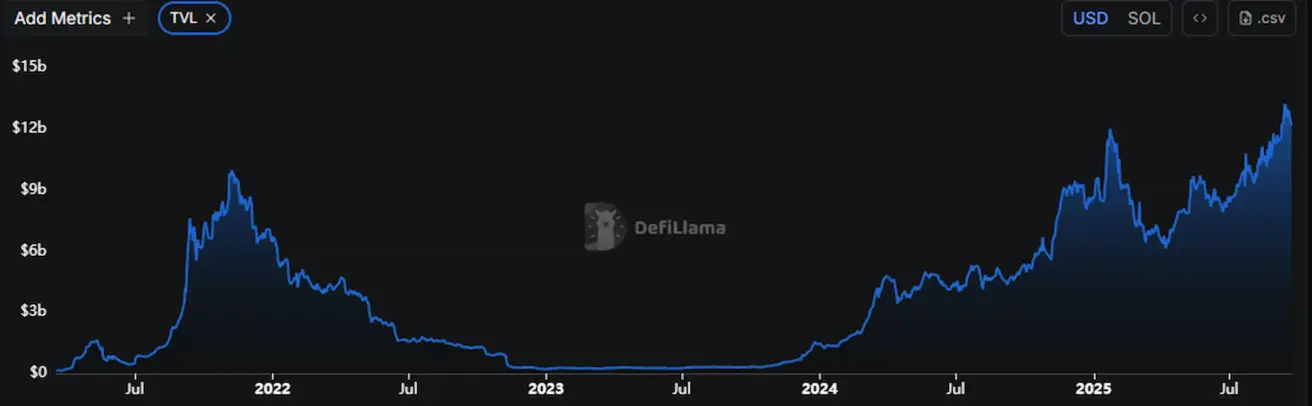
TVL (Total Value Locked — общий объем средств, заблокированных в протоколах, то есть капитала, активно размещенного в блокчейне):
- Ethereum: $91.804 billion (–3.44%).
- Solana: $12.186 billion (–2.62%), достигнув нового исторического максимума выше $13 billion.
Ethereum: $6.174 billion (–4.14%).