Lietuvių
 Русский
 Қазақша
 Eesti
EestiApril 13 – 19, 2026: Weekly economic update
Key market updates

United States (key takeaways):
- The rate remains unchanged, with cautious rhetoric maintained;
- Monetary policy remains moderately restrictive;
- Furthermore, U.S. macroeconomic data continues to support a soft landing scenario: inflationary risks are rising, the labor market is cooling without signs of recession, and, at this stage, does not warrant a rate cut.
Macroeconomic Statistics
INFLATION: CONSUMER PRICE INDEX (MARCH):
- Core CPI: (MoM) 0.2% (prev: 0.2%); (YoY) 2.6% (prev: 2.5%).
- CPI: (MoM) 0.9% (prev: 0.3%); (YoY) 3.3% (prev: 2.4%).
PRODUCER PRICE INDEX (FEBRUARY):
- PPI (m/m): 0.5%, prev: 0.7%.
- Core PPI (m/m): 0.1%, prev: 0.3%:
Headline PPI remains relatively elevated, rising by 0.5% (MoM), while core PPI has slowed markedly to 0.1%. Overall, inflationary pressures persist, but they are not broad-based.
Producer price inflation (PPI), with certain caveats, can be viewed as a leading indicator of consumer inflation (CPI), excluding the services sector.
On average, increases in producer prices tend to pass through to retail prices within 1–3 months (and in some cases up to 6 months), depending on the industry and inventory turnover dynamics.
Over the medium term, the Federal Reserve focuses primarily on core inflation metrics. Core PPI and CPI are decelerating; accordingly, the current data does not warrant further monetary tightening, but neither does it provide sufficient grounds for rate cuts. The “wait-and-see” stance is thus reaffirmed.
INFLATION EXPECTATIONS (MICHIGAN) (MARCH):
- 12-month inflation expectations: 4.8% (prev: 3.8%);
- 5-year inflation expectations: 3.4% (prev: 3.2%).
GDP (U.S. Bureau of Economic Analysis, BEA) (Q4 2025, annualized, third estimate): +0.5% (second estimate: 0.7%; Q3 2025: +4.4%).
The GDPNow indicator (a “real-time” estimate ahead of the official release) by the Federal Reserve Bank of Atlanta stands at 1.3% (previous: 1.6%).
The New York Empire State Manufacturing Index (April) came in at 11 (previous: -0.2).
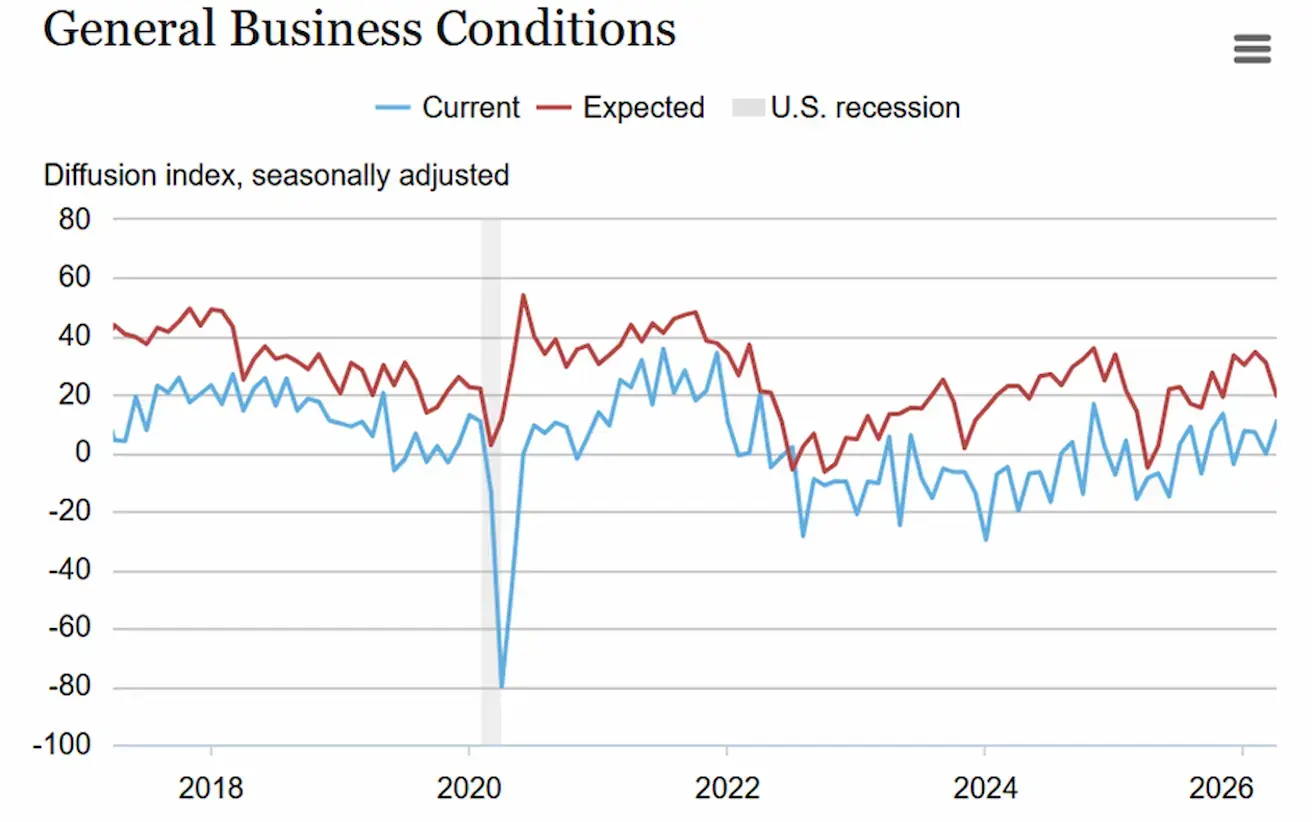
According to a survey of New York State manufacturing firms, business activity increased moderately in April. The general business conditions index rose by eleven points to 11.0. New orders and shipments expanded significantly, while supply availability deteriorated somewhat. Employment increased, and the average workweek lengthened.
Input price growth accelerated sharply following a slowdown in the previous month, whereas the pace of selling price increases remained largely unchanged. Firms maintained a moderate level of optimism about conditions in the months ahead, though sentiment softened somewhat and capital expenditure plans weakened.
BUSINESS ACTIVITY INDEX (PMI) (MARCH, PRELIMINARY DATA):
(Above 50 indicates expansion; below 50 indicates contraction)
- Services sector: 51.1 (prev: 51.7);
- Manufacturing sector: 52.4 (prev: 51.6);
- S&P Global Composite: 51.4 (prev: 51.9).
LABOR MARKET (BLS) (MARCH)
- Unemployment rate: 4.3% (prev: 4.4%);
- Total number of continuing jobless claims in the U.S.: 1,818K (prev: 1,794K);
- Initial jobless claims: 207K (prev: 219K);
- Change in nonfarm payroll employment: 178K (prev: -133K);
- Change in private nonfarm payroll employment: 186K (prev: -129K);
- Average hourly earnings (y/y): 3.5% (prev: 3.8%);
- JOLTS job openings: 6.542M (prev: 6.928M).
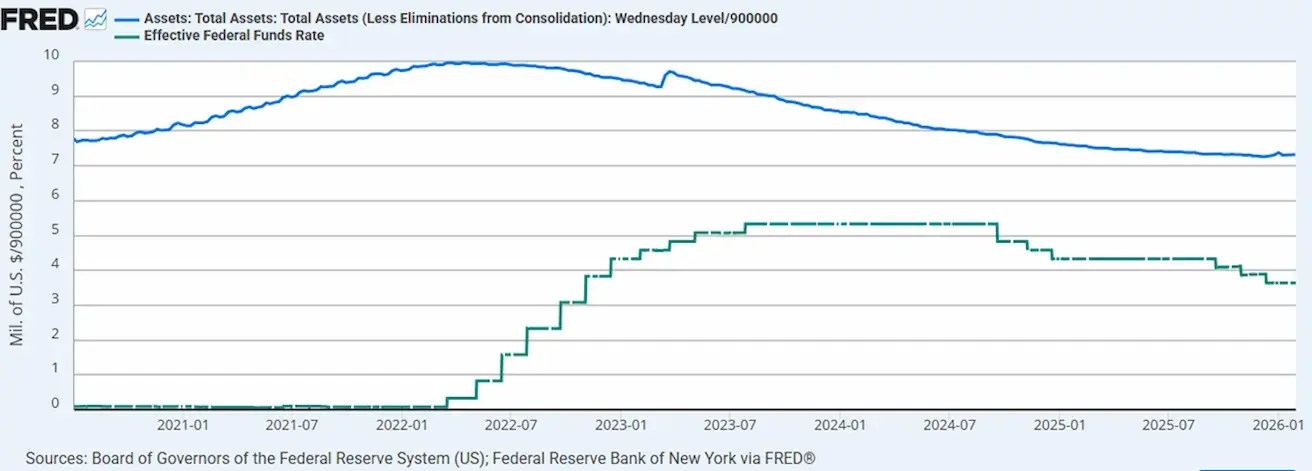
MONETARY POLICY
- Effective Federal Funds Rate (EFFR): 3.50%–3.75%;
- The Federal Reserve’s balance sheet stands at $6.705 trillion, up 2.60% since the halt of quantitative tightening (QT) ($6.535 trillion).
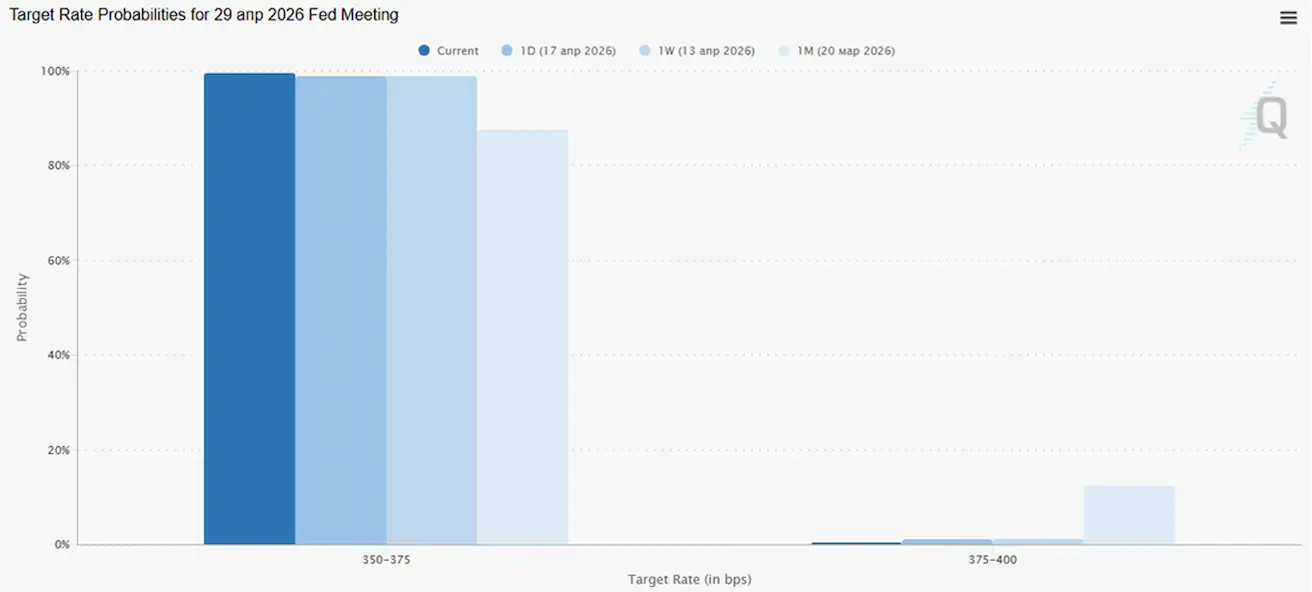
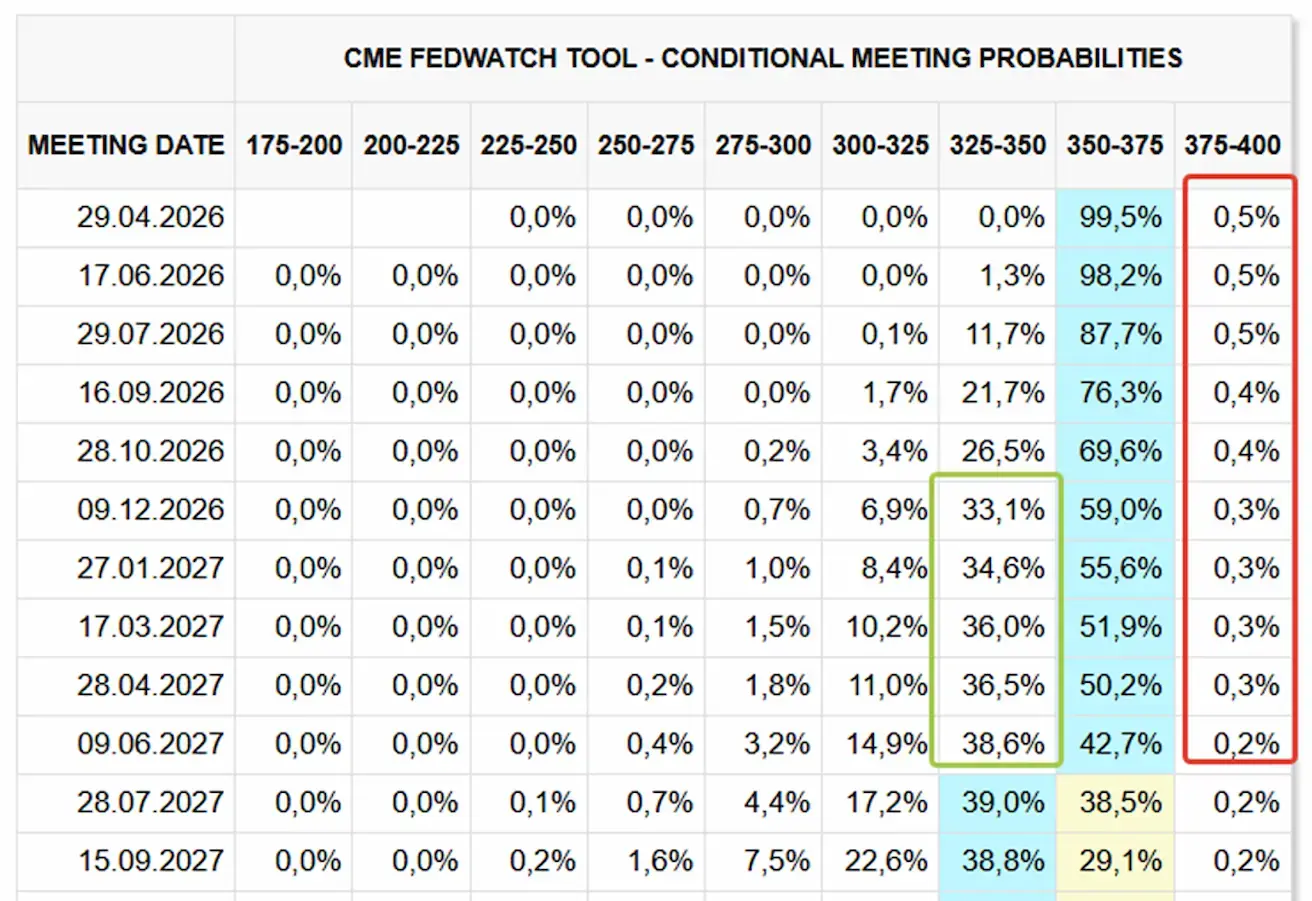
MARKET FORECAST FOR RATE (FEDWATCH)
For the upcoming meeting (April 29), the estimated probability of the rate remaining unchanged stands at 99.48%.
Over the next 12 months, the market is not pricing in any rate cuts and does not anticipate rate hikes. From early 2027, expectations for a 25 basis point rate cut start to build.
Market
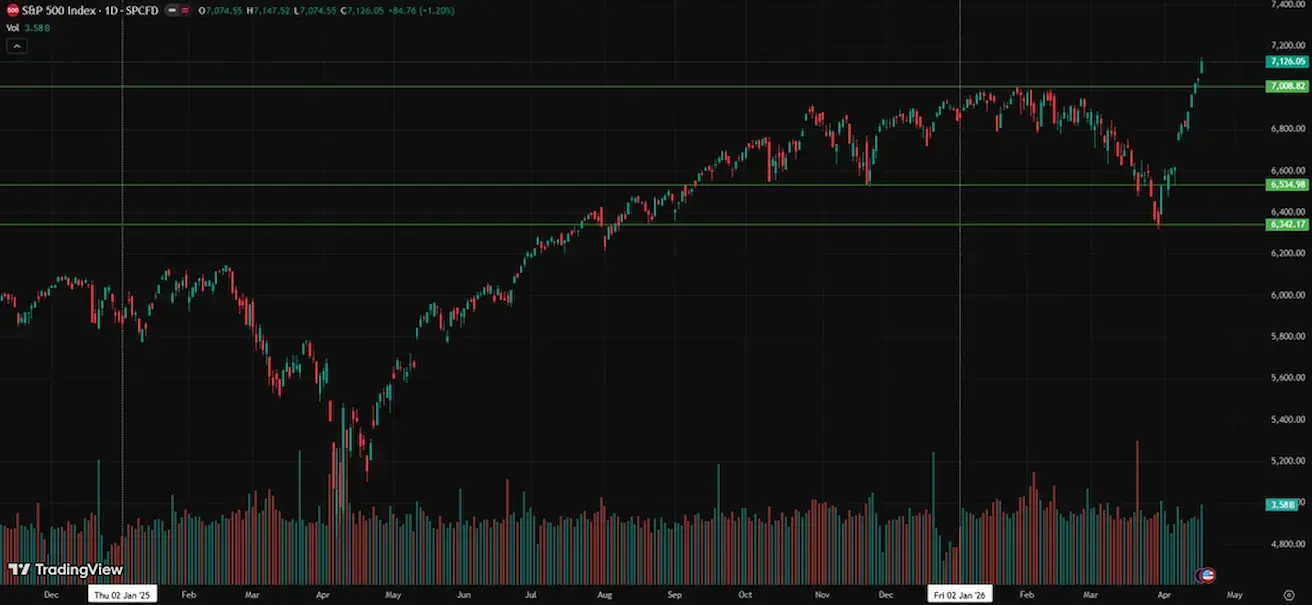
SP500
Weekly performance: +4,54% (week-end close at 7126,05); year-to-date: +4,10%.
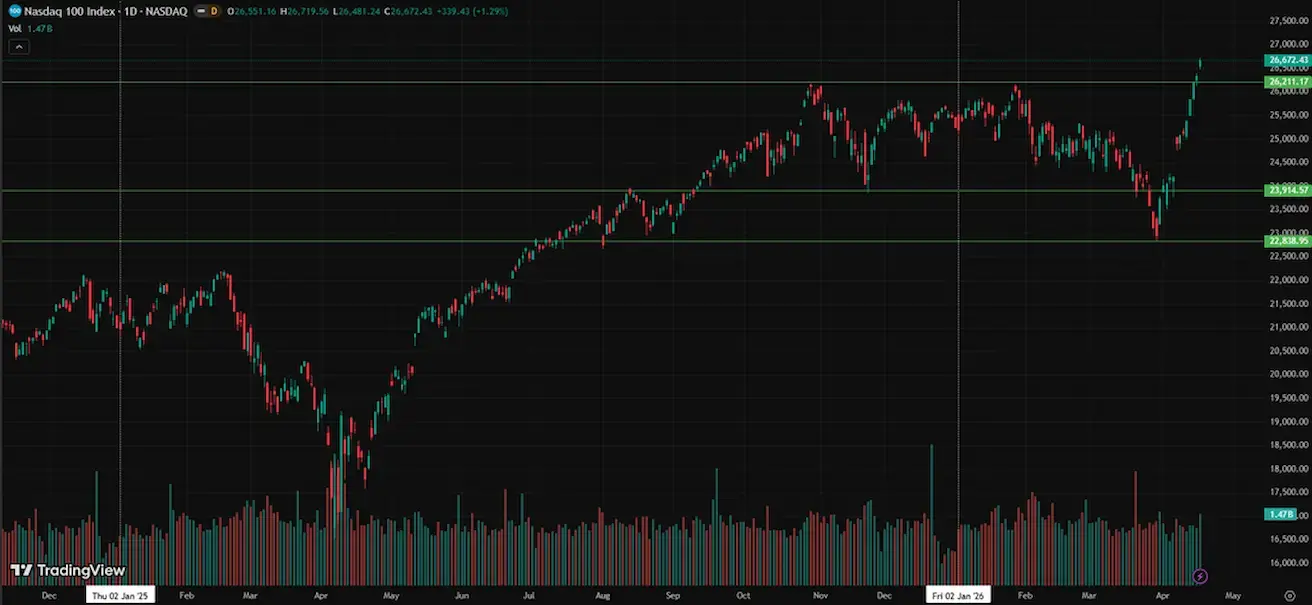
NASDAQ100
Weekly performance: +2,13% (week-end close at 26672,43); year-to-date: +5,63%.
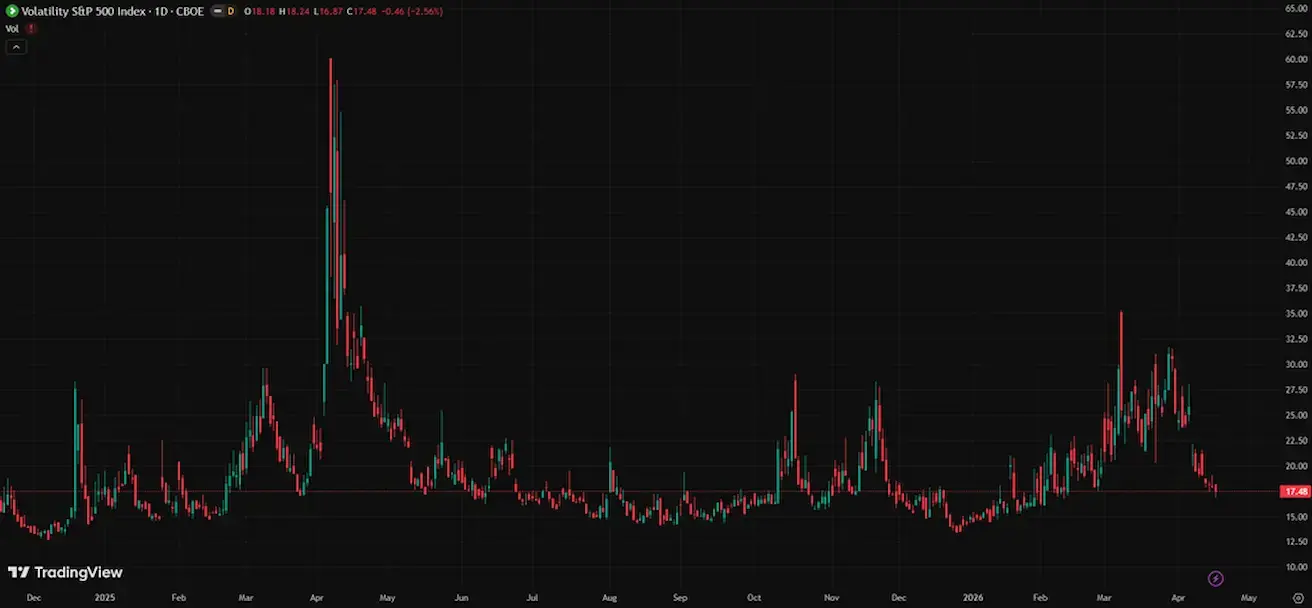
VIX
VIX (volatility index): week closing at 17.48 points.
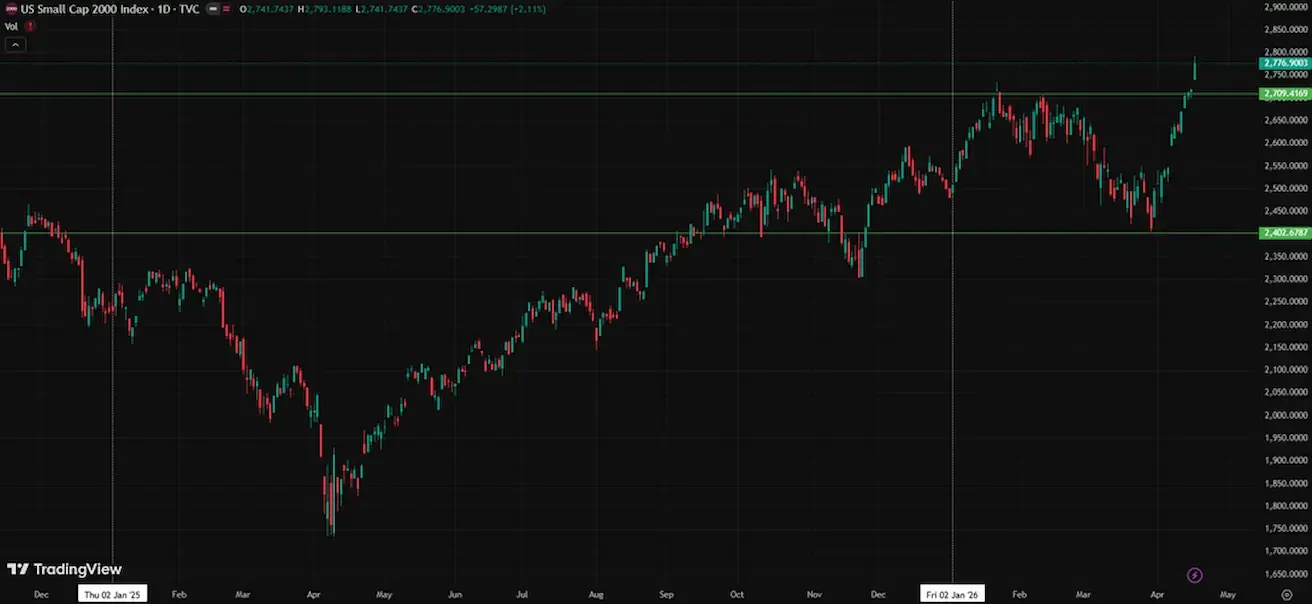
RUSSEL 2000 (RUT)
Weekly performance: +5,56% (week-end close at 2776,90); year-to-date: +11,89%.
Earnings season (selected highlights)
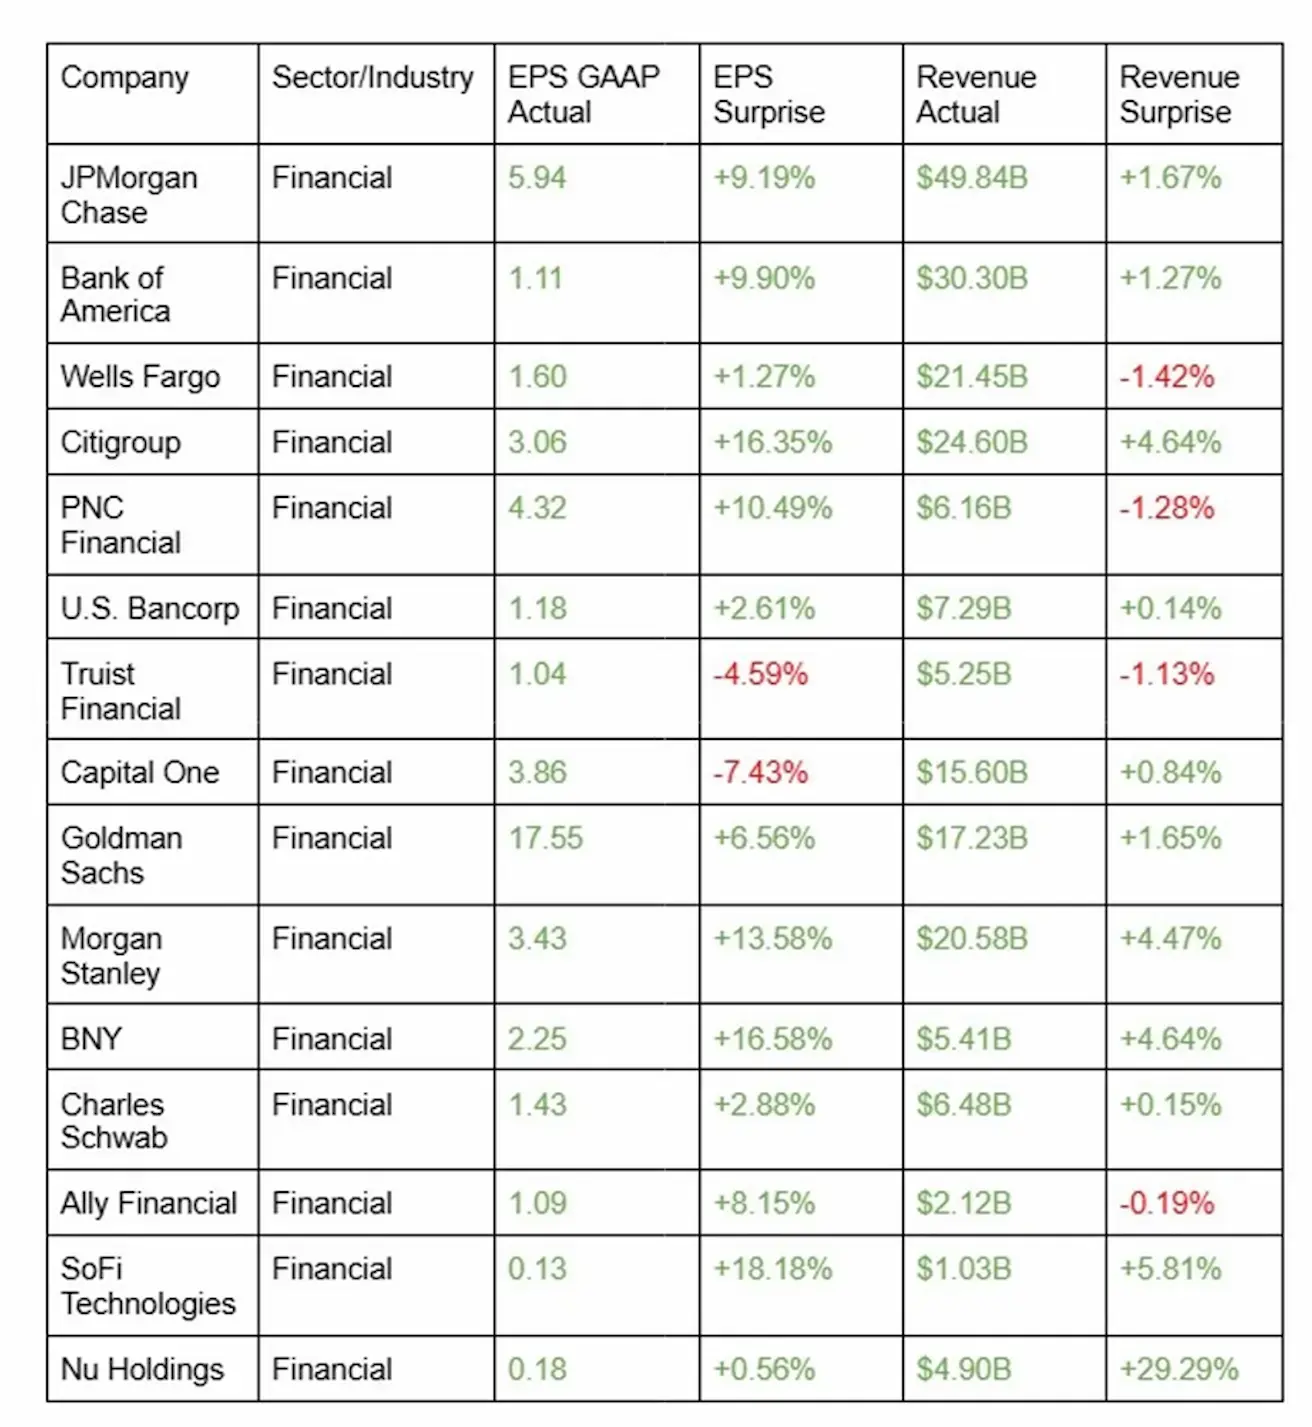
The banking sector has entered the earnings season on a strong footing; however, the quality of growth remains uneven. The primary driver of robust results has been trading revenues and capital markets activity, while traditional net interest businesses, in some cases, continue to face pressure.
At the same time, divergence within the sector is becoming evident: large universal banks and investment houses are performing better due to their diversified business models, whereas regional and consumer-focused banks are under pressure on margins, revenues, and operating metrics.
Key management takeaways, highlighting the link to private credit:
- JPMorgan / Jamie Dimon — explicitly acknowledged a deterioration in underwriting standards across the industry; JPM itself cited approximately $50 billion in exposure.
- Citi / Gonzalo Luchetti — stated that Citi “feels very comfortable”: it holds $22 billion in corporate private credit exposure, of which 98% is considered investment grade, 100% is securitized, with strong collateral protection; this $22 billion represents a small share of the bank’s total exposure to non-bank financial institutions.
- Goldman Sachs / David Solomon — argued that the negative noise around private credit is overstated, while emphasizing that the credit cycle remains intact and risk management must stay disciplined; Goldman Sachs relies on institutional funding structures (rather than private credit) and a broad investment origination funnel.
- Morgan Stanley / Ted Pick — noted that private credit is currently going through a “maturation phase” as a market; described the firm’s own exposure as low, well below $20 billion.
- Wells Fargo / Mike Santomassimo — indicated the bank is “fairly comfortable” with the risk in its private credit portfolio, which is largely composed of securitized lending to asset managers.
- Bank of America / Alastair Borthwick — reported no losses in its private credit portfolio to date, while noting that the bank continues to monitor the environment closely; at the same time, BofA appears intent on expanding its presence in the sector.
- Key takeaway: management consistently signals that risks are present, but not systemic at this stage.
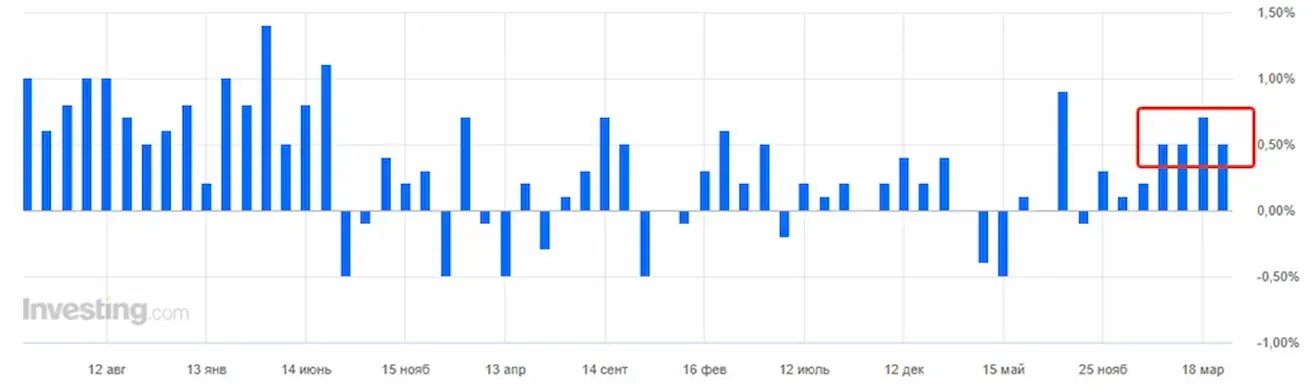
Share buybacks in U.S. equities (the volume of shares companies repurchase from the market):
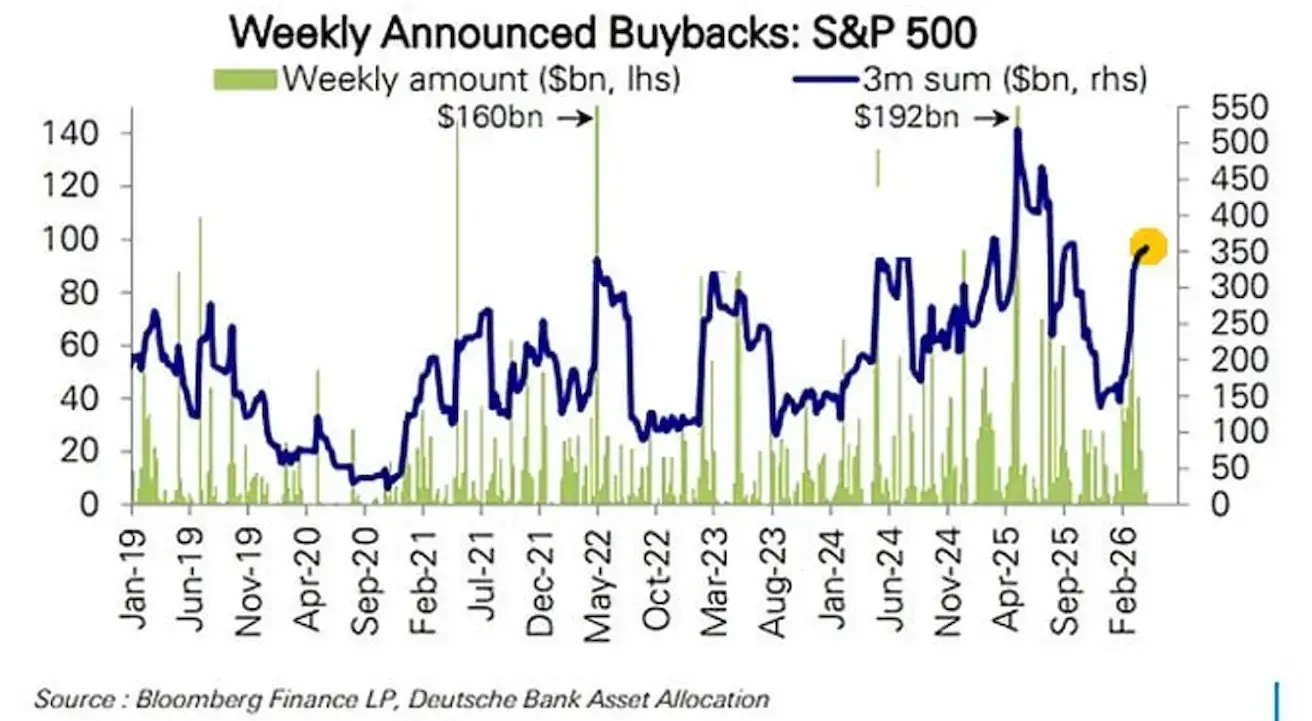
- Green bars represent weekly buybacks ($bn);
- The blue line shows the 3-month cumulative buyback volume. Since February, the 3-month total has returned to the $300–350 billion range. A sharp rebound is evident following the prior decline, with corporations actively returning to the market as buyers.
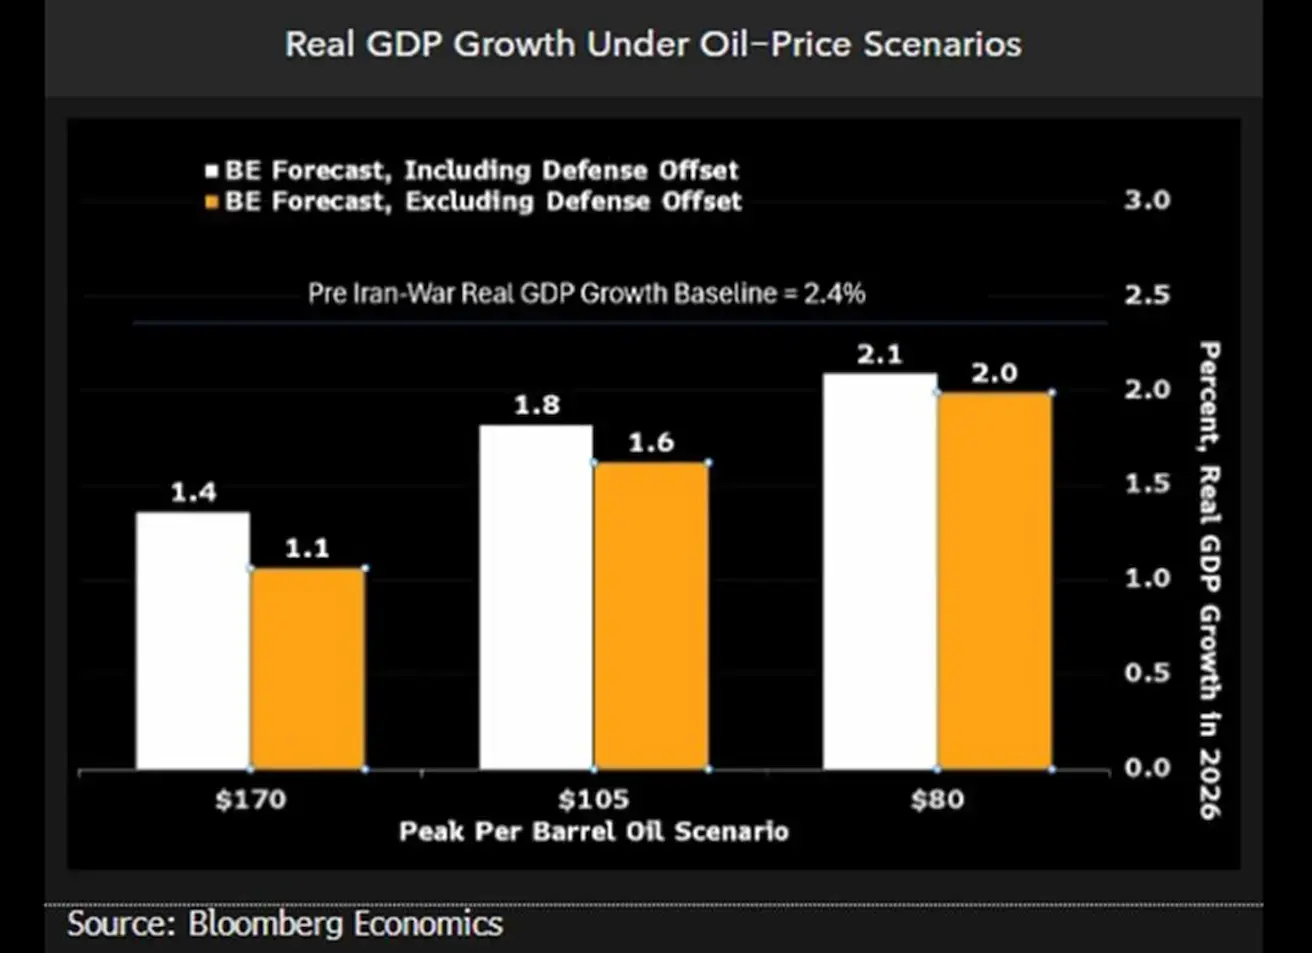
Impact of oil prices on U.S. GDP
According to Bloomberg Economics, under the 2026 baseline scenario ($80 per barrel), GDP growth is estimated at approximately 2.0–2.1%. If prices rise to $105, growth slows to around 1.6–1.8%, while in a stress scenario ($170), it declines further to 1.1–1.4%.
Across these scenarios, the risk of a deep recession or systemic crisis in the U.S. is not anticipated.
Eurozone
- Rates remain unchanged for now, but inflation risks are rising;
- Monetary policy is neutral, with the balance of risks tilted toward inflation;
- Amid the escalation of the conflict in the Middle East, the ECB has revised its GDP forecasts downward and raised its inflation projections for the coming years.
Interest rates:
- Deposit facility rate: 2.0% (prev. 2.0%);
- Marginal lending facility rate: 2.4% (prev. 2.4%) (the rate at which banks can borrow overnight from the central bank);
- Main refinancing rate: 2.15% (prev. 2.15%).
Inflation: Consumer Price Index (CPI) (March, preliminary data):
- Core CPI (YoY): 2.3% (previous: 2.4%).
- CPI: (м/м) 1,3% (пред: 0,6%); CPI (г/г) 2,6% (пред: 1,9%):
GDP (Q4, final): QoQ: 0.3% (prev. 0.3%); YoY: 1.3% (prev. 1.4%)
Unemployment rate (February): 6.2% (prev. 6.1%)
Industrial production (MoM) (February): 0.4% (prev. -0.8%)
Purchasing Managers’ Index (PMI) (March): remains in expansion territory, but is moderating.
- Services sector: 50.2 (prev. 51.9);
- Manufacturing sector: 51.6 (prev. 50.8);
- S&P Global Composite: 50.7 (prev. 51.9).
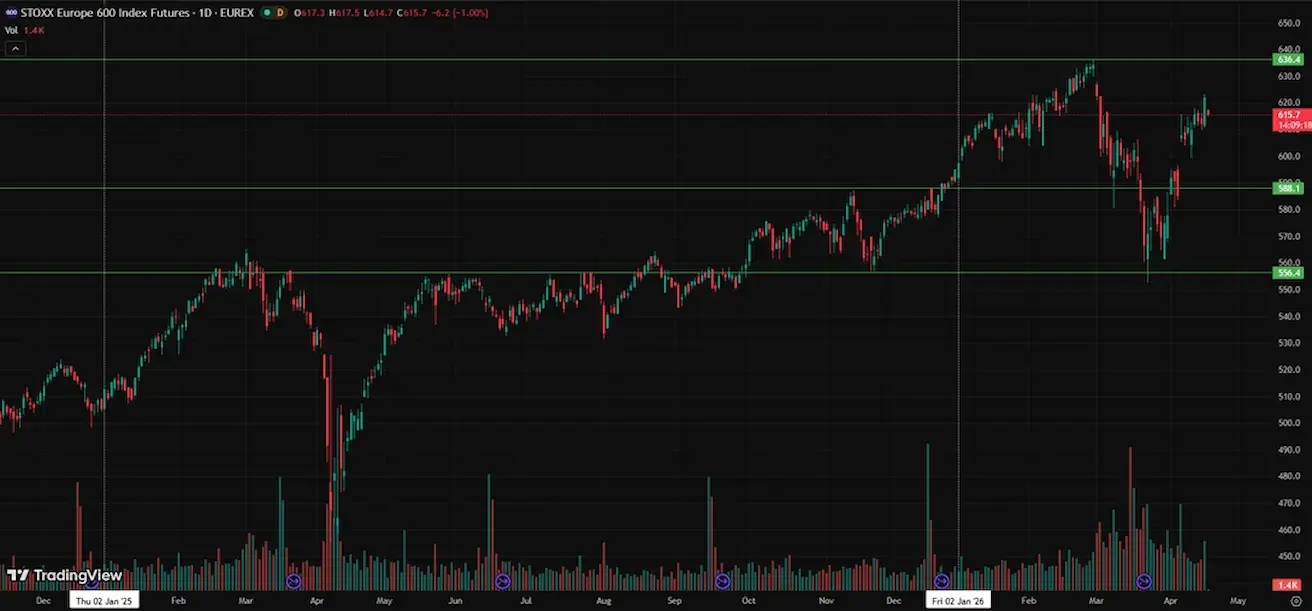
EURO STOXX 600 (FXXP1!)
Weekly performance: +1,85% (Week-end close: 621,9); Year-to-date: +4,7%.
China
The economy is stabilizing, supported by exports, while domestic demand and investment are recovering; policy stimulus remains targeted and cautious.
- Rates remain unchanged;
- Monetary policy remains accommodative;
- China has reaffirmed continued fiscal support for economic growth במסגרת its 2026 plan (stimulating domestic demand, optimizing tax incentives and subsidies, and upgrading industrial capacity).
Interest rates:
- 1Y Loan Prime Rate (medium-term lending): 3.00%;
- 5Y Loan Prime Rate (affecting mortgages): 3.50%.
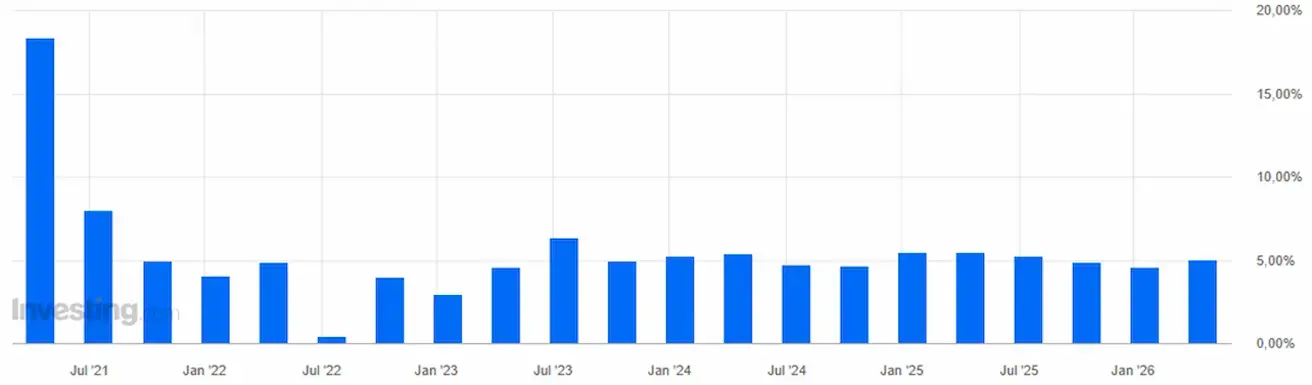
Inflation indicators (March):
- Consumer Price Index (CPI): MoM: -0.7% (prev. 1.0%); YoY: 1.0% (prev. 1.3%);
- Producer Price Index (PPI) (YoY): -0.5% (prev. -0.9%).
China’s GDP grew by 5.0% year-on-year, exceeding expectations of 4.8% and up from 4.5% in the previous quarter.
GDP (Q1 2026): QoQ: 1.3% (prev. 1.2%).
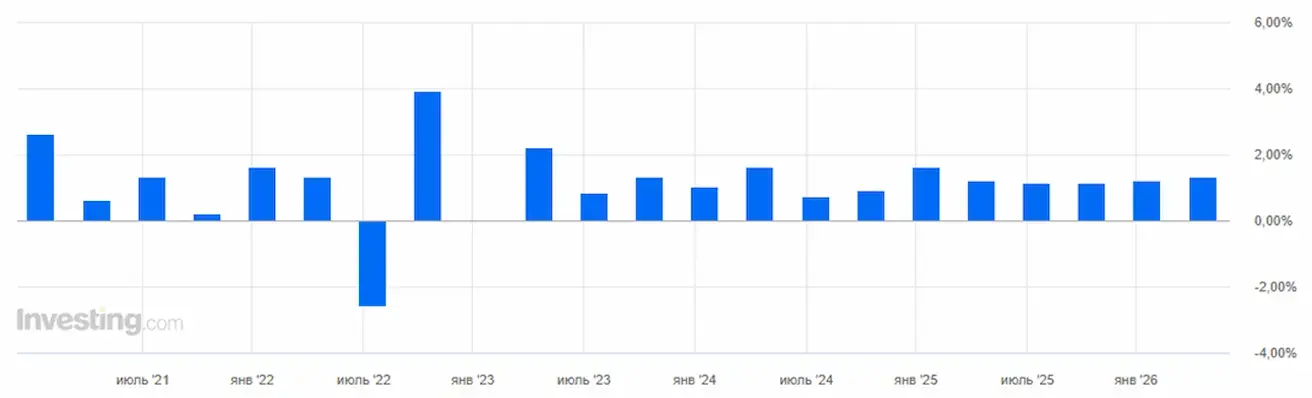
YoY: 5.0% (prev. 4.5%).
- Unemployment rate (March): 5.4% (prev. 5.3%)
- Industrial production (March, YoY): 6.1% (prev. 6.3%)
- Fixed asset investment (March, YoY): 1.7% (prev. 1.8%)
- Retail sales (March, YoY): 0.9% (prev. 1.3%)
- Imports (March, YoY): 27.8% (prev. 19.8%)
- Exports (March, YoY): 2.5% (prev. 21.8%)
The slowdown in export growth to 2.5% does not indicate a collapse; rather, it reflects normalization following strong growth in February. Import growth appears robust at 27.8%, though this is also partly attributable to a low base effect, as imports were weak last year.
China is actively increasing purchases of raw materials and components, which may indicate either preparation for higher production or inventory accumulation.
Overall, there are signs of a recovery. This is a positive signal, suggesting that the domestic economy is beginning to expand.
Trade balance (March): $51.13 billion (prev. $213.62 billion)
Purchasing Managers’ Index (PMI) (February):
- Manufacturing: 50.1 (prev. 49.5);
- Non-manufacturing: 50.4 (prev. 49.0);
- Composite: 50.5 (prev. 49.5).
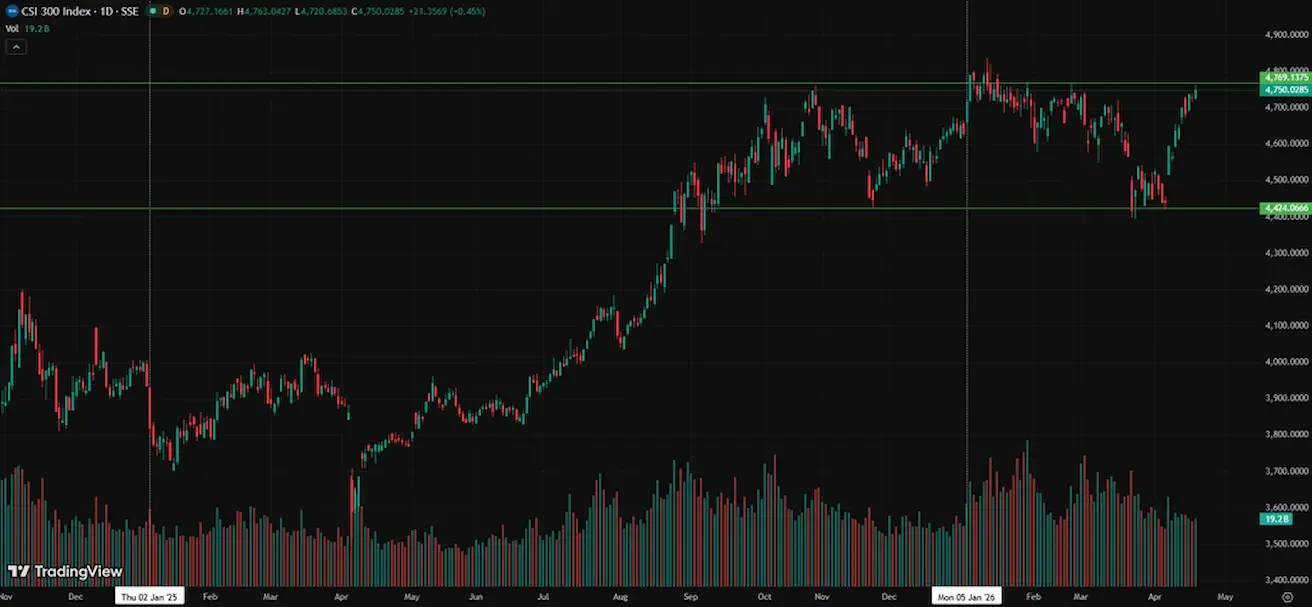
CSI 300 INDEX (000300.HK)
Weekly performance: +1,99% (week-end close at 4728,67); Year-to-date: +1,44%.
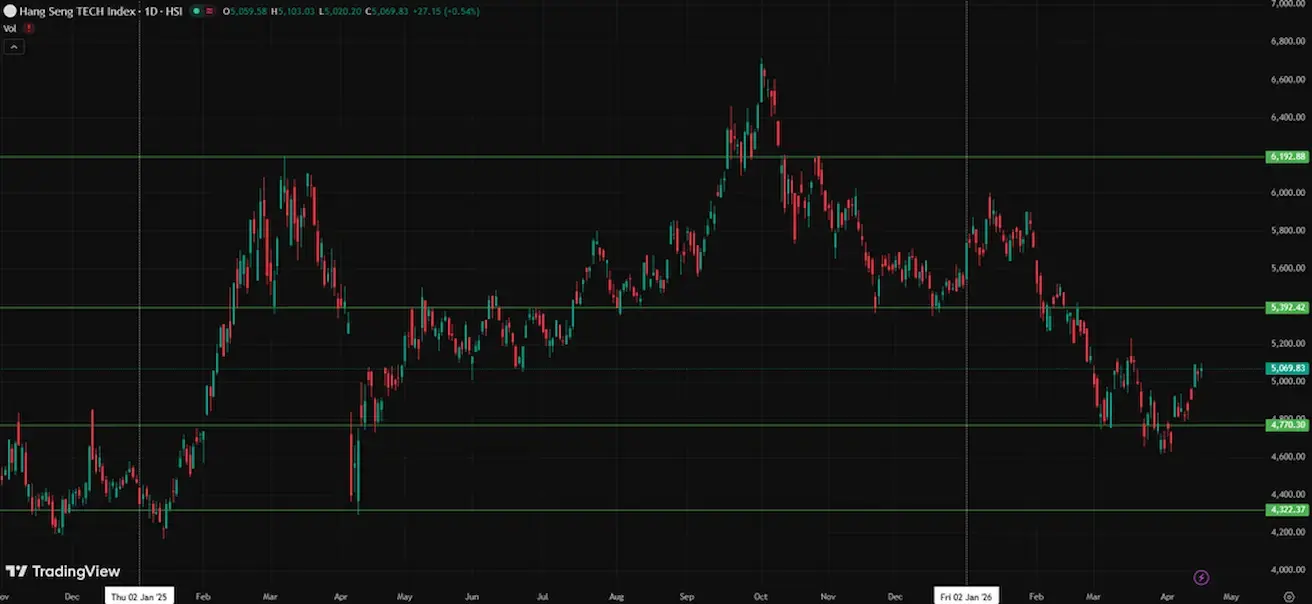
Hang Seng TECH Index (HSTECH)
Weekly performance: +3,52% (week-end close: 5042,68); year-to-date: -8,39%.
Key drivers of markets in Q1 2026:
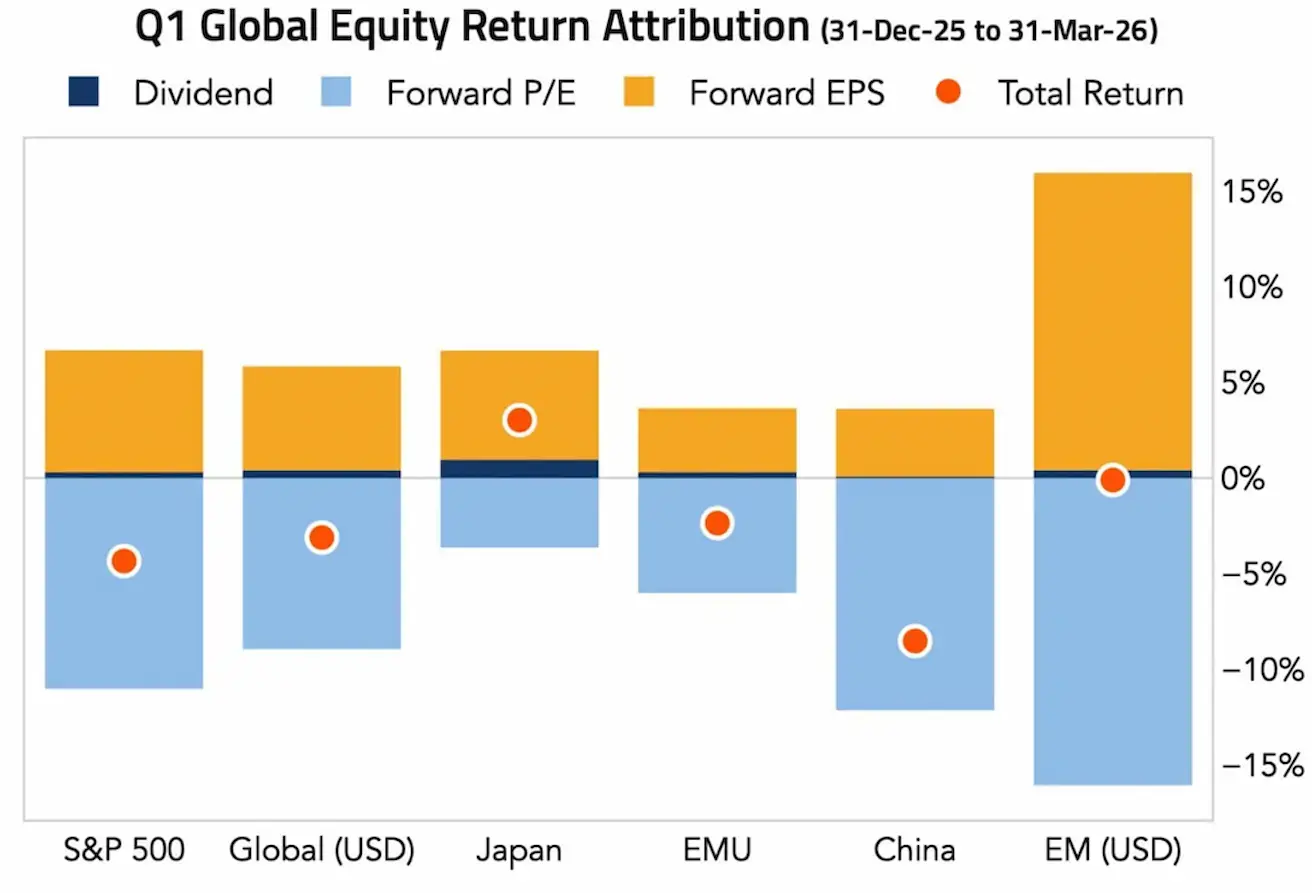
- Yellow: Forward EPS — earnings growth;
- Blue: Forward P/E — changes in valuation multiples;
- Dark blue: Dividends;
- Red dot: total return.
Across nearly all regions, earnings growth (EPS) remained positive — the corporate sector continues to demonstrate resilience. However, valuation multiples declined, particularly in the S&P 500, China, and emerging markets, reflecting the impact of elevated interest rates and tighter liquidity conditions.
Japan stands out as an exception, with positive returns and lower valuation pressure.
Key takeaway: Equity markets are no longer supported by cheap liquidity, as in the pre-COVID period, but rather by corporate earnings.
The red dots indicate negative total returns. Equity indices closed the quarter with a sharp decline amid heightened geopolitical escalation. However, the earnings season confirms that the downturn was not driven by deterioration in the real economy. In early April, as tensions in the Middle East eased, markets staged a strong rebound.
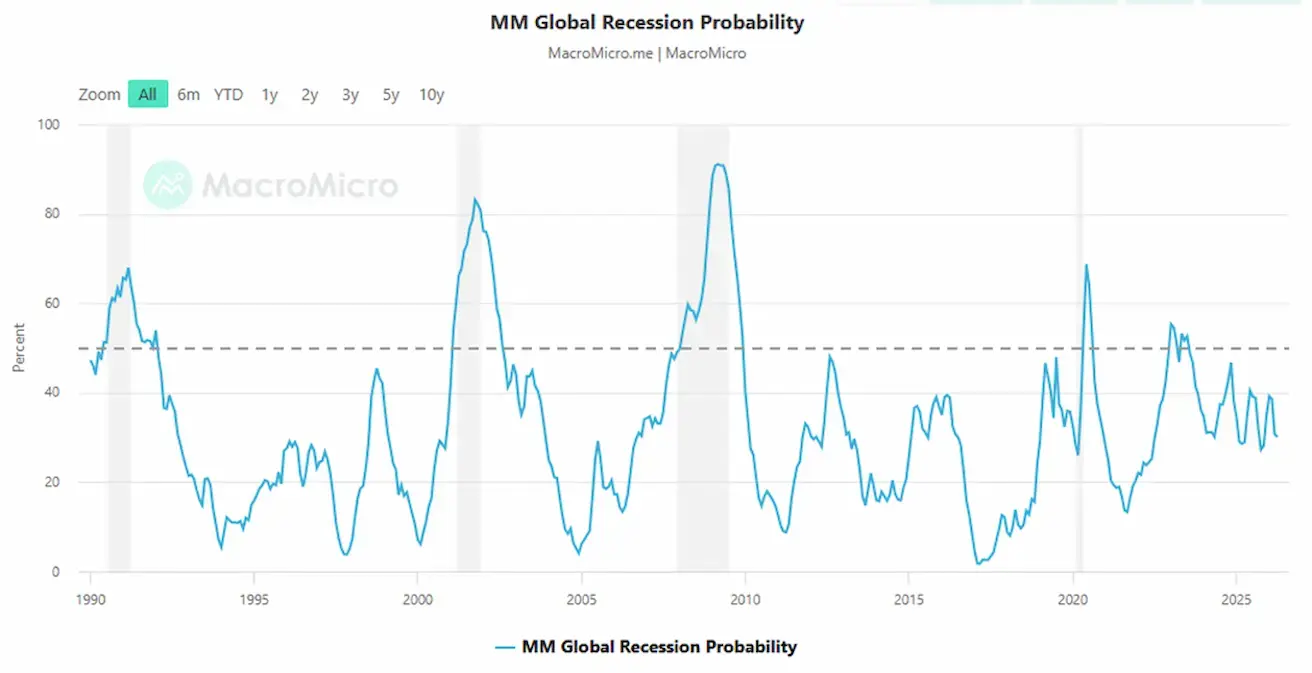
The dashed line at 50% marks the elevated risk zone, while the shaded areas indicate recession periods. Current level: 30.2 — below the critical threshold, but above the “normal, calm range” (~10–20%).
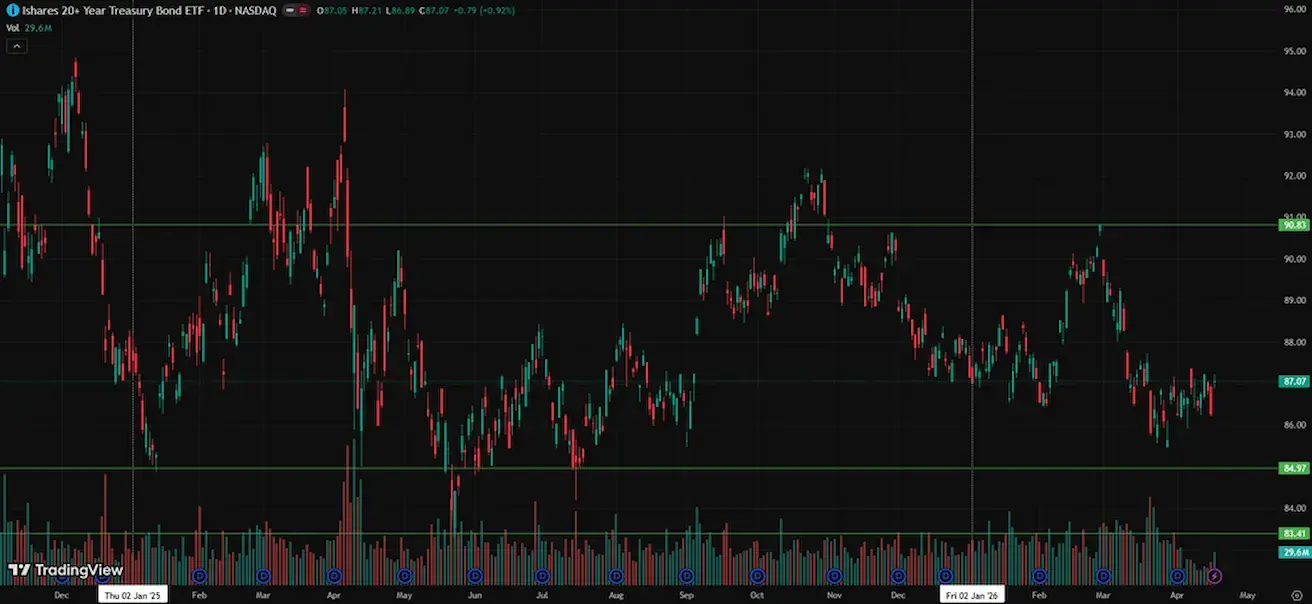
BOND MARKET
U.S. bond market: modest decline in yields by the end of the week. U.S. Treasuries 20+ (ETF TLT): weekly performance: +0.67% (week close: 87.07); year-to-date: -0.10%.
YIELDS AND SPREADS
Market Yield on U.S. Treasury Securities at 10-Year Constant Maturity: 4.27% (prev. 4.35%)
2-year Treasury yield: 3.73% (prev. 3.84%)
ICE BofA BBB US Corporate Index Effective Yield: 5.21% (prev. 5.24%)
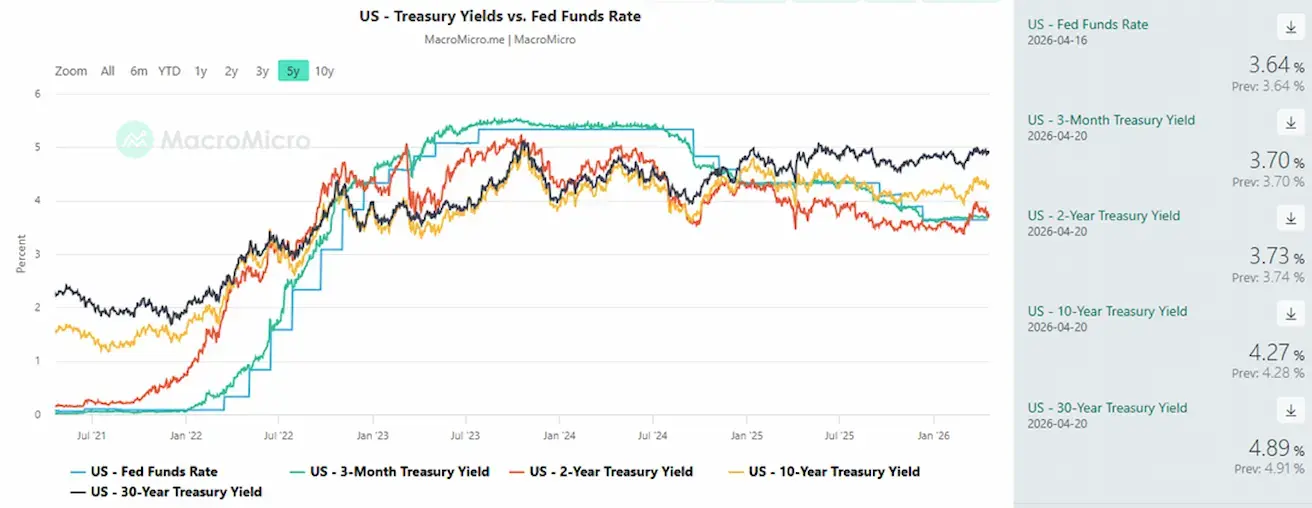
- The yield spread between 10-year and 2-year U.S. Treasuries stands at 54 basis points (prev. 51);
- The yield spread between 10-year and 3-month U.S. Treasuries stands at 57 basis points (prev. 65). U.S. 5-year credit default swap (CDS) spread (default insurance): 35.07 bps (vs 35.53 bps last week).
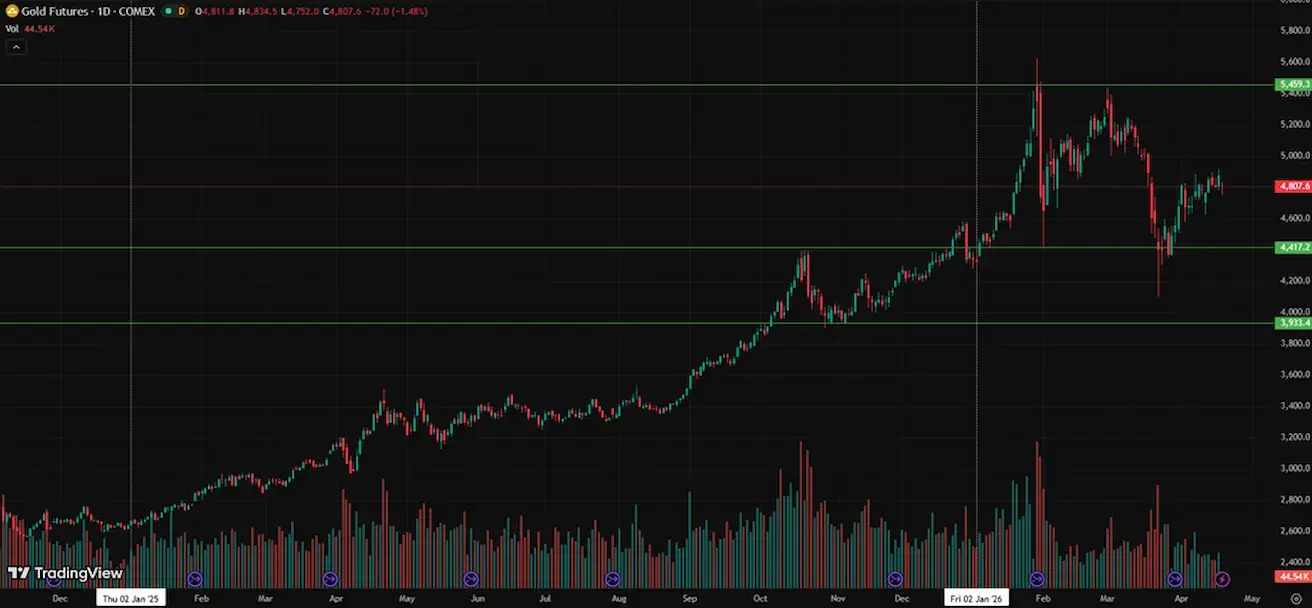
GOLD FUTURES (GC)
Weekly performance: +1,93% (week close: $4879,6 per troy ounce); Year-to-date: +12,63%. Central banks continue to increase their gold reserves.
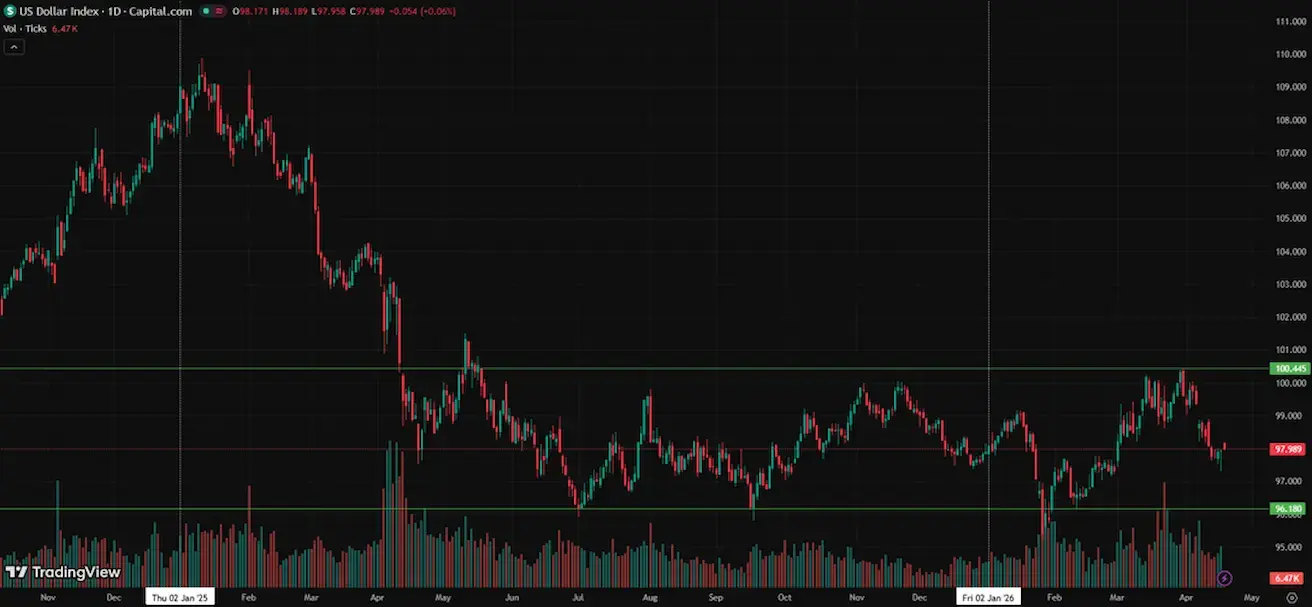
DOLLAR INDEX FUTURES (DX)
Weekly performance:-0,77% (week-end close: 97,935). Year-to-date performance: -0,06%.
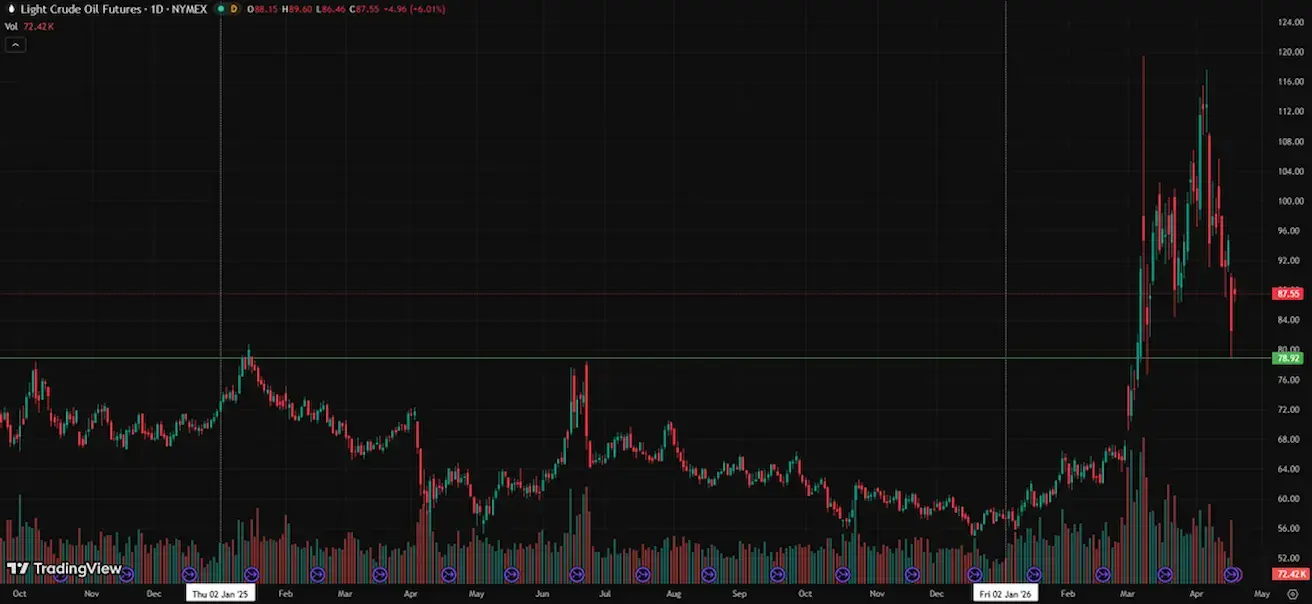
OIL FUTURES
During the two-week ceasefire, oil briefly declined to $78, but today futures opened with an upward gap amid a deterioration in the negotiation process.
Weekly performance: -14,48% (week-end close: $82,59 per barrel). Year-to-date performance: +43,86%
- IEA member countries have begun drawing on reserves.
- OPEC+ will increase production by 206,000 barrels per day in May.
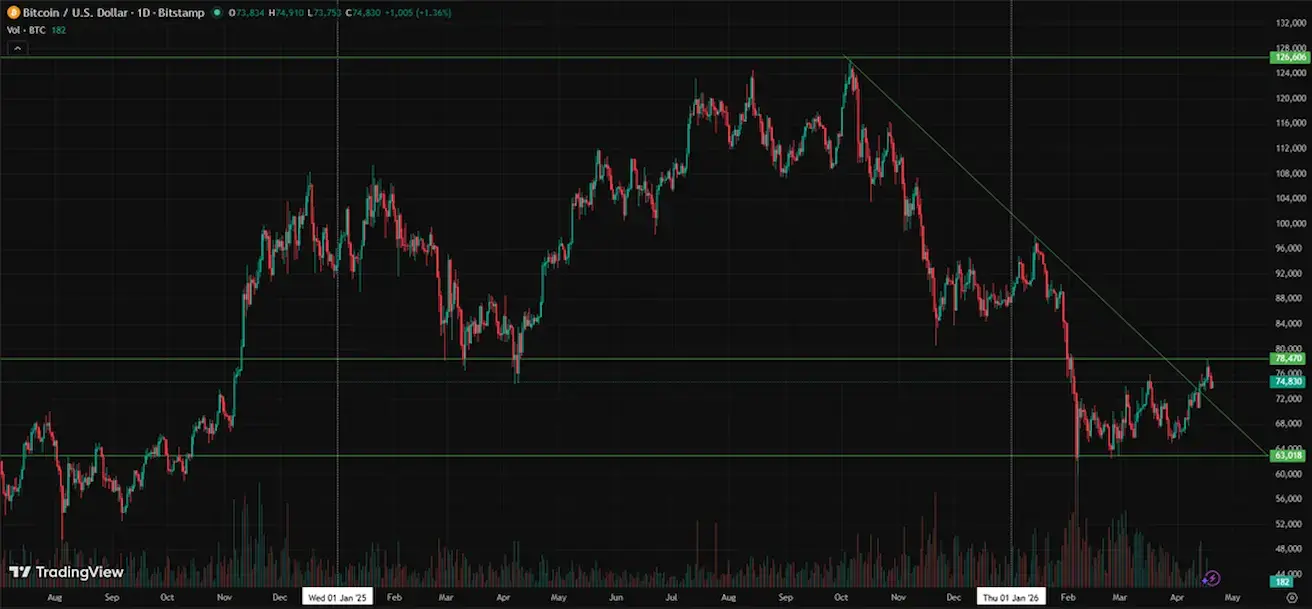
BTC FUTURES
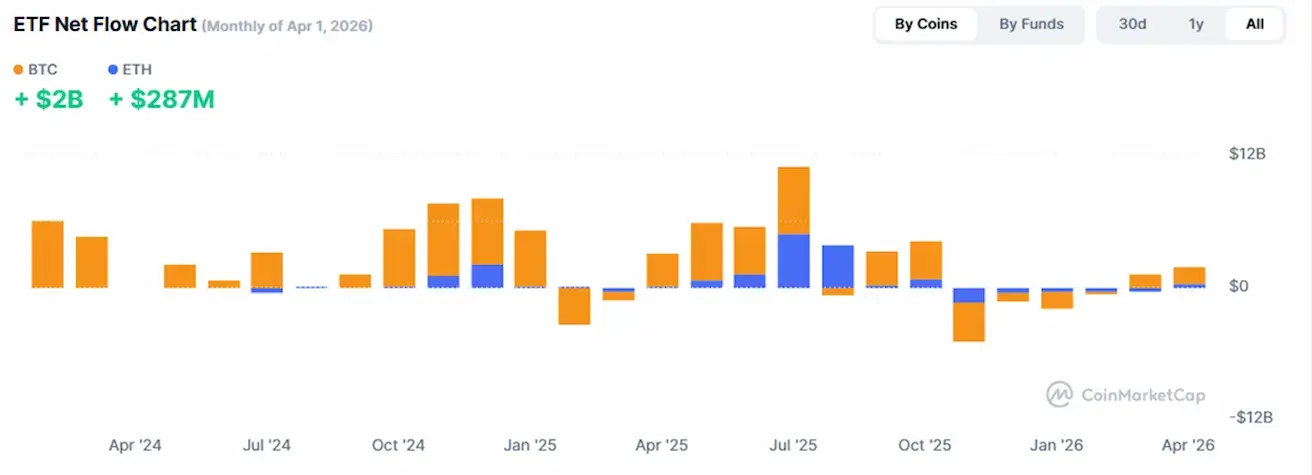
Weekly performance +4,35% (week-end close: $73825); year-to-date: -15,84%.
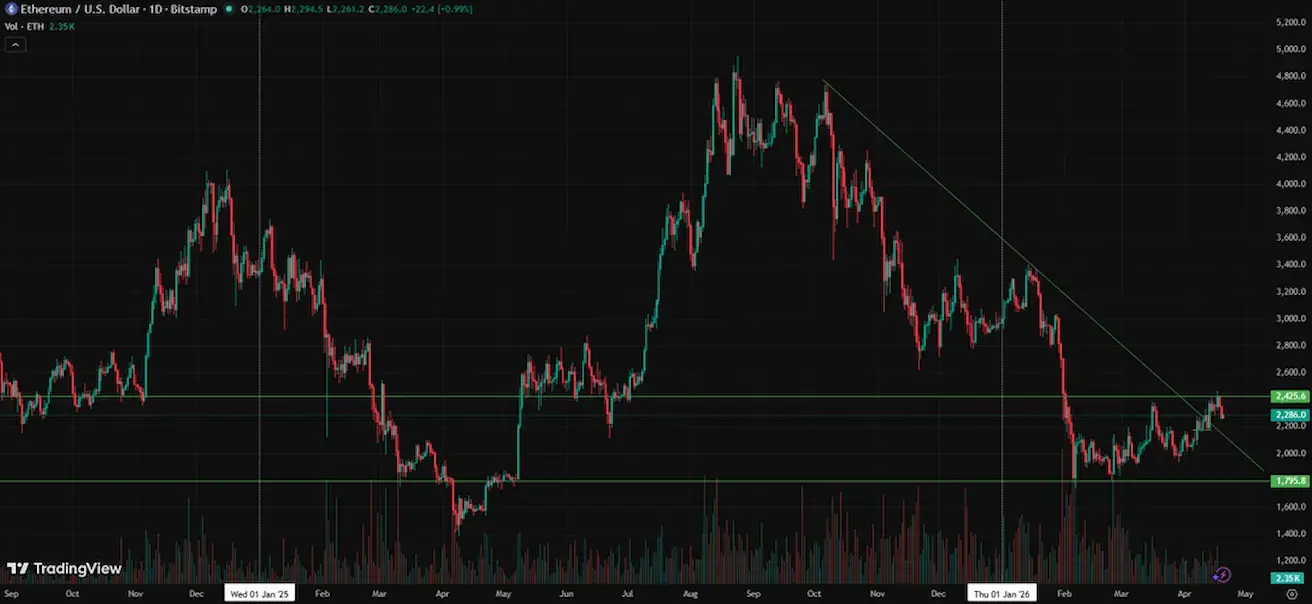
ETH FUTURES
Weekly performance +2,96% (week-end close: $2263,6); year-to-date: -22,88%.
Largest holders of BTC:
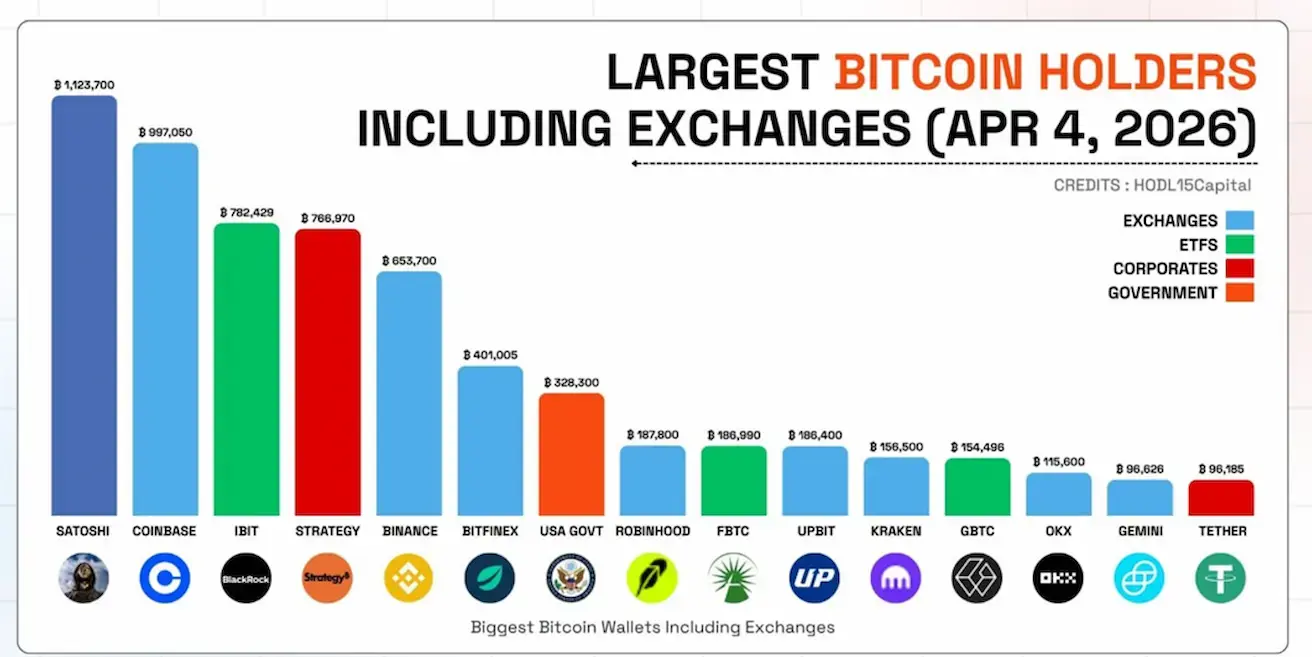
- Blue — Exchanges (Coinbase, Binance, etc.);
- Green — ETFs (IBIT, GBTC, FBTC);
- Red — Corporations (Strategy, Tether);
- Orange — Governments (U.S.).
The U.S. government has already moved into 7th place. ETFs are becoming dominant players, with ETF inflows driving the bulk of demand. Exchanges primarily provide custody and liquidity, rather than setting market direction.
Key takeaway: BTC continues its institutionalization.
The first bar represents Satoshi Nakamoto (~1.12 million BTC, estimated). These are wallets associated with early network mining (2009–2010). These coins have never moved and are considered lost or inactive supply — effectively, not active holders or market participants.
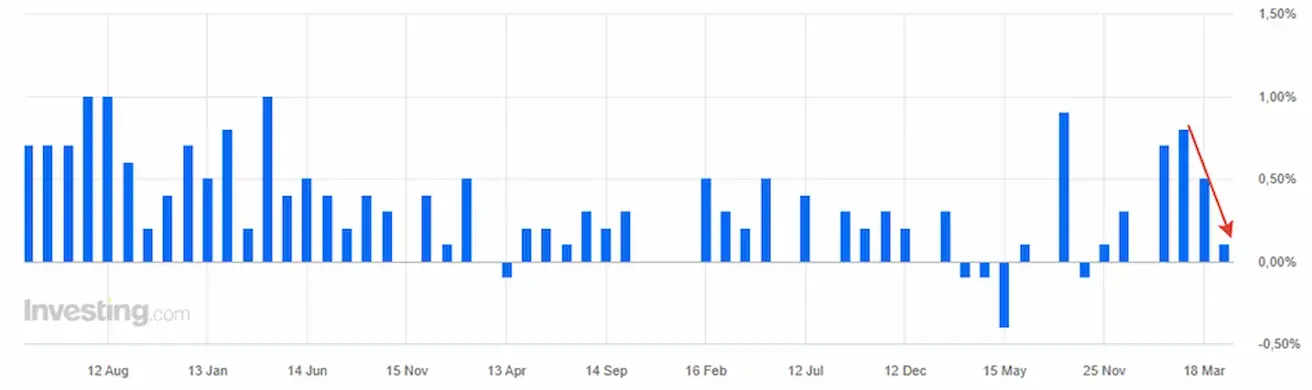
Institutional demand:
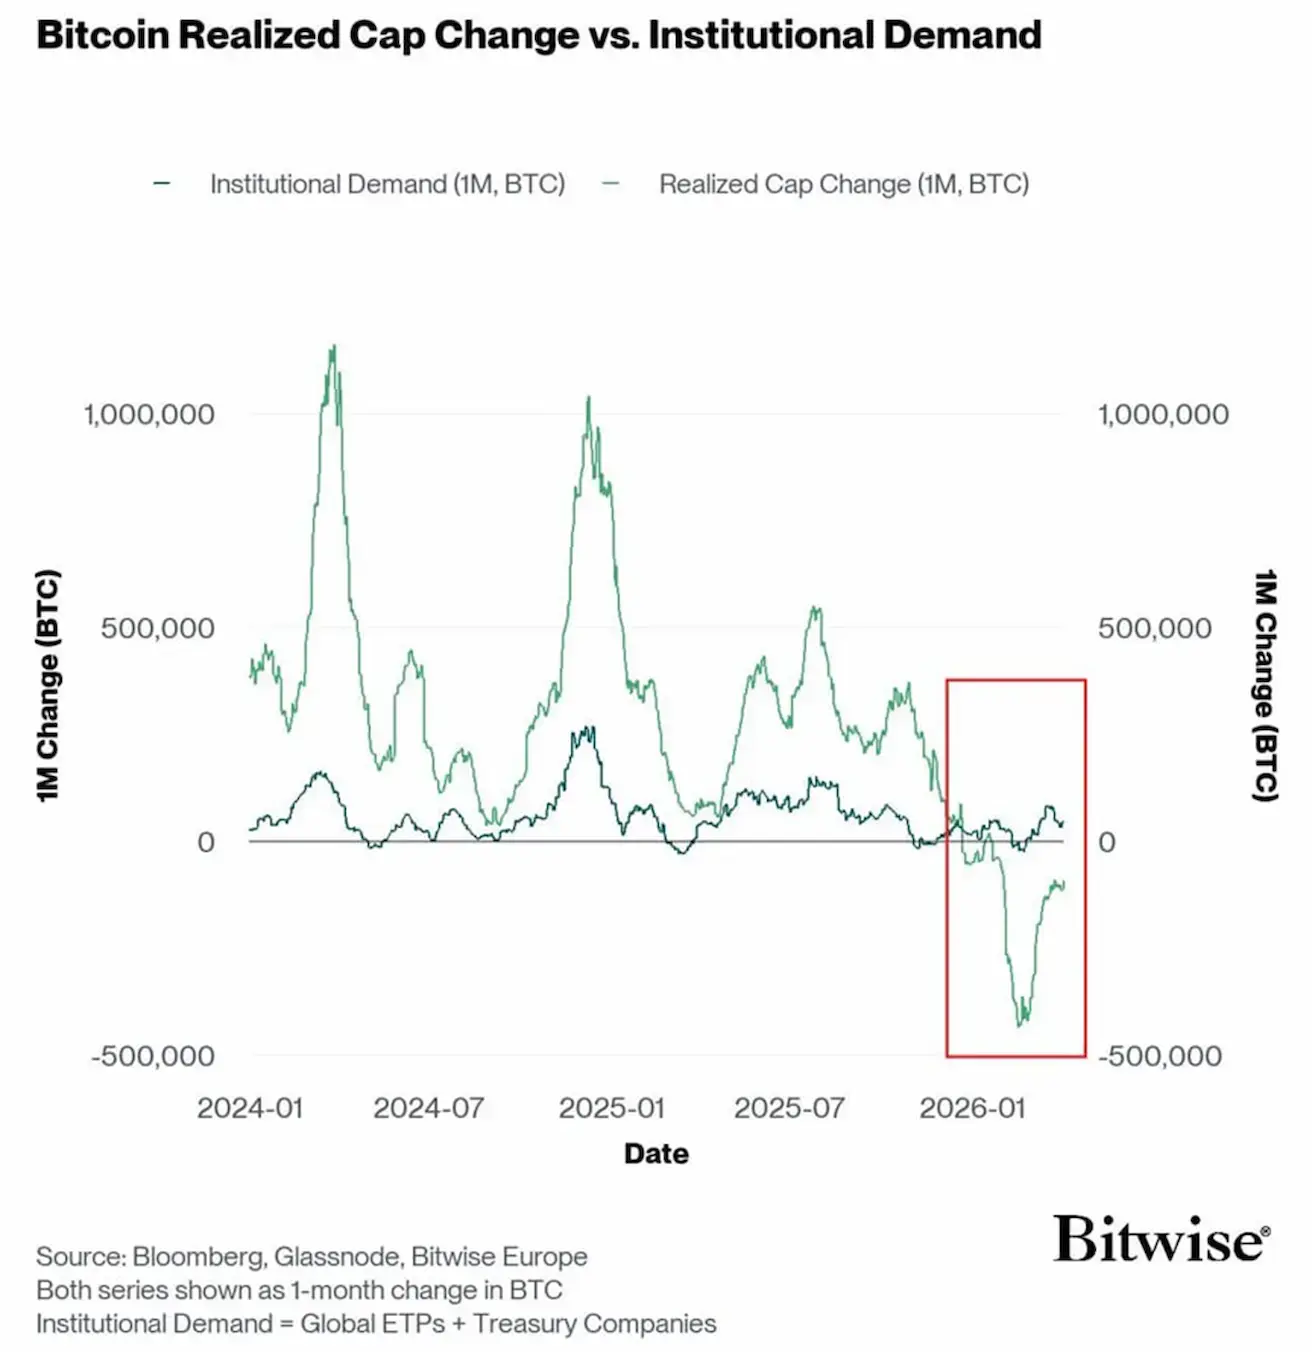
- Green — capital inflows/outflows into BTC (real money);
- Blue — Institutional Demand (ETF + corporate demand). The highlighted area shows that during the Bitcoin sell-off, institutional demand remained above zero and slightly positive. This indicates that it was primarily retail and speculative capital exiting the market, while institutional investors held their positions and continued to accumulate gradually.
TOTAL CRYPTOCURRENCY MARKET CAPITALIZATION
Total crypto market capitalization: $2,53 trillion (vs $2,42 trillion a week earlier) (coinmarketcap.com).
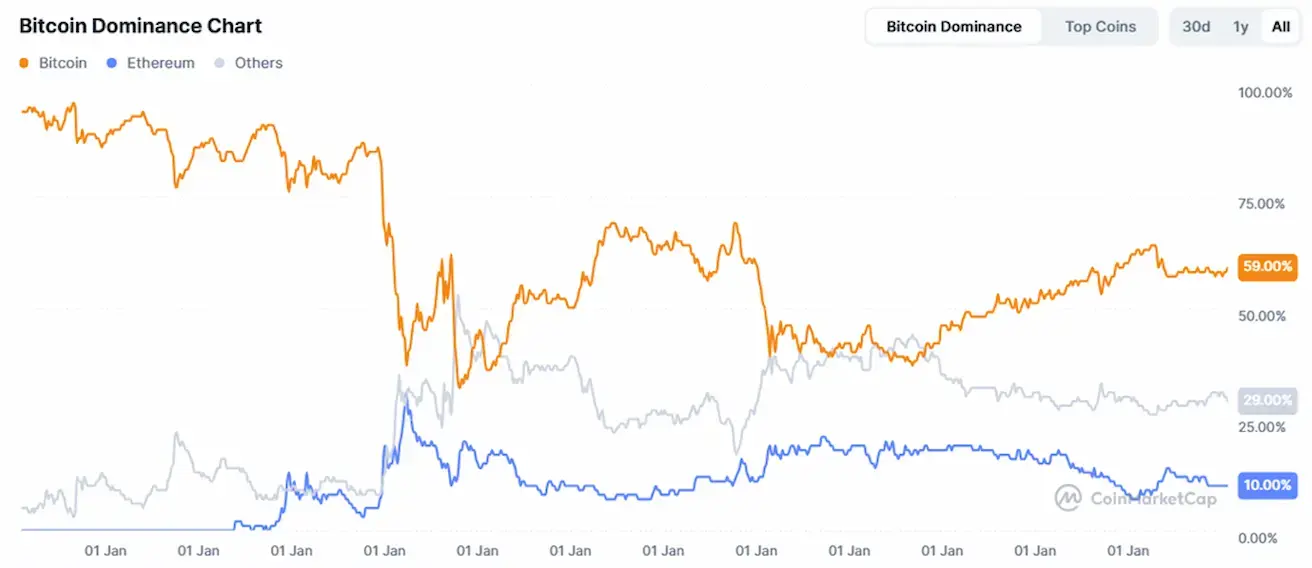
Crypto asset market shares:
- Bitcoin: 59.4% (58.8%)
- Ethereum: 11.0% (11.0%)
- Others: 29.6% (30.3%).
ETF Net Flows Chart: