Русский
 Қазақша
 Eesti
EestiAugust 31 – September 6, 2026: Weekly economic update
Key market updates

Key Takeaways:
- The policy rate remains unchanged, while the Fed’s rhetoric remains cautious;
- Monetary policy remains moderately restrictive;
- U.S. macroeconomic data continue to support a soft-landing scenario: inflation risks are increasing, the labor market is cooling without signs of recession, and current conditions do not yet warrant a rate cut.
Commentary
Takeaways from the remarks of Federal Reserve Vice Chair for Supervision Michael S. Barr (Sept 1, 2026):
- The US economy remains resilient. Barr noted a stable labor market and low unemployment, solid economic growth and steady consumption. He separately highlighted strong investment in AI infrastructure and high productivity;
- Inflation remains the main risk. According to him, progress has stalled following the sharp disinflation of 2022-2024, while tariffs, the conflict in the Middle East and the rapid rollout of AI infrastructure have again intensified price pressures. He specifically pointed to persistently high inflation in core services excluding housing;
- Barr effectively left the door open to a rate hike as early as the September meeting. If the data confirm a sustained move of inflation toward 2%, the Fed can afford to wait. If the September slowdown in inflation proves insufficient, Barr believes the Fed should raise rates decisively.
Takeaways from the remarks of Christopher Waller, President of the Federal Reserve Bank of St. Louis (Sept 3, 2026):
- Waller is noticeably more dovish than Warsh and Barr on the September decision. Despite inflation above target, he sees early signs of renewed disinflation and currently leans toward keeping the rate unchanged. He would support a hike only if August inflation shows that the improvement was temporary;
- The economy and labor market allow the Fed to avoid rushing. Waller characterizes economic growth as resilient and the labor market as stable and close to maximum employment. Consumption remains strong, and investment in data centers, AI, and technology infrastructure continues to grow rapidly.
Takeaway from the Fed’s Beige Book release: the economy shows no signs of recession, the labor market is gradually cooling, but price pressures remain fairly broad-based. In other words, the report supports the Fed’s cautiously hawkish stance and does not create arguments for a rate cut.
Inflation: Consumer Price Index (July)
- Core CPI (MoM): 0.2% (previous: 0.0%).
- Core CPI (YoY): 2.5% (previous: 2.6%).
- CPI (MoM): 0.1% (previous: -0.4%).
- CPI (YoY): 3.4% (previous: 3.5%).
Producer Price Index (July)
- PPI (MoM): 0.0% (previous: -0.3%).
- Core PPI (MoM): 0.2% (previous: 0.2%).
Inflation Expectations (Michigan) (August)
- 12-month Inflation Expectations: 4.30% (previous: 4.2%).
- 5-Year Inflation Expectations: 3.3% (previous: 3.3%).
GDP (U.S. Bureau of Economic Analysis, BEA) — Q2 2026 annualized growth rate, preliminary: +1.5% (Q1 2026: +2.1%); forecast: 1.5%.
GDPNow (the Atlanta Fed’s real-time estimate of official GDP growth ahead of release (Q3 2026)): 4.7% (previous: 4.6%).
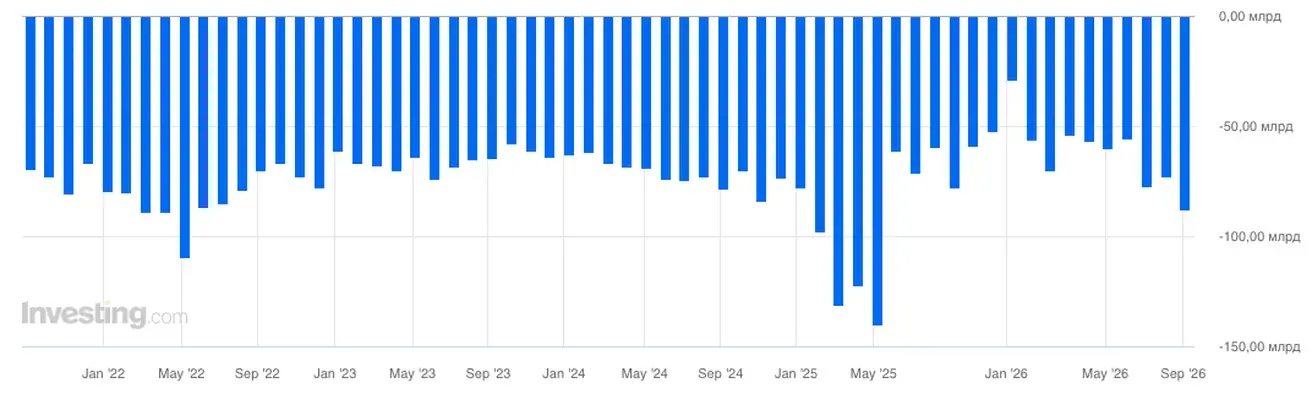
Trade balance (July): -88 bn (-71.20 bn):
Labor Market (BLS) (July/August)
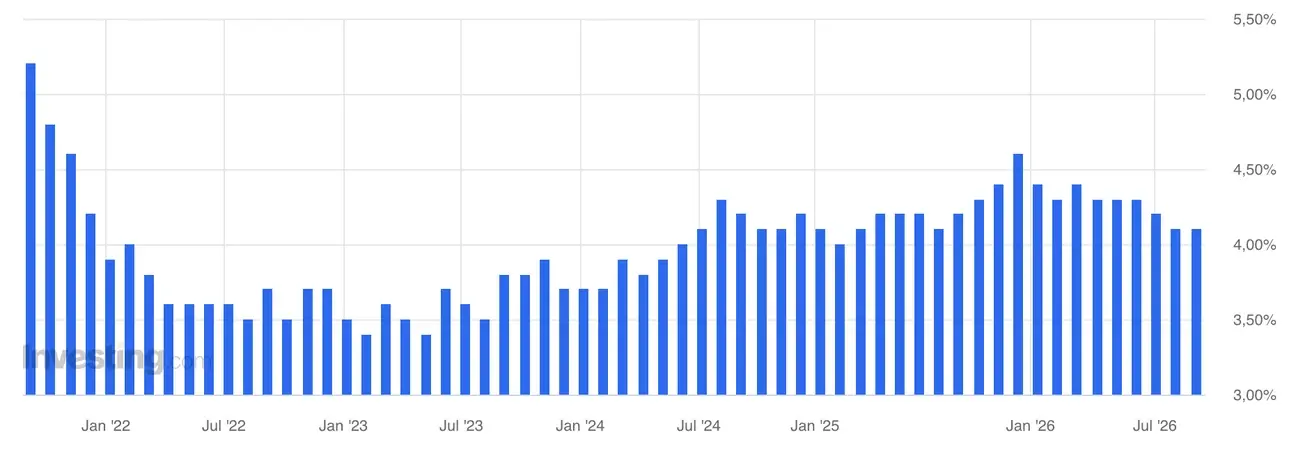
- Unemployment rate: 4.1% (prev: 4.1%):
- Total number of people receiving unemployment benefits in the US: 1,779K (prev: 1,778K);
- Initial jobless claims: 206K (prev: 203K);
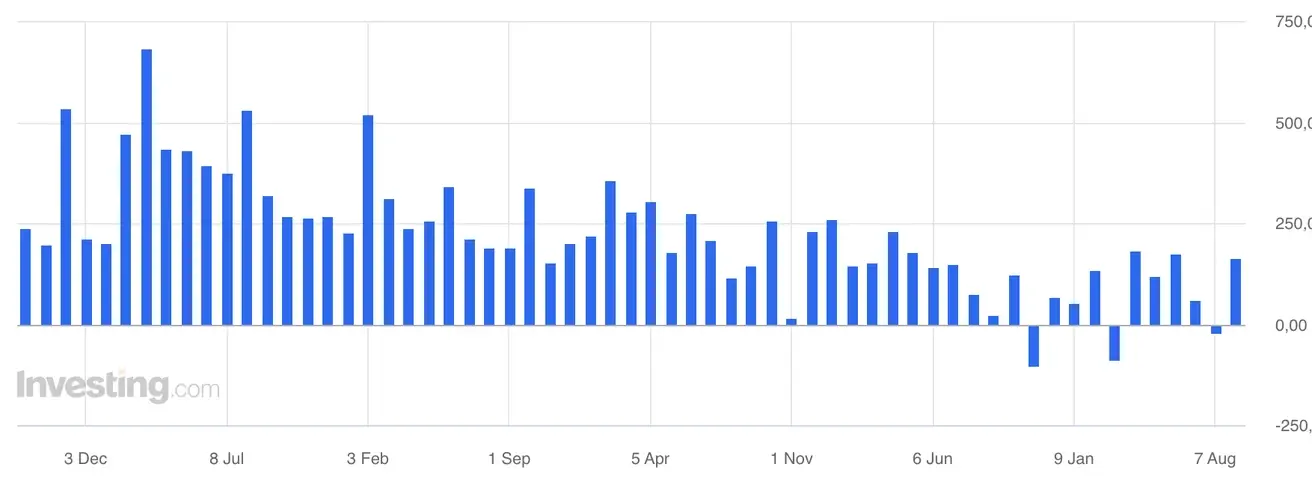
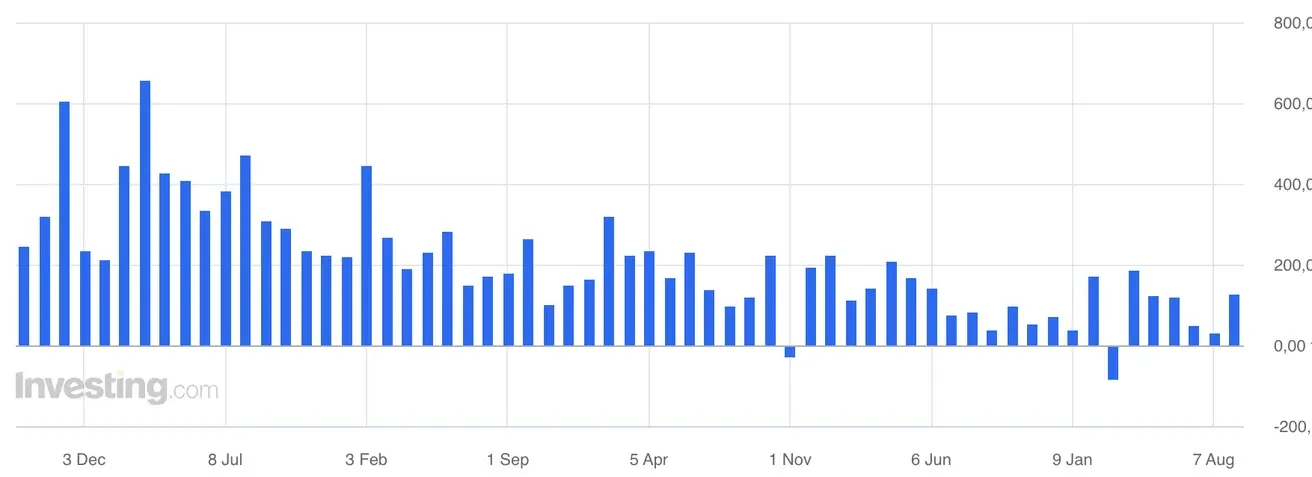
- Change in nonfarm payrolls: 162K (prev: 23K):
- Change in employment in the private nonfarm sector: 127K (prev: -30K):
- Average hourly earnings (y/y): 3.1% (prev: 3.2%);
- JOLTS job openings: 7.271M (prev: 6.866M).
Business Activity Index (PMI) (July)
Above 50 indicates expansion; below 50 indicates contraction.
- Services PMI: 56.5 (previous: 56.8).
- Manufacturing PMI: 53.9 (previous: 53.2).
- Composite PMI: 56.0 (previous: 56.0).
Monetary Policy
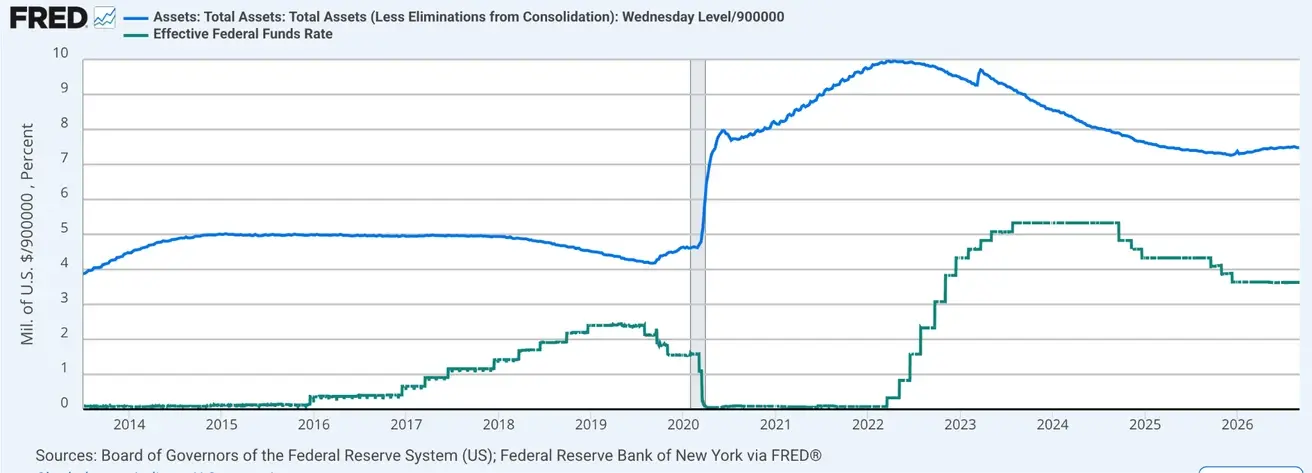
Effective Federal Funds Rate (EFFR): 3.50%–3.75%.
Federal Reserve Balance Sheet: $6.737 trillion, +3.09% since the suspension of quantitative tightening (QT), when the balance sheet stood at $6.535 trillion.
Market Forecast for Rate (Fedwatch)
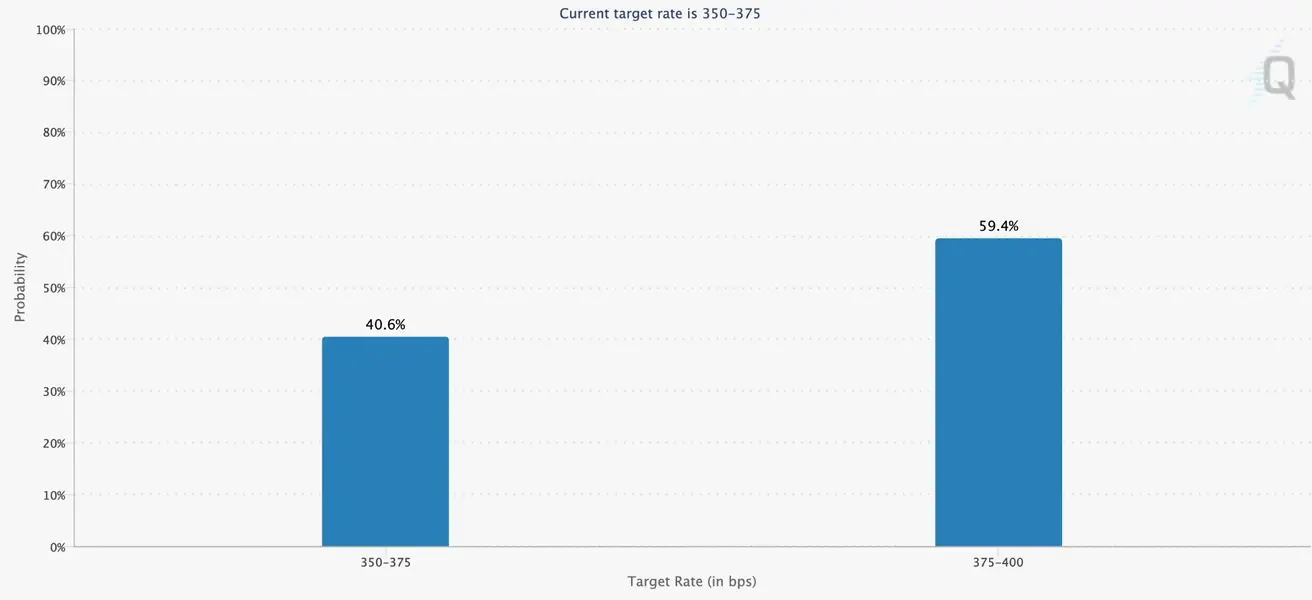
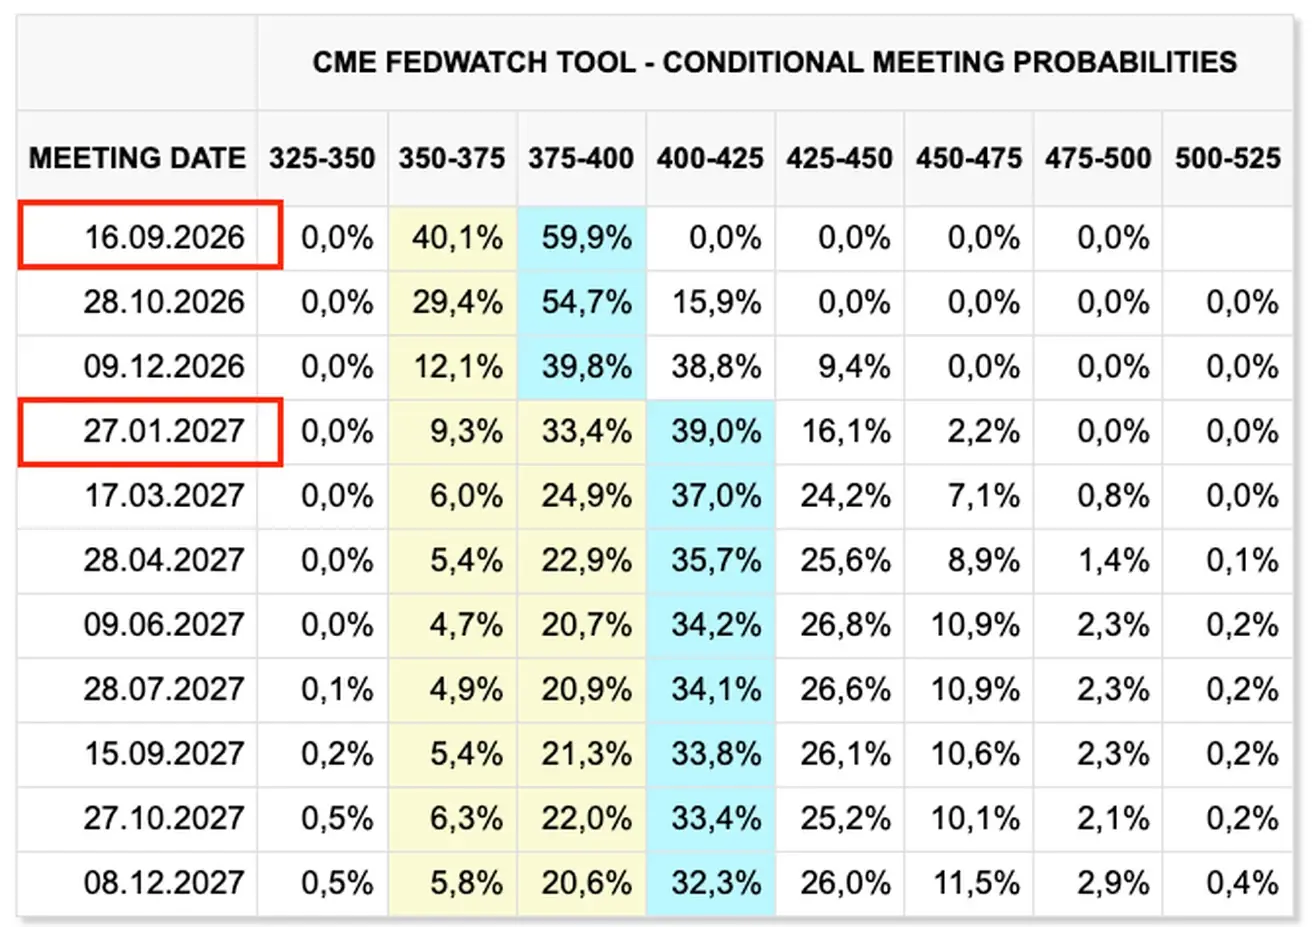
For the next FOMC meeting (September 16) — the implied market probability of a 0.25% rate hike is 59.4% (week ago: 59.8%):
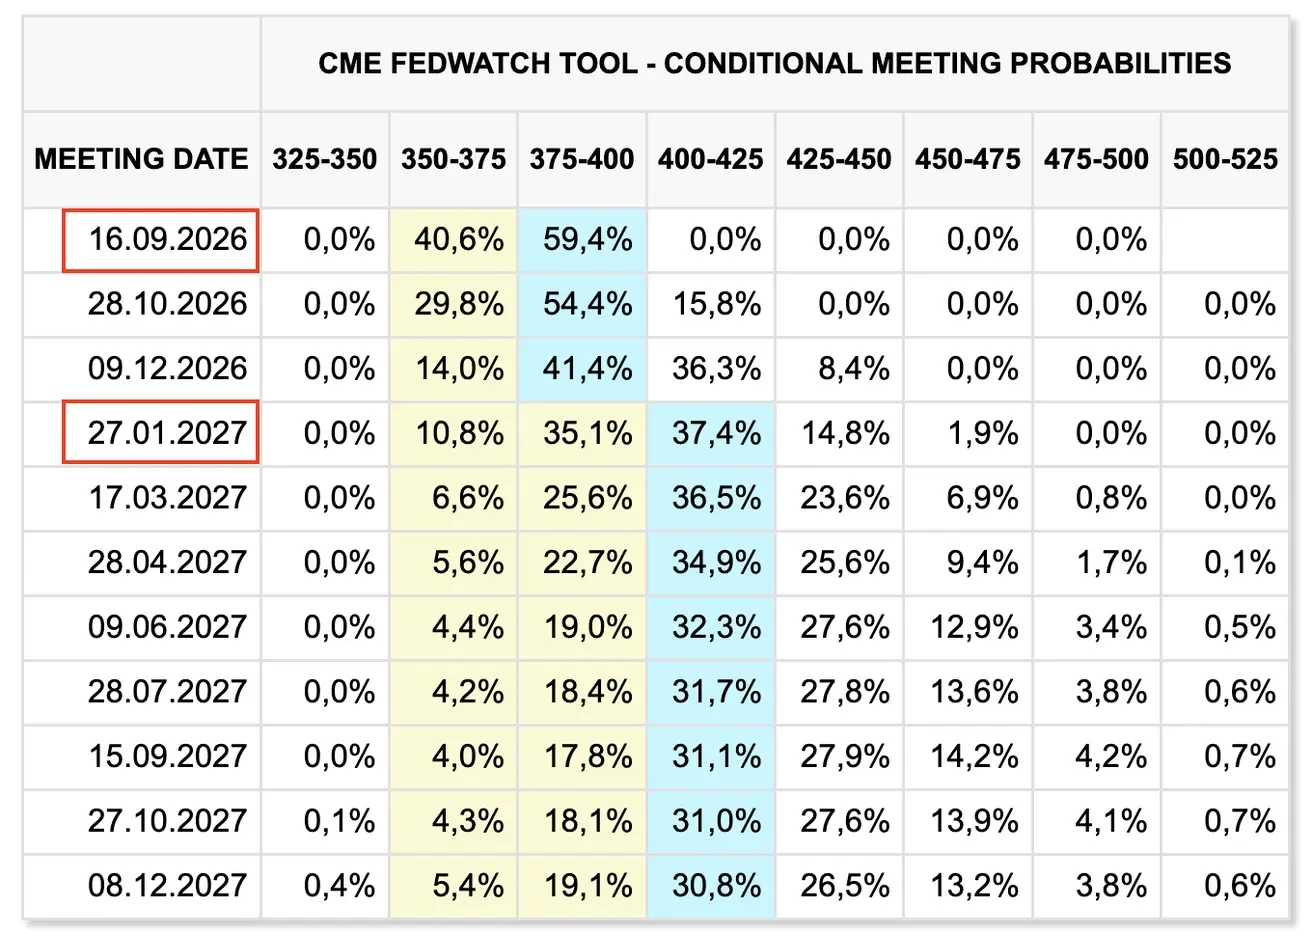
Over the next 12 months, the market now expects two 25-basis-point rate hikes, bringing the target range to 4.00%–4.25% by September of this year and January 2027.
Today:
A week earlier:
Bond Market
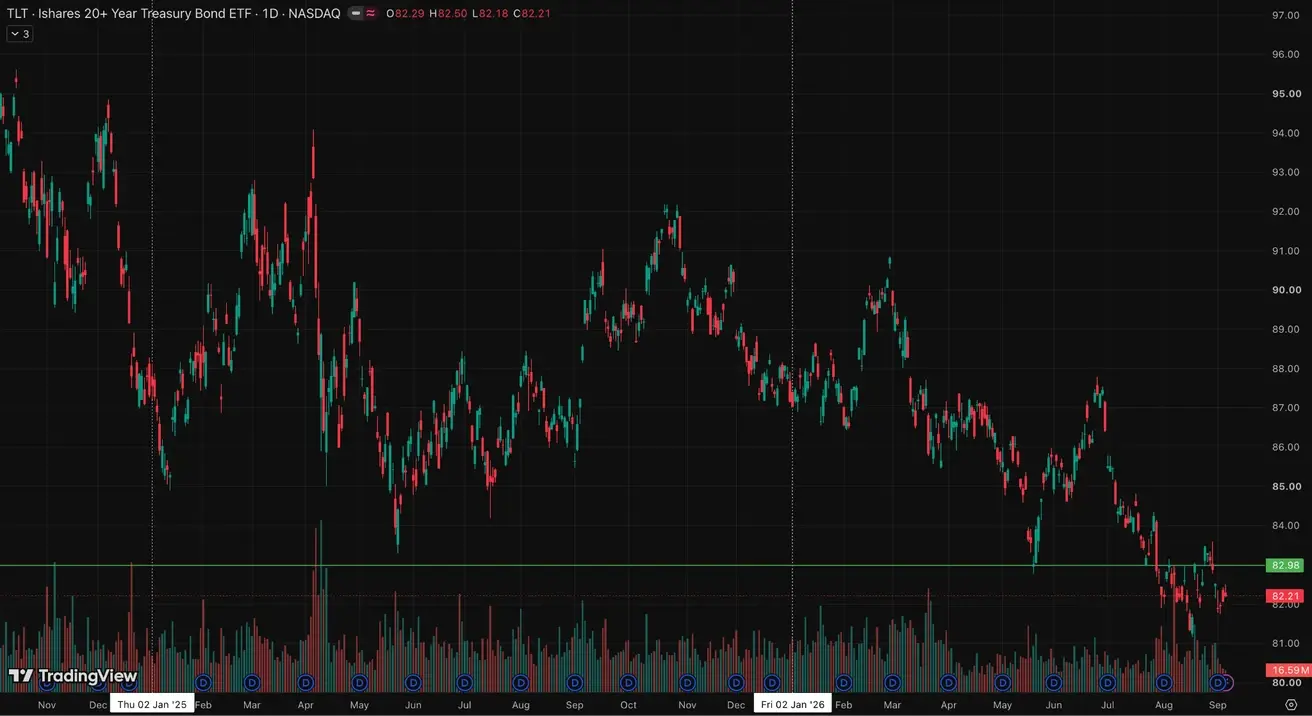
Following the jobs report, selling resumed in US government bonds, and yields turned higher.
U.S. Treasury Bonds 20+ Years (TLT ETF): -0.81% for the week (weekly close: 82.21); -5.68% year-to-date.
Yields and Spreads
- Market Yield on U.S. Treasury Securities at 10-Year Constant Maturity: 4.8% (previous: 4.73%);
- 2-Year U.S. Treasury Yield: 4.38% (previous: 4.35%);
- ICE BofA BBB US Corporate Index Effective Yield: 5.69% (previous: 5.56%).
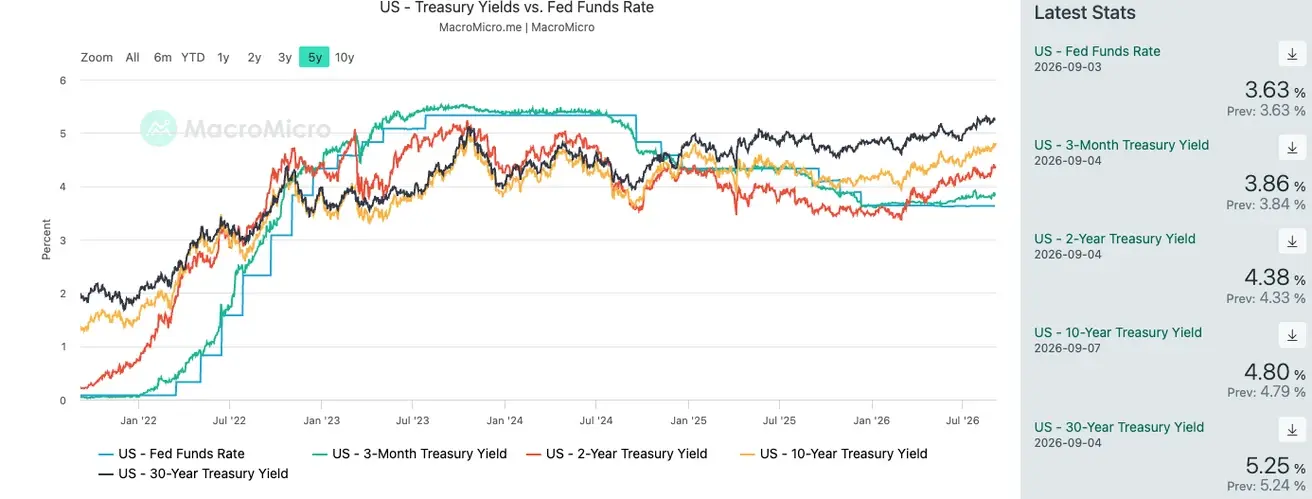
- The yield spread between 10-year and 2-year U.S. Treasury securities stands at 42 basis points (previous: 38 bps);
- The yield spread between 10-year and 3-month U.S. Treasury securities stands at 94 basis points (previous: 91 bps).
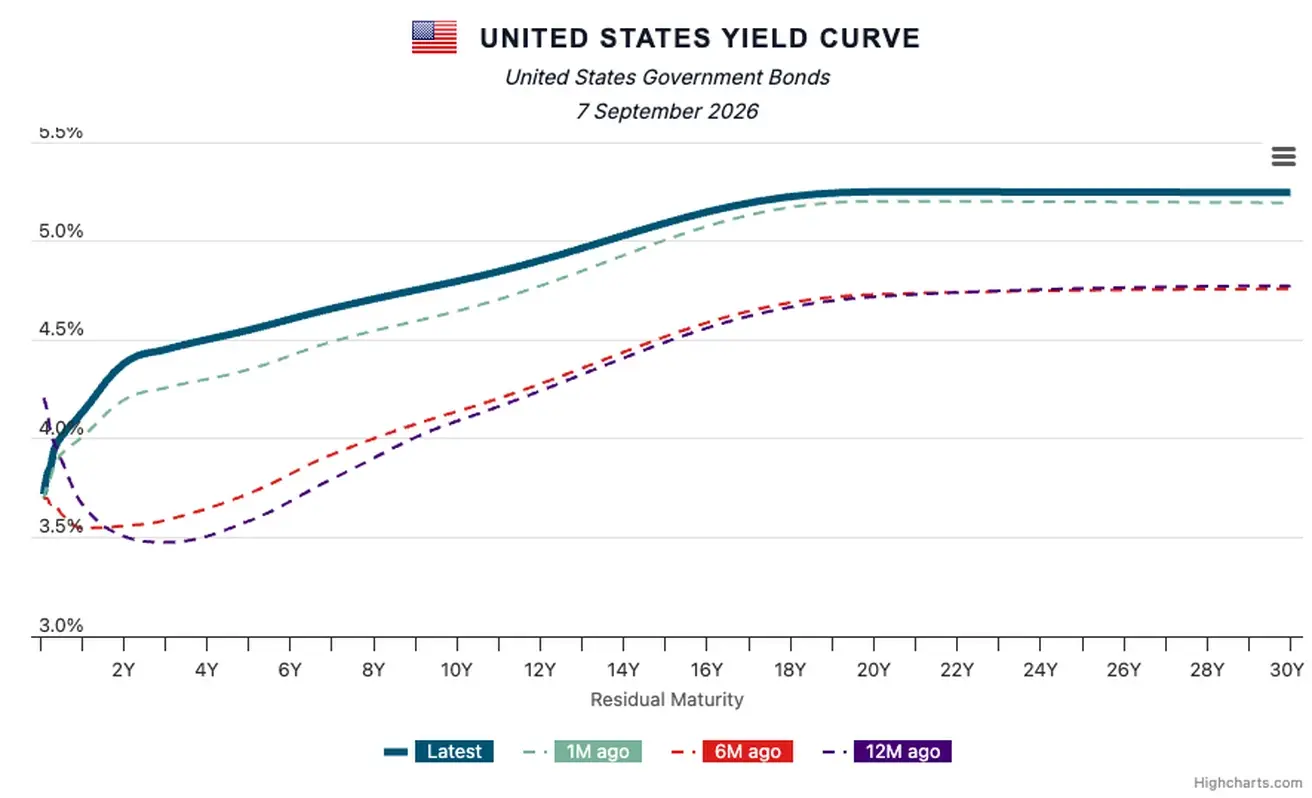
U.S. Treasury Yield Curve
The cost of a 5-year U.S. Credit Default Swap (CDS) — a market-based measure of sovereign default insurance — is 32.38 basis points, compared with 33.29 basis points a week earlier.
SP500
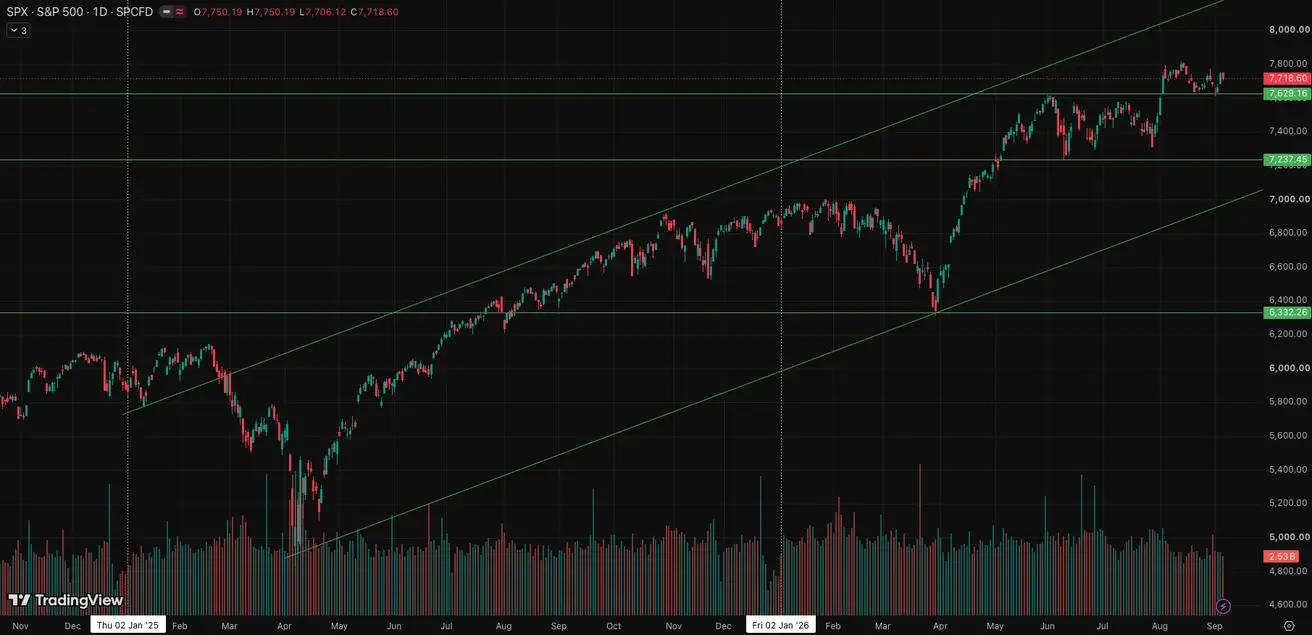
Weekly performance: +0.09% (week-end close: 7,718.60); year-to-date: +12.75%.
NASDAQ100
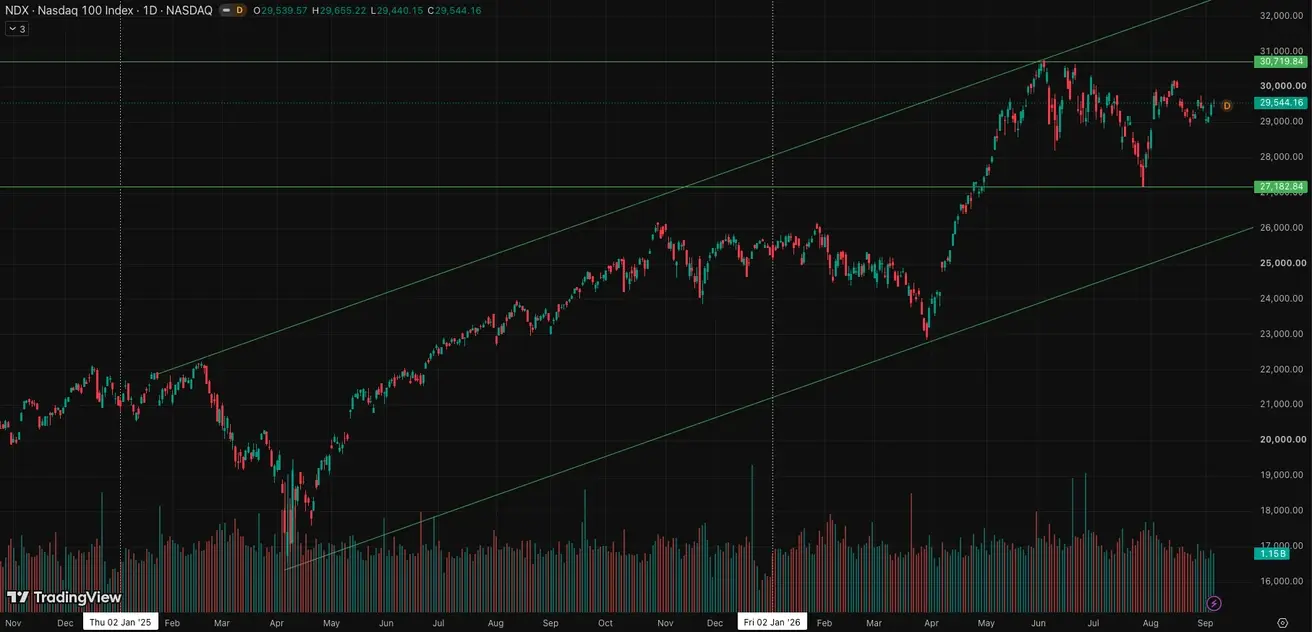
Weekly performance: +0.38% (week-end close: 29,544.16); year-to-date: +17.01%.
VIX
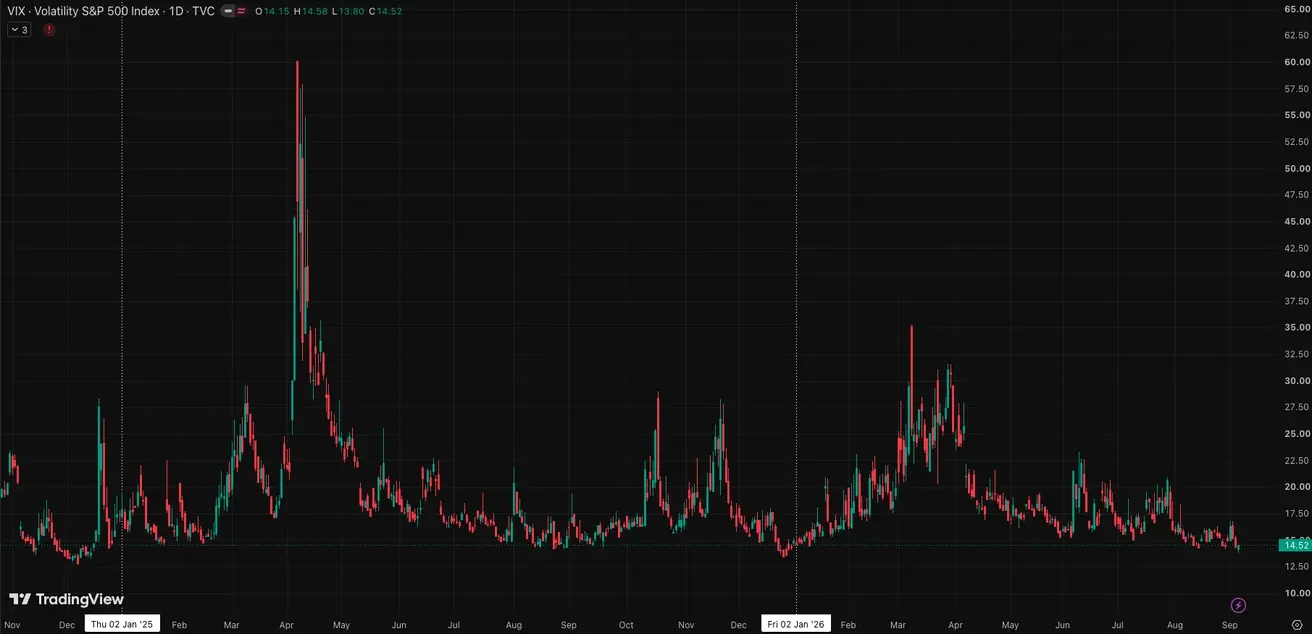
VIX (volatility index): week-end close at 14.52 points.
Eurozone
- The ECB raised interest rates, while maintaining a hawkish stance as inflationary risks continue to increase;
- Against the backdrop of the conflict in the Middle East, the ECB revised its GDP forecasts downward and raised its inflation projections for the coming years.
Interest Rates
- Deposit Facility Rate: 2.25% (previous: 2.0%);
- Marginal Lending Facility Rate: 2.65% (previous: 2.4%) — the rate at which banks can obtain overnight funding from the central bank;
- Main Refinancing Rate (Policy Rate): 2.40% (previous: 2.15%).
Inflation: Consumer Price Index (CPI) (August)
- Core CPI (YoY): 2.4% (previous: 2.5%);
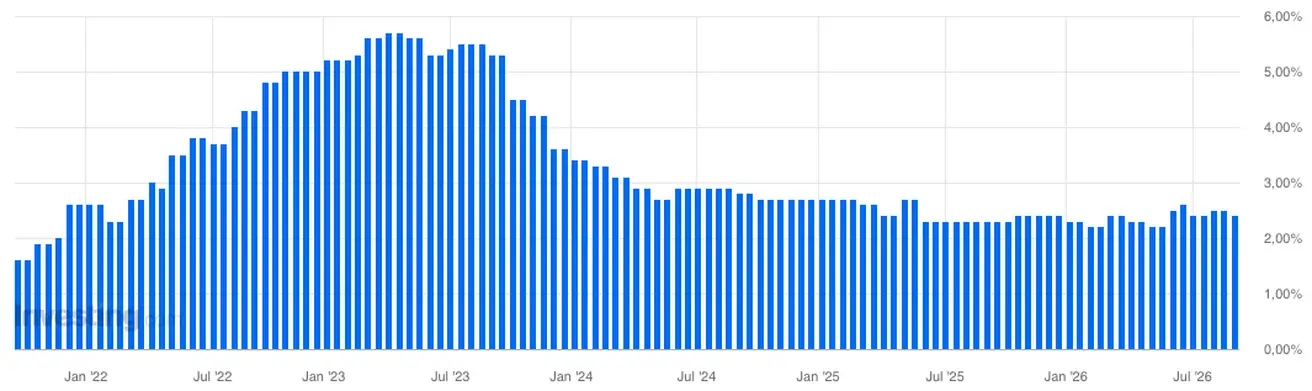
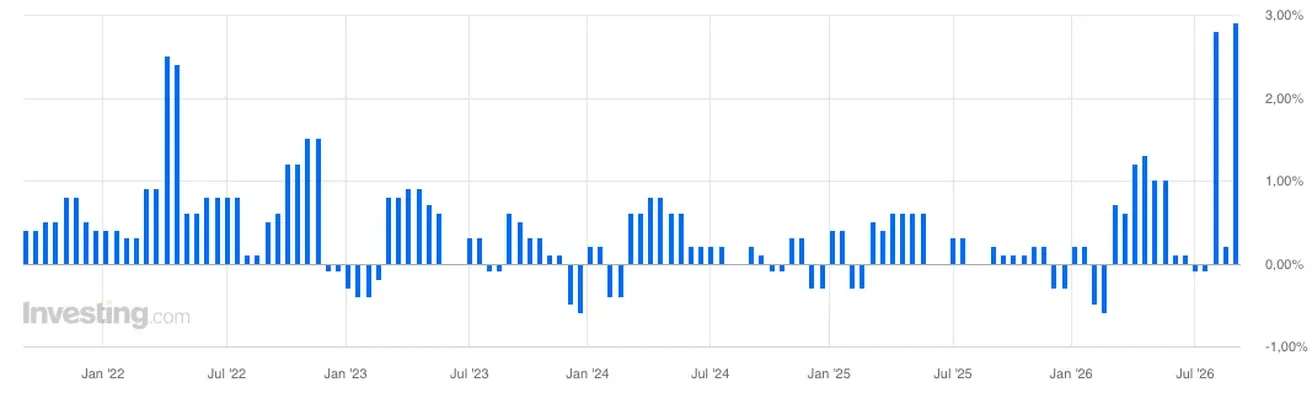
- Headline CPI: 2.9% (MoM) (previous: 0.2%);
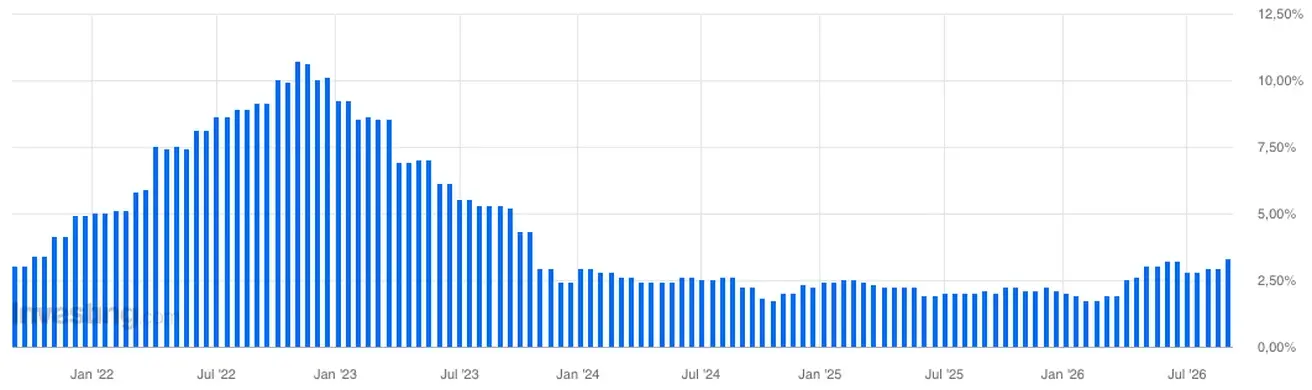
- CPI: 3.3% (YoY) (previous: 2.9%).
Gabriel Makhlouf, Governor of the Central Bank of Ireland and member of the ECB Governing Council, commented last week that “the European Central Bank should not shy away from further raising interest rates if inflation risks in the eurozone continue to worsen”.
GDP (Q2 2026 Preliminary Estimate)
- QoQ: 0.4% (previous: -0.2%);
- YoY: 1.0% (previous: 0.3%).
Unemployment Rate (June)
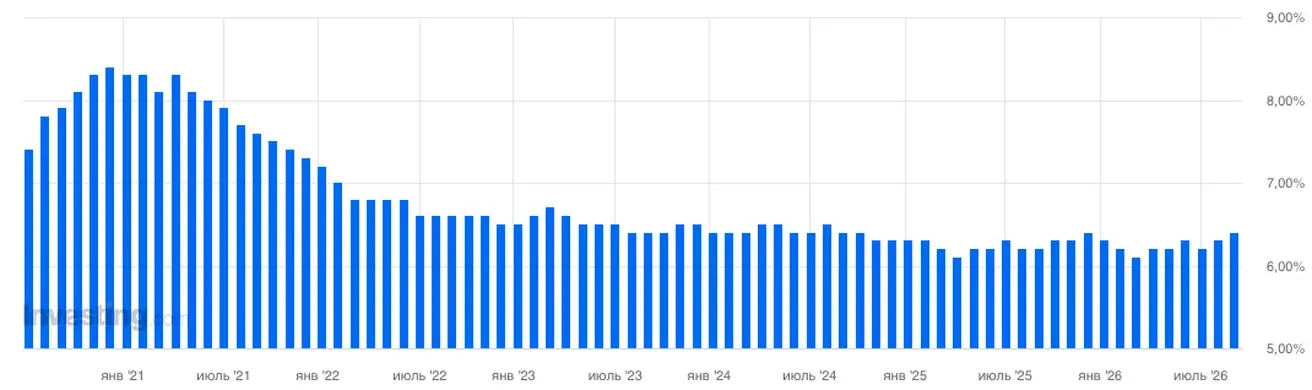
6.4% (previous: 6.3%).
Industrial Production (June)
- MoM: 0.0% (previous: 0.3% revised);
- YoY: 1.67% (previous: 1.37%).
Purchasing Managers’ Index (PMI) (August)
- Services PMI: 51.6 (previous: 51.7);
- Manufacturing PMI: 52.7 (previous: 52.8);
- S&P Global Composite PMI: 52.0 (previous: 52.0).
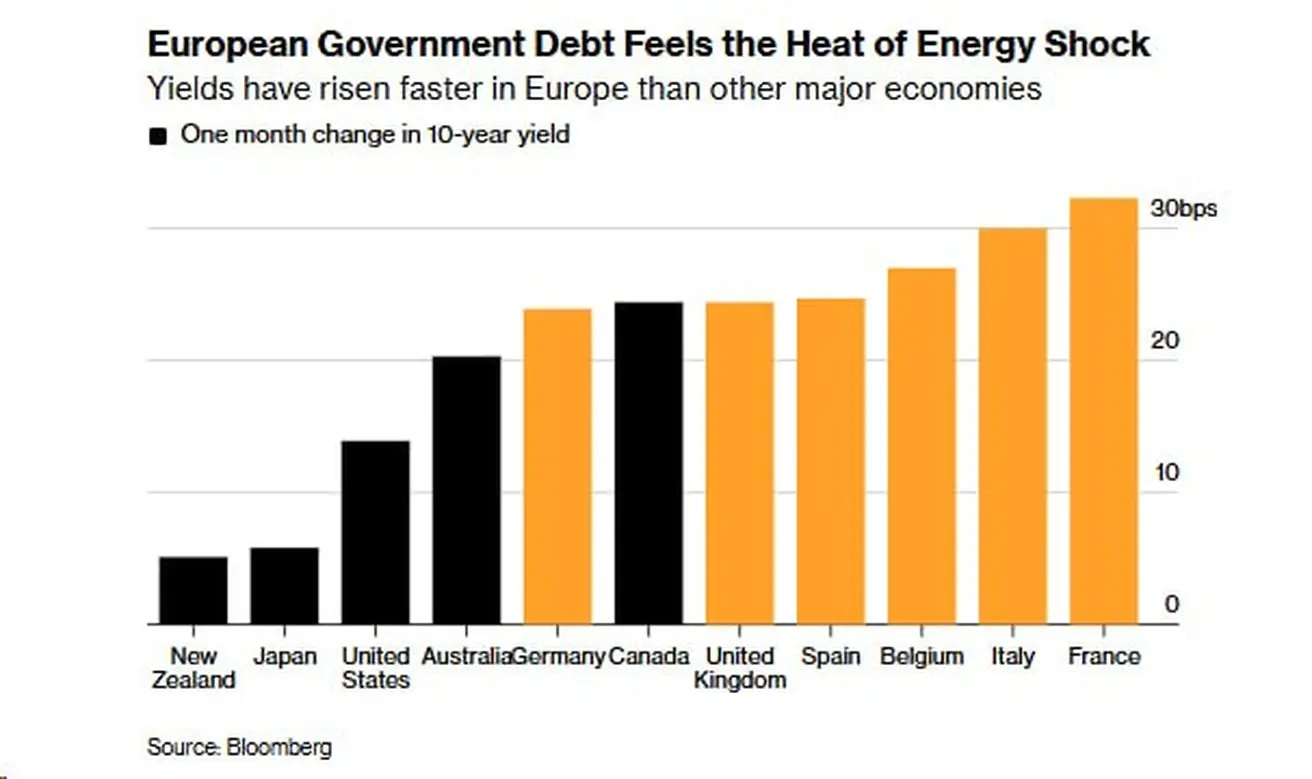
Changes in 10-year government bond yields over one month. Europe stands out notably: France (+32 bps), Italy (+30 bps), Belgium (+27 bps), Spain and the UK (+24–25 bps), and Germany (+23 bps). By comparison, the US is around +14 bps.
The energy shock is hitting the European debt market hardest.
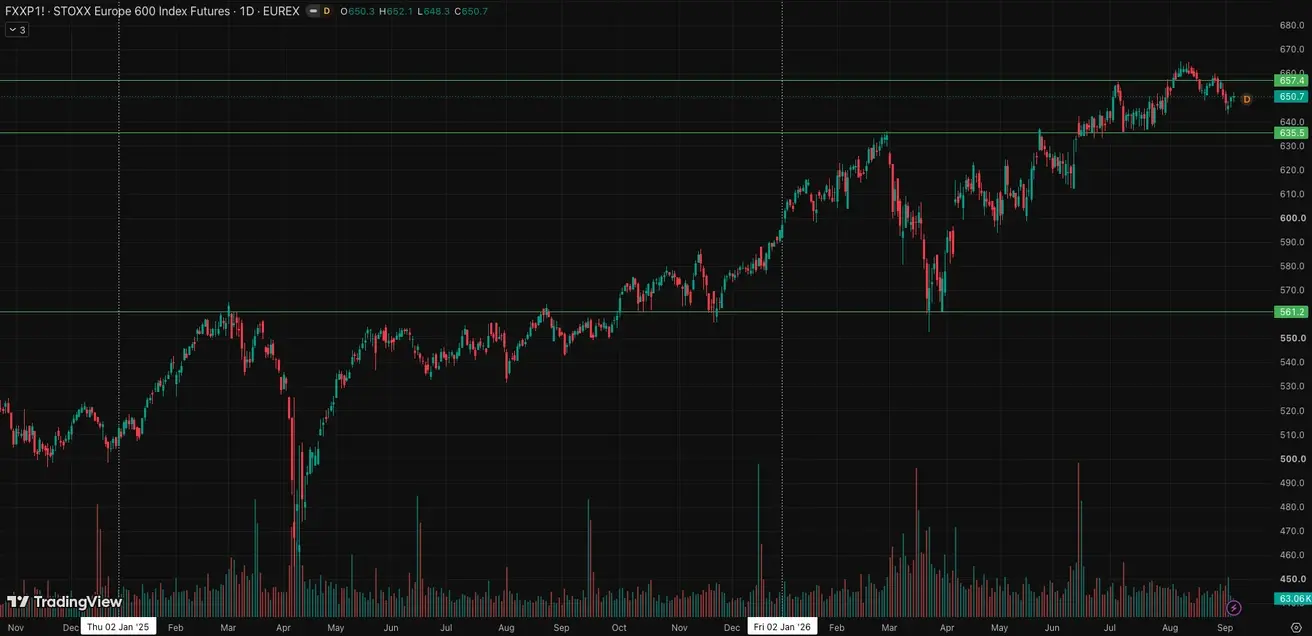
Euro Stoxx 600 (FXXP1!)
Weekly performance: -0.85% (week-end close: 650.7); year-to-date: +9.55%.
China
China’s economy continues to stabilize, supported by strong exports, while domestic demand and investment gradually recover. Policymakers remain measured and targeted in their approach to economic stimulus.
- Interest rates remain unchanged;
- Monetary policy remains accommodative;
- China reaffirmed its commitment to fiscal support for economic growth under its 2026 plan, including measures to stimulate domestic demand, optimize tax incentives and subsidies, and modernize industrial capacity.
Interest Rates
- 1-Year Loan Prime Rate (medium-term lending): 3.00%;
- 5-Year Loan Prime Rate (benchmark for mortgage lending): 3.50%.
Inflation Indicators (July)
- Consumer Price Index (CPI): -0.1% MoM (previous: -0.3%); 0.5% YoY (previous: 1.0%);
- Producer Price Index (PPI): 3.5% YoY (previous: 4.1%).
Trade Data
- Imports (June): 27.5% YoY (previous: 36.0%);
- Exports (June): 23.9% YoY (previous: 27.0%);
- Trade Balance (USD) (July): $112.5 billion (previous: $125.62 billion).
GDP (Q2 2026)
- QoQ: 0.9% (previous: 1.3%);
- YoY: 4.3% (previous: 5.0%). This is below the target trajectory and reflects weaker domestic momentum.
Labor Market
- Unemployment Rate (July): 5.2% (previous: 5.0%).
Industrial Activity
- Industrial Production (July, YoY): 4.5% (previous: 5.3%).
Fixed Asset Investment
- June, YoY: -6.7% (previous: -5.7%).
Retail Sales
- June, YoY: 0.6% (previous: 0.9%).
Purchasing Managers’ Indices (PMI) (August)
- Manufacturing PMI: 49.8 (previous: 49.2);
- Non-Manufacturing PMI: 49.0 (previous: 49.0);
- Composite PMI: 49.5 (previous: 49.3).
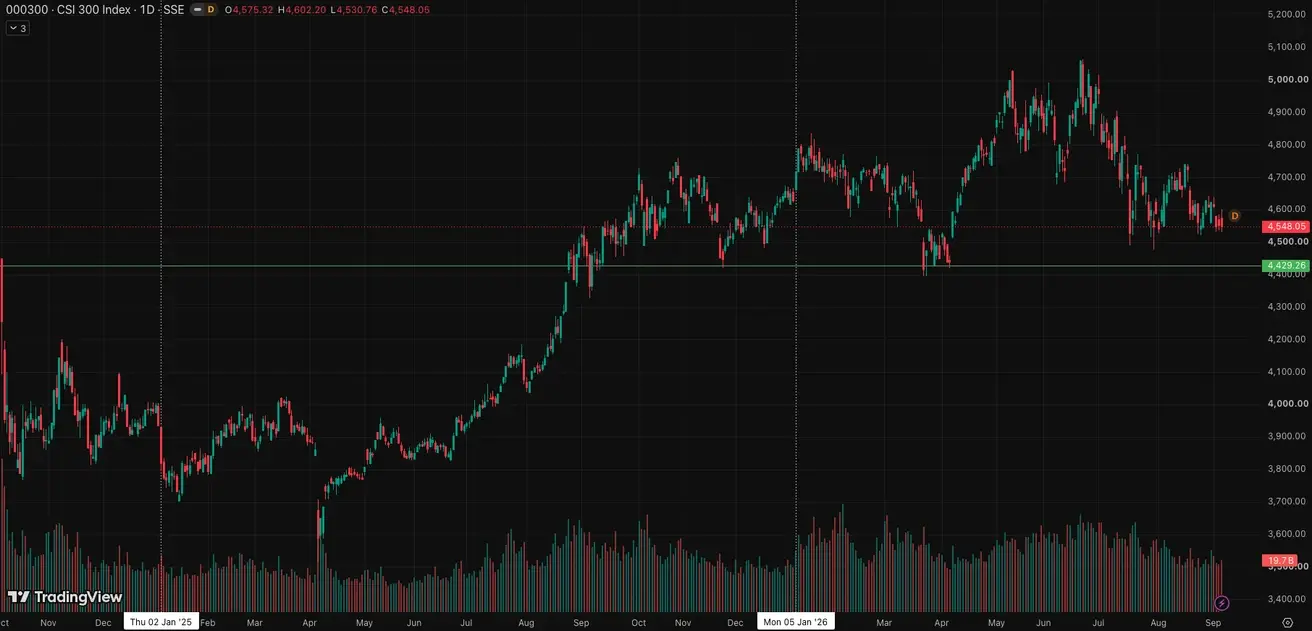
CSI 300 Index (000300.HK)
Weekly performance: -1.33% (week-end close: 4,548.05); year-to-date: -2.44%.
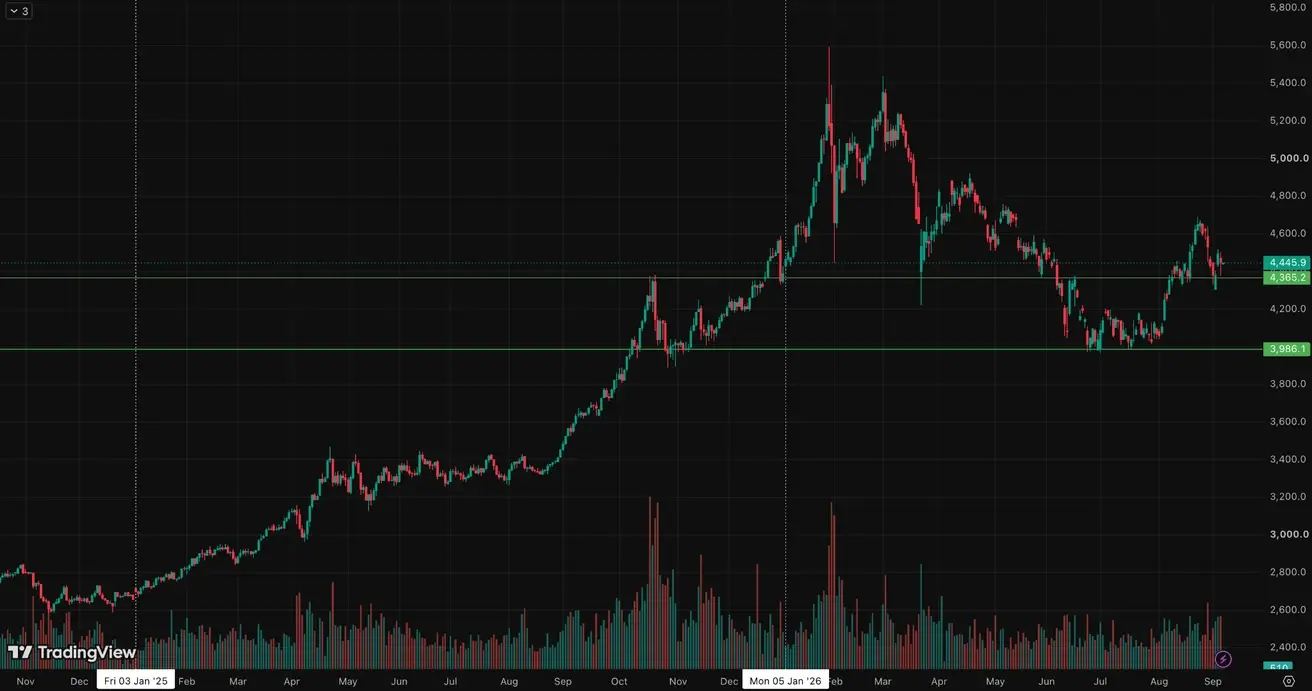
Gold Futures (GC)
Weekly performance: -1.88% (week close: $4,445.9 per troy oz); year-to-date: +2.63%.
Central banks remained net buyers in July — net purchases totaled 23t:
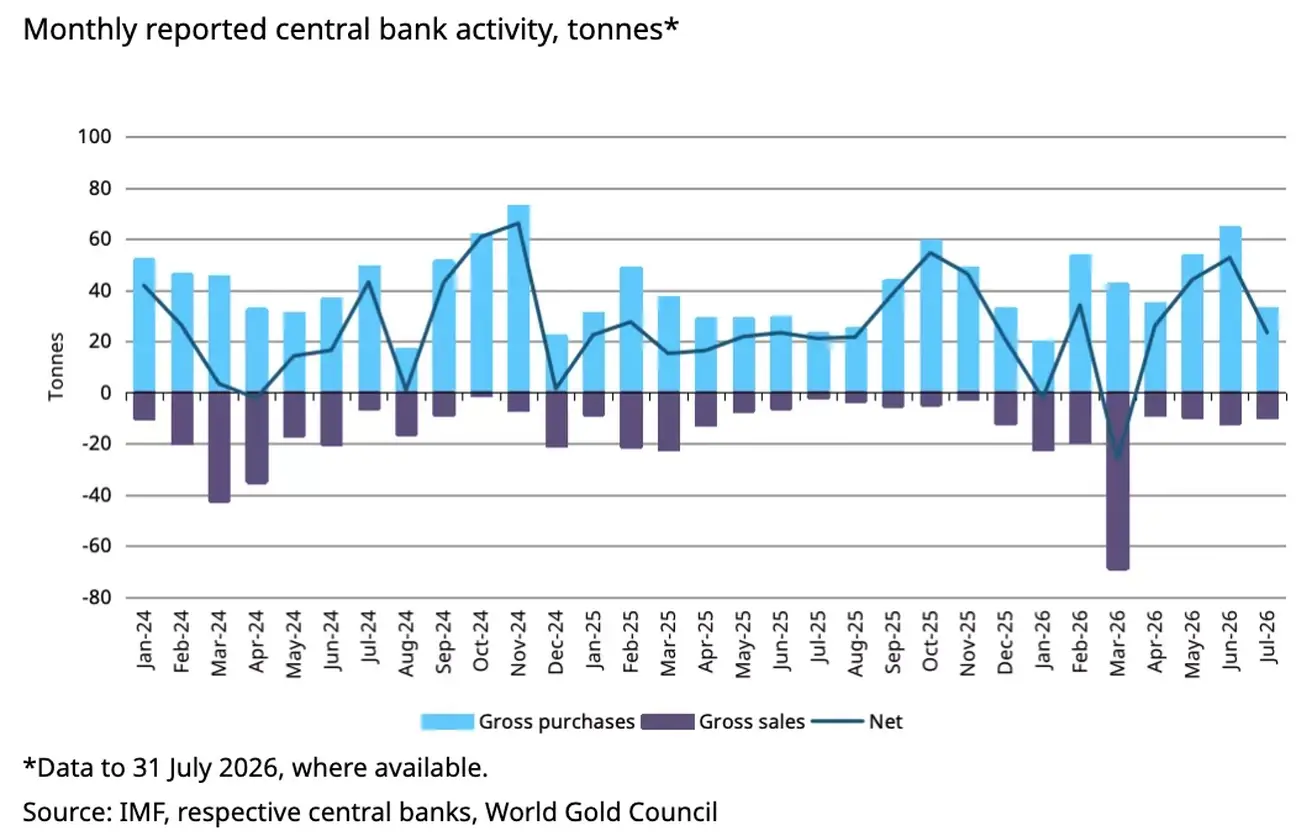
The People’s Bank of China (PBoC) has accelerated its activity in recent months, posting double-digit monthly gold purchase volumes since May 2026. Russia was the largest net seller this month, selling 6 tonnes, followed by Turkey, Jordan and Uzbekistan with 1 tonne each.
On an annualized basis, central banks reported purchases of around 130 tonnes of gold. By comparison, central banks purchased around 160 tonnes over the same period last year.
Oil Futures
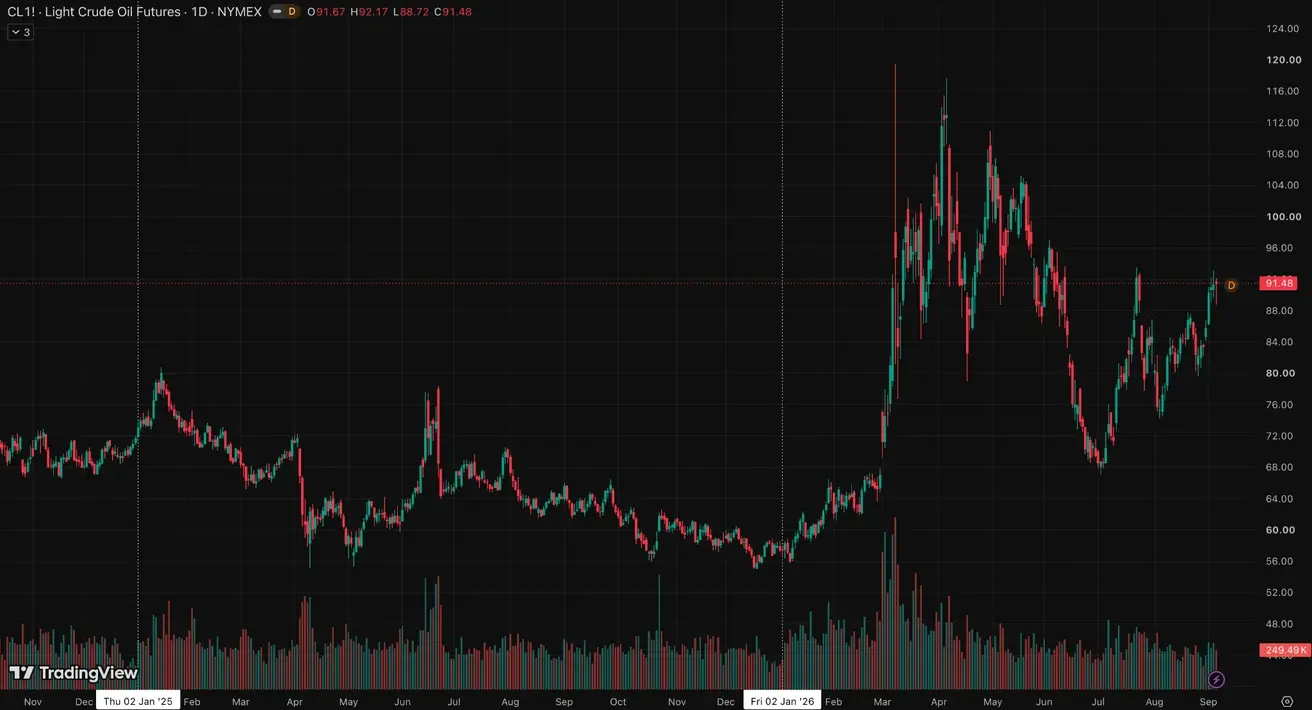
Weekly performance: +9.69% (week close: $91.48 per barrel); year-to-date: +59.35%.
Oil prices continue to move higher amid rising tensions in the Strait of Hormuz.
Dollar Index Futures (DX)
Weekly performance: -0.5% (week close: 98.885); year-to-date: +0.91%.
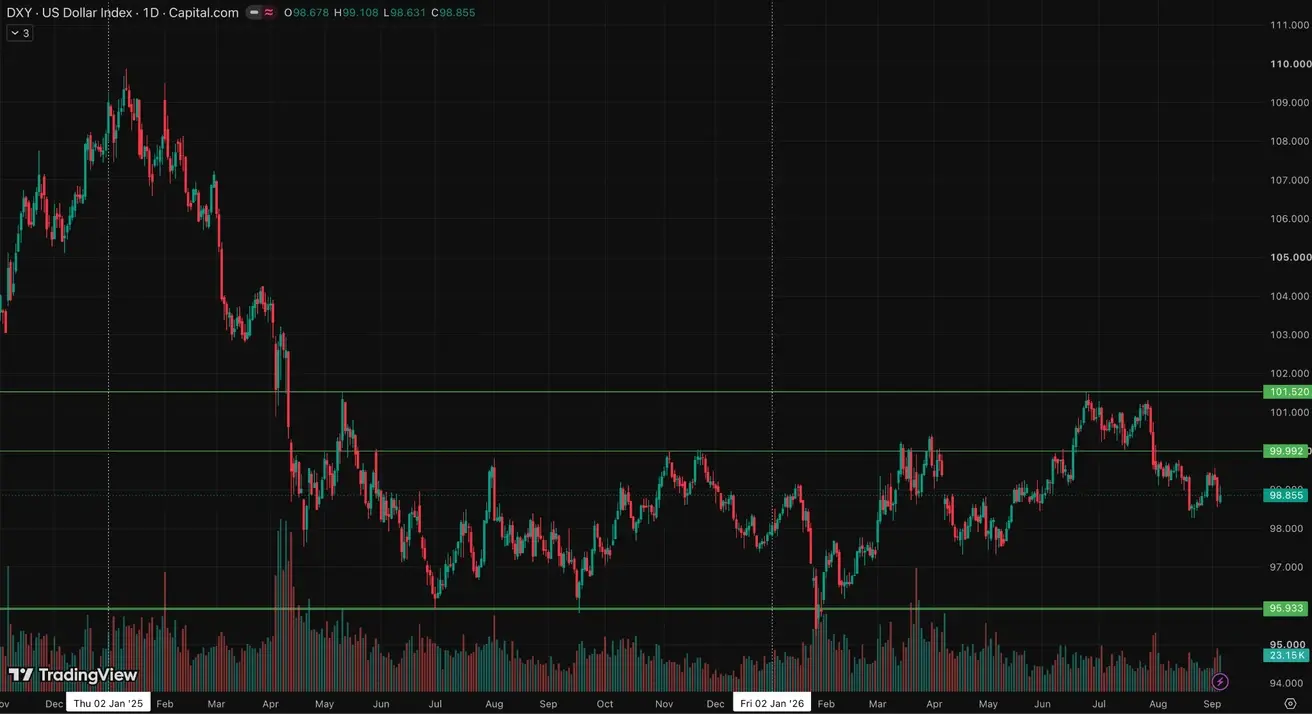
The dollar index is declining despite the Fed’s more hawkish rhetoric, as the US interest rate differential versus Europe narrows and markets believe the ECB will pursue more aggressive monetary policy than the Fed. The euro’s weight in the index is 57%.
Additional pressure also comes from a rising fiscal premium in Treasuries and a strengthening yen following currency interventions between the Fed and the Bank of Japan; the yen’s weight in the dollar index is 14%.
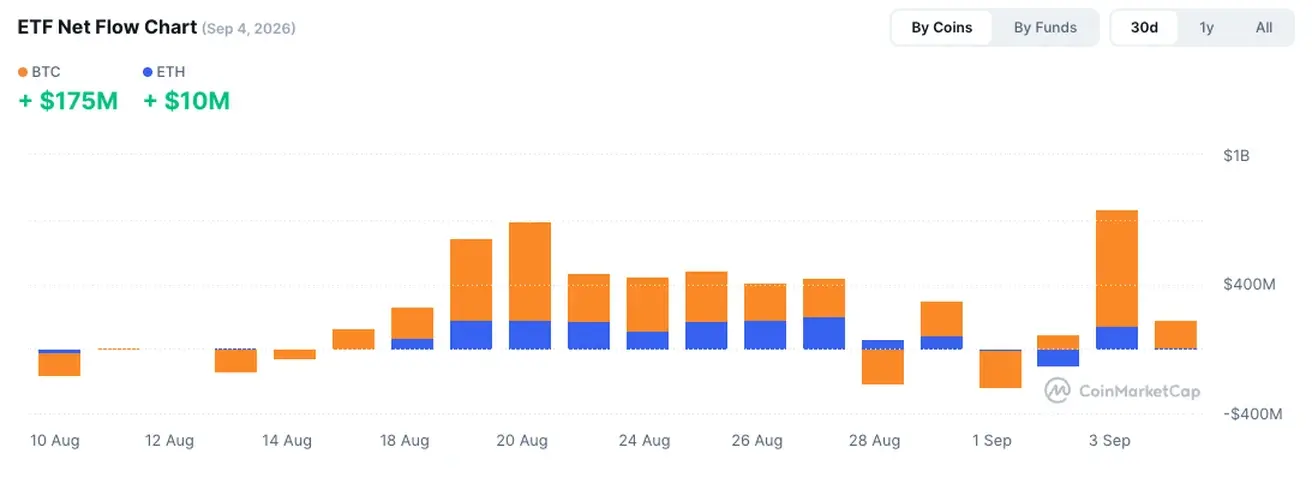
BTC Futures
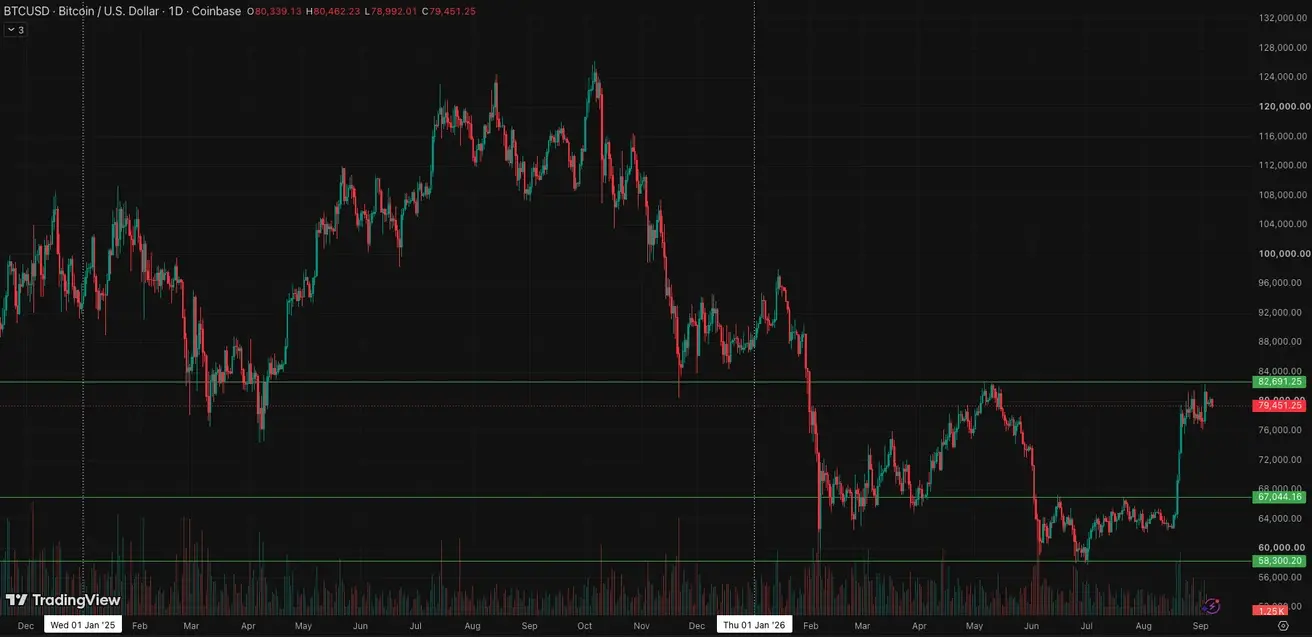
Weekly performance: +3.44% (week close: $80,339.13); year-to-date: -8.41%.
ETH Futures
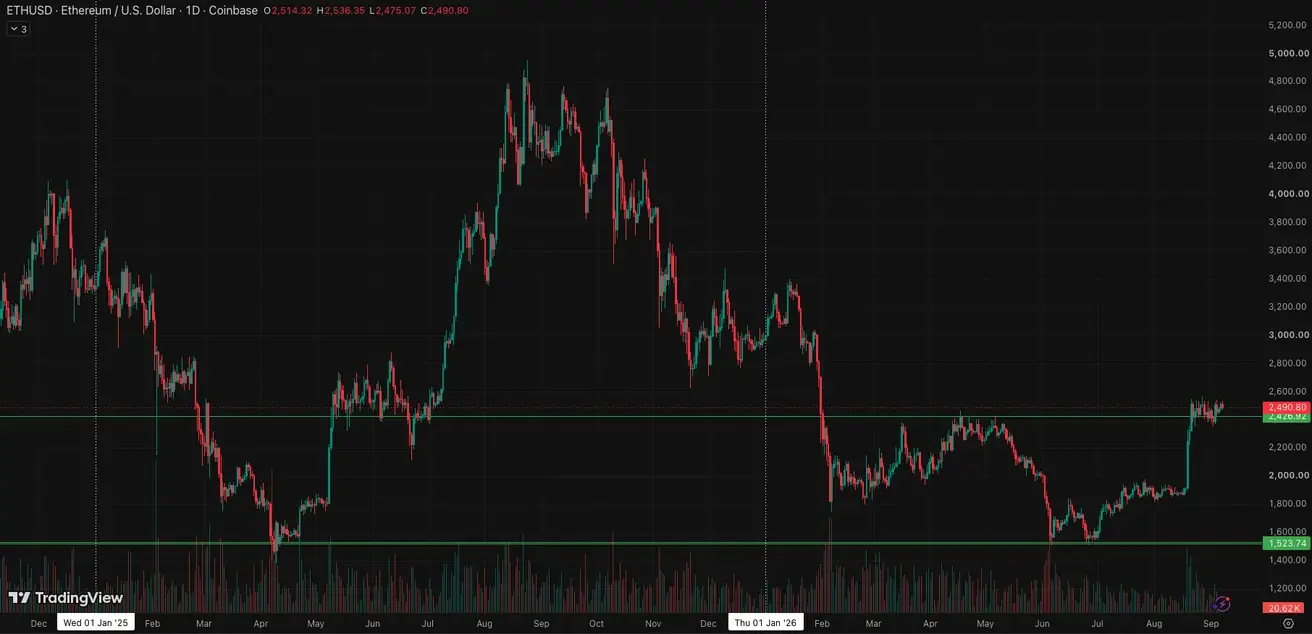
Weekly performance: +4.03% (week close: $2,514.31); year-to-date: -15.45%.
SEC Chair Paul Atkins said in an interview with FOX News that he expects the Senate to vote on the CLARITY Act bill in September.
Total Cryptocurrency Market Capitalization
Total crypto market capitalization: $2.7 trillion (vs $2.64 trillion a week earlier) (coinmarketcap.com).
Crypto asset market shares:
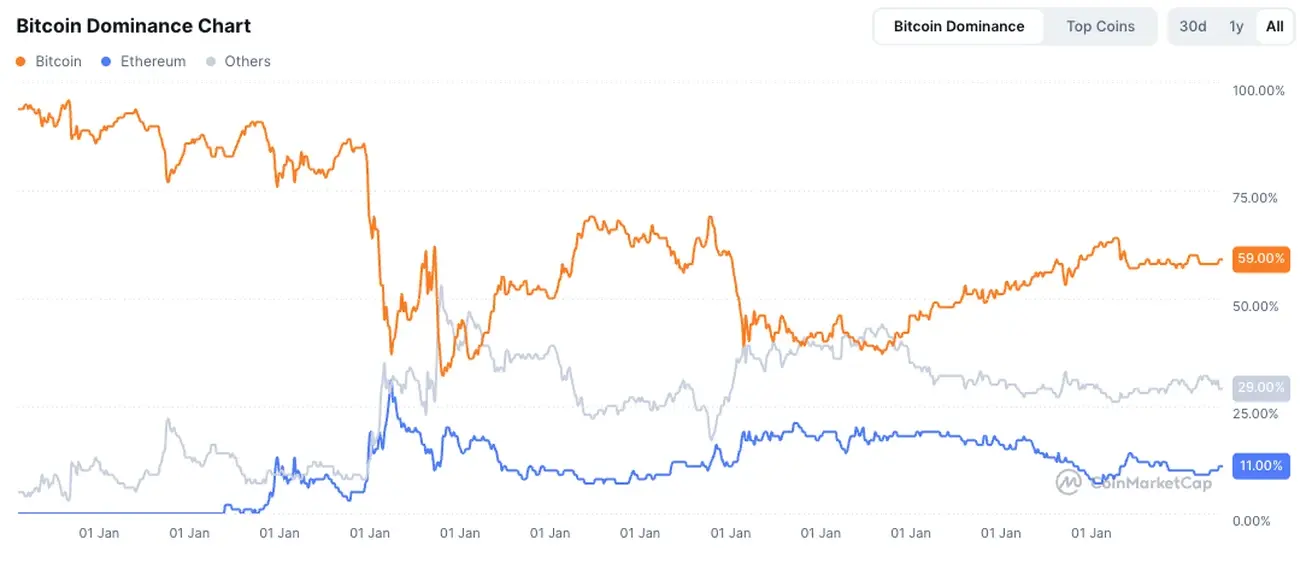
- Bitcoin: 59.1% (prev. 59.7%);
- Ethereum: 11.3% (prev. 11.2%);
- Others: 29.7% (prev. 29.1%).