Lietuvių
 Русский
 Қазақша
 Eesti
EestiDecember 1–7, 2025: Weekly economic update
Key market updates

Last week, equity markets were dominated by moderately constructive sentiment.
ADP’s National Employment Report indicated a further softening in labor-market conditions. The U.S. private sector shed 32,000 jobs in November, following an upwardly revised gain of 47,000 in October, while consensus expectations had pointed to a 10,000 increase. The official non-farm payrolls report is scheduled for release on December 16.
U.S. 12-month inflation expectations, according to the University of Michigan survey, declined for a fourth consecutive month, reaching a near one-year low of 4.1% in December, down from 4.5% in November. Five-year expectations also eased to 3.2%.
The core Personal Consumption Expenditures Price Index showed no month-over-month increase in September and slipped by 0.1 percentage points year-on-year to 2.8%.
Soft labor-market data and the absence of inflationary momentum in September have reinforced market expectations for a 25-basis-point Fed rate cut at the upcoming meeting on December 10.
U.S. PMI indices remain in expansion territory, while the Atlanta Fed’s GDPNow model holds steady at 3.9%. Comprehensive U.S. macroeconomic data will be released throughout December.
Macroeconomic Statistics
INFLATION (September)
- Core Consumer Price Index (CPI) (m/m): 0,2% (previous: 0.3%)
- Consumer Price Index (CPI) (m/m): 0.3% (previous: 0.4%)
- Core Consumer Price Index (CPI) (y/y): 3.0% (previous: 3.1%)
- Consumer Price Index (CPI) (y/y): 3.0% (previous: 2.9%)
Producer Price Index (September):
- PPI (m/m): 0.3% (prev: -0.1%)
- Core PPI (m/m): 0.1% (prev: -0.1%)
INFLATION EXPECTATIONS (MICHIGAN)
- 12-month expected inflation (November): 4.1% (prev: 4.5%)
- 5-year expected inflation (November): 3.2% (prev: 3.4%)
Core Personal Consumption Expenditures Price Index (September) — the Federal Reserve’s preferred measure of underlying inflation:
- m/m: 0.2% (prev: 0.2%)
- y/y: 2.8% (prev: 2.9%)
GDP (U.S. Bureau of Economic Analysis, BEA) — 2Q25 annualized, third estimate: +3.8% (second estimate:+3.30%; 1Q2024: –0.5%). Atlanta Fed GDPNow estimate (4Q): 3.9% (vs. 3.9%).
Business Activity Index (PMI) (October):
(Above 50 indicates expansion; below 50 indicates contraction)
- Services sector: 54.1 (previous: 54.8)
- Manufacturing sector: 52.2 (previous: 52.5)
- S&P Global Composite: 54.2 (previous: 53.6)
LABOR MARKET (Data for September, BLS; October figures will be released later together with the November report)
- The labor-market data exceeded expectations across several indicators:
- Unemployment rate: 4.4% (prev: 4.3%)
- Total continuing unemployment claims (U.S.): 1,939K (vs. 1,943K revised)
- Initial jobless claims: 191K (vs. 218K revised)
- ADP non-farm employment change (November): –32K (prev: +47K)
- U.S. private non-farm payrolls: +97K (prev: +18K)
- Average hourly earnings (y/y): 3.8% (prev: 3.8%)
- JOLTS job openings: — (vs. 7.227M)
MONETARY POLICY
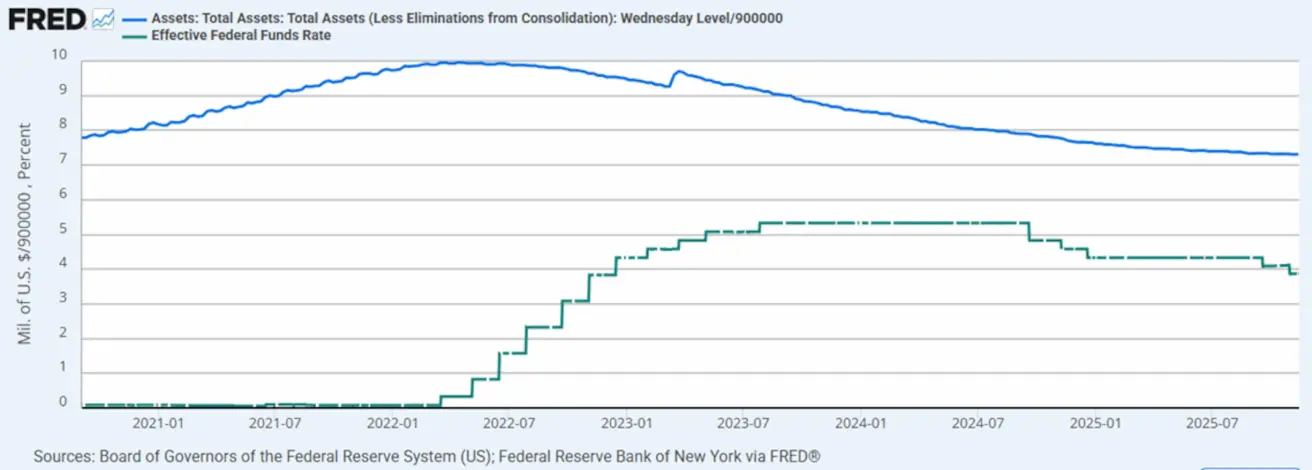
- Federal Funds Effective Rate (EFFR): 3.75% - 4.0%
- Federal Reserve balance sheet increased: $6,535T (vs. previous week: $6,552T)
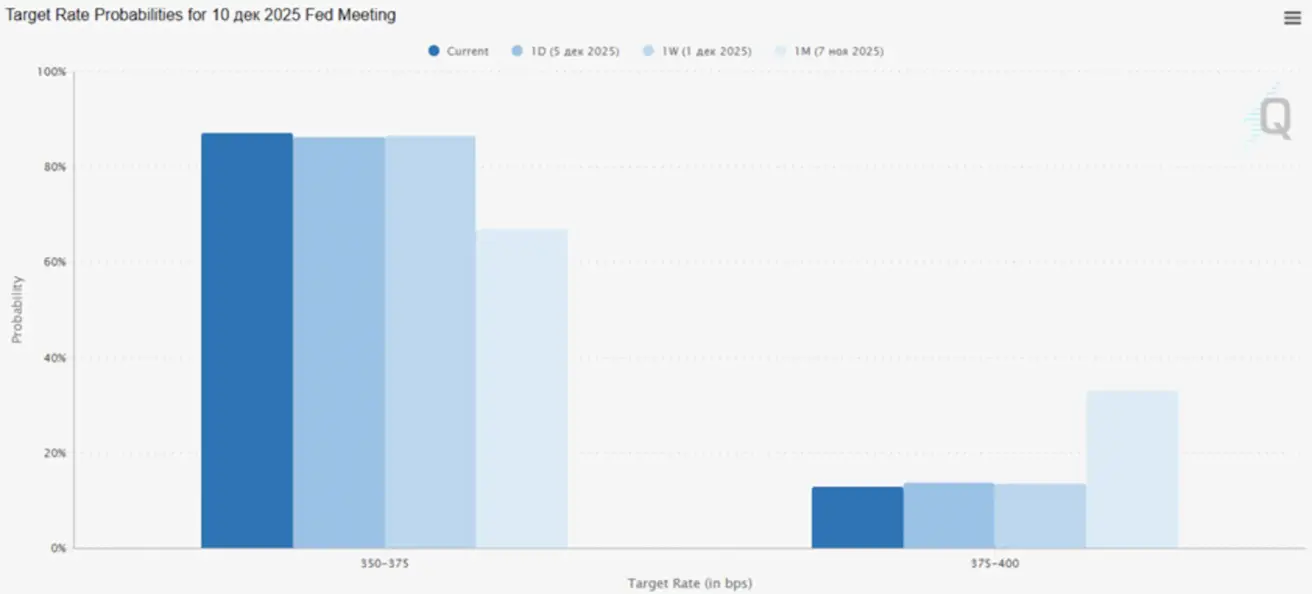
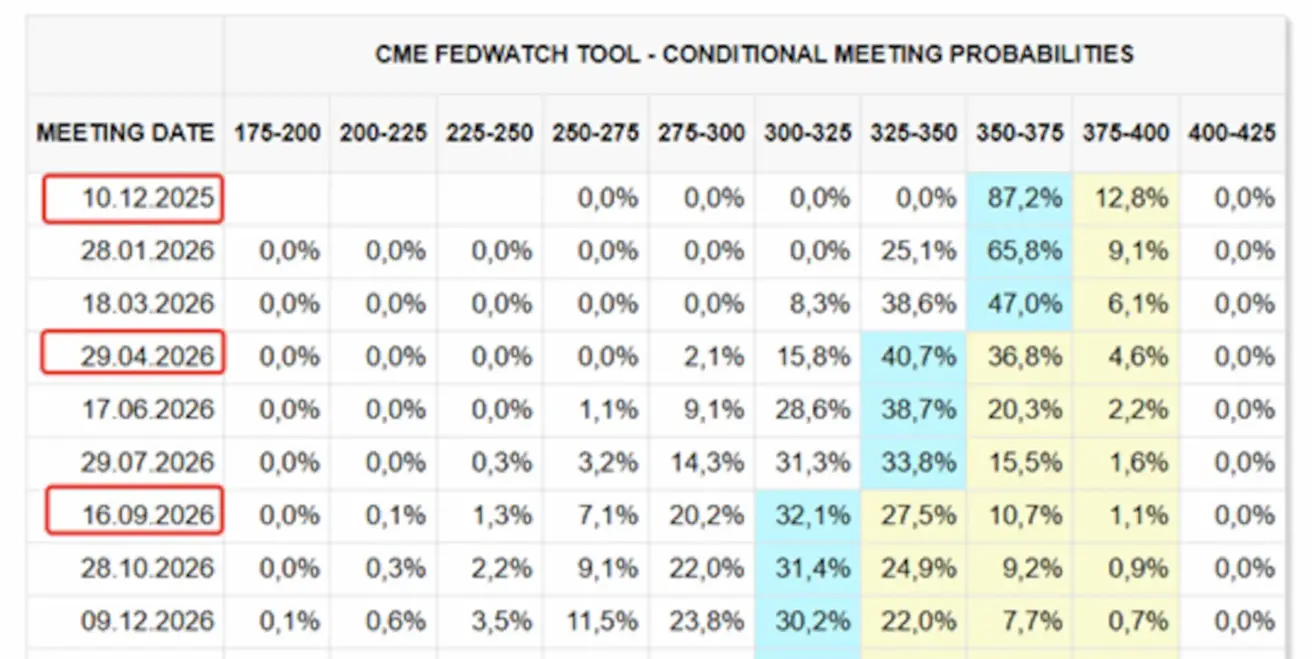
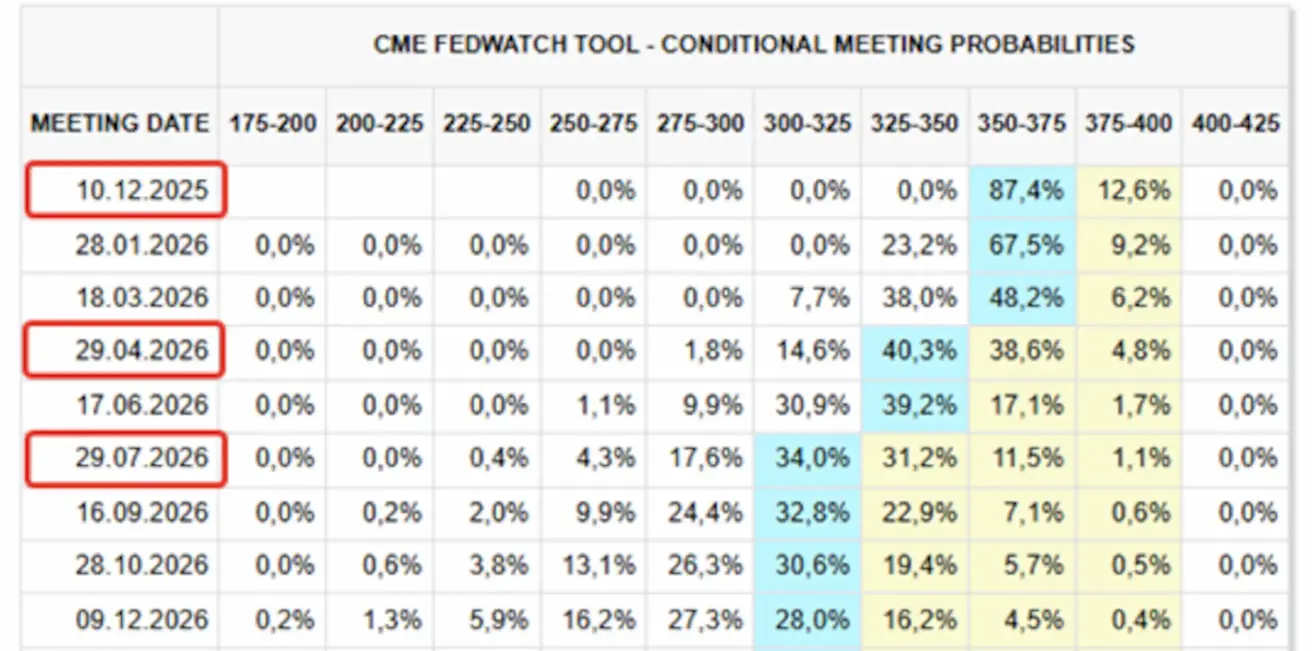
MARKET FORECAST FOR RATE (FEDWATCH)
- For the upcoming meeting on December 10, the implied probability of a 25bps rate cut stands at 87.2%.
- Over the subsequent 12 months: the market is pricing in three 25bps cuts, leaving the target range at 3.00–3.25%.
Today:
А week earlier:
Market
SP500
Weekly performance: +0,31% (week closed at 6870.39). Year-to-date performance for 2025: +16,38%.

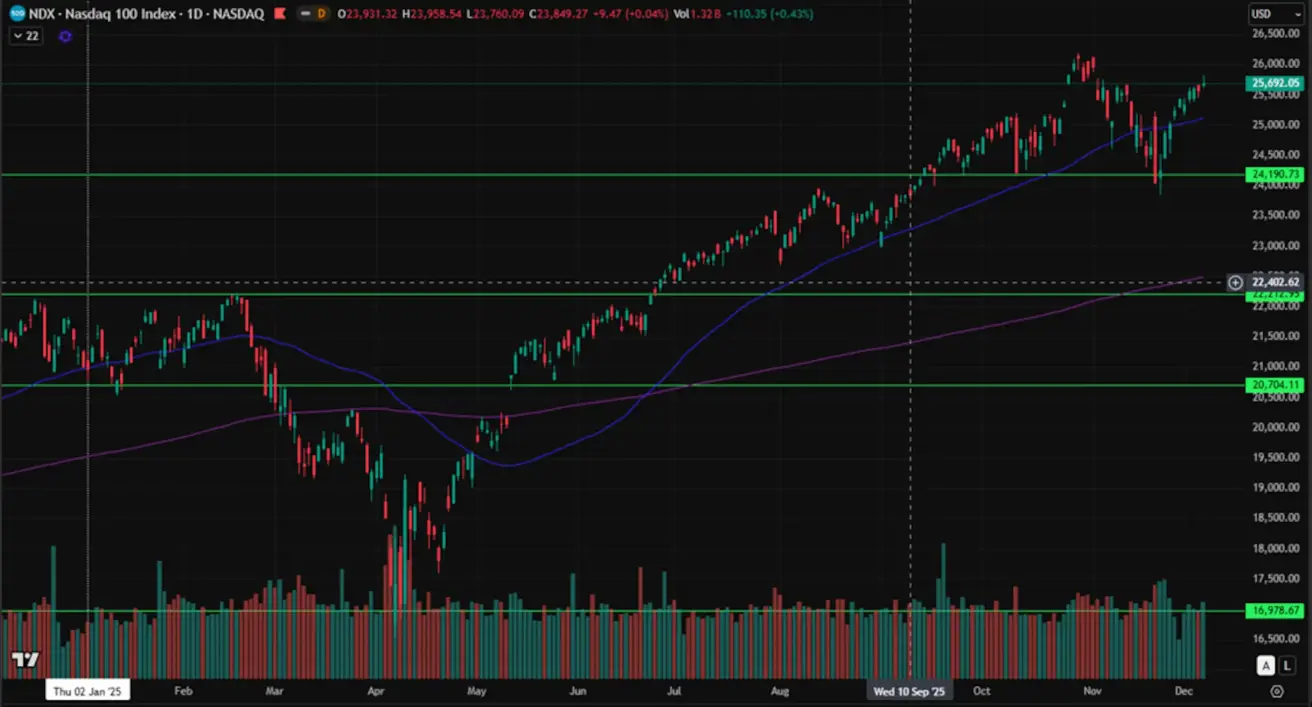
NASDAQ100
Weekly performance: +1.01% (week closed at 25,692.05). Year-to-date: +21.65%.
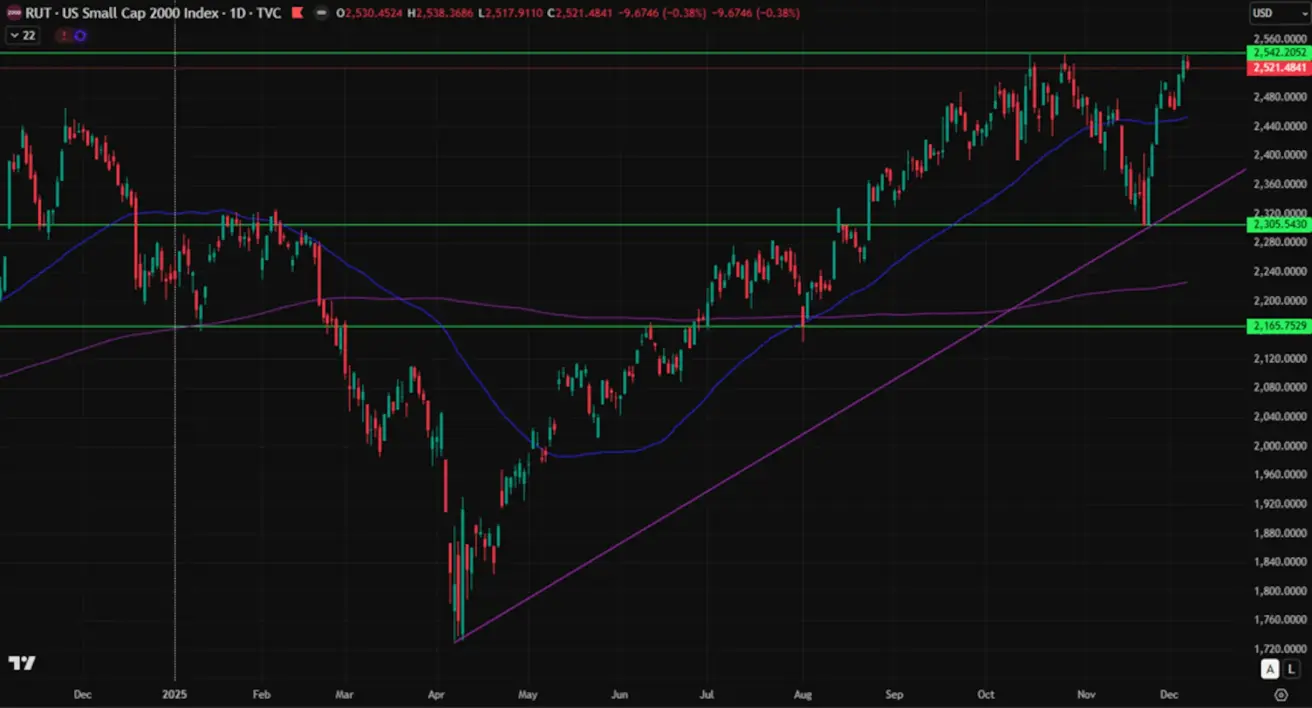
Russel 2000 (RUT)
Weekly performance: +0.84% (weekly close: 2,521.48). Year-to-date performance: +12.51%.
VIX
Market volatility is approaching its cyclical lows, with the VIX ending the week at 15.40.

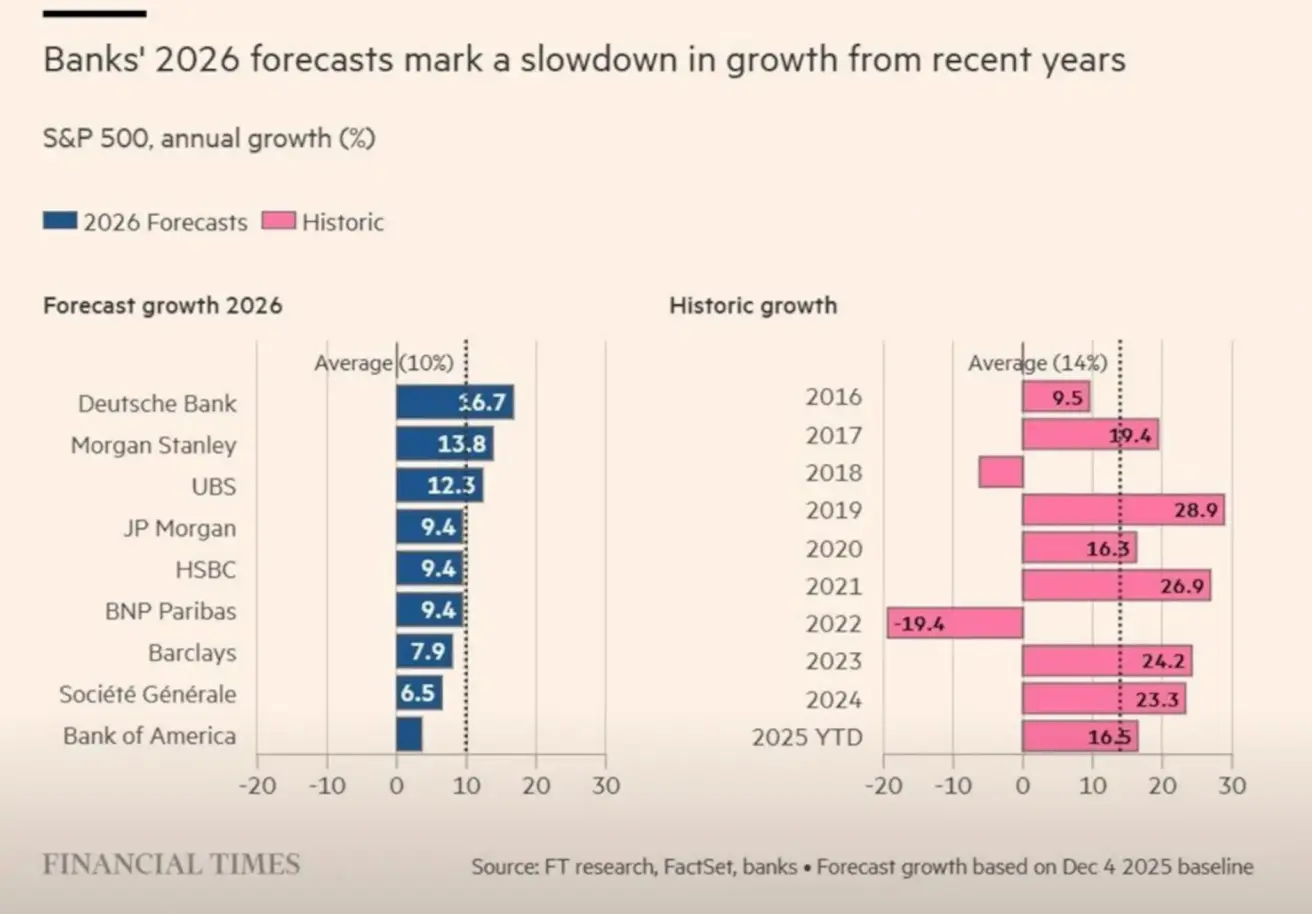
Forecasts from major global banks for the S&P 500 in 2026 point to an average expected gain of around 10%, slightly below the 10-year average forecast of 14%. Nevertheless, none of the institutions surveyed anticipate a decline in the index.
Eurozone
Interest Rates:
- Deposit facility rate: 2.0% (prev: 2.0%)
- Marginal lending facility rate: 2.4% (prev: 2.4%) — the rate at which banks can obtain overnight credit from the ECB
- Main refinancing (key policy) rate: 2.15% (prev: 2.15%)
Inflation — Consumer Price Index (CPI), November:
- Core CPI (y/y): 2.4% (prev: 2.4%)
- Headline CPI: m/m: –0.3% (prev: +0.2%); y/y: 2.2% (prev: 2.1%)
GDP, 3Q (final estimate):
- q/q: 0.3% (prev: 0.1%)
- y/y: 1.4% (prev: 1.5%)
Unemployment rate (October): 6.4% (prev: 6.3%)
Purchasing Managers’ Indices (PMI), October:
- Services: 53.6 (prev: 53.0)
- Manufacturing: 49.6 (prev: 50.0)
- S&P Global Composite: 52.8 (prev: 52.5)
ECB communication continues to signal a preference for maintaining policy rates at current levels. According to a Reuters survey, the majority of economists expect the ECB to keep rates unchanged at least through the end of 2026.
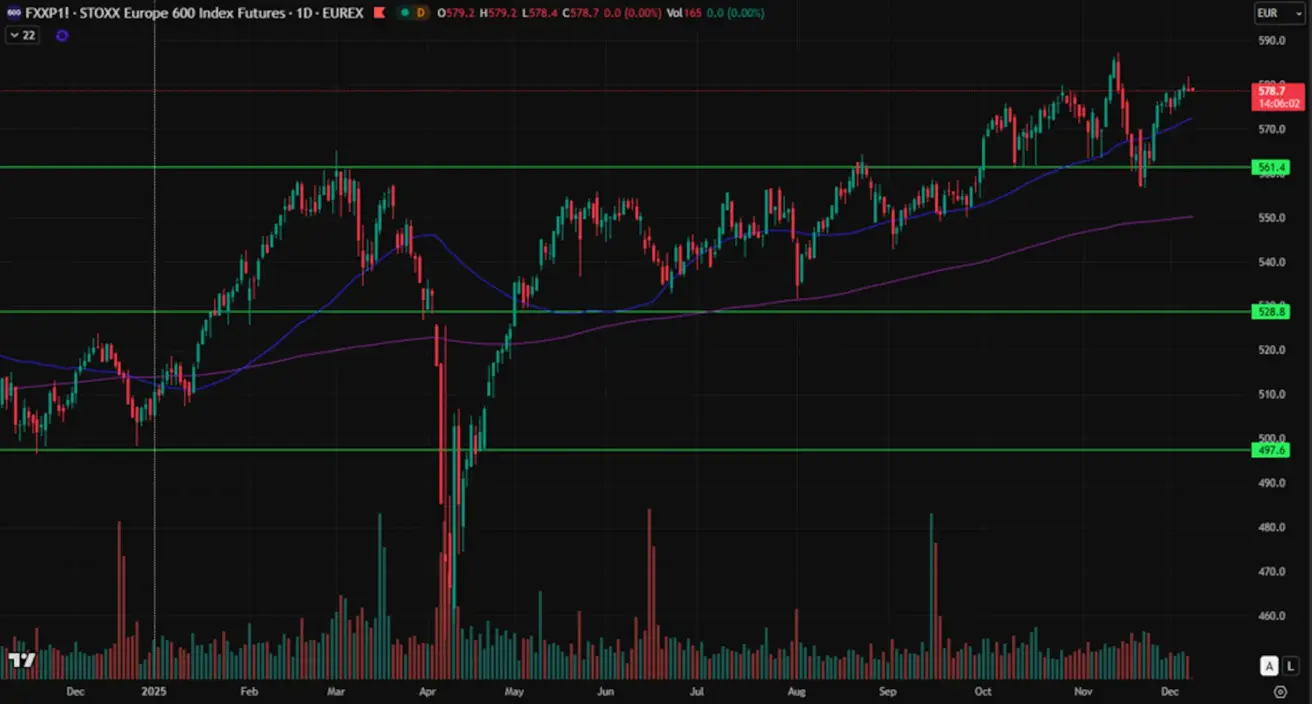
Euro Stoxx 600
Weekly performance: +0.10% (week closed at 578.7). Year-to-date: +14.46%.
China
Loan Prime Rates:
- 1Y Loan Prime Rate (medium-term lending benchmark): 3.50%
- 5Y Loan Prime Rate (key reference for mortgages): 3.50%
Inflation Indicators (October):
- Consumer Price Index (CPI): m/m: +0.2% (prev: –0.3%); y/y: +0.2% (prev: +0.1%)
- Producer Price Index (PPI, y/y): –2.1% (prev: –2.3%)
Labor Market:
- Unemployment rate (October): 5.1% (prev: 5.2%)
Industrial and Investment Data (October):
- Industrial production (y/y): 4.9% (vs. 6.5%)
- Fixed-asset investment (y/y): –1.7% (vs. –0.5%)
Purchasing Managers’ Indices (PMI), November:
- Manufacturing: 49.2 (prev: 49.0)
- Non-manufacturing: 49.0 (prev: 49.x)
- Composite: 49.5 (prev: 50.1)
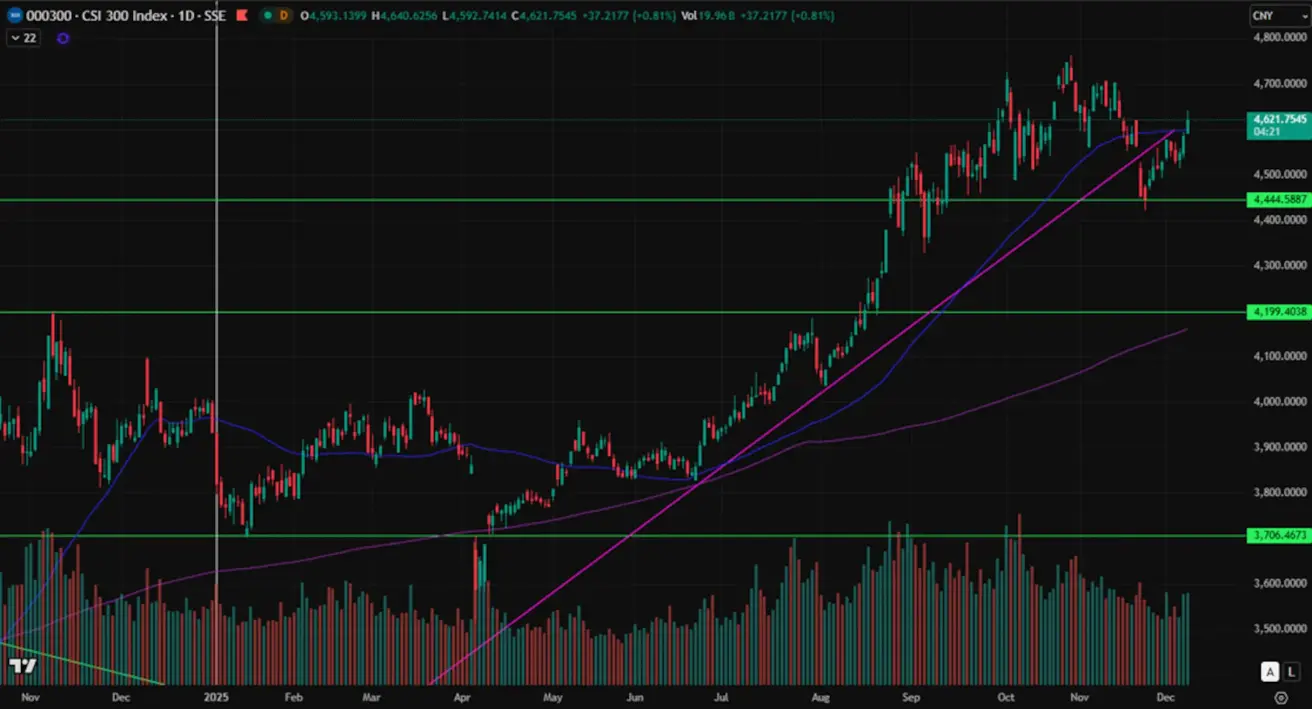
CSI 300 Index
Weekly performance: +1.28% (week closed at 4,584.53). Year-to-date: +16.63%.
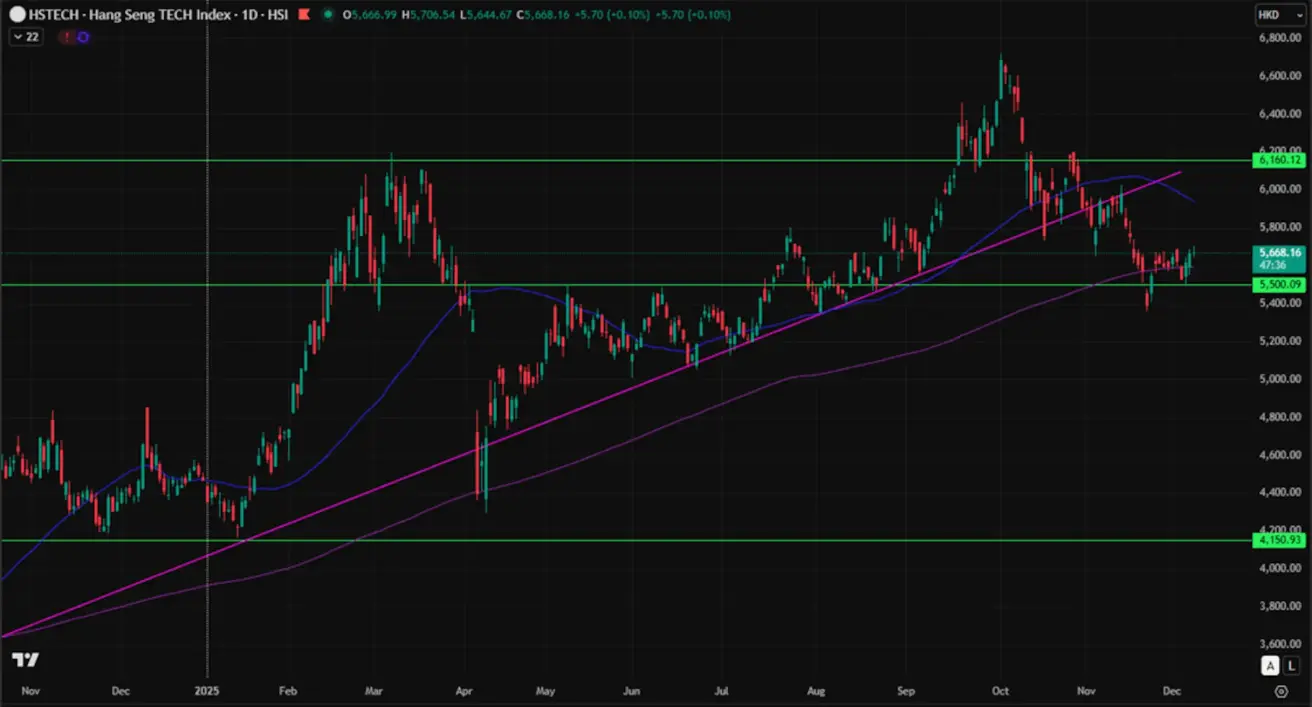
Hang Seng TECH Index (HSTECH.HK)
Weekly performance: +1.13% (week closed at 5,662.46). Year-to-date: +27.63%.
BOND MARKET
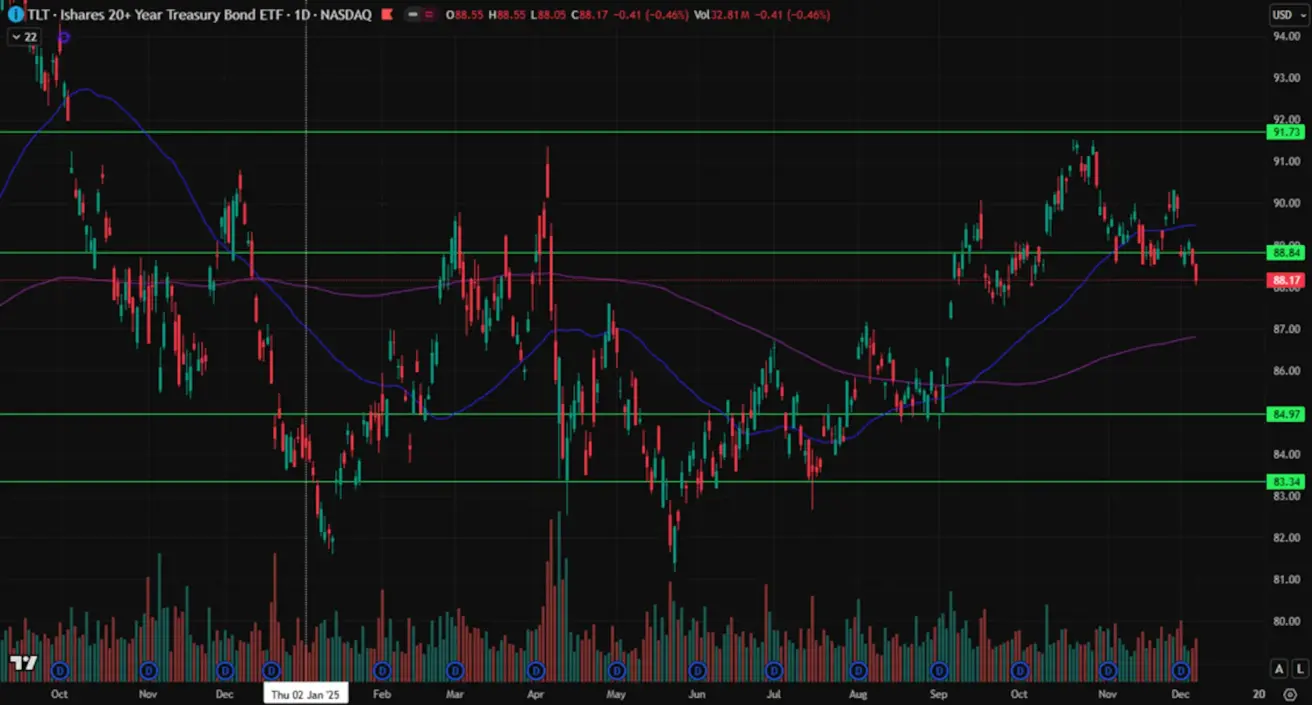
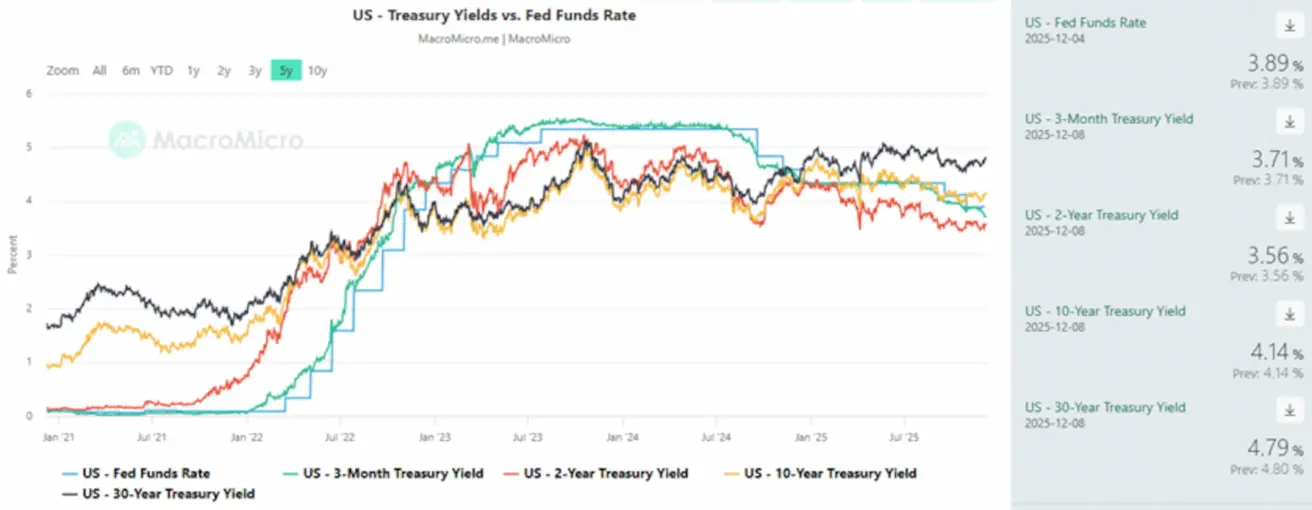
Despite expectations of an upcoming rate cut, yields moved higher across the fixed-income market, both in U.S. Treasuries and in corporate credit.
Long-duration U.S. Treasuries (20+ years, ETF: TLT):
- Weekly performance: –2.26% (week closed at 88.17)
- YTD 2025: +0.42%
Yields and Spreads
- Market Yield on U.S. Treasury Securities, 10-Year Constant Maturity: 4.14% (vs. 4.04%). 2-Year Treasury yield: 3.56% (vs. 3.49%)
- ICE BofA BBB U.S. Corporate Index Effective Yield: 5.02% (vs. 4.94%)
- 10Y–2Y Treasury yield spread: 58 bps (vs. 55 bps)
- 10Y–3M Treasury yield spread: 43 bps (vs. 23 bps)
The cost of the 5-year U.S. credit default swap (CDS) — a hedge against sovereign default — stands at 28.78 bps (vs. 30.13 bps last week).
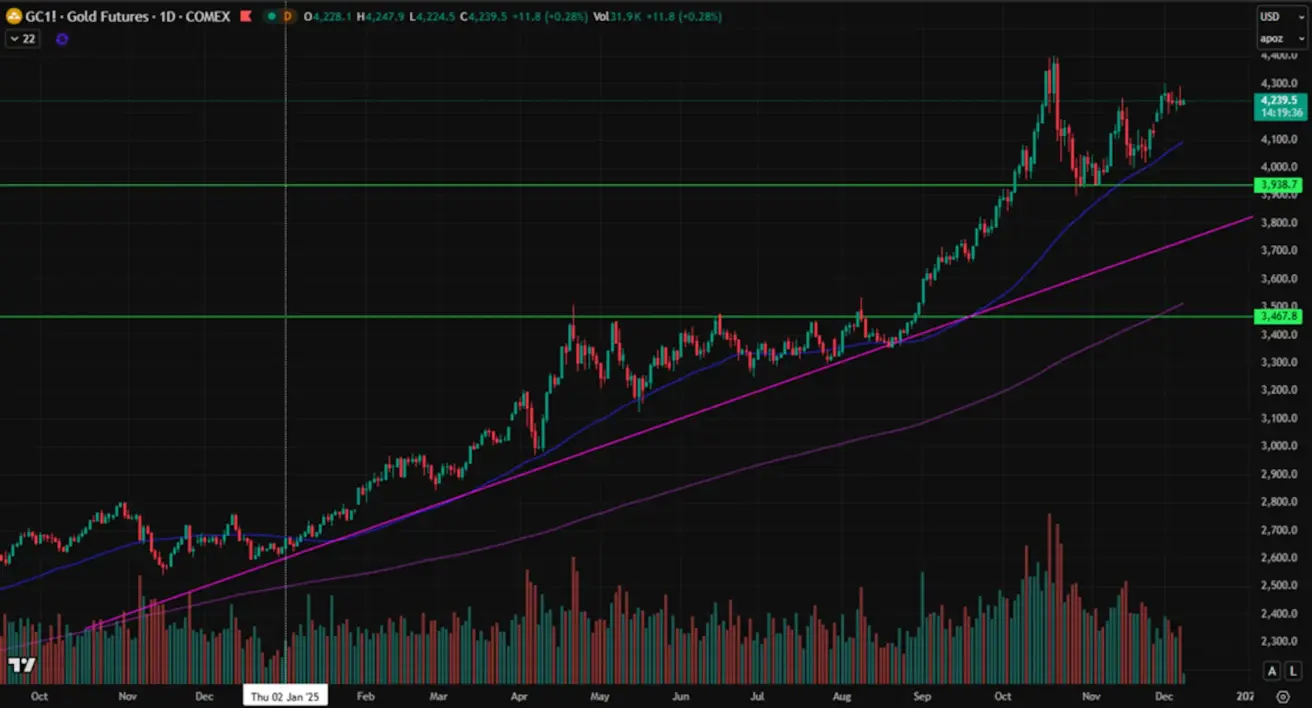
GOLD FUTURES (GC)
Weekly performance: -1.05% (week closed at $4,227.7/oz). Year-to-date: +60.08%.
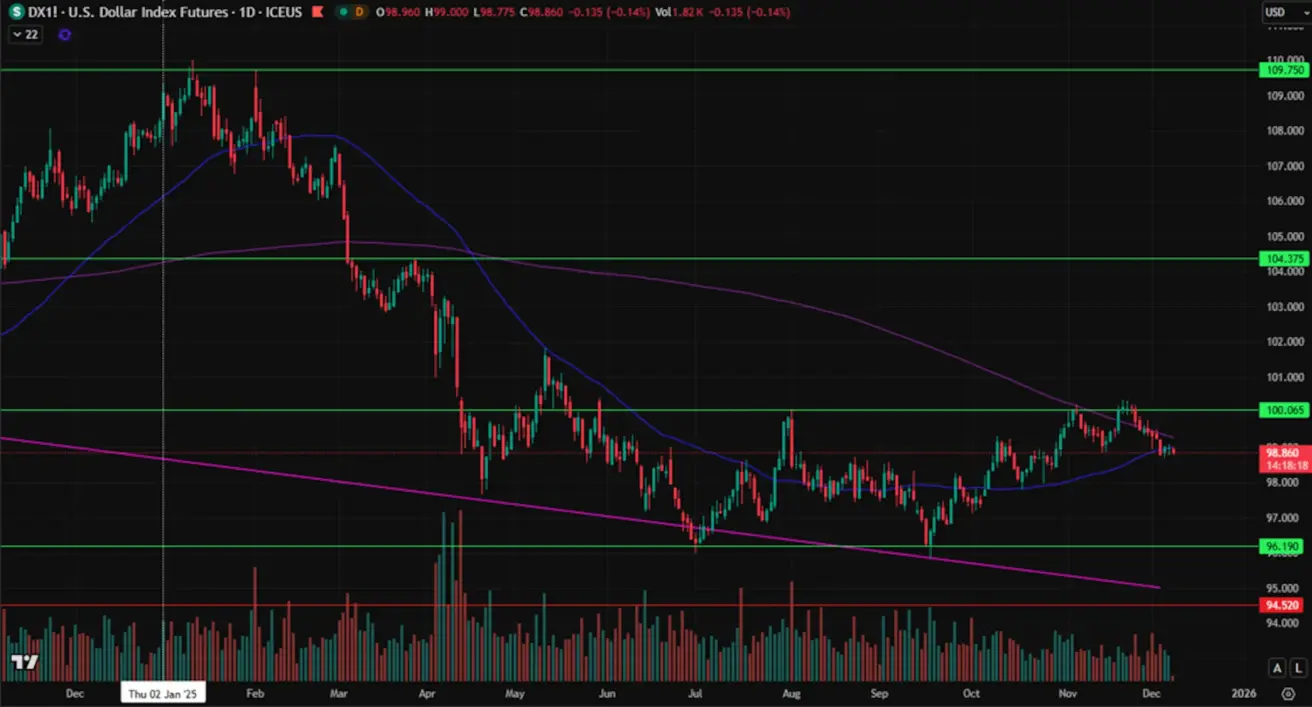
DOLLAR INDEX FUTURES (DX)
Weekly performance: -0.34% (week closed at 98.995). Year-to-date: –8.62%.
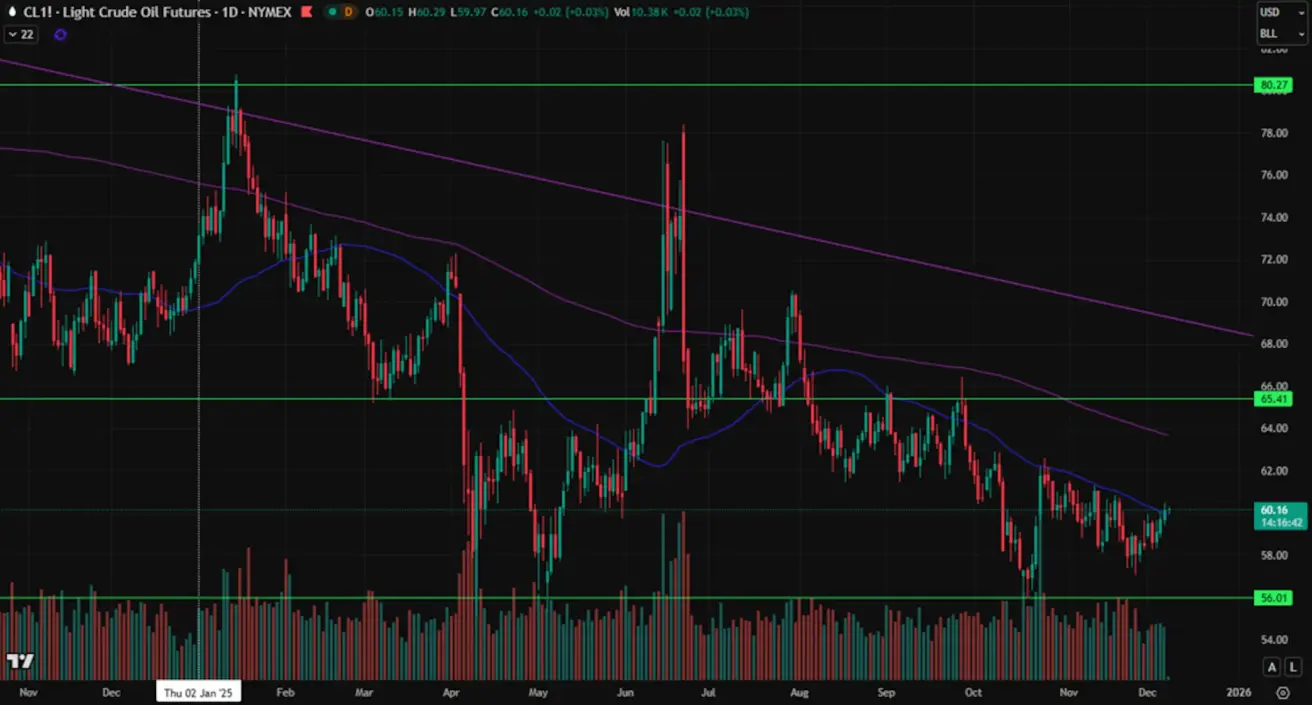
OIL FUTURES
Weekly performance: +2.84% (week closed at $60.14/barrel). Year-to-date: –16.30%.
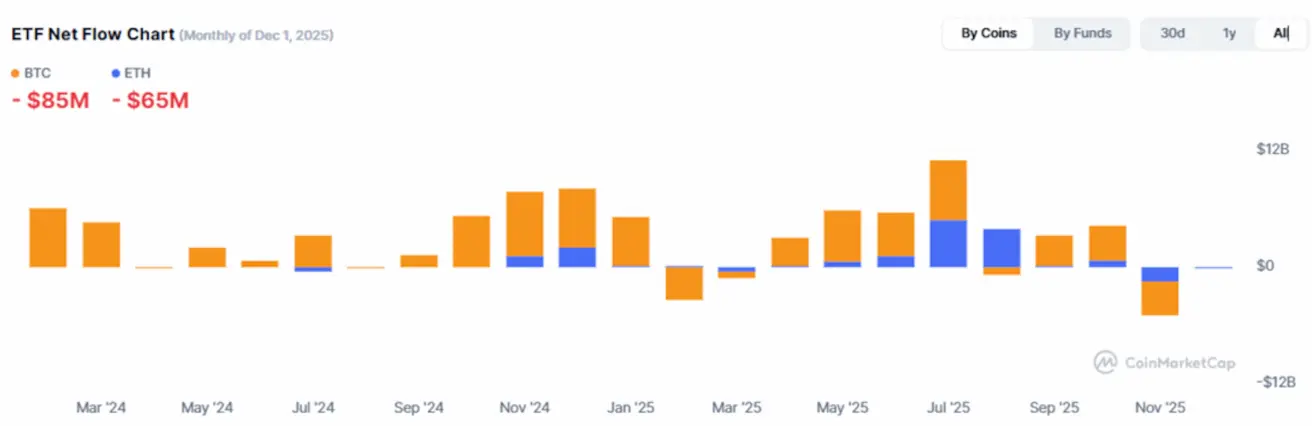
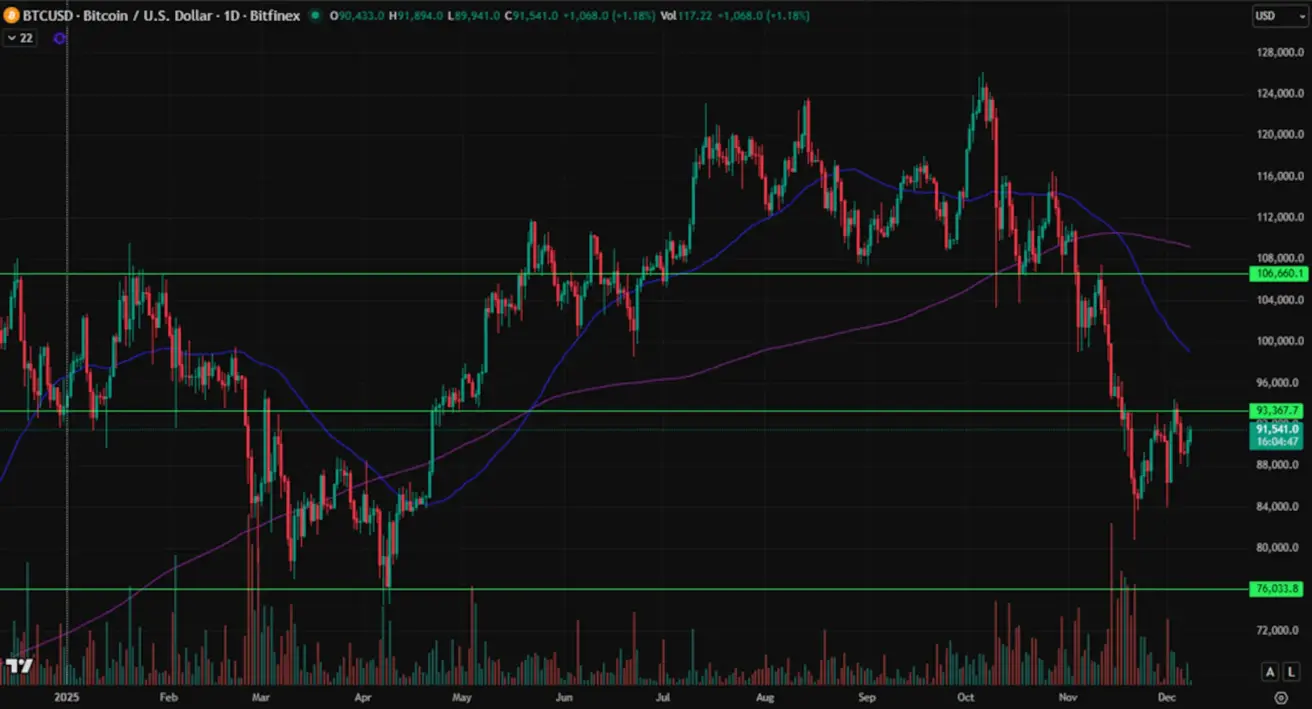
Against the backdrop of further liquidity easing — driven by the government’s reopening and the suspension of quantitative tightening — the cryptocurrency market has begun to recover gradually.
BTC FUTURES
Weekly performance: +0.07% (week closed at $90,473.0). Year-to-date: –3.50%.
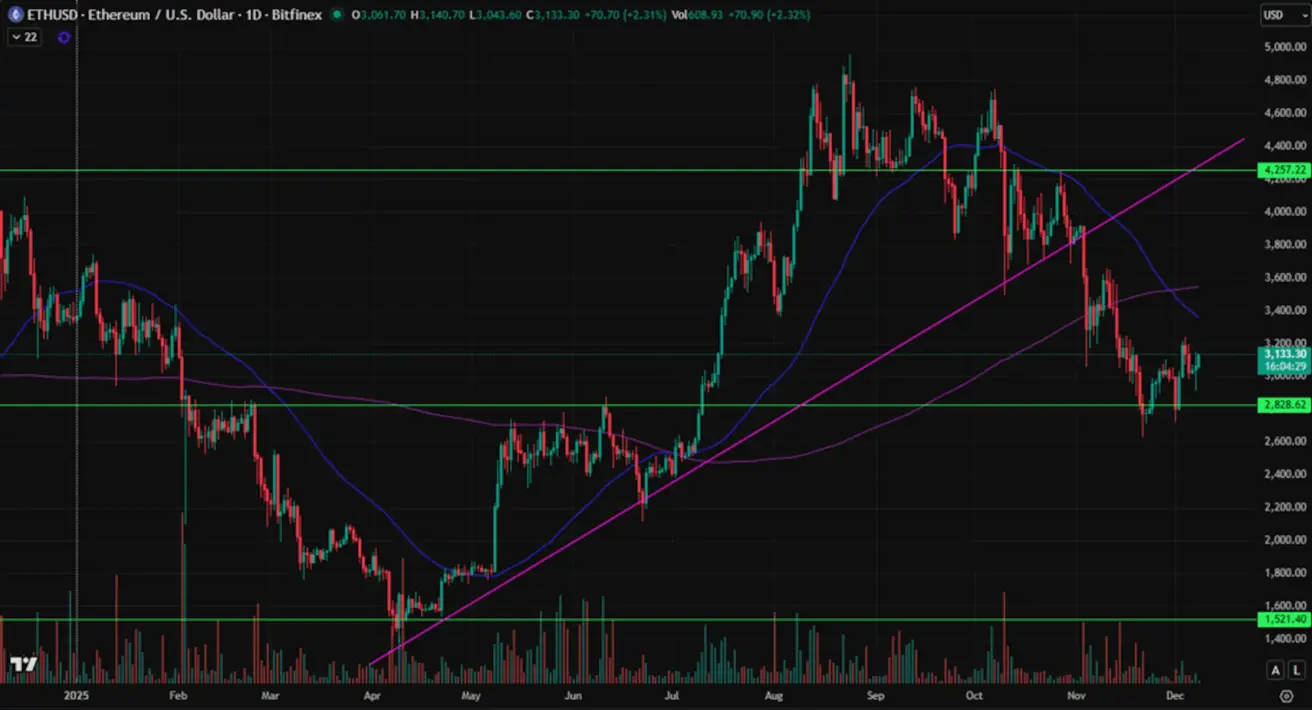
ETH FUTURES
Weekly performance: +2.33% (week closed at $3,062.60). Year-to-date: –8.42%.
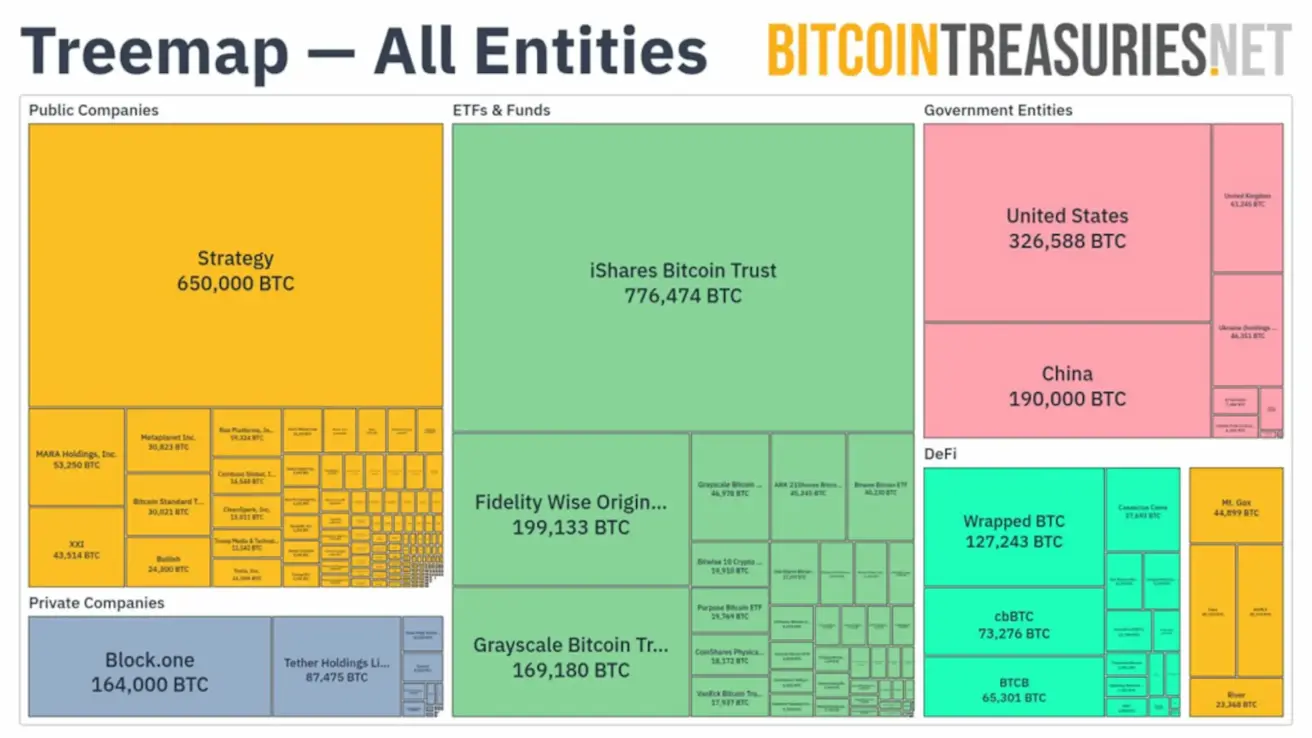
Treasury Bitcoin holdings:
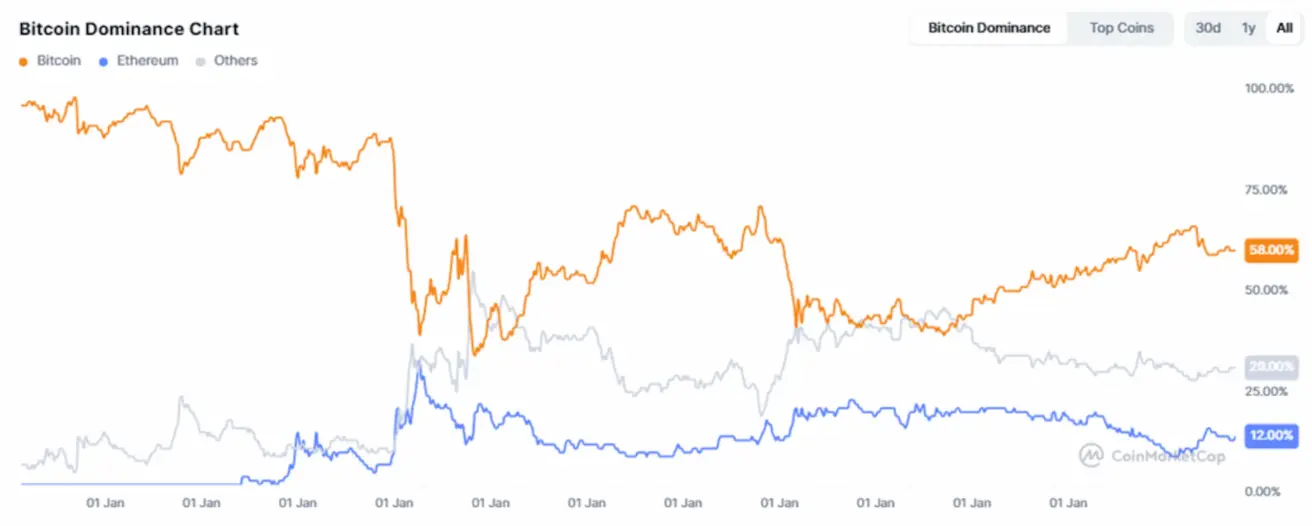
Total cryptocurrency market capitalization: USD 3.11 trillion (vs. USD 2.94 trillion a week earlier), according to CoinMarketCap.
Market share breakdown:
- Bitcoin: 58.7% (prev: 58.7%)
- Ethereum: 12.1% (prev: 11.7%)
- Other cryptoassets: 29.1% (prev: 29.7%)
Public companies pursuing Bitcoin-treasury strategies now hold 5.02% of the total Bitcoin supply on their balance sheets (vs. 4.87% a week earlier).
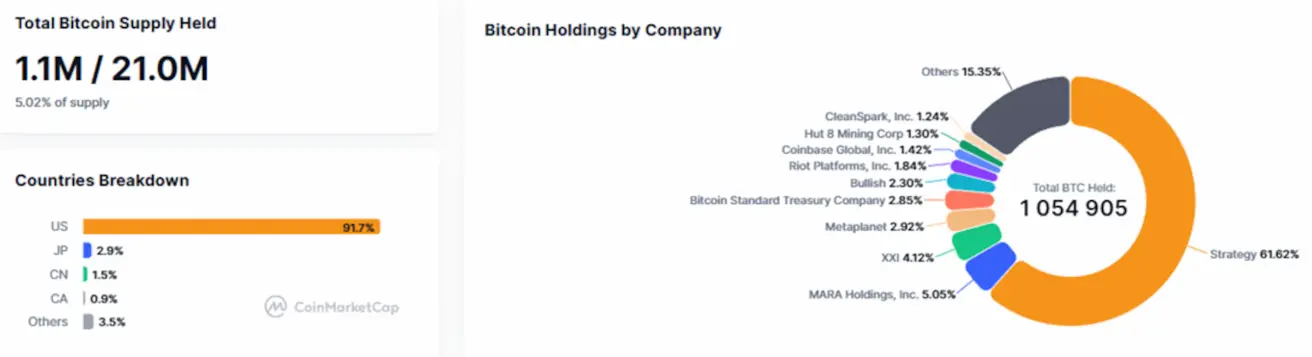
Chart of ETF net flows: