Lietuvių
 Русский
 Қазақша
 Eesti
EestiNovember 24–30, 2025: Weekly economic update
Key market updates

Equity markets were dominated by a positive sentiment, driven by rising expectations of a rate cut and recent Federal Reserve rhetoric. In particular, Stephen I. Miran (a Trump-aligned economist) argued that the current economic environment requires a substantial reduction in interest rates.
Kevin Hassett, Director of the White House National Economic Council, has emerged as the leading contender for the role of the next Fed Chair — a candidate widely viewed as most aligned with Trump’s preference for lower interest rates.
According to the regional business contacts survey, the latest Beige Book indicated a slight decline in U.S. employment levels, further reinforcing expectations of a more “dovish” outcome at the December FOMC meeting.
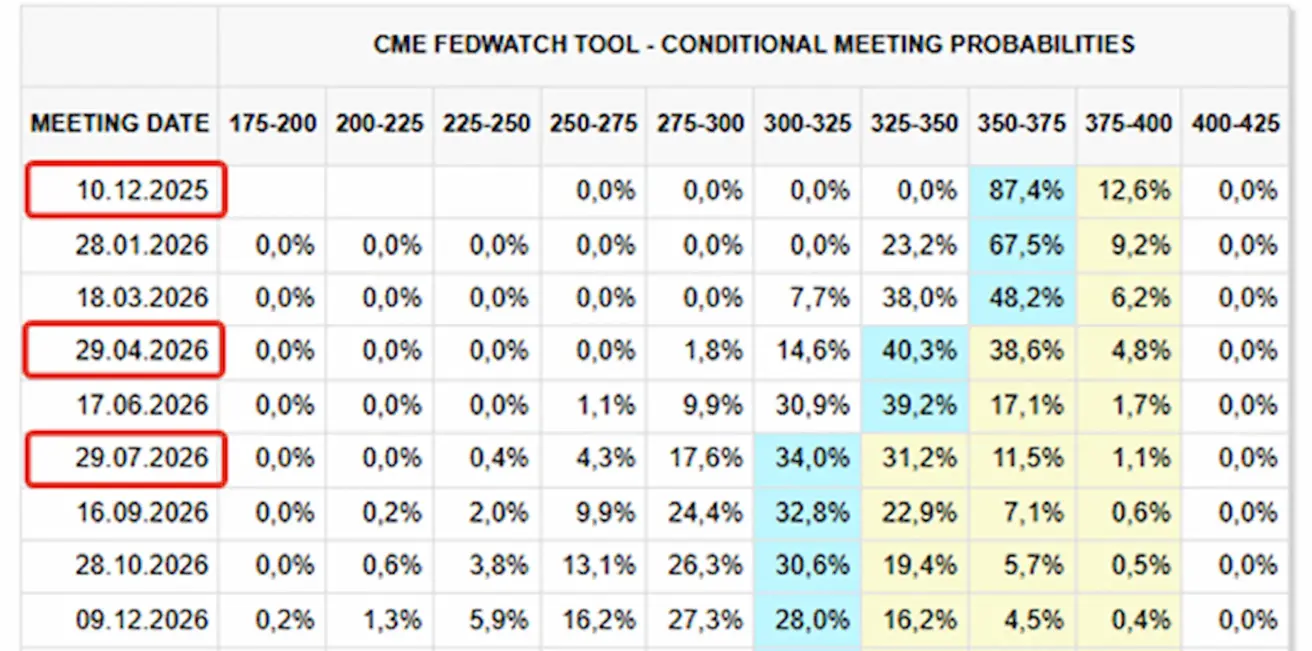
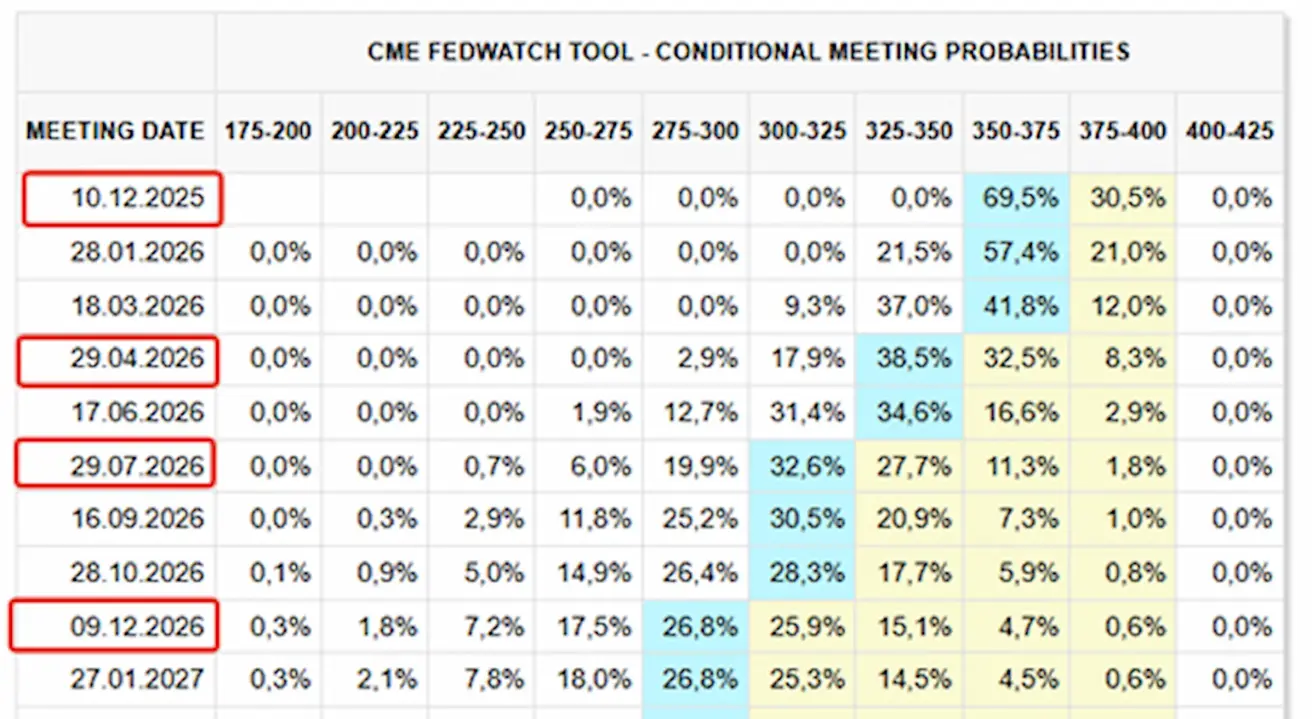
Market-based expectations reflected this shift as well, according to FedWatch:
- For the upcoming meeting on December 10: the estimated probability of a 25 bps rate cut stands at 87.4%.
- Over the next 12 months: the market is pricing in three 25 bps cuts, bringing the target range down to 3.00 – 3.25%.
Macroeconomic Statistics
INFLATION (September)
- Core Consumer Price Index (CPI) (m/m): 0,2% (previous: 0.3%)
- Consumer Price Index (CPI) (m/m): 0.3% (previous: 0.4%)
- Core Consumer Price Index (CPI) (y/y): 3.0% (previous: 3.1%)
- Consumer Price Index (CPI) (y/y): 3.0% (previous: 2.9%)
Producer Price Index (September):
- PPI (m/m): 0.3% (prev: -0.1%)
- Core PPI (m/m): 0.1% (prev: -0.1%)
INFLATION EXPECTATIONS (MICHIGAN)
- 12-month expected inflation (November): 4.5% (prev: 4.6%)
- 5-year expected inflation (November): 3.4% (prev: 3.9%)
GDP (U.S. Bureau of Economic Analysis, BEA) (Q2 2025, annualized, third estimate): +3.8% (advance estimate: +3.30%; Q1 2024: – 0.5%). Atlanta Fed GDPNow estimate for Q2: 3.9% (vs. 4.0%).
Business Activity Index (PMI) (October)
(Above 50 indicates expansion; below 50 indicates contraction)
- Services sector: 54.8 (previous: 54.2)
- Manufacturing sector: 52.5 (previous: 52.5)
- S&P Global Composite: 54.6 (previous: 53.8)
LABOR MARKET (Data for September, BLS; October figures will be released later together with the November report)
- The labor-market data exceeded expectations across several indicators:
- Unemployment rate: 4.4% (previous: 4.3%)
- Total continuing jobless claims: 1.960M (vs 1.953M)
- Initial jobless claims: 216K (vs 222K)
- Nonfarm payrolls (change): 119K (prev: -4K)
- Private nonfarm payrolls (change): 97K (prev: 18K)
- Average hourly earnings (y/y): 3.8% (prev: 3.8%)
- JOLTS job openings: — (vs 7.227M)
- ADP employment change (October): -13.50K (vs -2.50K)
Private employers added new jobs in October for the first time since July, although the number of hires remained modest compared with figures published earlier this year. Meanwhile, wage growth has shown virtually no change for over a year, indicating a balanced adjustment between labor supply and demand.
MONETARY POLICY
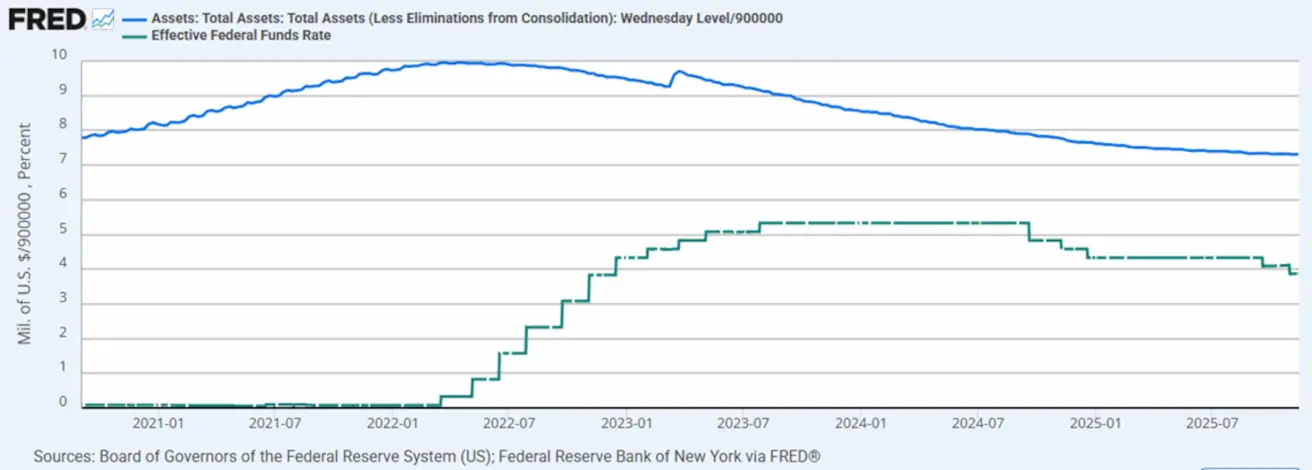
- Federal Funds Effective Rate (EFFR): 3.75% - 4.0%
- Federal Reserve balance sheet increased: $6,552T (vs. previous week: $6,55T)
MARKET FORECAST FOR RATE (FEDWATCH)
Expectations for the upcoming FOMC meeting on December 10:
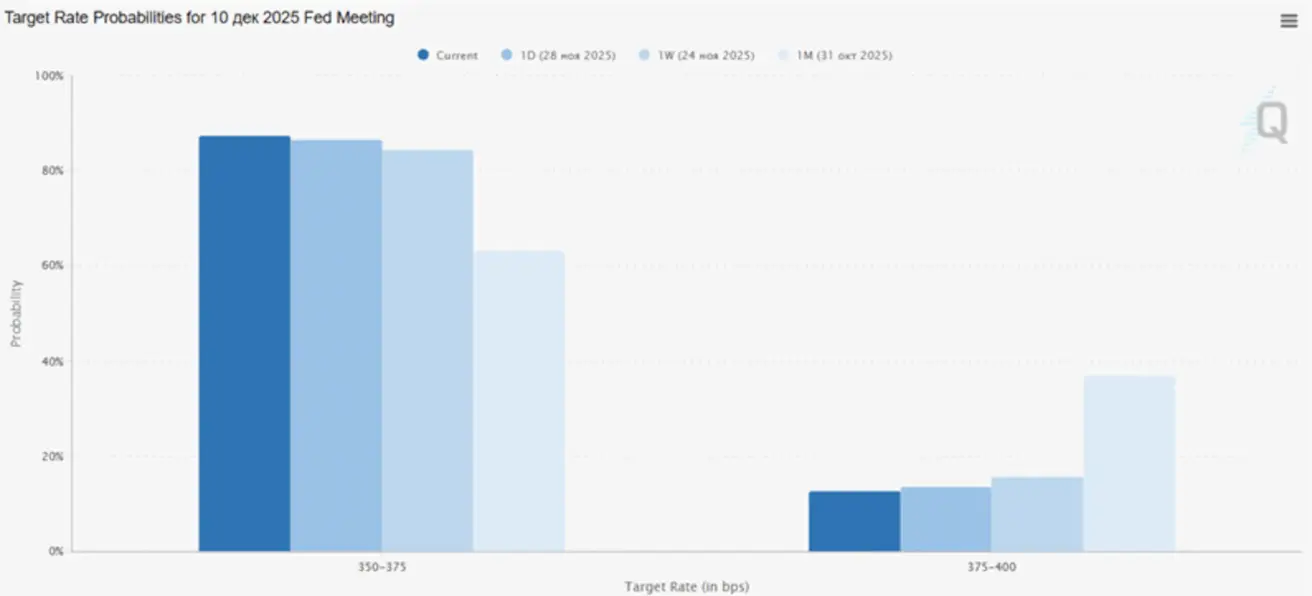
Today:
А week earlier:
Market
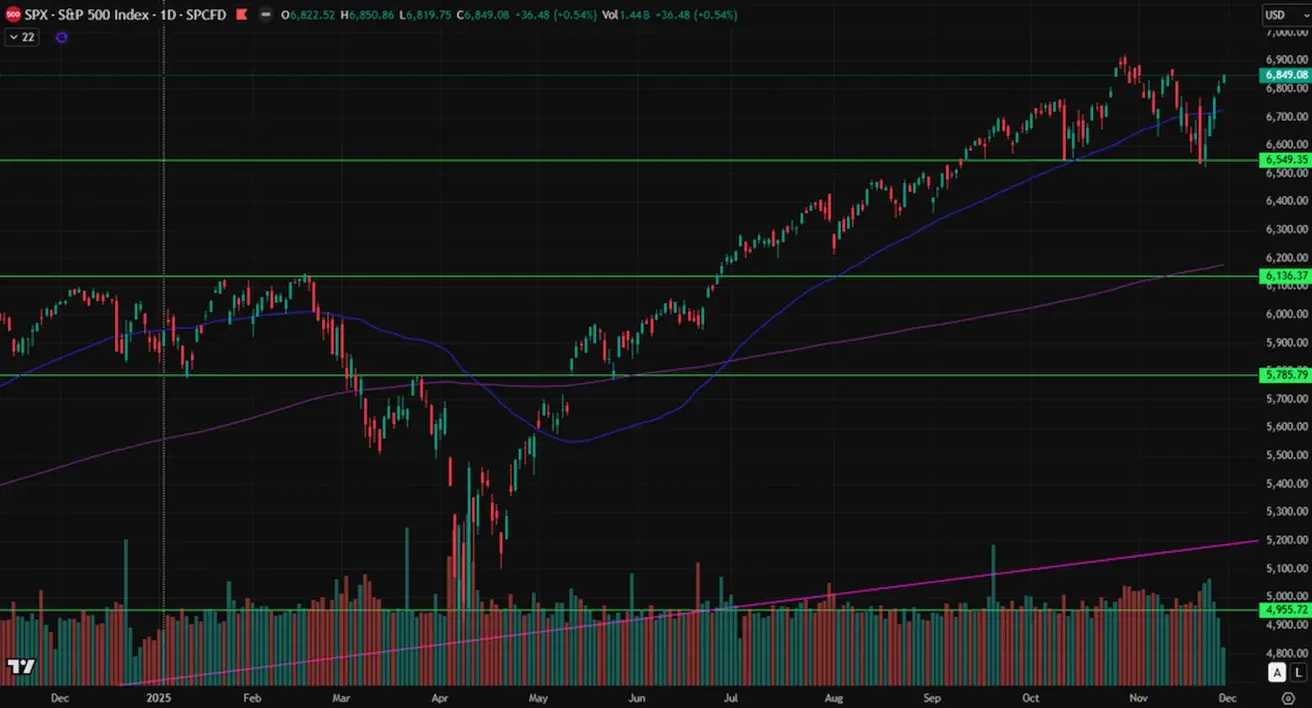
SP500
Weekly performance: +3,73% (week closed at 6,849.08). Year-to-date performance for 2025: +16.02%.
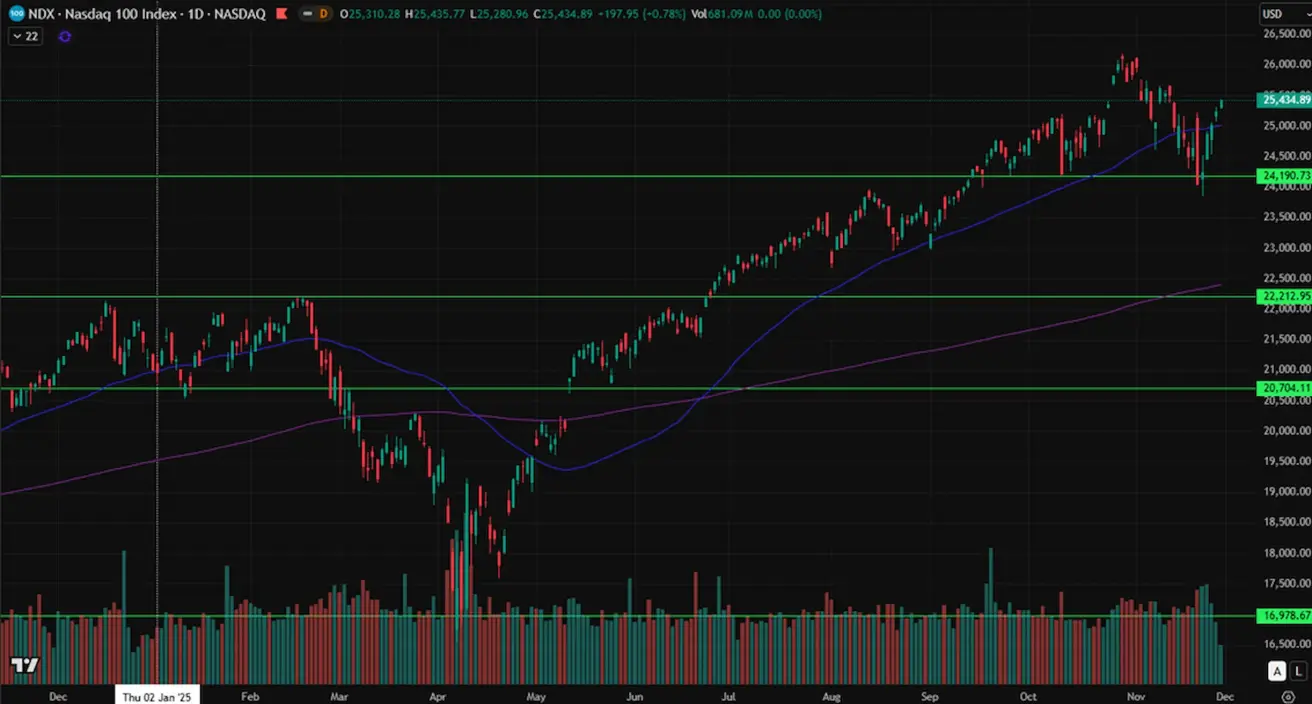
NASDAQ100
Weekly performance: +4.93% (week closed at 25,434.89). Year-to-date: +20.43%.
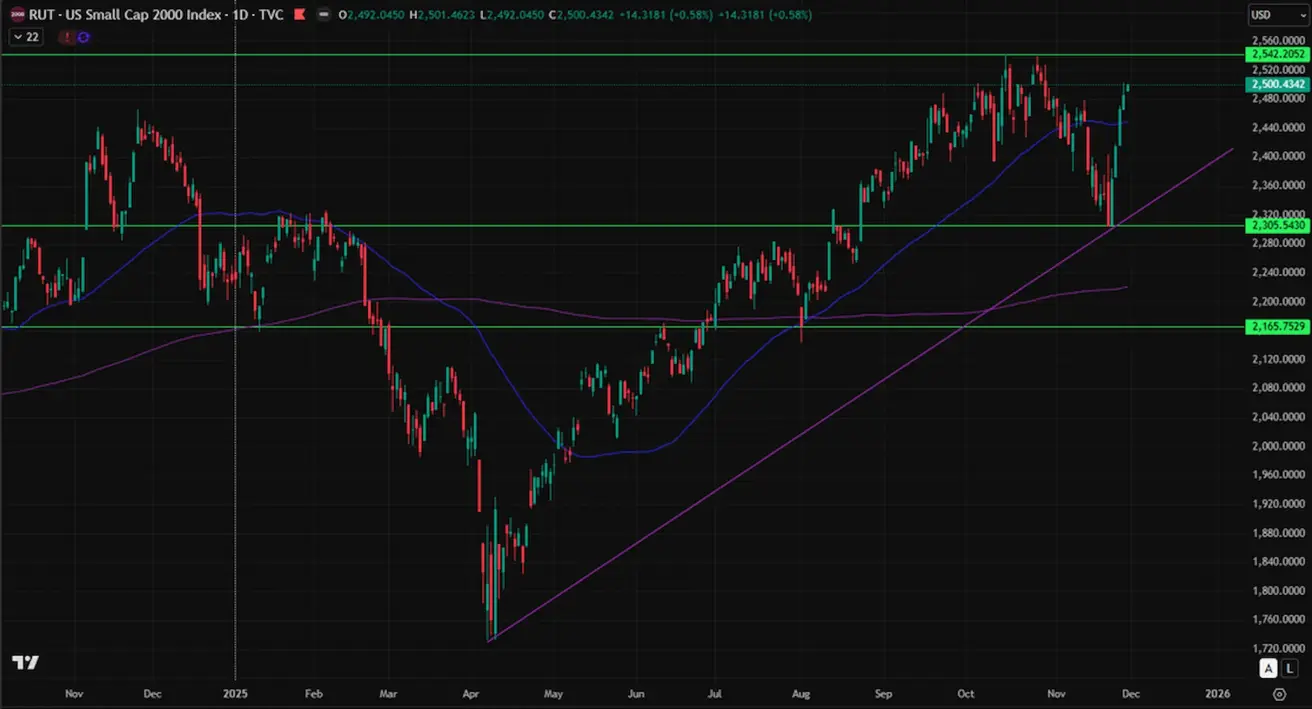
Russel 2000 (RUT)
Weekly performance: +5.52% (weekly close: 2,500.4342). Year-to-date performance: +11.57%.
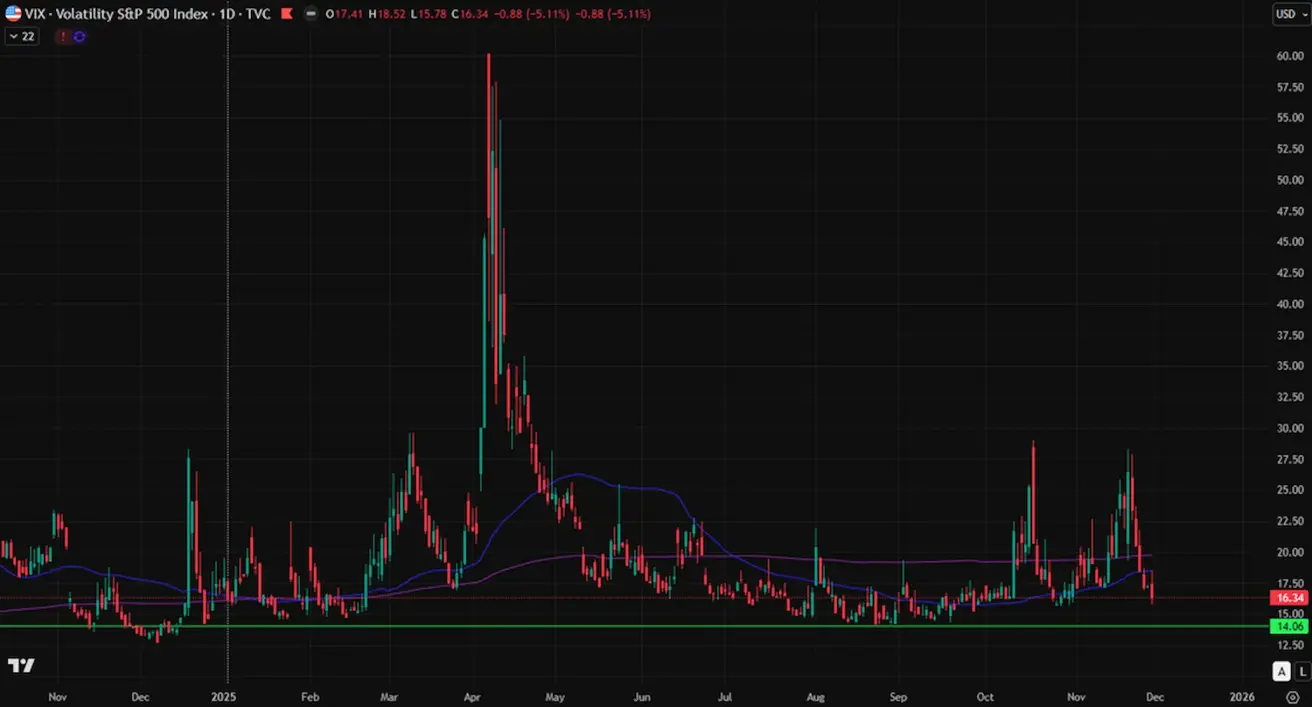
VIX
Closed the week at 16.34.
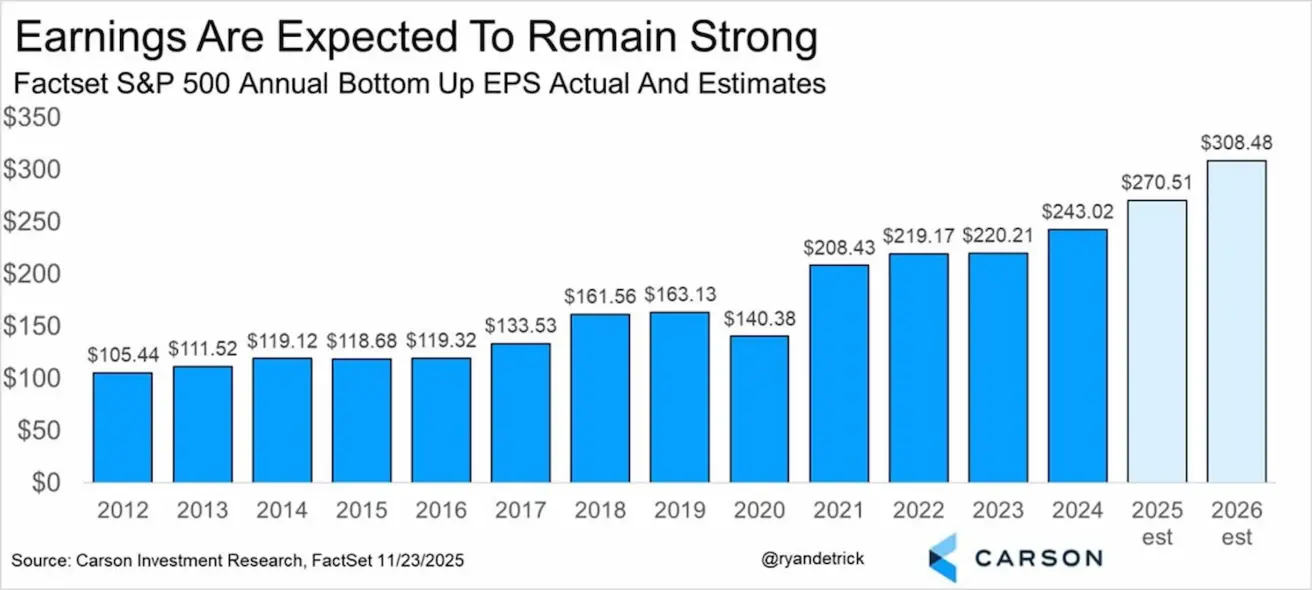
According to forecasts from CarsonIR and FactSet, earnings growth for S&P 500 companies is expected to reach +11.31% in 2025, followed by an increase of 14.04% in 2026.
Eurozone
Interest Rates:
- Deposit facility rate: 2.0% (prev: 2.0%)
- Marginal lending facility rate: 2.4% (prev: 2.4%)
- Main refinancing rate: 2.15% (prev: 2.15%)
Inflation — Consumer Price Index (CPI), October:
- Core CPI (y/y): 2.4% (prev: 2.4%)
Headline CPI:
- (m/m): 0.2% (prev: 0.1%)
- (y/y): 2.1% (prev: 2.2%)
GDP for 3Q:
- (q/q): 0.2% (prev: 0.1%)
- (y/y): slowed to 1.4% (prev: 1.5%)
- Unemployment rate (October): 6.3% (prev: 6.3%)
PMI Indices (October):
- Services PMI: 53.1 (prev: 53.0)
- Manufacturing PMI: 49.7 (prev: 50.0)
- S&P Global Composite PMI: 52.4 (prev: 52.5)
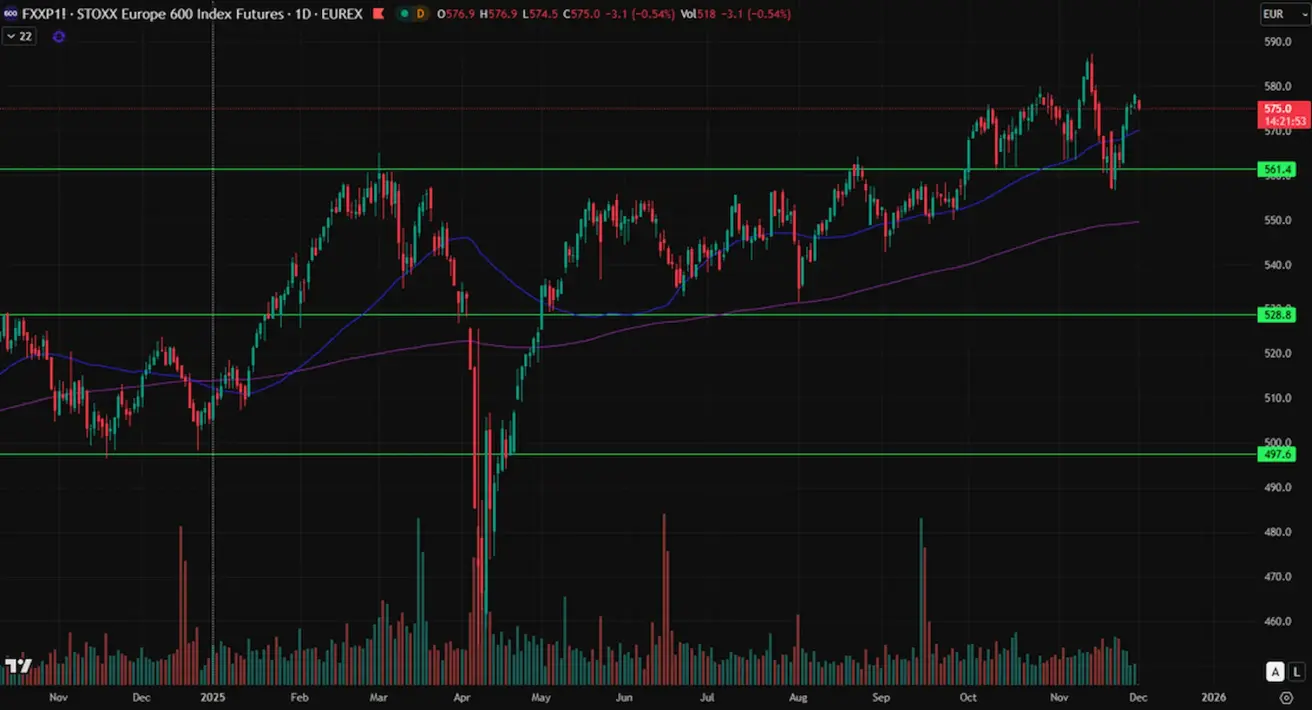
Euro Stoxx 600
Weekly performance: 2.30% (week closed at 578.1). Year-to-date: +14.34%.
China
- 1Y Loan Prime Rate (medium-term lending): 3.50%
- 5Y Loan Prime Rate (key benchmark for mortgages): 3.50%
Inflation indicators (October) — deflation has now receded:
Consumer Price Index (CPI):
-
(m/m): 0.2% (prev: -0.3%)
-
(y/y): 0.2% (prev: 0.1%)
-
Producer Price Index (PPI, y/y): -2.1% (prev: -2.3%)
-
Unemployment rate (October): 5.1% (prev: 5.2%)
-
Industrial production (October, y/y): 4.9% (vs 6.5%)
-
Fixed asset investment (October, y/y): -1.7% (vs -0.5%)
PMI Indices (November):
- Manufacturing PMI: 49.2 (prev: 49.0)
- Non-manufacturing PMI: 49.0 (prev: 49.8)
- Composite PMI: 49.7 (prev: 50.1)
CSI 300 Index
Weekly performance: +1.64% (week closed at 4,526.6616). Year-to-date: +15.15%.
. Year-to-date: +15.15%.)
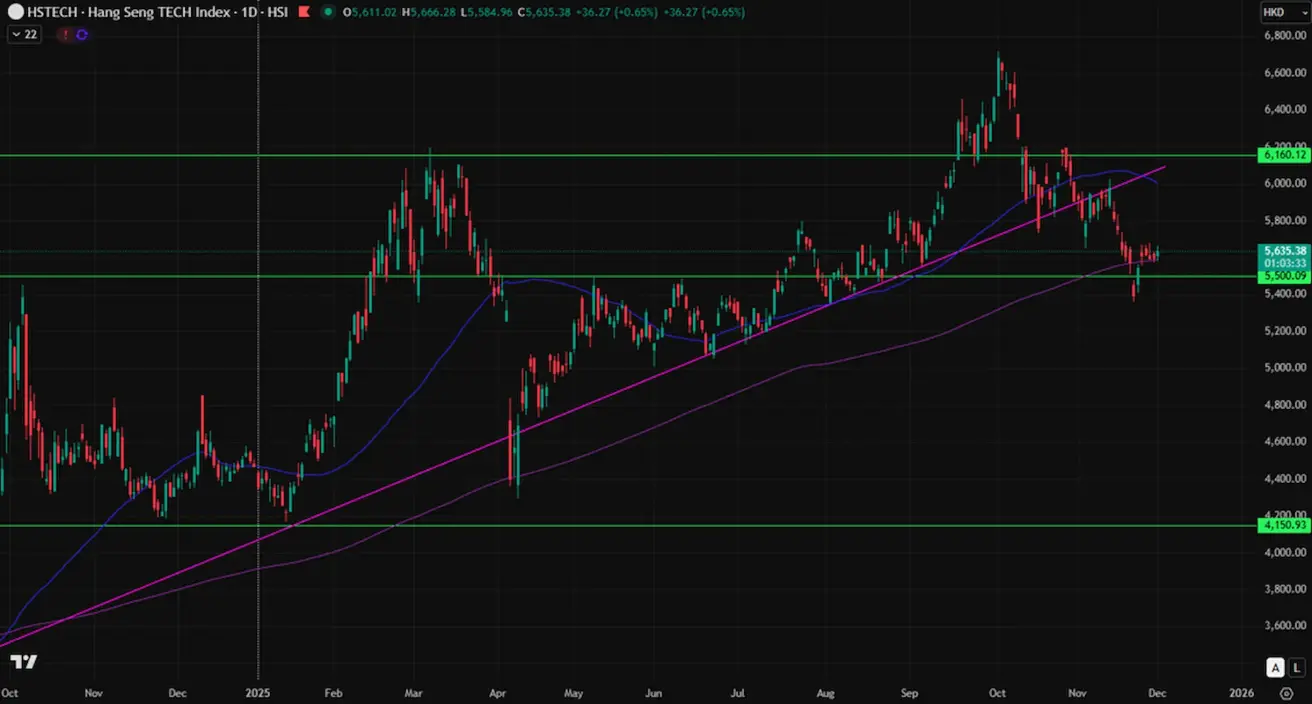
Hang Seng TECH Index (HSTECH.HK)
Weekly performance: +3.77% (week closed at 5,599). Year-to-date: +26.20%.
Kazakhstan
The Monetary Policy Committee of the National Bank of the Republic of Kazakhstan decided to keep the base rate unchanged at 18.0% per annum, with a corridor of ±1 pp. The regulator also noted that, at this stage, it does not see room for rate cuts before the end of the first half of 2026.
The NBK did not rule out the possibility of further monetary tightening should there be no convincing signs of a persistent disinflationary trend.
Annual inflation stood at 12.6% in October (vs 12.9% in September).
- Food inflation continued to accelerate to 13.5% (prev: 12.7%).
- Non-food inflation rose to 11% (prev: 10.8%).
- Services inflation slowed to 12.9% (prev: 15.3%).
The inflation forecast for 2026 has been revised to a baseline range of 9.5–12.5%. By the end of 2027, inflation is expected to slow to 5.5–7.5%.
Economic growth in 2026 is projected at 3.5–4.5%. The tenge has strengthened by nearly 5%, supported by FX interventions from the National Oil Fund.
BOND MARKET – Decline in Yields (Rise in Prices)
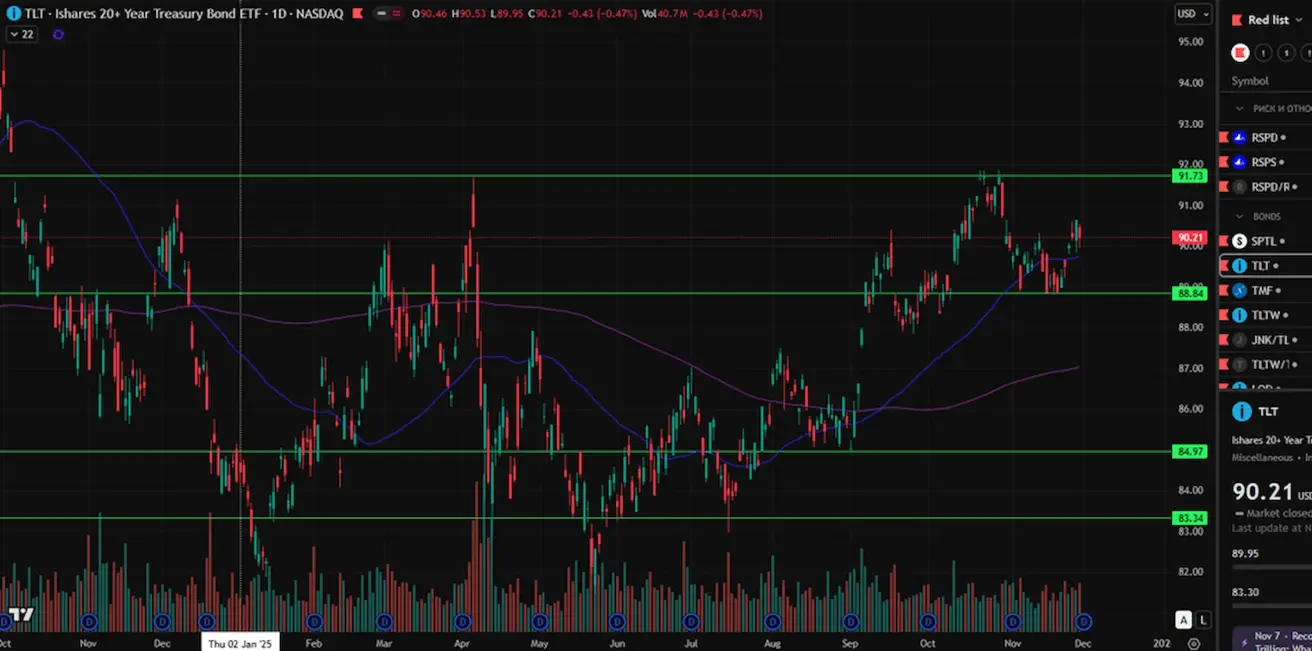
U.S. Treasuries 20+ Years (ETF: TLT): Weekly performance: +0.69% (week closed at 90.21). Year-to-date: +2.74%.
Yields and Spreads
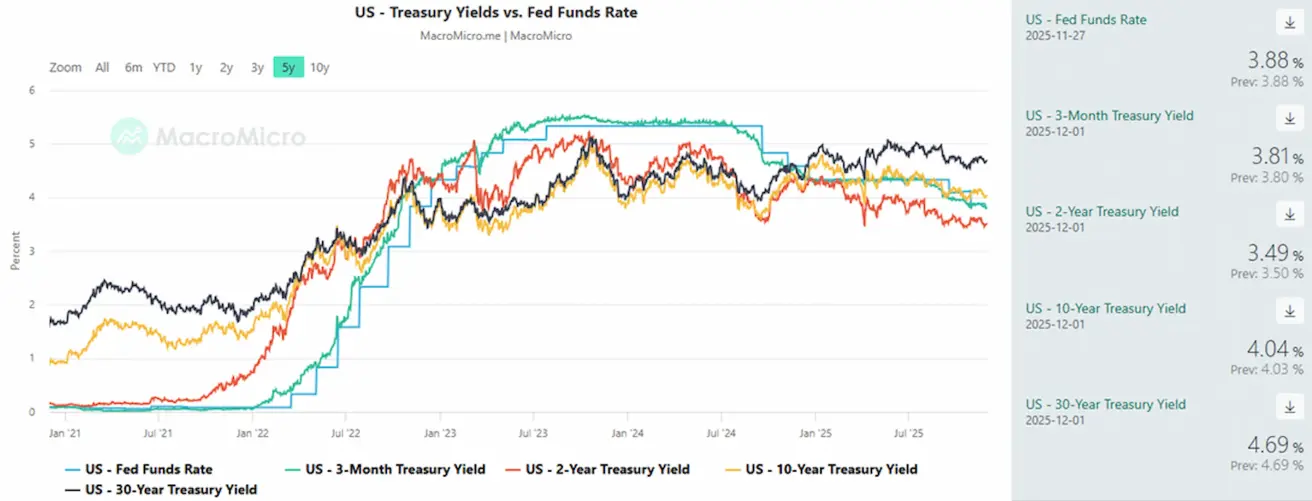
- Market Yield on U.S. Treasury Securities (10-year constant maturity): 4.04% (vs 4.06%) 2-year Treasury yield: 3.49% (vs 3.51%)
- ICE BofA BBB US Corporate Index Effective Yield: 4.94% (vs 5.05%)
- 10Y–2Y Treasury yield spread: 55.0 bps (vs 55.0 bps)
- 10Y–3M Treasury yield spread: 23.0 bps (vs 22.0 bps)
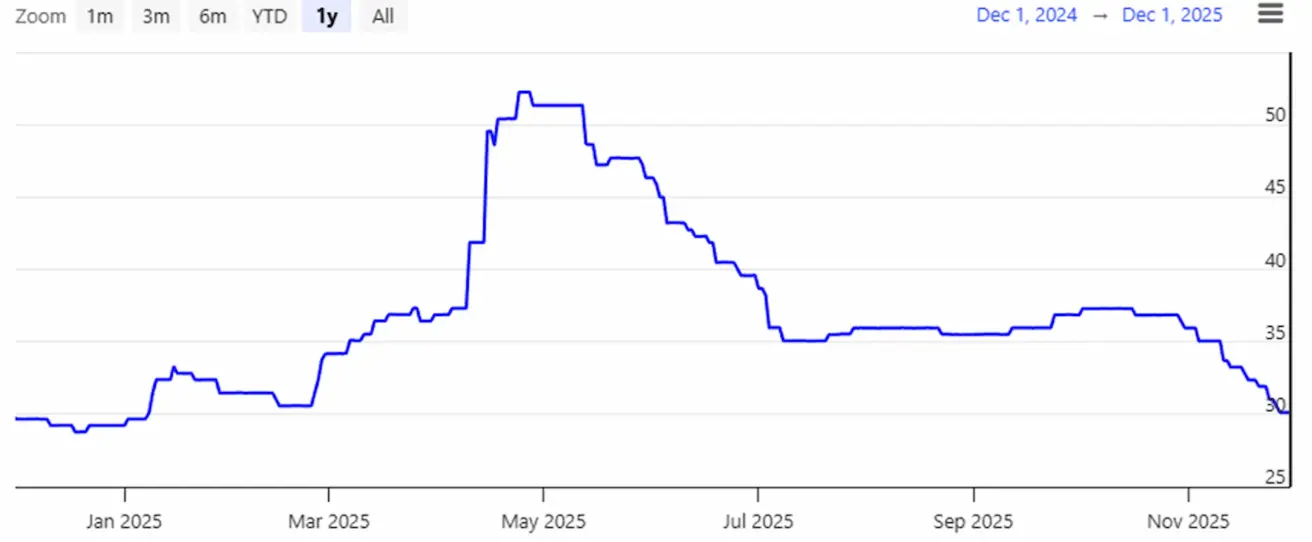
The cost of the 5-year U.S. credit default swap (CDS) — a measure of default insurance — continued to decline, reaching 30.13 bps (vs 31.93 bps last week).
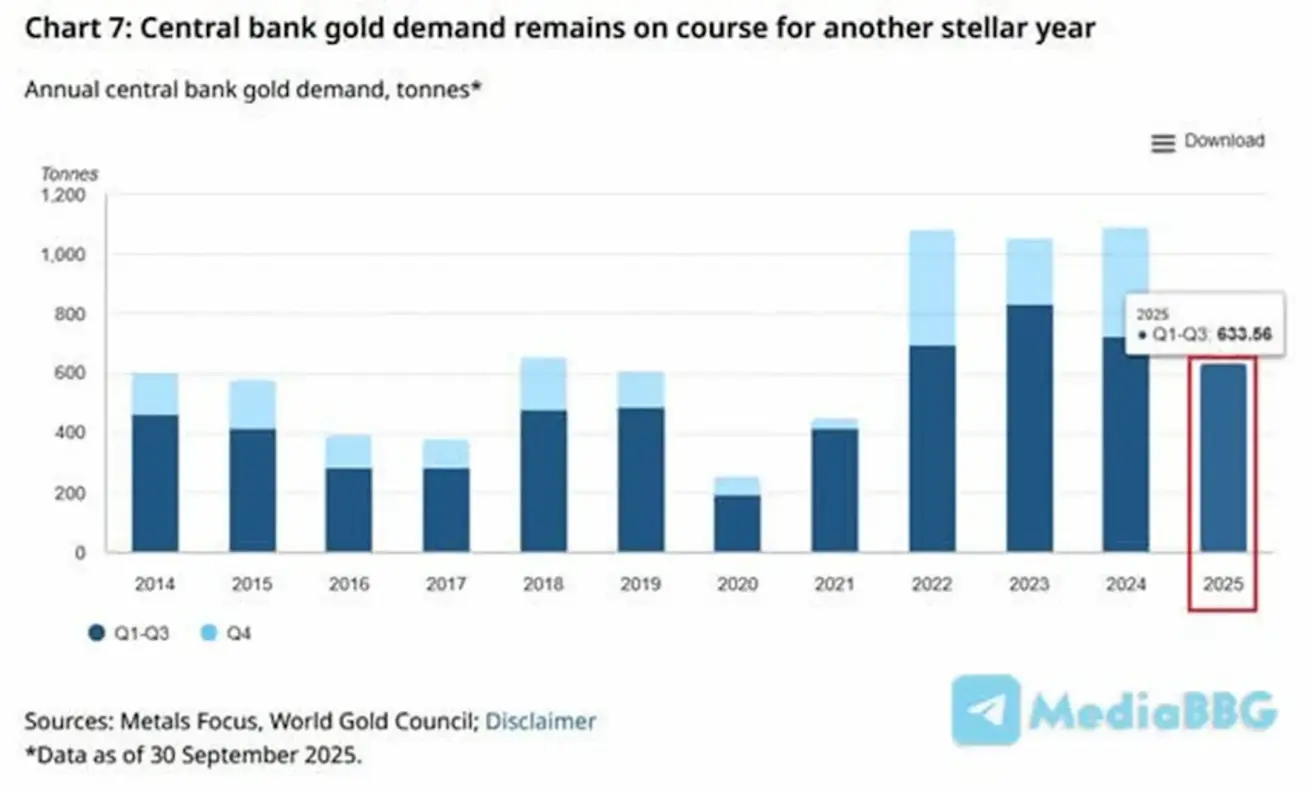
GOLD FUTURES (GC)
Weekly performance: +5.26% (week closed at $4,272.7/oz). Year-to-date: +61.68%.
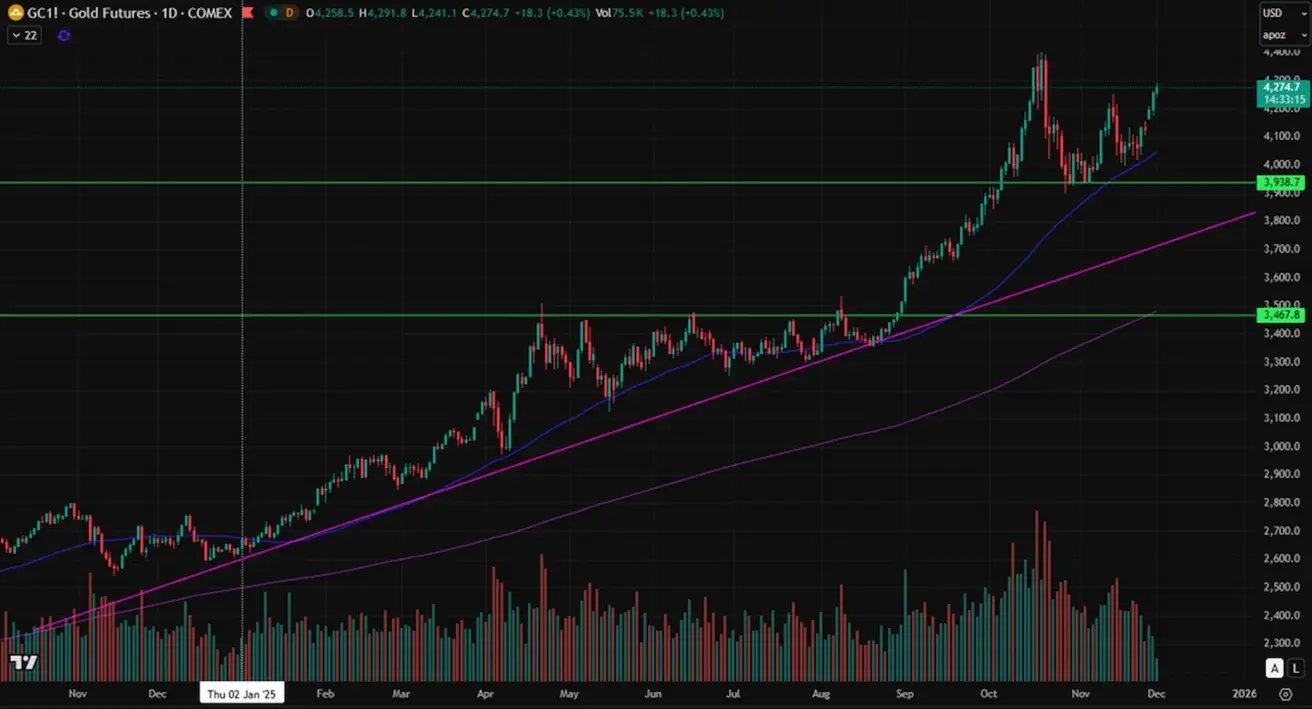
Global central banks continued to actively increase their gold reserves, reaching a total of 633 tonnes over the first three quarters of 2025.
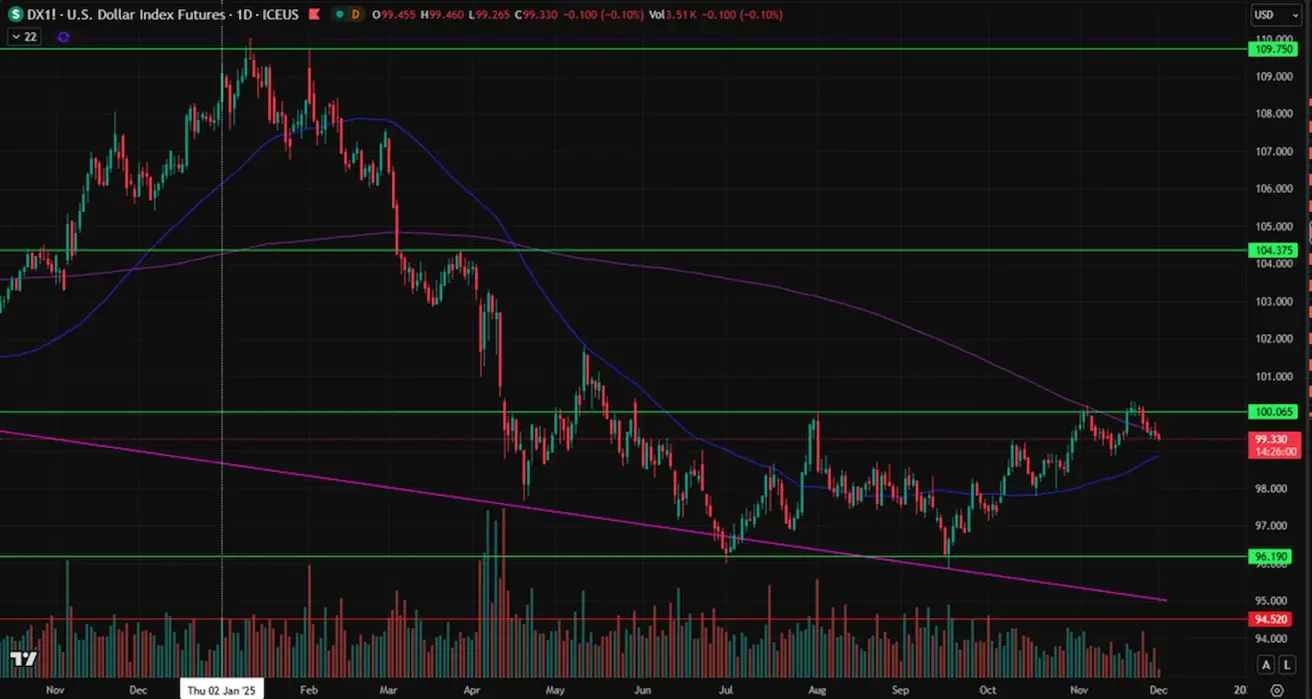
DOLLAR INDEX FUTURES (DX)
Weekly performance: -0.77% (week closed at 99.33). Year-to-date: –8.31%.
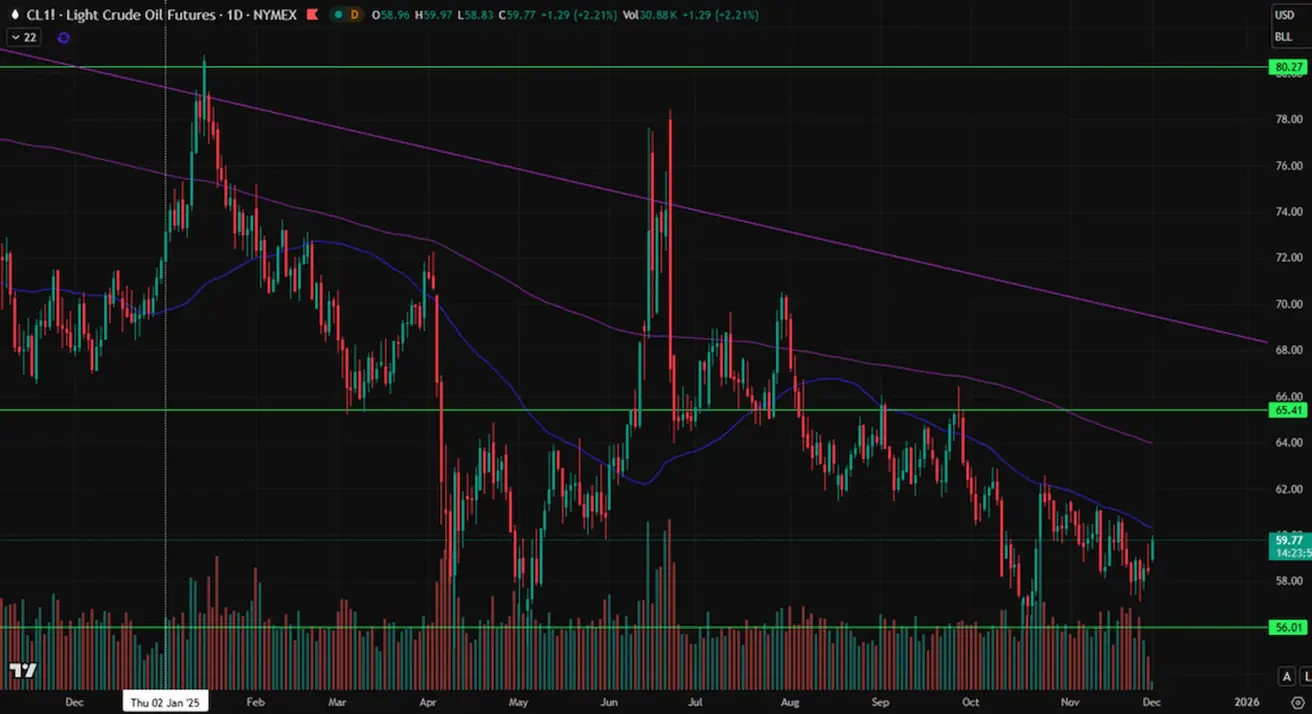
OIL FUTURES
Weekly performance: +0.86% (week closed at $58.48/barrel). Year-to-date: –18.61%.
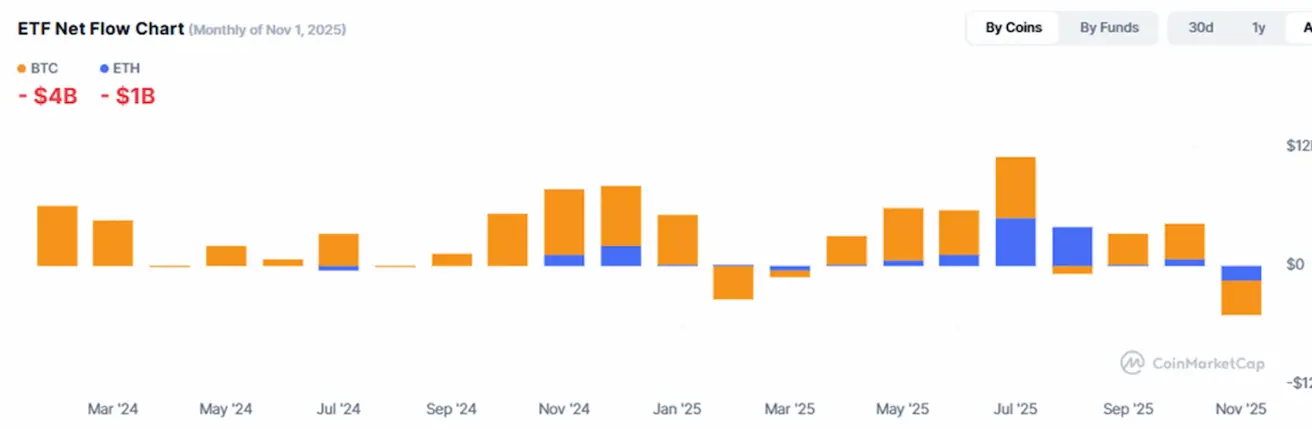
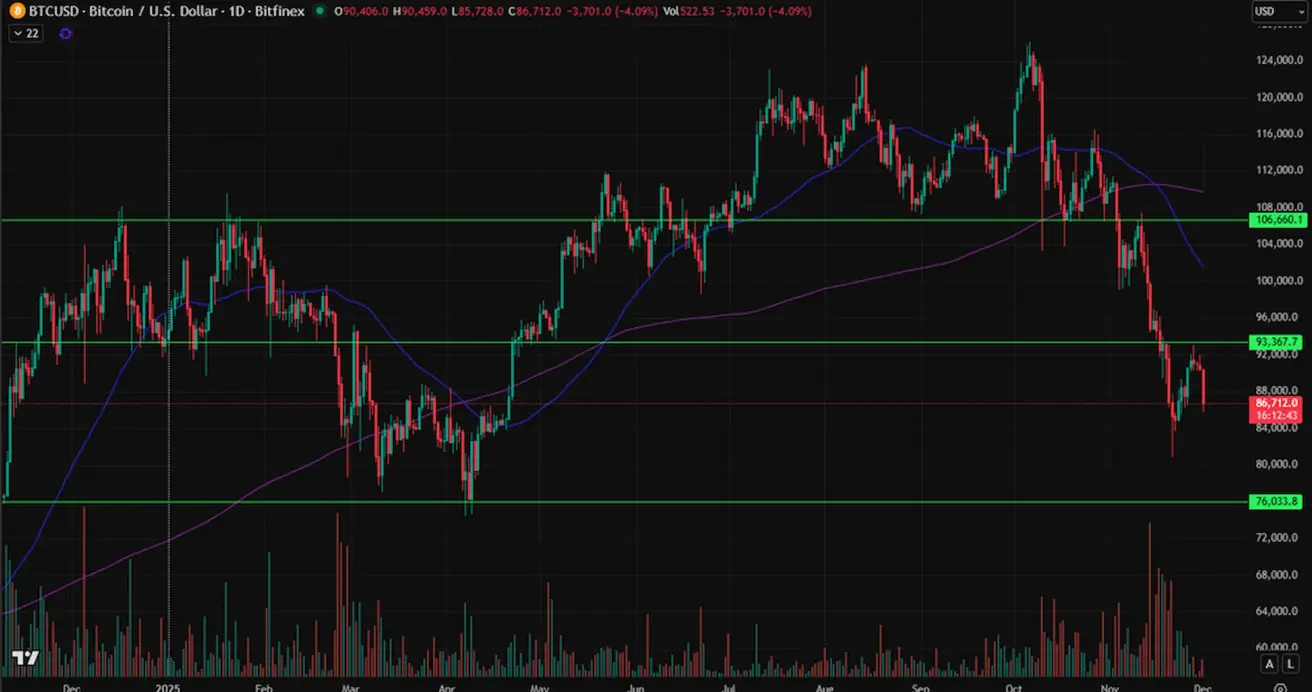
BTC FUTURES Weekly performance: +3.91% (week closed at $90,413.00). Year-to-date: –3.75%.
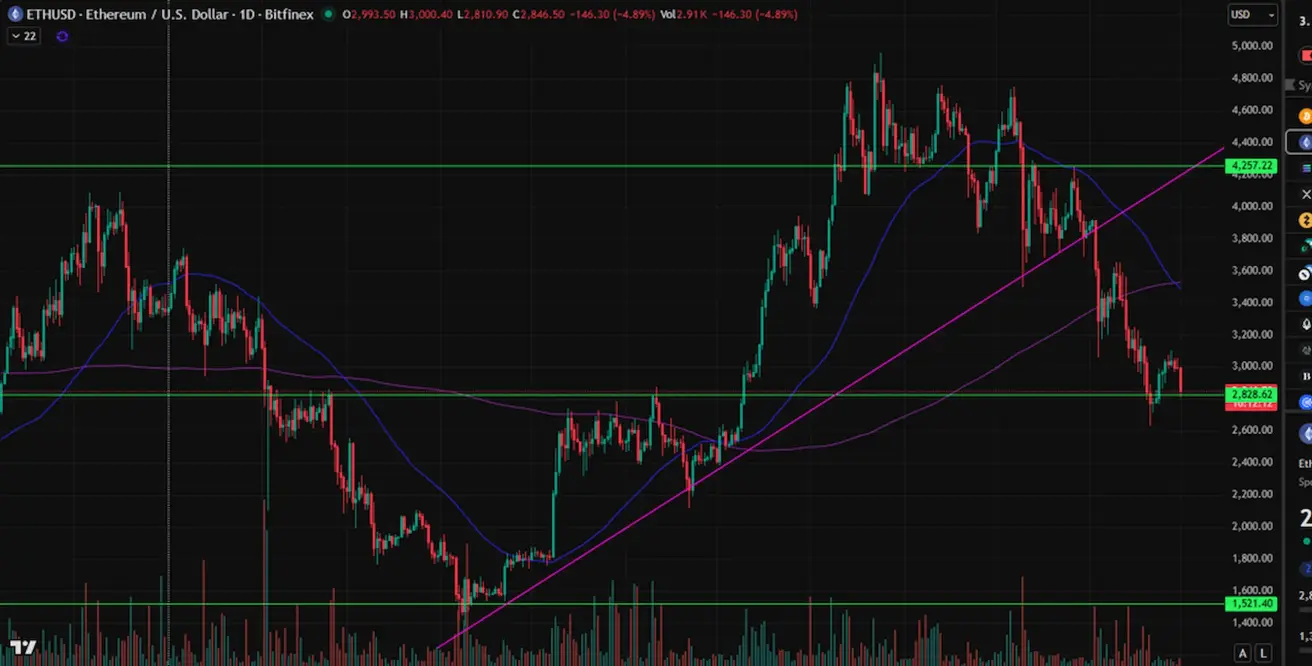
ETH FUTURES
Weekly performance: +6.61% (week closed at $2,992.8). Year-to-date: –10.51%.
Cryptocurrency Market Capitalization: $2.94 trillion (vs. $3.96 trillion a week earlier), according to CoinMarketCap.
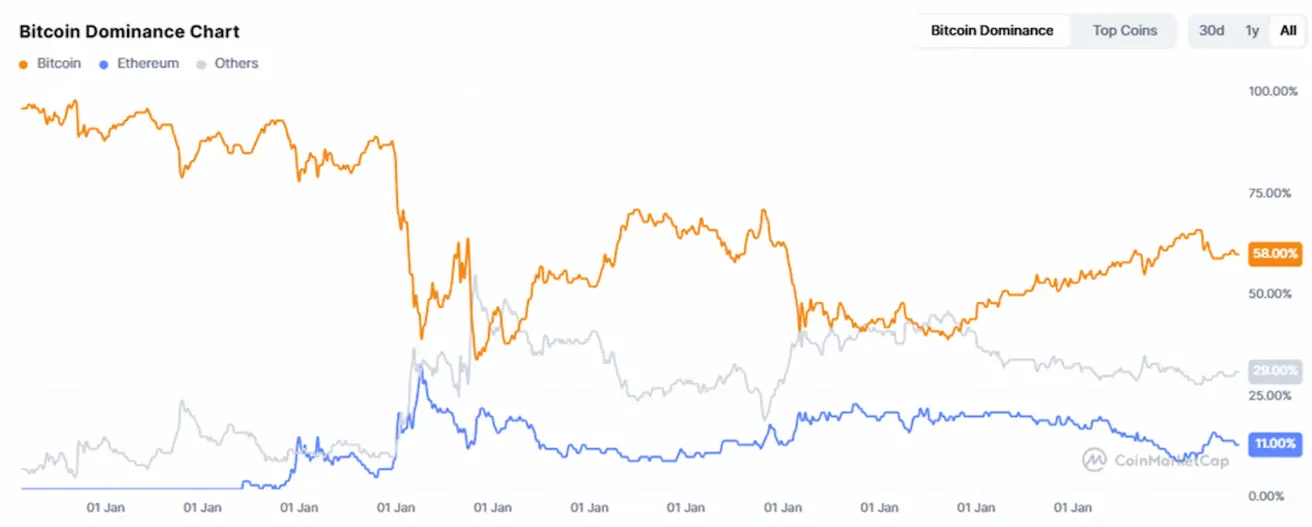
Market Share:
- Bitcoin: 58.7% (prev. 58.5%)
- Ethereum: 11.7% (prev. 11.5%)
- All other assets: 29.7% (prev. 30.0%)
Public companies following a Bitcoin Treasuries strategy currently hold 4.87% of the total Bitcoin supply on their balance sheets (vs 5.08% last week).
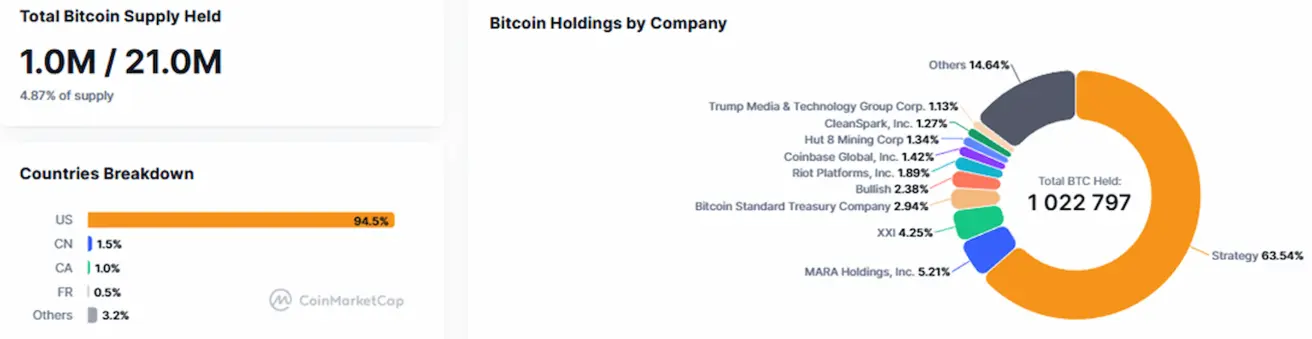
Chart of Net ETF Flows: