Lietuvių
 Русский
 Қазақша
 Eesti
EestiNovember 10–16, 2025: Weekly economic update
Key market updates

Macroeconomic Statistics
INFLATION (September)
- Core Consumer Price Index (CPI) (m/m): 0,2% (previous: 0.3%)
- Consumer Price Index (CPI) (m/m): 0.3% (previous: 0.4%)
- Core Consumer Price Index (CPI) (y/y): 3.0% (previous: 3.1%)
- Consumer Price Index (CPI) (y/y): 3.0% (previous: 2.9%)
INFLATION EXPECTATIONS (MICHIGAN)
- 12-month expected inflation (August): 4.7% (prev: 4.6%)
- 5-year expected inflation (August): 3.6% (prev: 3.9%)
PRODUCER PRICE INDEX (PPI):
- PPI (m/m) (August): -0.1%, prev: 0.7%
- Core PPI (m/m) (August): -0.1%, prev: 0.7%
GDP (U.S. Bureau of Economic Analysis, BEA) (Q2 2025, annualized, third estimate): +3.8% (advance estimate: +3.30%; Q1 2024: – 0.5%). Atlanta Fed GDPNow estimate for Q2: 4.0% (vs. 3.9%).
Business Activity Index (PMI) (October):
(Above 50 indicates expansion; below 50 indicates contraction)
- Services sector: 54.8 (previous: 54.2)
- Manufacturing sector: 52.5 (previous: 52.2)
- S&P Global Composite: 54.6 (previous: 53.9)
LABOR MARKET (OCTOBER): due to the temporary government shutdown, the data is unavailable.
- Unemployment rate: - (prev. 4.3%)
- Total number of individuals receiving unemployment benefits in the US: - (vs 1,926K).
- Change in Nonfarm Employment (ADP), October: 42K (previous: -29K, revised)
- Change in U.S. Private Nonfarm Employment: —
- Average Hourly Earnings (y/y): — (previous: 3.7%)
- Number of Job Openings (JOLTS): — (vs 7.227M)
MONETARY POLICY
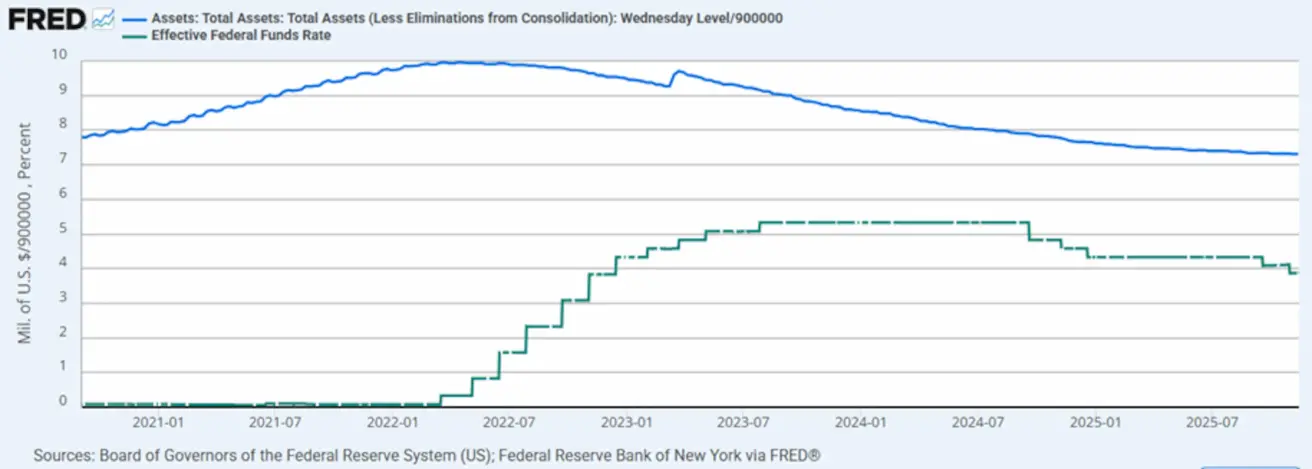
- Federal Funds Effective Rate (EFFR): 3.75% - 4.0%
- Federal Reserve balance sheet increased: $6,580T (vs. previous week: $6,572T)
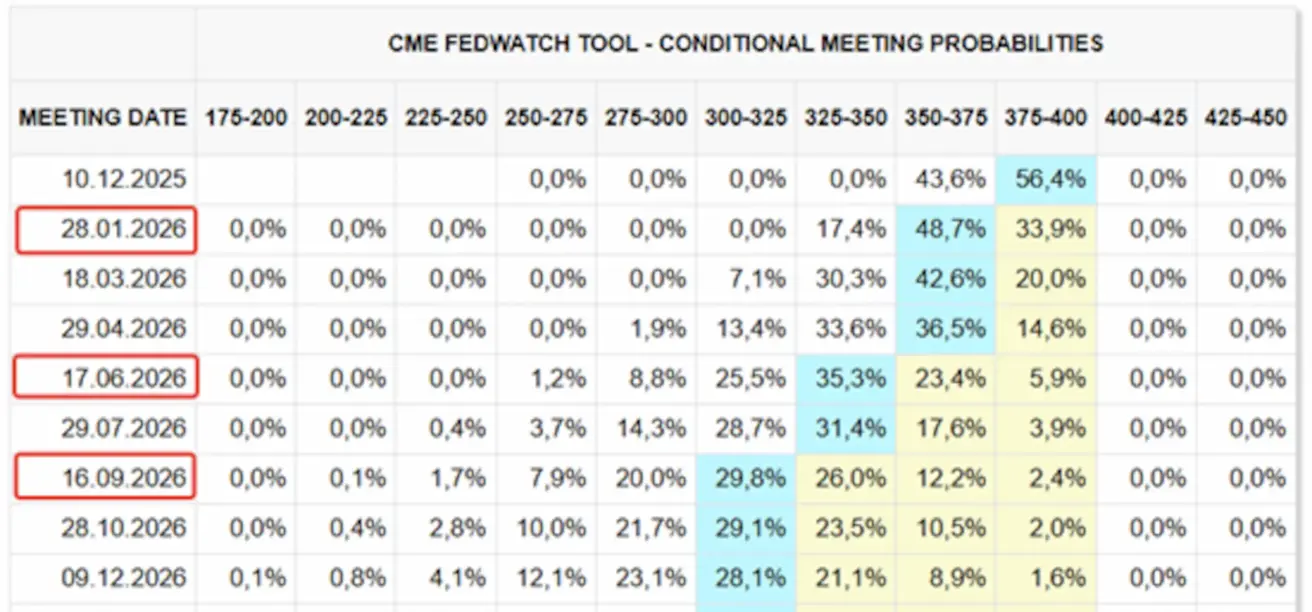
MARKET FORECAST FOR RATE (FEDWATCH)
Expectations for the upcoming FOMC meeting on October 29:
Today:
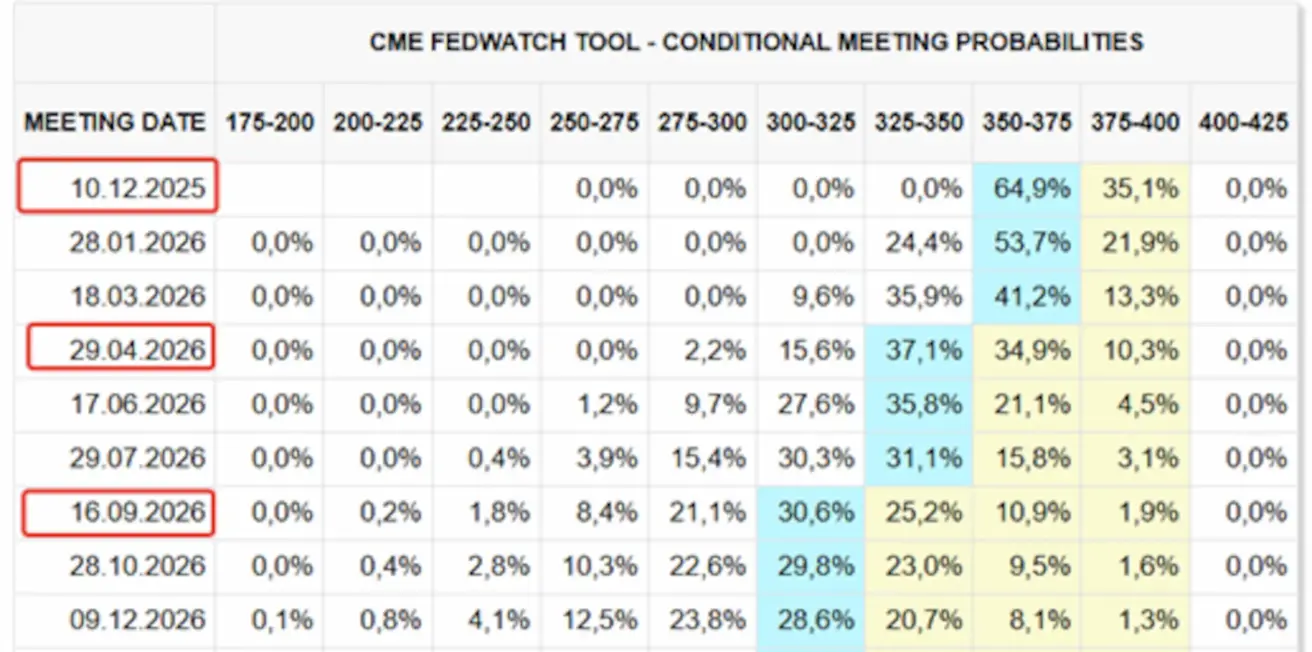
А week earlier:
Market Context
The record-setting 43-day government shutdown has come to an end, but the current stopgap funding is only valid through January 30, after which a new round of negotiations will follow.
Because federal operations were halted, government outlays were effectively frozen, pushing the Treasury General Account (TGA) to nearly one trillion dollars.
Treasury General Account (TGA):
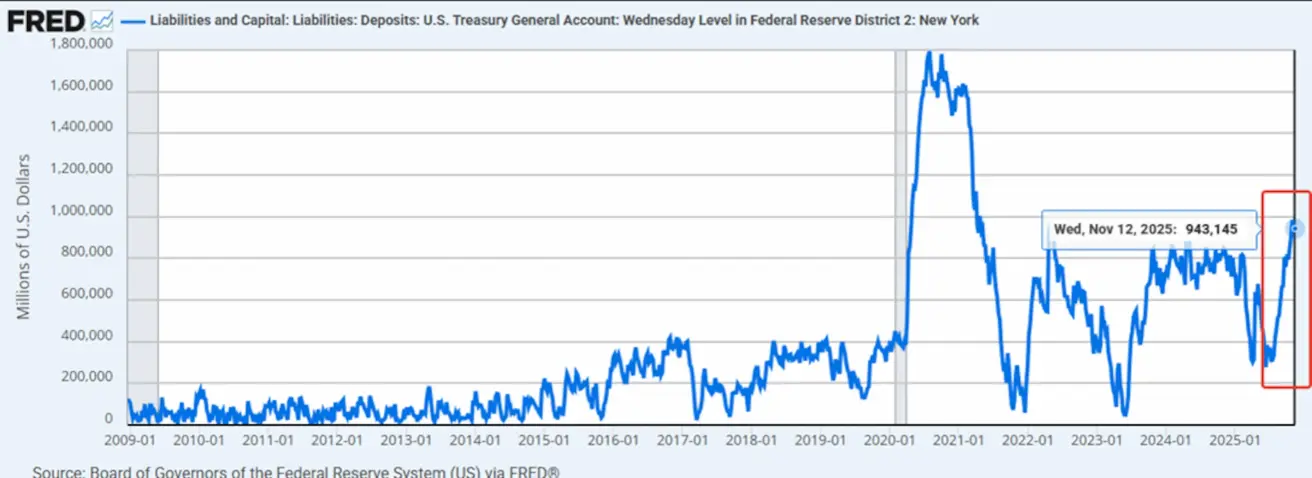
The broader decline in liquidity did not weigh on equity indices, but the cryptocurrency market posted a noticeable pullback.
The government’s reopening — and the resumption of federal spending — together with the Fed’s hints at potential QE, could serve as meaningful catalysts supporting equity markets.
Fed officials’ rhetoric — rising probability of a new round of QE:
- John Williams, President of the New York Fed, stated that the Fed may soon return to asset purchases.
- Raphael Bostic, the Atlanta Fed President and a noted hawk, announced his intention to resign.
- Elizabeth Hammack, President of the Cleveland Fed, noted that the current monetary stance may be ill-suited for addressing prevailing inflation.
- Steven Miran (a Trump-aligned nominee) continues to push for a 50 bps rate cut in December.
Judging by the recent statements, the Fed lacks a unified position; however, Powell has indicated that the policy trajectory is tilting toward a more neutral stance.
Amid declining approval ratings, Trump is advocating a form of “helicopter money” — a plan to distribute $2,000 to low- and middle-income Americans, financed by tariff-derived tax revenues, with the remaining funds directed toward reducing the federal debt.
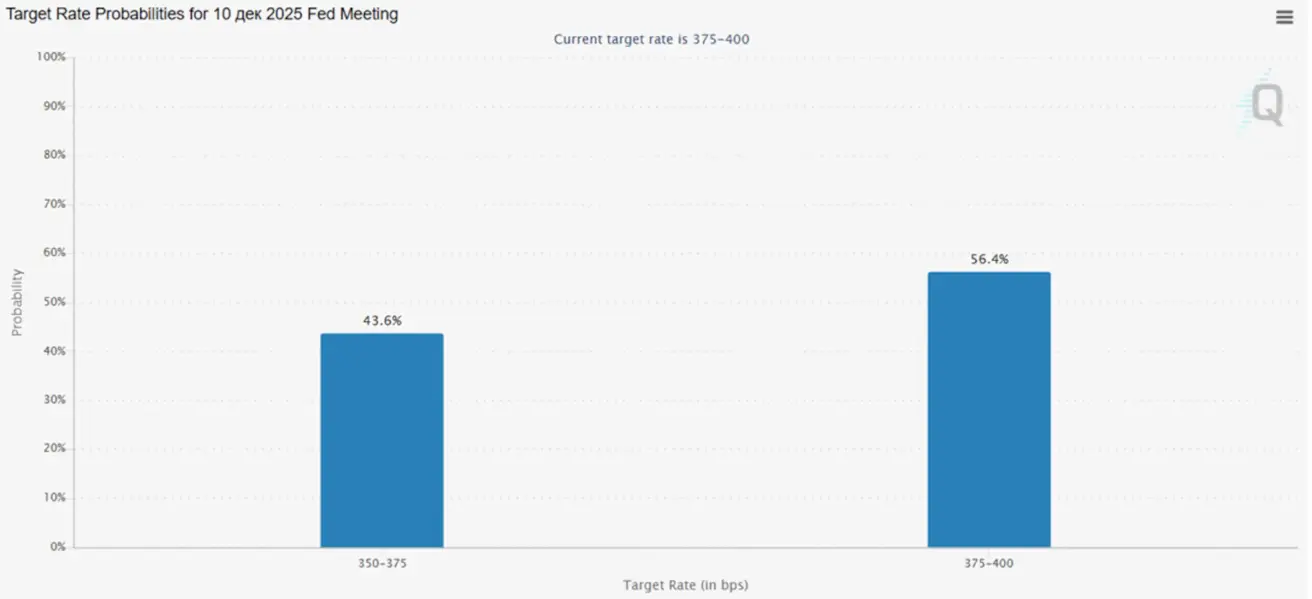
Market expectations according to FedWatch:
- For the next meeting (December 10): the implied probability of a 25 bps rate cut stands at 43.6% (down from more than 80% prior to the last meeting).
- Over the next 12 months: the market is pricing in three 25 bps cuts, bringing the target range to 3.00 – 3.25%.
Market
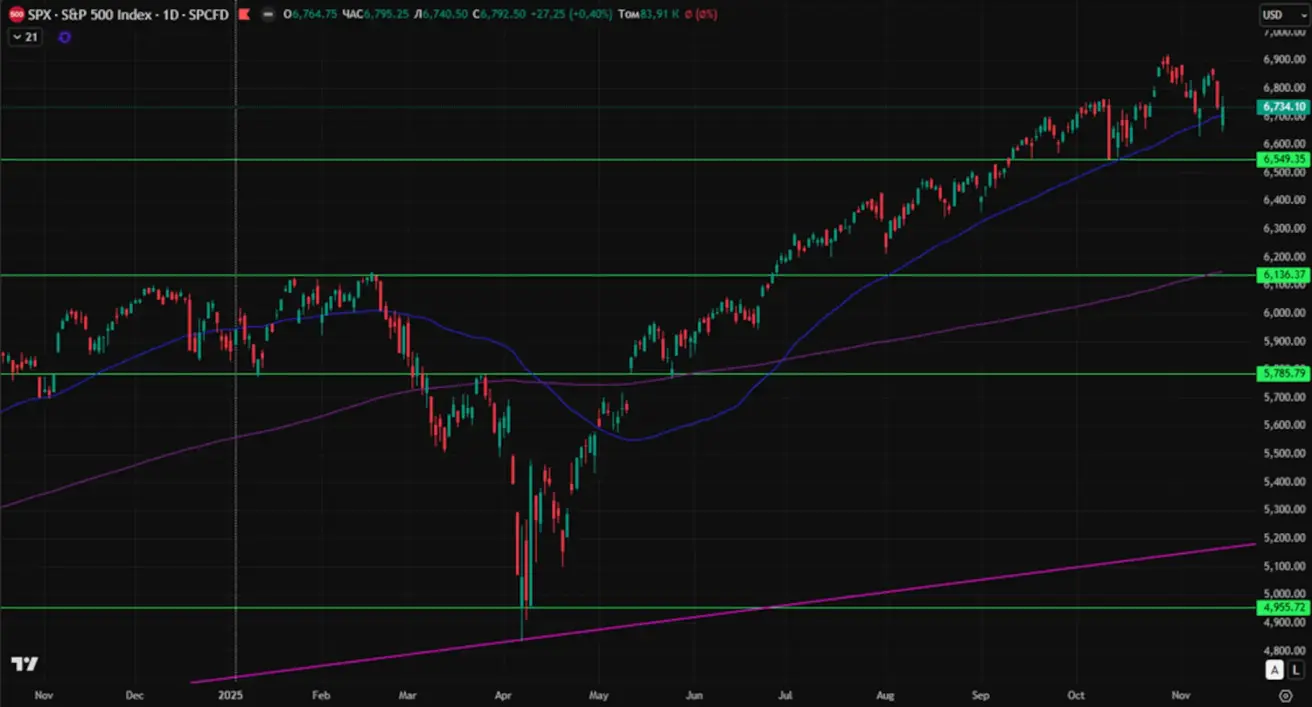
SP500
Weekly performance: +0.08% (week closed at 6,734.10). Year-to-date performance for 2025: +14.07%.
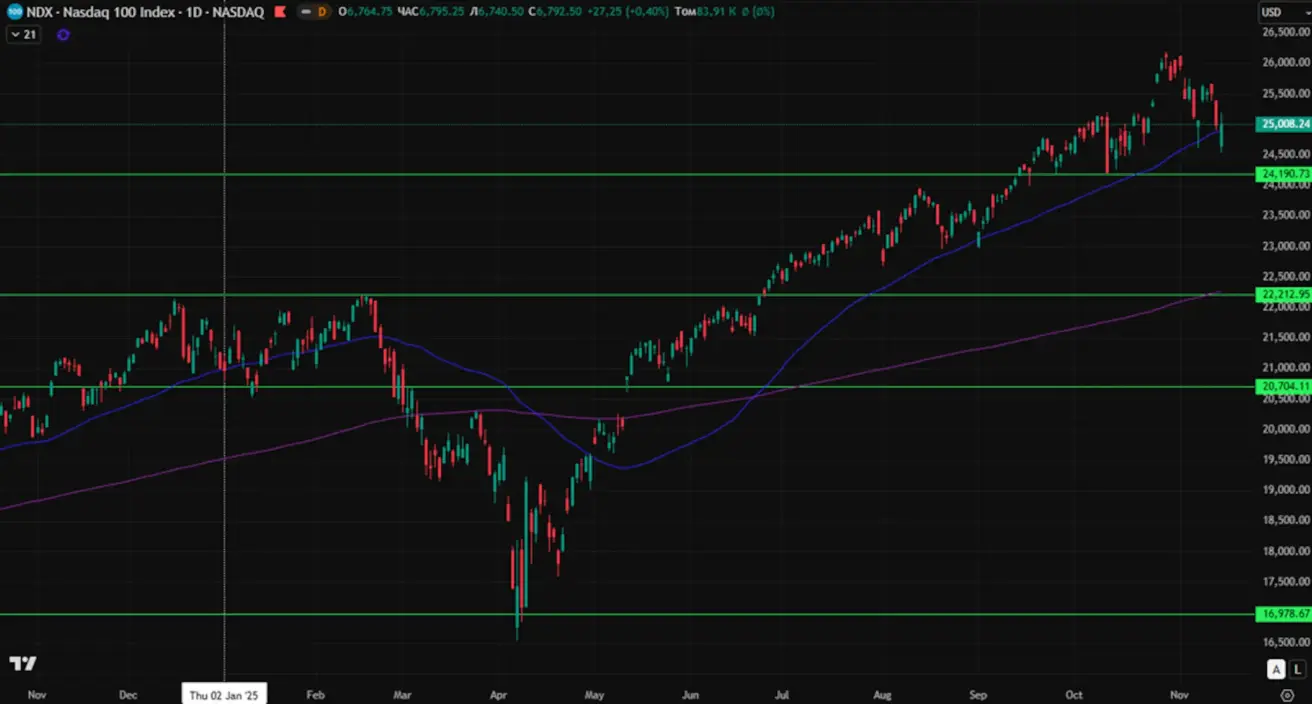
NASDAQ100
Weekly performance: -4.20% (week closed at 24,008.24). Year-to-date performance: +13.68%.
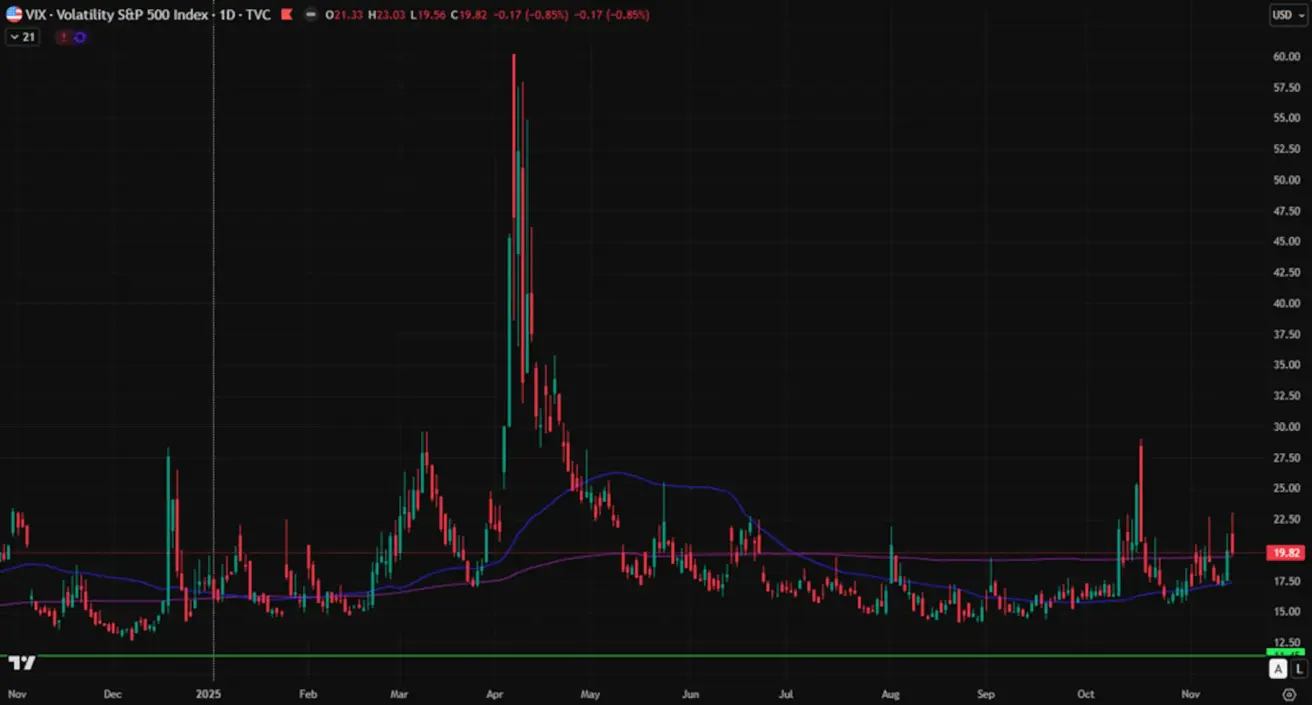
VIX
Week closed at: 19.82
Eurozone
Interest rates:
- Deposit rate: 2.0% (previous: 2.0%)
- Marginal lending rate: 2.4% (previous: 2.4%)
- Short-term (key) refinancing rate: 2.15% (previous: 2.15%)
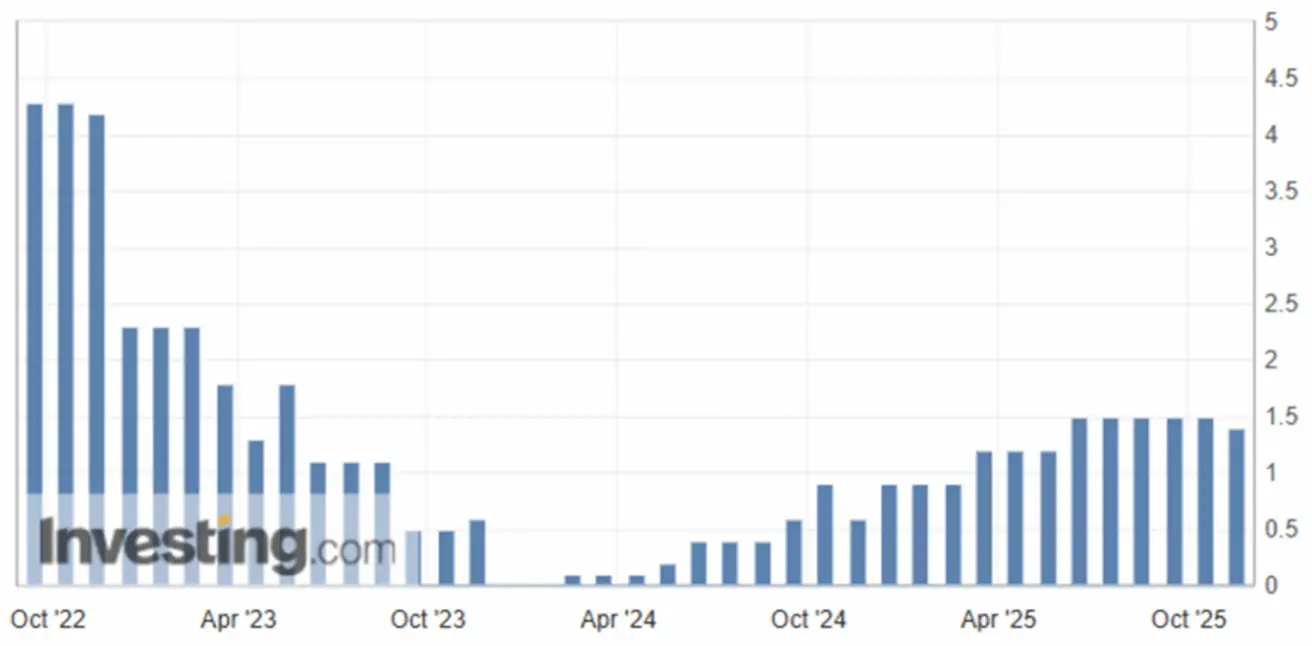
Inflation:
- Consumer Price Index (CPI), y/y (October): 2.2% (previous: 2.1%)
GDP (Q3):
- q/q: 0.2% (previous: 0.1%)
- y/y: 1.4% (previous: 1.5%)
Unemployment rate (September): 6.3% (previous: 6.3%)
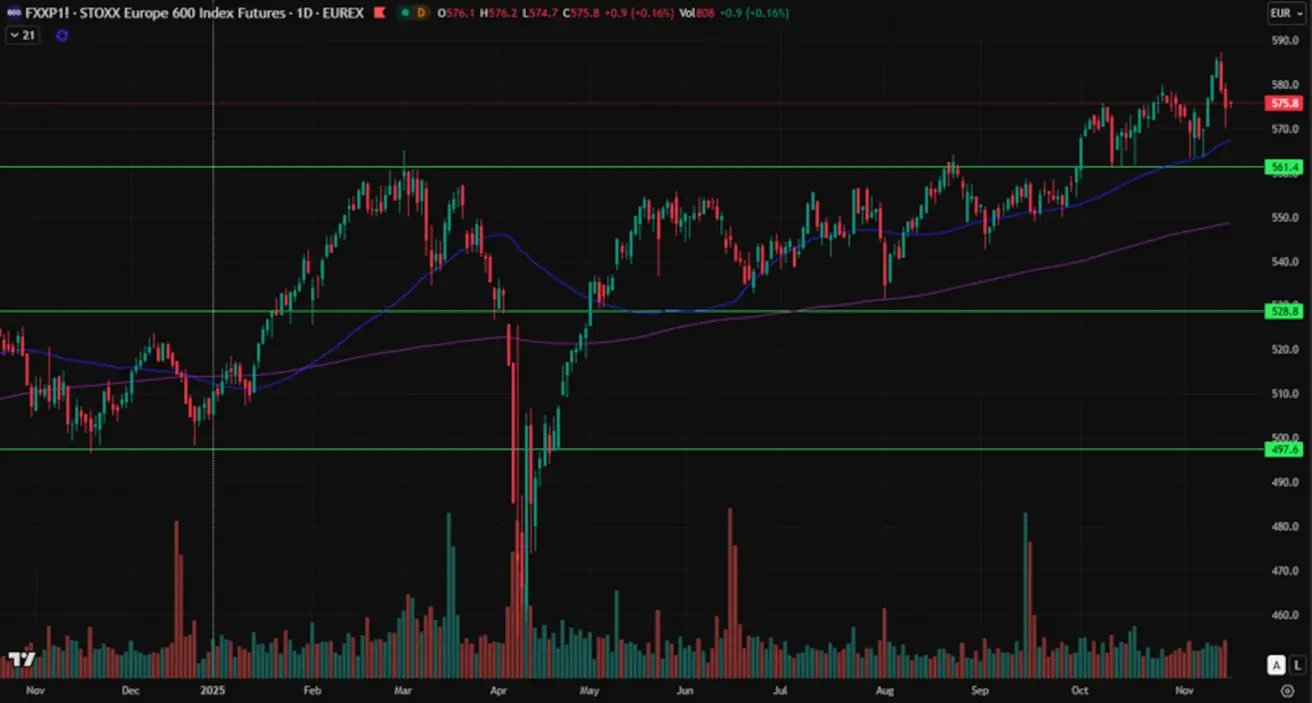
Euro Stoxx 600
Weekly performance: +1.09% (week closed at 575.8). Year-to-date performance: +13.88%.
China
Purchasing Managers’ Index (PMI), October:
- Services sector: 50.1 (previous: 50.0)
- Manufacturing sector: 49.0 (previous: 49.8)
- Composite index: 54.8 (previous: 53.9)
Inflation (CPI), October:
-
Consumer Price Index (m/m): 0.2% (previous: -0.3%)
-
Consumer Price Index (y/y): 0.2% (previous: 0.1%)
-
Producer Price Index (PPI, y/y): -2.1% (previous: -2.3%)
-
Unemployment rate (September): 5.1% (prev. 5.2%).
-
Industrial production, YoY: 4.9% (vs. 6.5%).
-
Fixed-asset investment, YoY: –1.7% (vs. –0.5%).
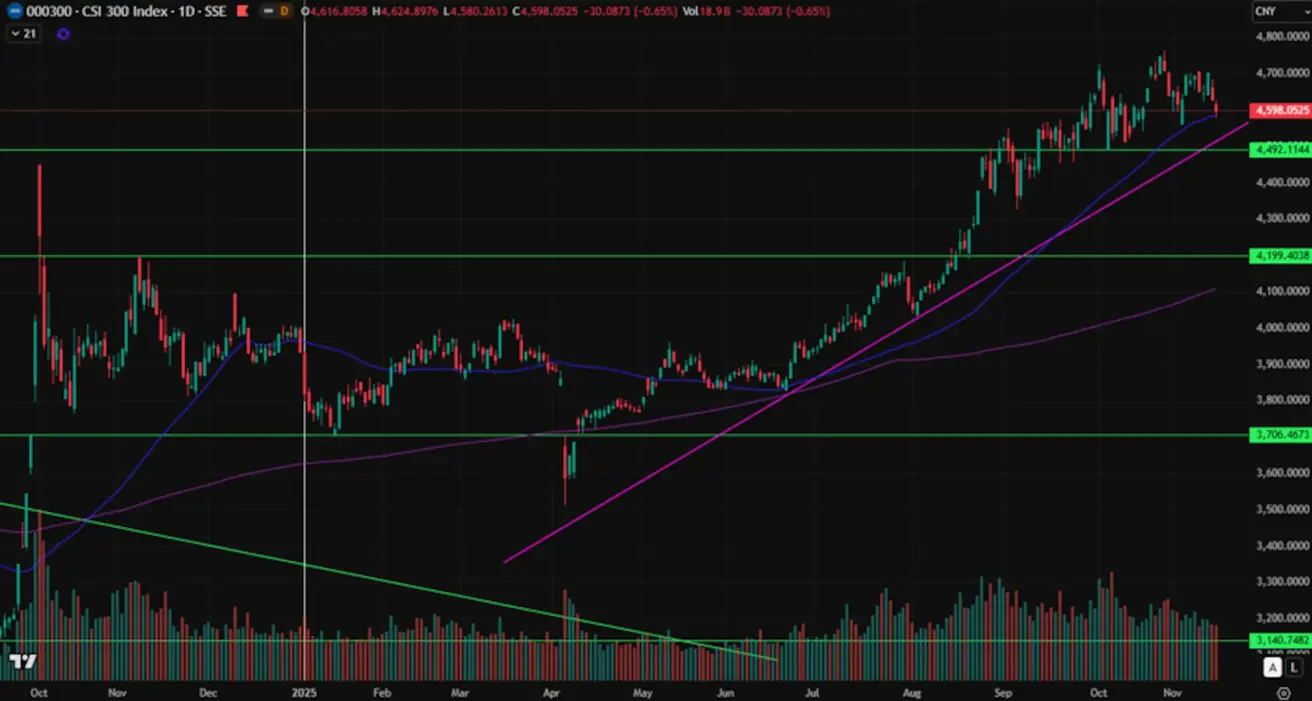
CSI 300 Index
Weekly performance: -1.73% (week closed at 4,598.0525). Year-to-date performance: +16.97%.
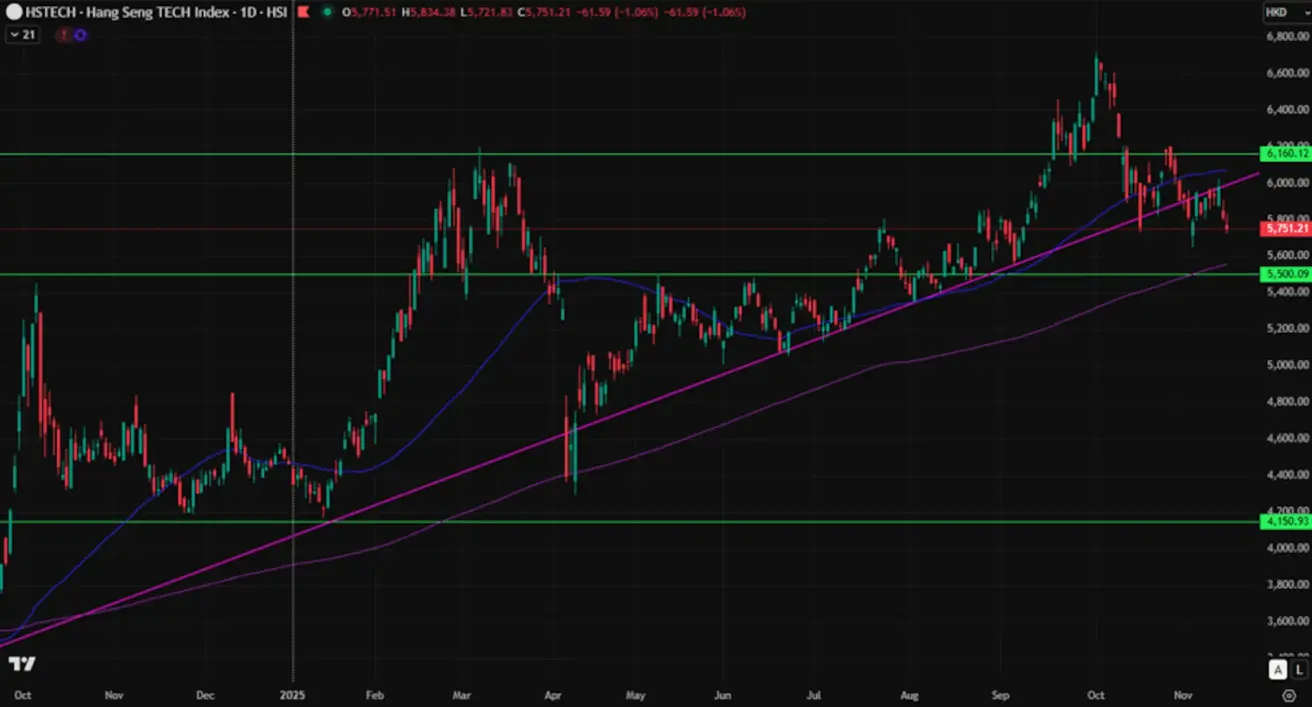
Hang Seng TECH Index (HSTECH.HK)
Weekly performance: -0.42% (week closed at 5,812.80). Year-to-date performance: +31.02%.
IMF
The IMF has revised its global growth forecast upward, projecting 3.2% expansion in 2025 and 3.1% in 2026, noting that tariff shocks and financial conditions have proven milder than previously expected.
The outlook for the U.S. economy remains resilient: growth in 2025 is now expected to reach 2.0%, slightly above the July estimate of 1.9%. For 2026, the IMF forecasts U.S. GDP growth of 2.1%, again marginally higher than the July projection, though well below the 2.8% pace recorded in 2024.
The IMF left its forecast for global headline inflation broadly unchanged at 4.2% for 2025 and 3.7% for 2026, while noting increasing divergence across countries. In the United States, inflation projections have been revised higher as firms that had previously refrained from raising prices begin to pass tariff-related costs on to consumers.
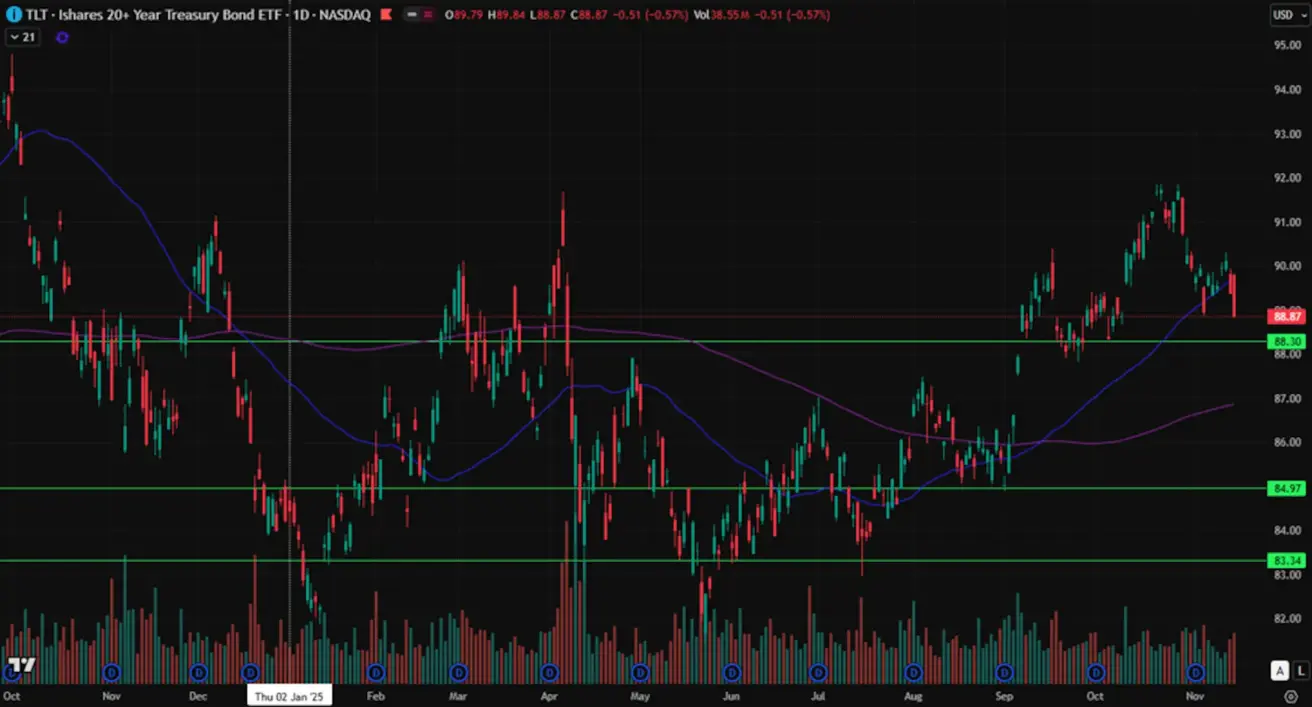
BOND MARKET
Bond market — yields edged slightly higher as expectations grow that the Fed may pause its rate-cut cycle.
Treasury Bonds 20+ (ETF TLT): weekly performance: -0.87% (week closed at 88.87). Year-to-date performance: +1.22%.
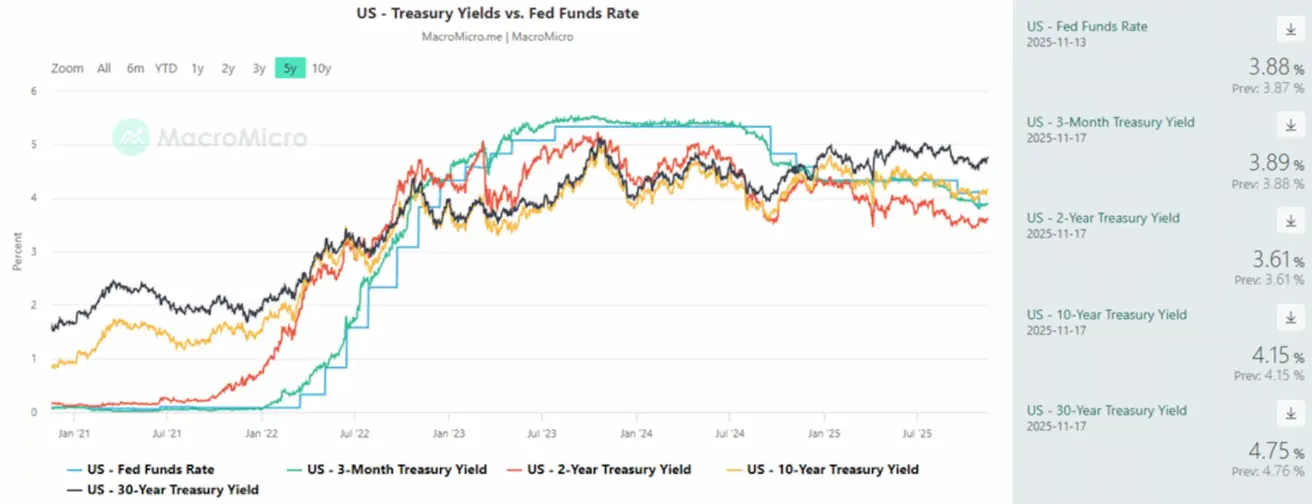
- Market Yield on U.S. Treasury Securities, 10-Year Constant Maturity: 4.15% (vs 4.13%). 2-Year Treasury Yield: 3.61% (vs 3.61%)
- ICE BofA BBB U.S. Corporate Index Effective Yield: 5.07% (vs 4.03%)
Yields and Spreads
- The yield spread between 10-year and 2-year U.S. Treasury bonds stands at 54.0 basis points (vs 54.0 bps).
- The yield spread between 10-year and 3-month U.S. Treasury bonds is 26.0 basis points (vs 26.0 bps).
- The cost of the 5-year U.S. Credit Default Swap (CDS) — insurance against default — is 33.26 bps (vs 35.05 bps last week).
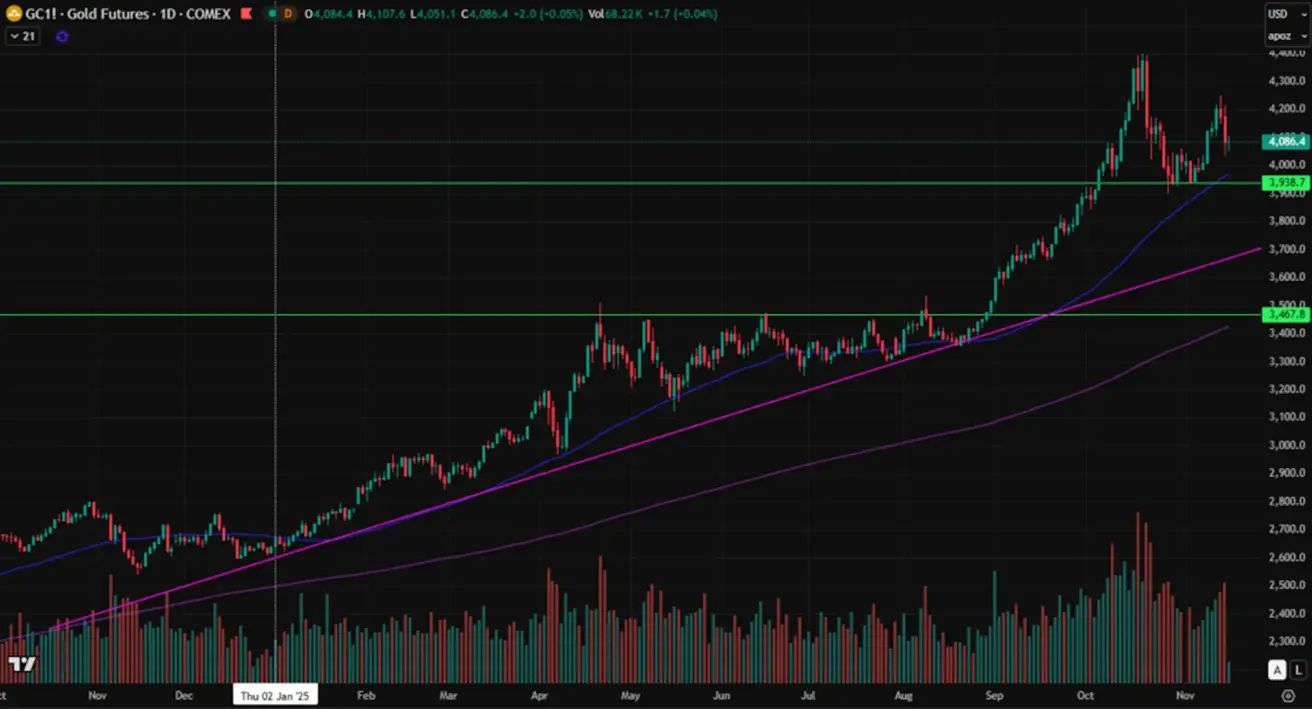
GOLD FUTURES (GC)
Gold Futures (GC): weekly performance: +1.19% (week closed at $4,084.4 per troy ounce). Year-to-date performance: +54.65%.
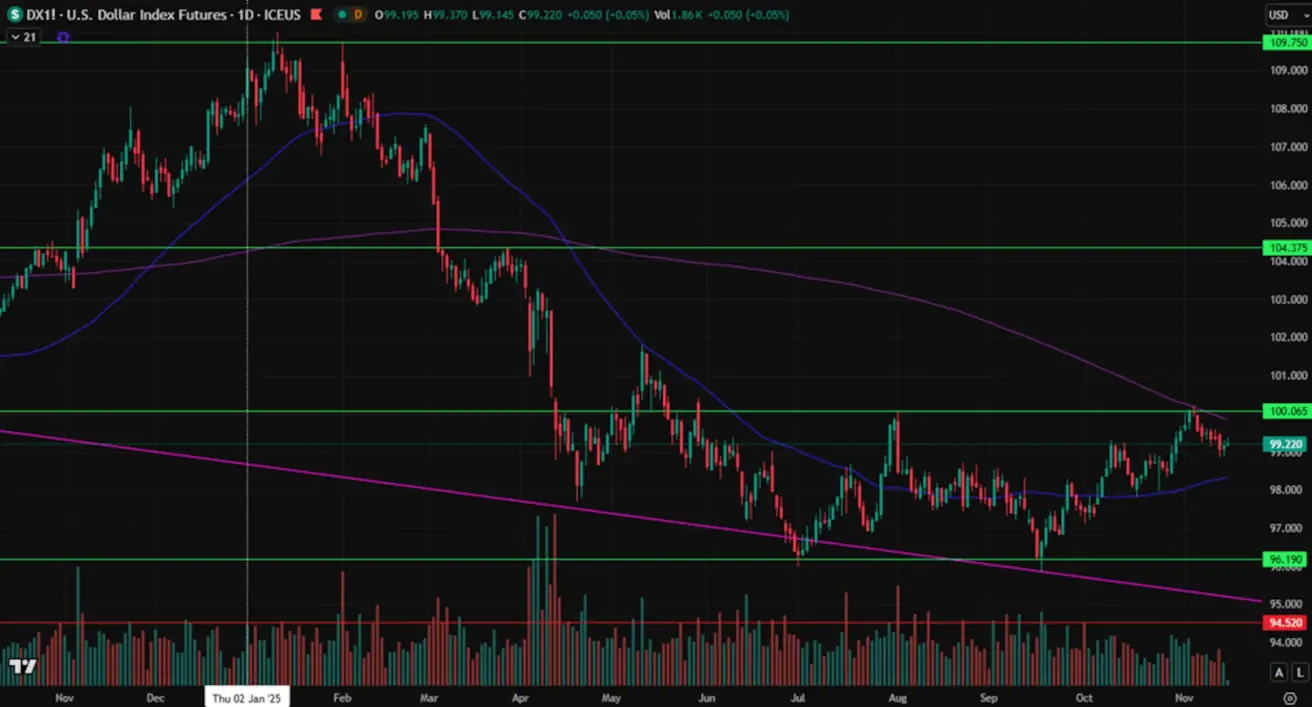
DOLLAR INDEX FUTURES (DX)
Weekly performance: -0.25% (week closed at 99.170). Year-to-date performance: -8.46%.
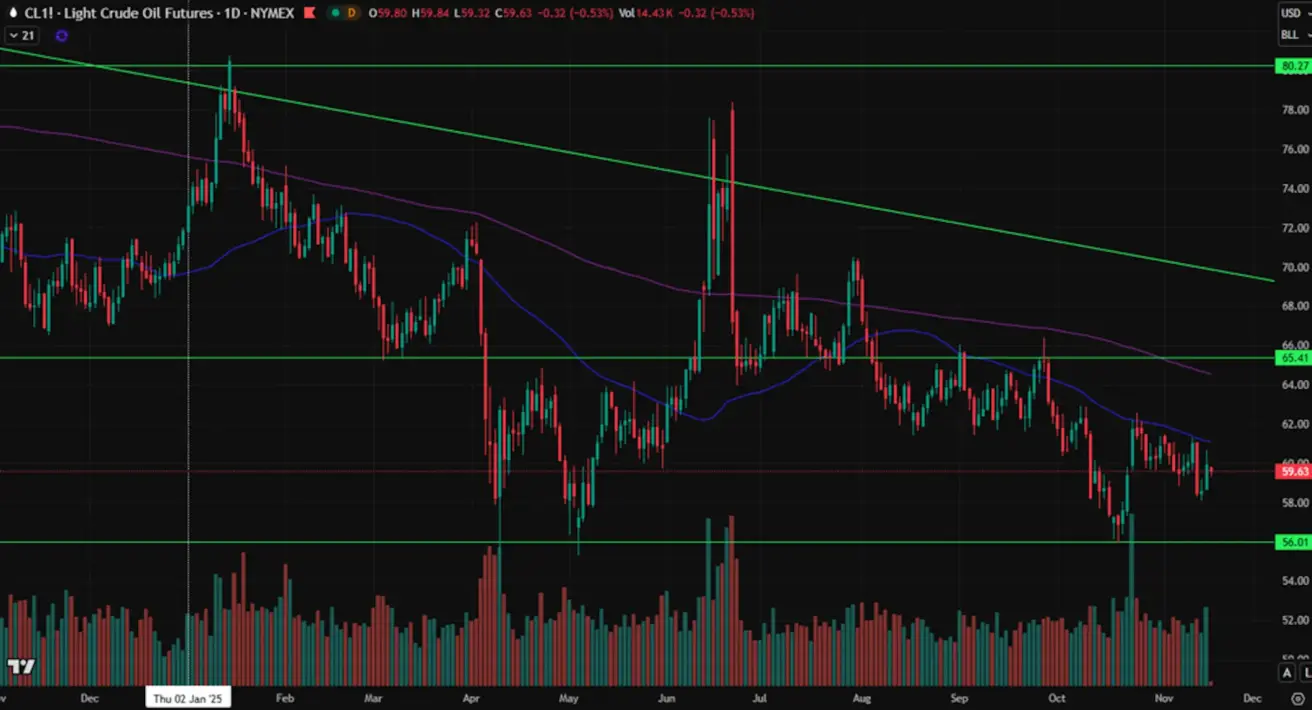
OIL FUTURES
Weekly performance: +0.18% (week closed at $59.95 per barrel). Year-to-date performance: -16.56%.
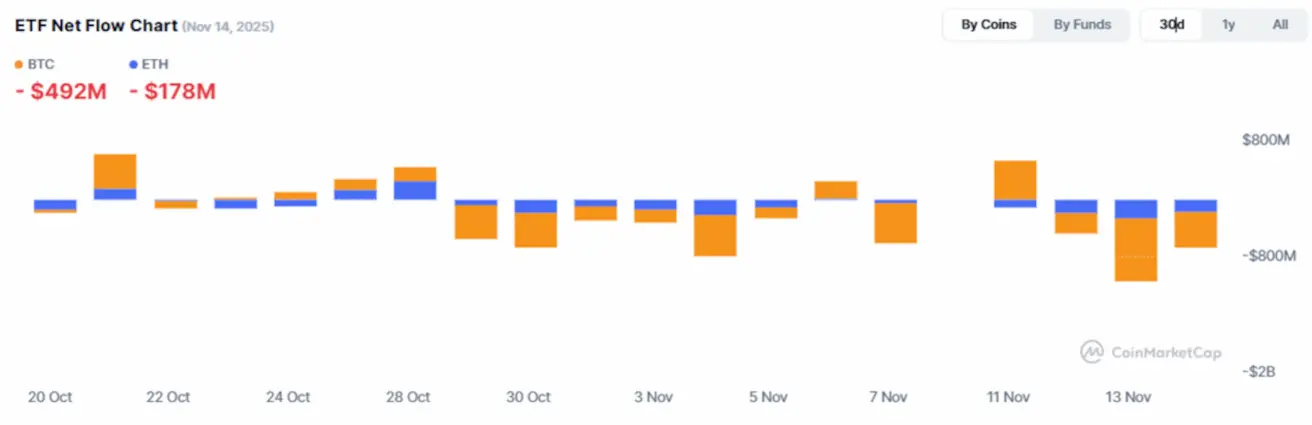
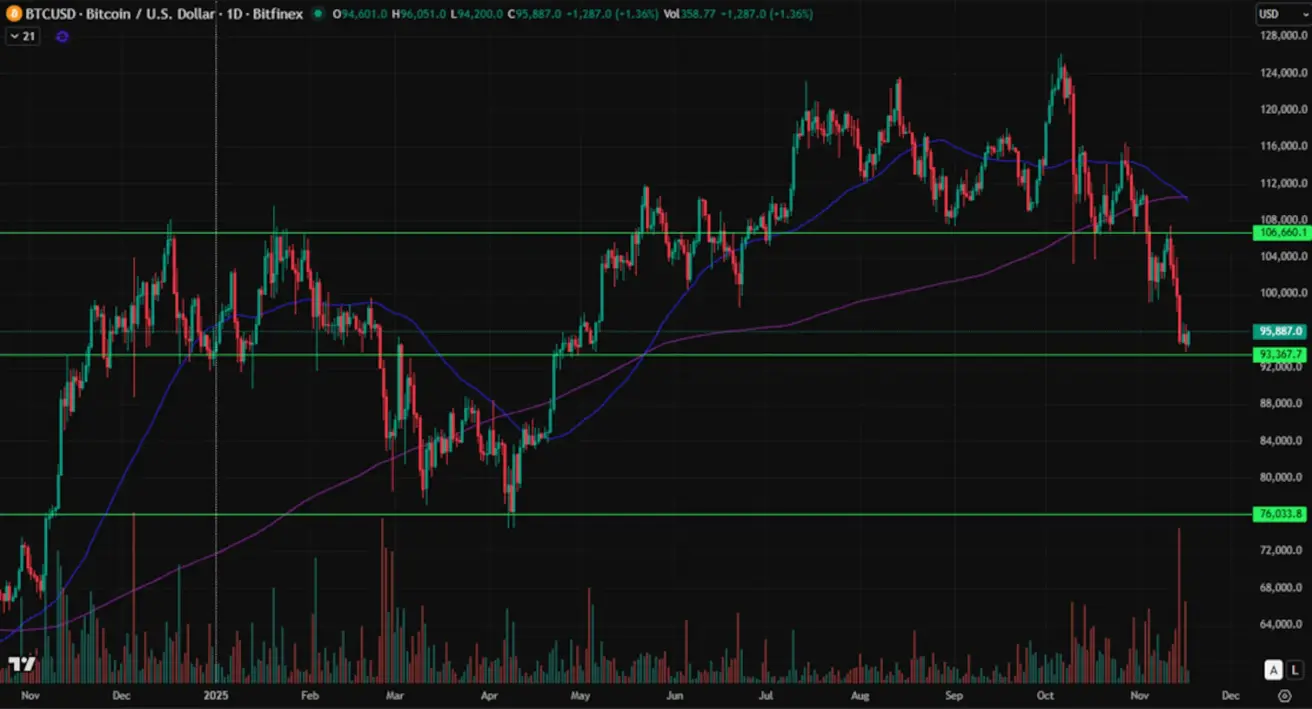
BTC FUTURES
Weekly performance: -9.72% (week closed at $94,600). Year-to-date performance: +0.90%.
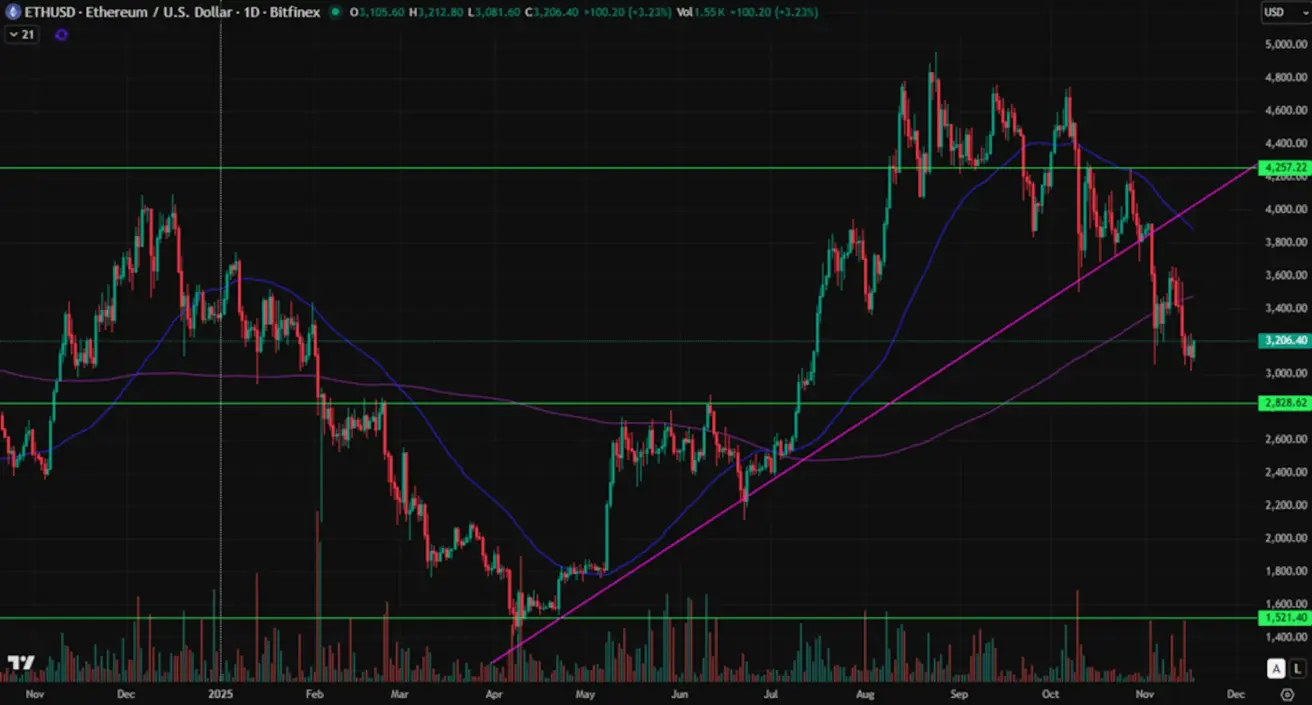
ETH FUTURES
Weekly performance: -13.38% (week closed at $3,106.20).Year-to-date performance: -7.12%.
Cryptocurrency Market Capitalization: $3.25 trillion (vs $3.57 trillion a week earlier, according to coinmarketcap.com).
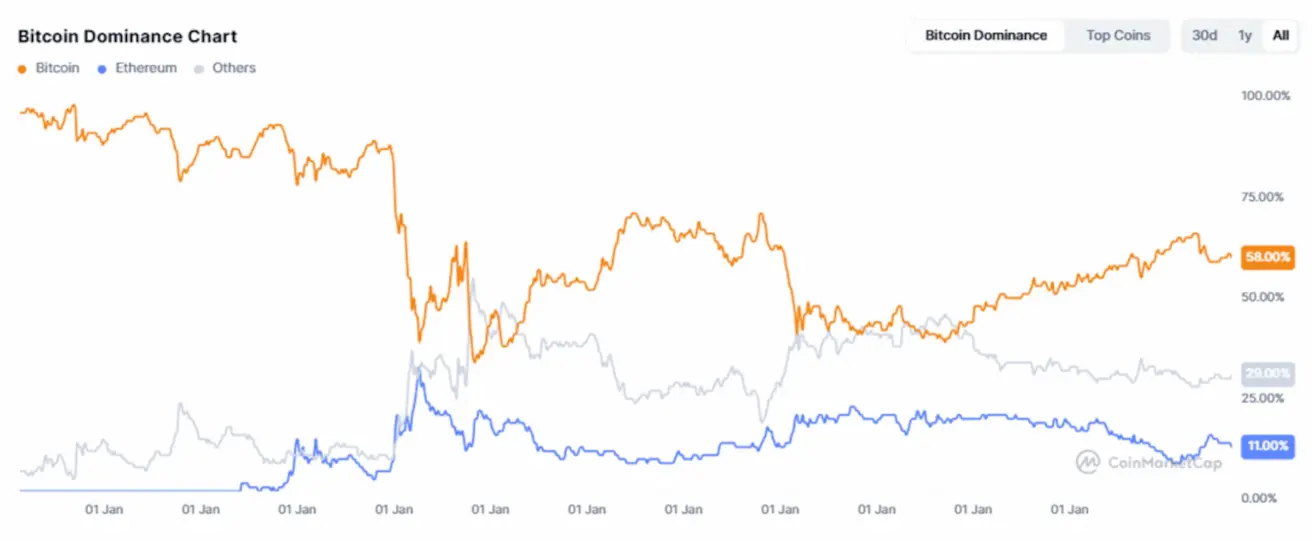
Market shares:
- Bitcoin: 58.8% (previous: 59.3%)
- Ethereum: 11.9% (previous: 12.2%)
- Other assets: 29.4% (previous: 28.6%)
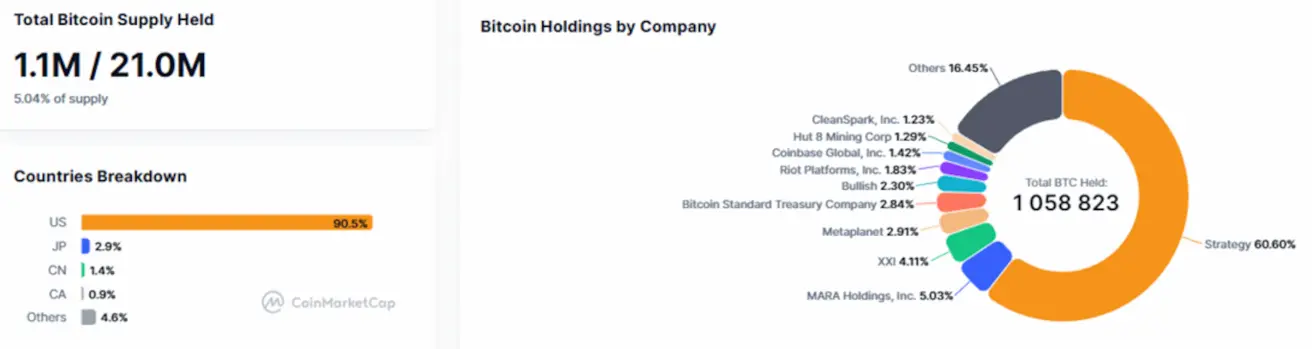
Public companies with a Bitcoin Treasuries strategy. The share of bitcoin held on corporate balance sheets remains unchanged from last week at 5.04% (vs. 5.04%) of total circulating supply.