Lietuvių
 Русский
 Қазақша
 Eesti
EestiFebruary 10 - 14, 2025: Weekly economic update
Key market updates

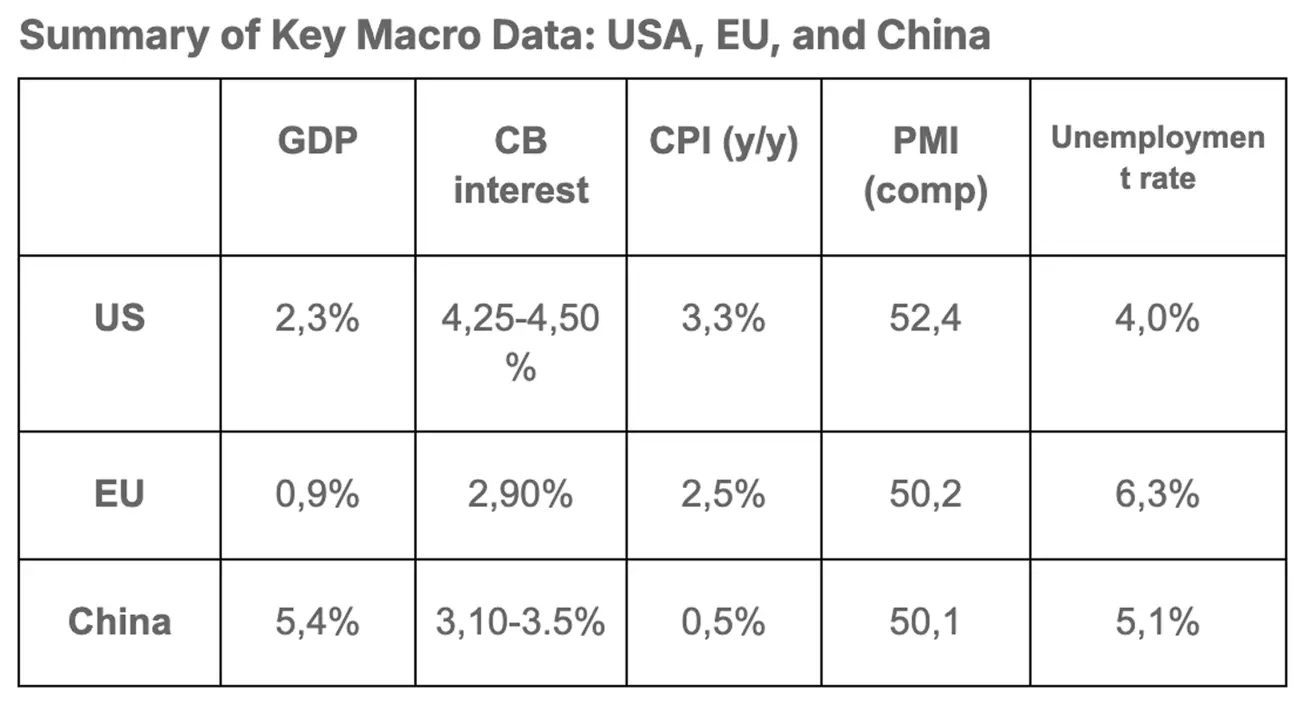
MACROECONOMIC STATISTICS
INFLATION
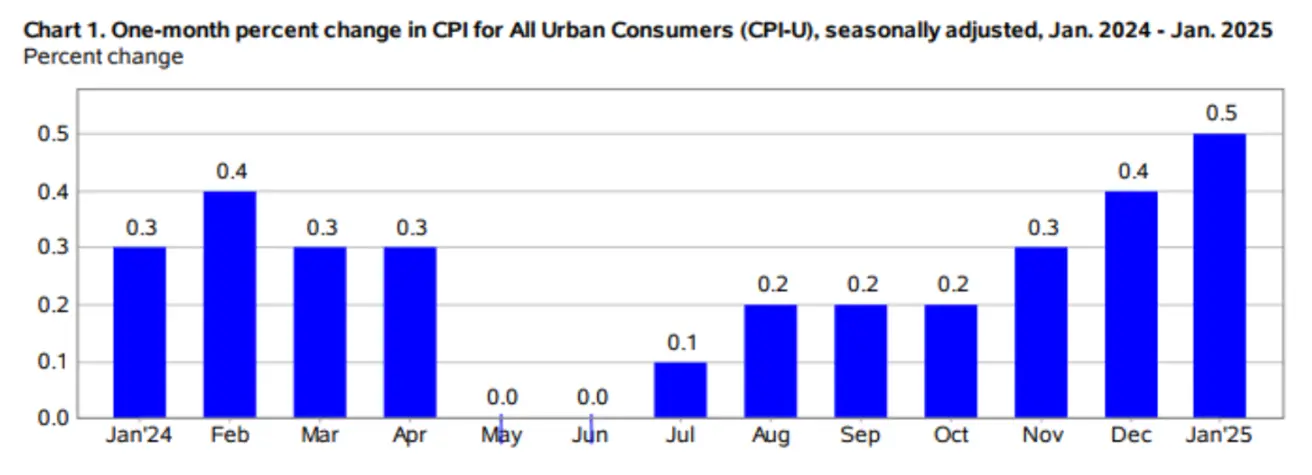
- Core Consumer Price Index (CPI) (m/m) (January): 0.4% (prev: 0.2%);
- Consumer Price Index (CPI) (m/m) (January): 0.5% (prev: 0.4%);
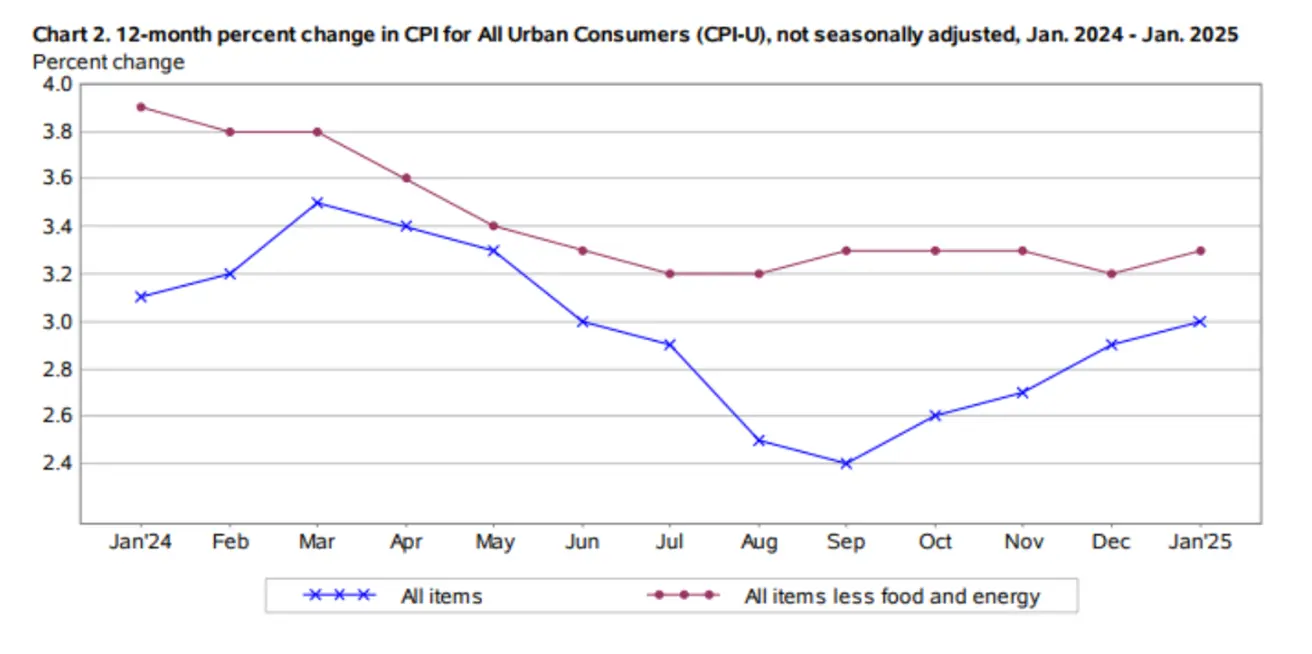
- Core Consumer Price Index (CPI) (y/y) (January): 3.3% (prev: 3.2%);
- Consumer Price Index (CPI) (y/y) (January): 3.0% (prev: 2.9%).
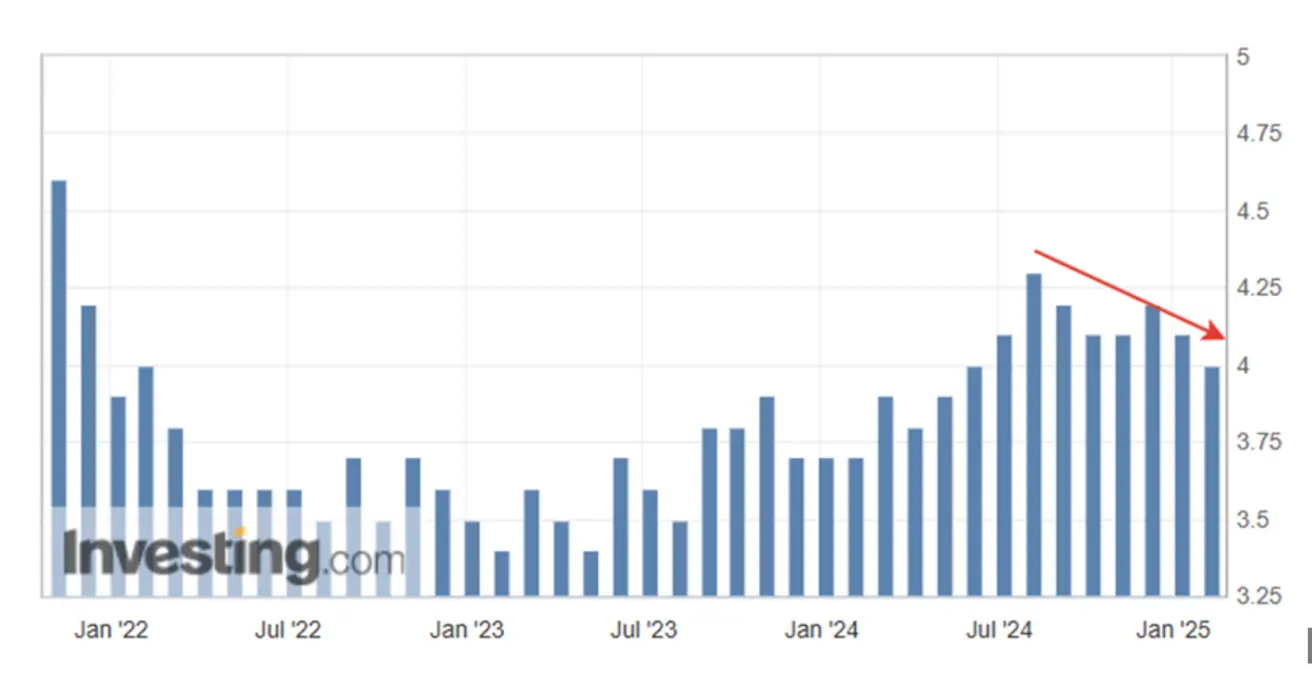
INFLATION EXPECTATIONS (MICHIGAN)
- 12-month expected inflation (January): 4.3%, prev: 3.3%;
- 5-year expected inflation (January): 3.3%, prev: 3.2%.
BUSINESS ACTIVITY INDEX (PMI):
- Services Sector (December): 52.8 (prev: 56.8);
- Manufacturing Sector (December): 50.1 (prev: 49.3);
- S&P Global Composite (December): 52.4 (prev: 55.4).
GDP (BEA – U.S. Bureau of Economic Analysis) (q/q) (Q) (Preliminary Estimate):
- 2.3% (prev: 3.1%)
LABOR MARKET:
- Unemployment Rate (January): 4.0% (prev: 4.1%);
- Nonfarm Payrolls Change (January): 143K (prev: 307K);
- Private Nonfarm Payrolls Change (January): 111K (prev: 273K revised);
- Average Hourly Earnings (January, y/y): 4.1% (prev: 4.1%).
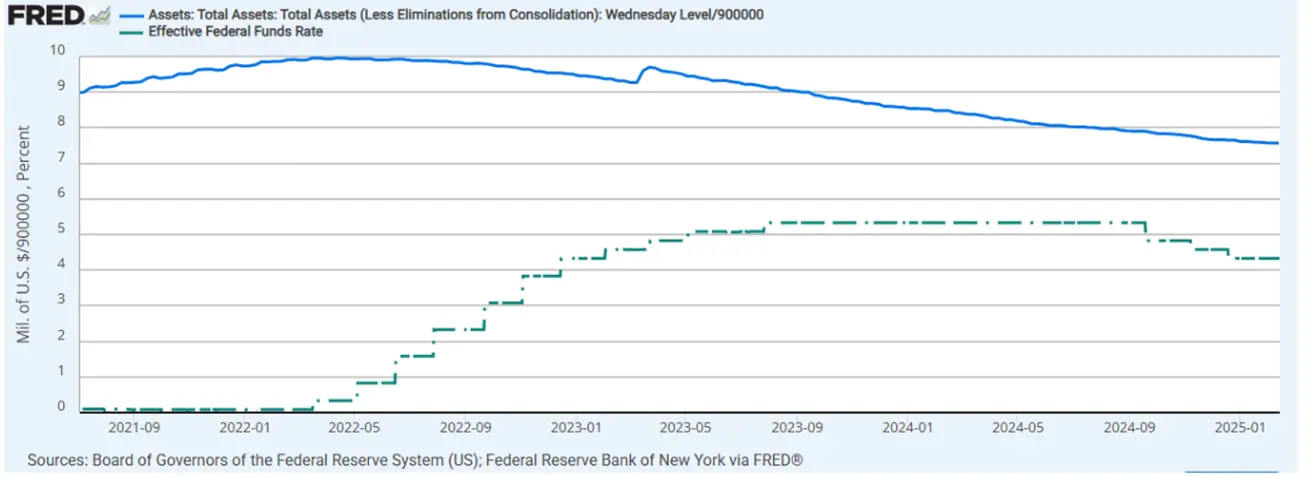
MONETARY POLICY
- Federal Funds Rate (EFFR): 4.25%–4.50% (dotted line);
- Fed Balance Sheet (blue): $6.81 trillion (vs previous week: $6.818 trillion)
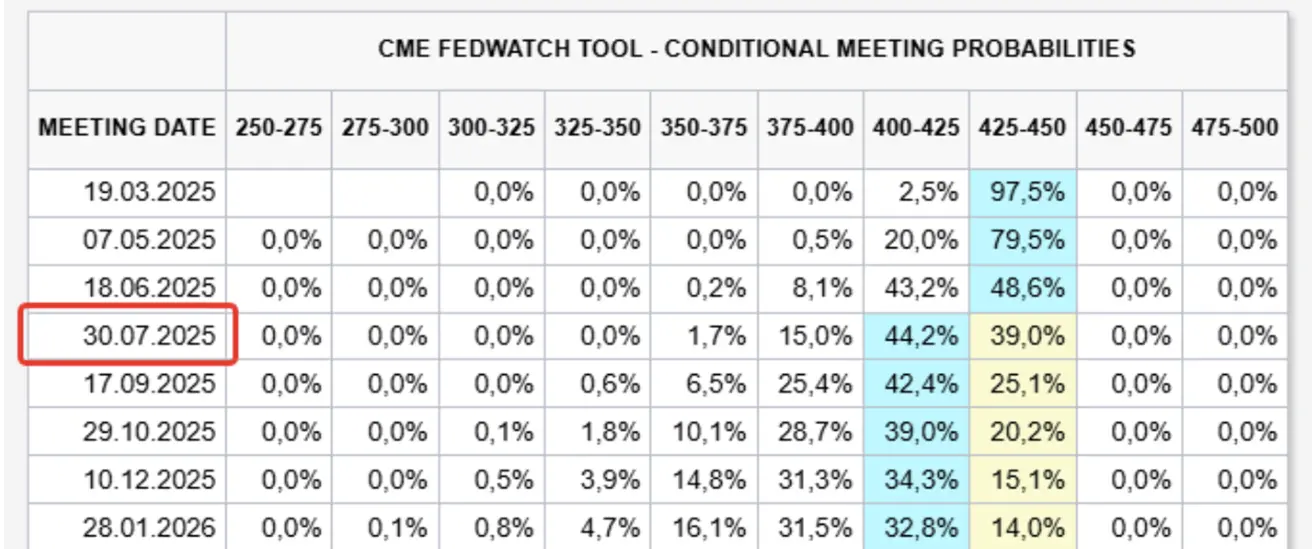
MARKET FORECAST FOR RATE
Today:
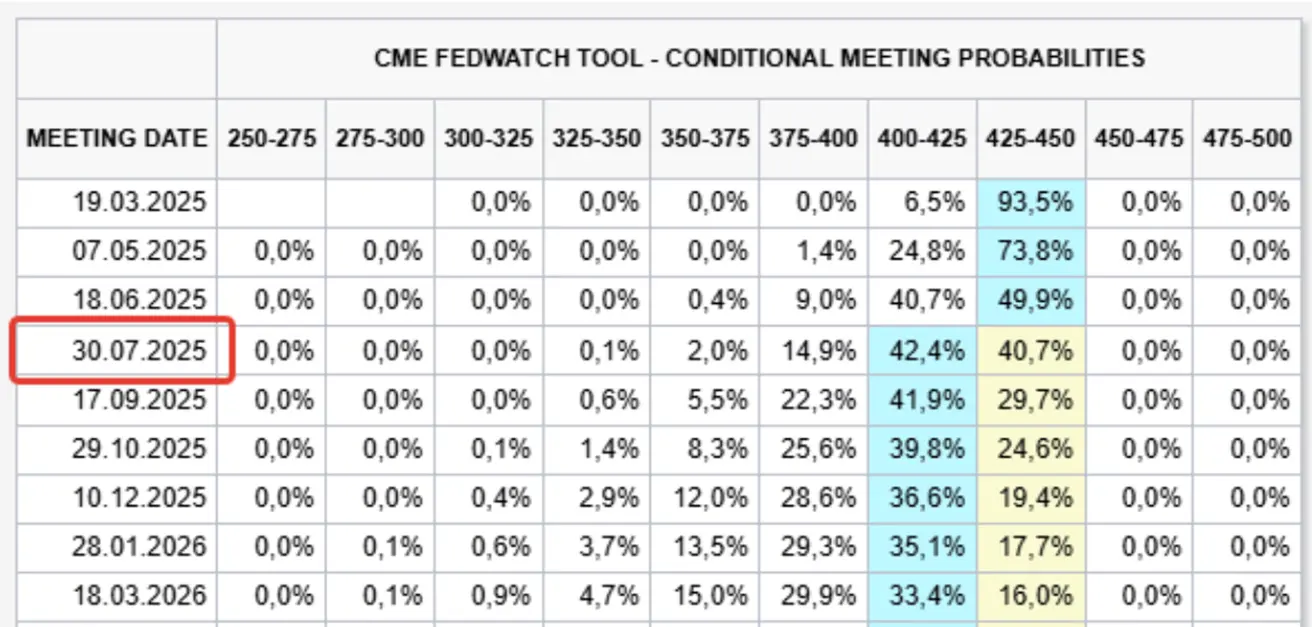
А week earlier:
Commentary:
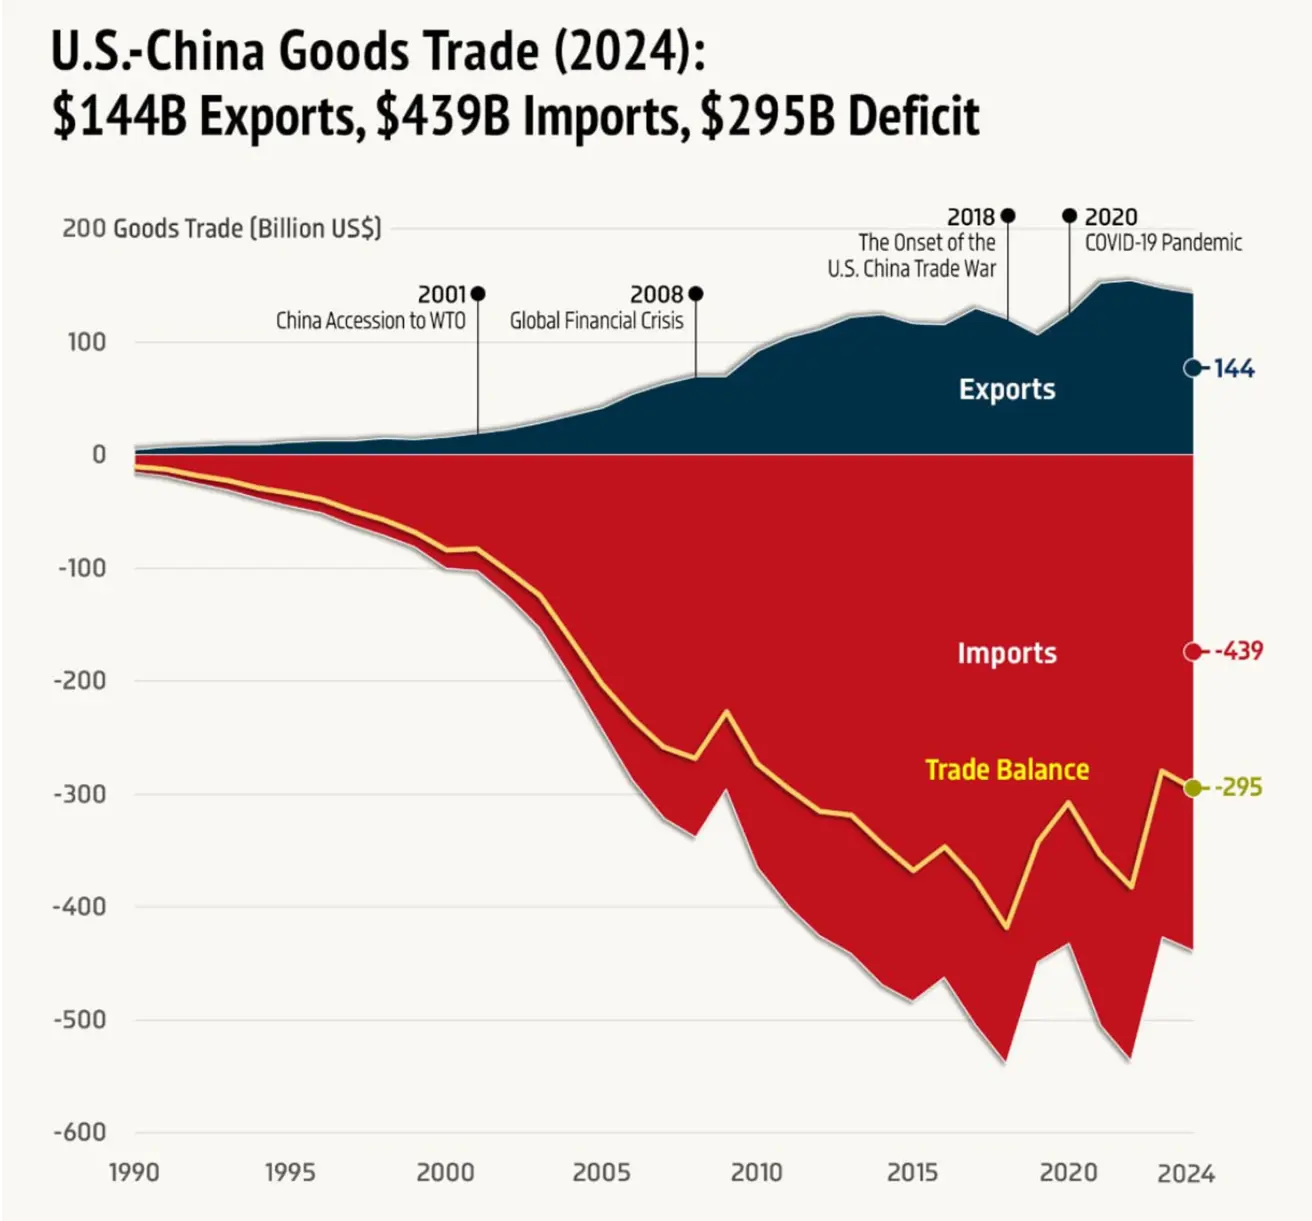
In January, the Consumer Price Index (CPI) increased by 0.5% month-over-month, seasonally adjusted, following a 0.4% rise in December—marking the seventh consecutive month of increases. The Core CPI (m/m) rose 0.4% in January. The categories contributing to the monthly increase included motor vehicle insurance, recreation, used cars and trucks, medical care, communication, and airline fares. Meanwhile, apparel, personal care products, and household furnishings and operations were among the few major categories that declined in January. On a year-over-year basis, the CPI rose by 3.0% (energy index: +1.0%, food index: +2.5%), while Core CPI increased by 3.3%. All figures came in above expectations, reinforcing that disinflation remains elusive and instead indicating signs of a second wave of inflationary pressures. A key takeaway from the Semiannual Monetary Policy Report to Congress (published a day before the CPI release) emphasized: "Since our policy stance is now significantly less restrictive than before and the economy remains strong, there is no urgency in adjusting our monetary policy position." During his speech, Chair Powell reaffirmed that the Federal Reserve does not anticipate cutting interest rates soon. The latest CPI data will further reinforce this position. "If the economy remains strong and inflation does not demonstrate sustained progress toward the 2% target, we can afford to maintain a restrictive policy stance for an extended period. Conversely, if the labor market unexpectedly weakens or inflation declines faster than anticipated, we are prepared to adjust policy accordingly." Despite the Federal Reserve's moderately hawkish rhetoric and stronger-than-expected CPI data, market expectations—reflected in the CME FedWatch Tool—remain unchanged. The first expected 25-basis-point rate cut is still projected for July 2025, with no significant shifts in the 12-month outlook, maintaining an anticipated policy range of 4.00%–4.25%. In 2024, U.S.–China trade recorded an export volume of $144 billion and an import volume of $439 billion, resulting in a trade deficit of $295 billion. With a threefold imbalance, it is evident that China stands to suffer more from trade wars than the U.S. In response to Trump's policies, China introduced retaliatory tariffs, including: A 10% tariff on U.S. oil and agricultural machinery A 15% tariff on coal and liquefied natural gas (LNG) Export controls on rare earth materials, including tungsten, tellurium, bismuth, molybdenum, and indium These measures signal China's strategic counteroffensive in the ongoing trade conflict, particularly in critical supply chain leverage sectors.
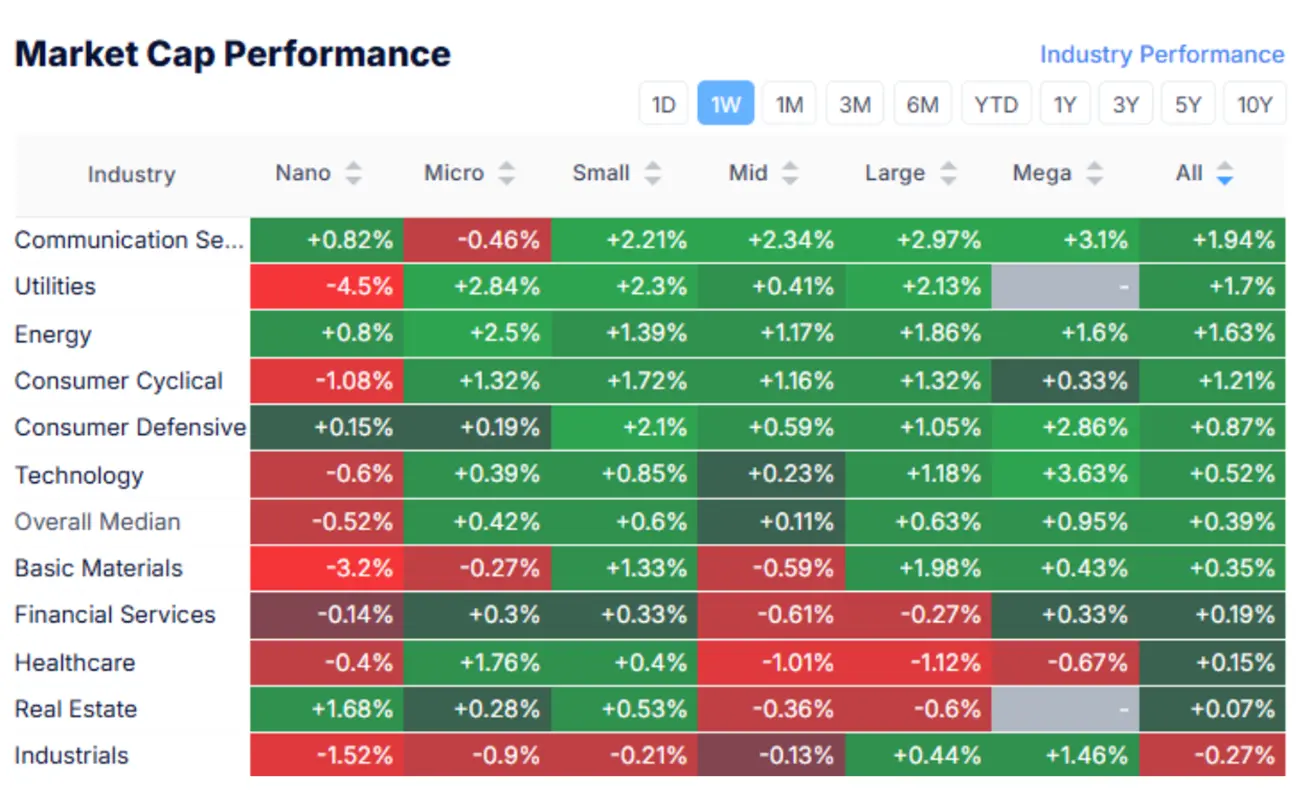
MARKET CAP PERFORMANCE
The overall market showed a median increase of 0.39% last week, reflecting positive sector dynamics. The best-performing sectors were communication services, utilities, and energy.
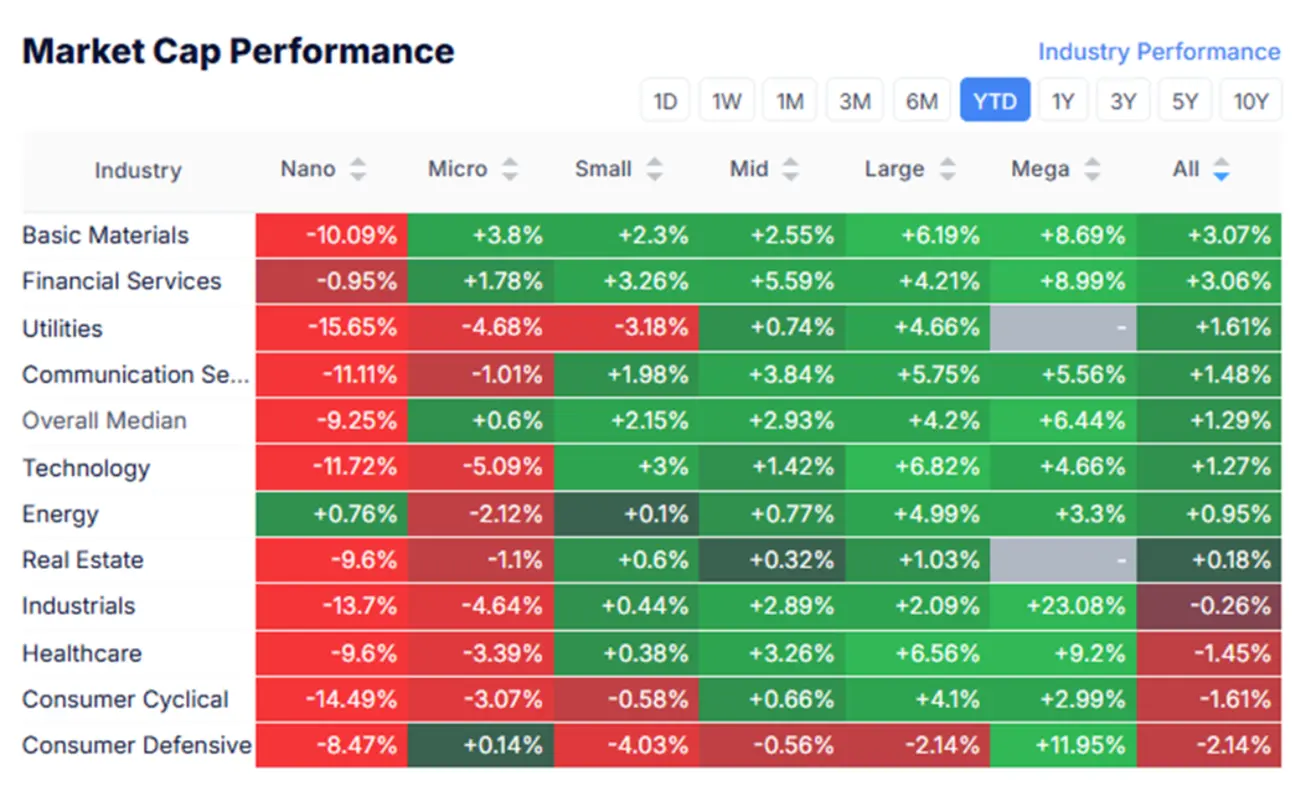
The market has ignored the inflation data, maintaining a Risk-ON sentiment.
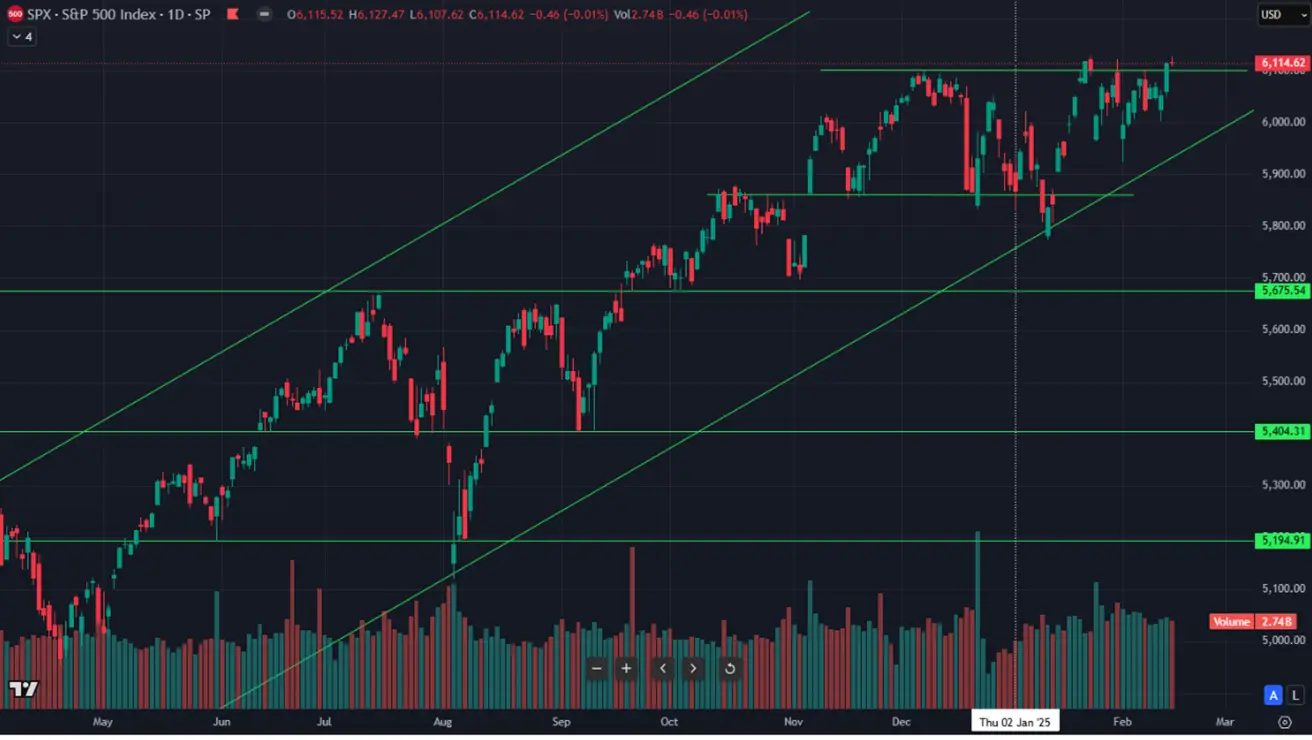
SP500
S&P 500: Weekly performance: +1.47% (weekly close: 6114.62). YTD growth: +3.58%.
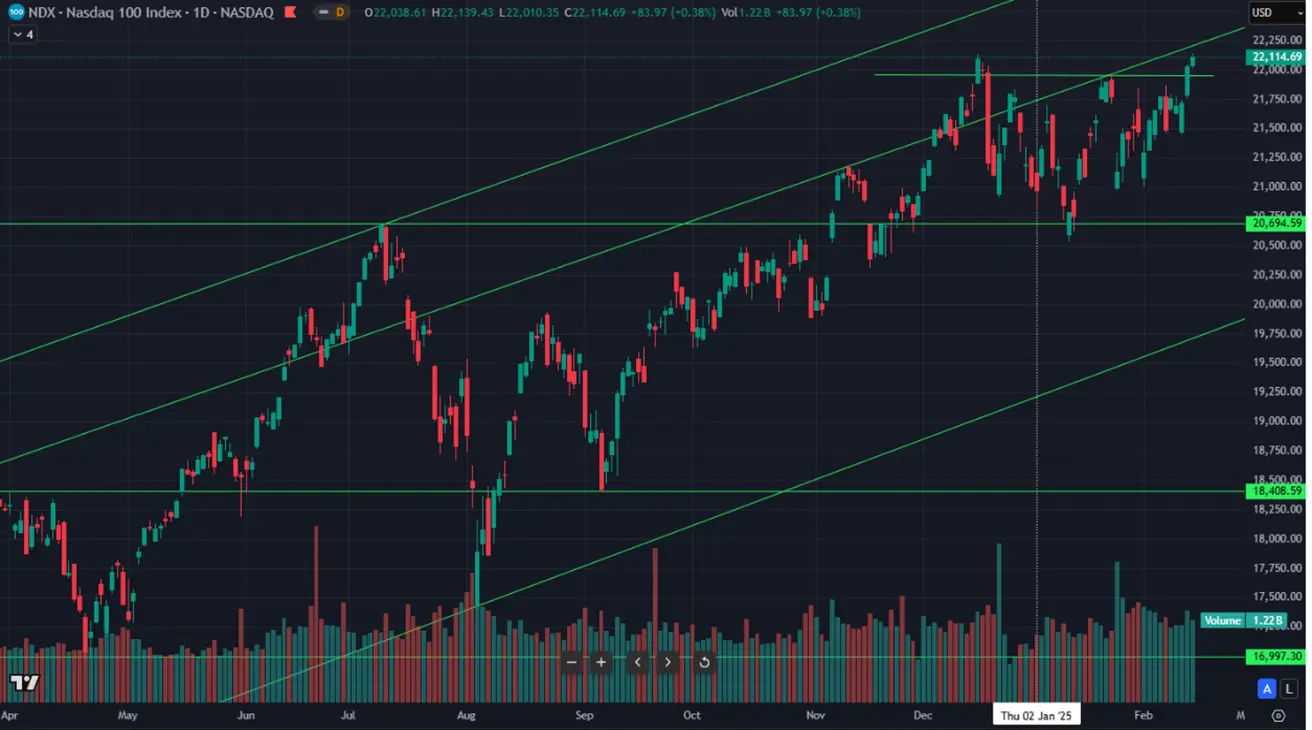
NASDAQ100
Nasdaq 100: Weekly performance: +2.90% (weekly close: 22114.69). YTD growth: +4.71%.
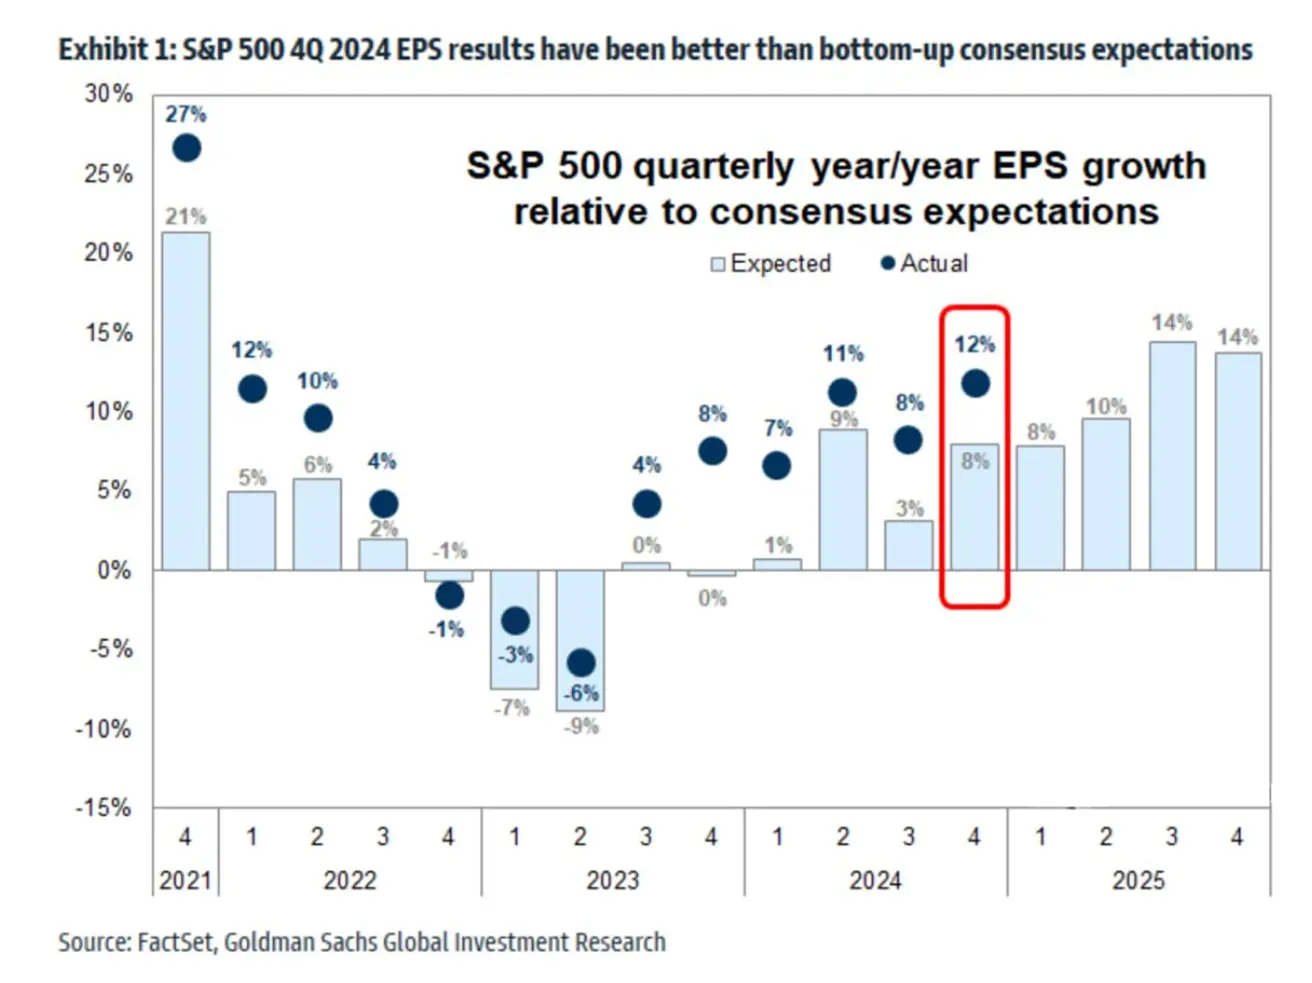
Corporate Earnings Overview
U.S. companies' earnings in the fourth quarter exceeded consensus estimates by 4%, marking the most substantial growth of 12% since Q1 2022.
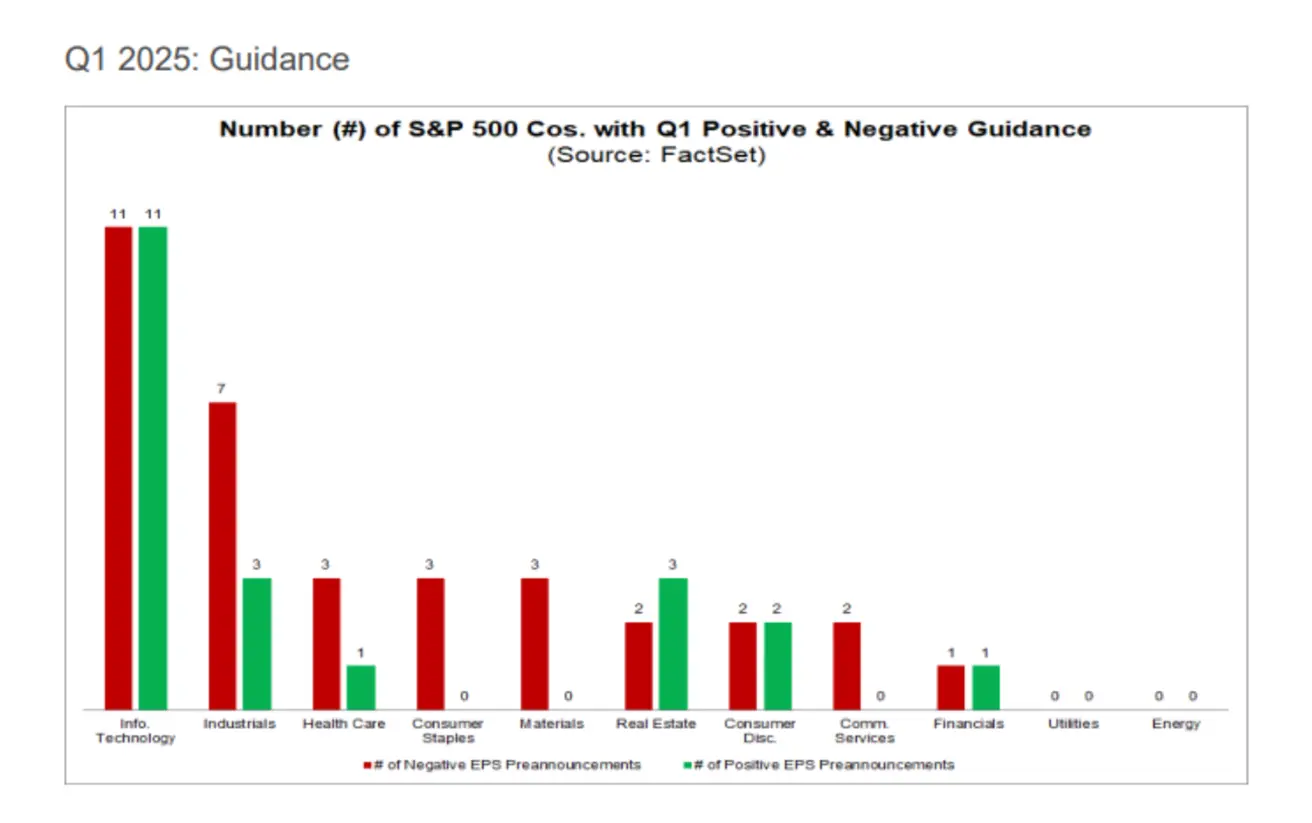
So far, 55 companies have released their earnings per share (EPS) forecasts for the first quarter 2025. Of these, 34 companies (62%) issued a negative EPS outlook, while 21 (38%) provided an optimistic EPS forecast.
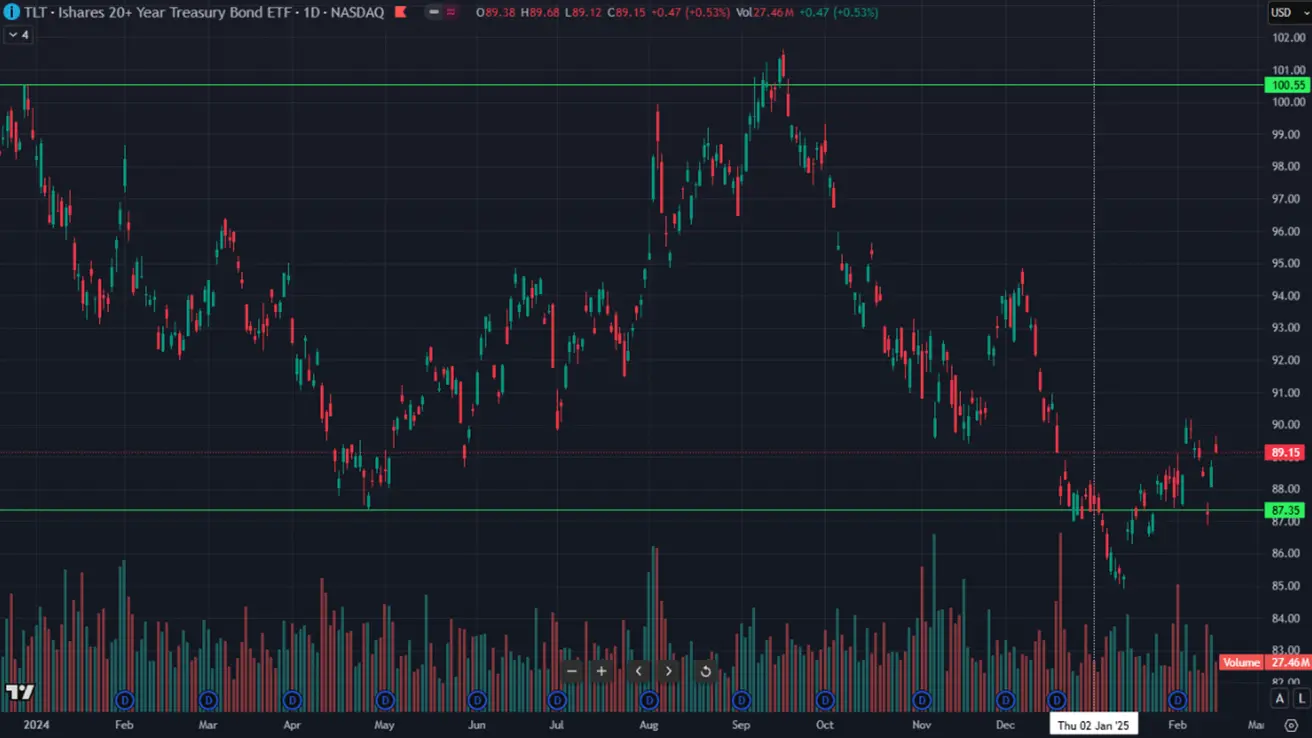
BOND MARKET
Bond Market – a slight yield increase at the end of the week.
- Treasury Bonds 20+ (ETF TLT): -0.13% (weekly close: $89.15). YTD: +1.54%.
YIELDS AND SPREADS
Yields and Spreads (2025/02/17 vs 2024/02/14):
- 10-Year U.S. Treasury Yield: 4.493% (prev: 4.48%)
- ICE BofA BBB US Corporate Index Effective Yield: 5.59% (prev: 5.44%)
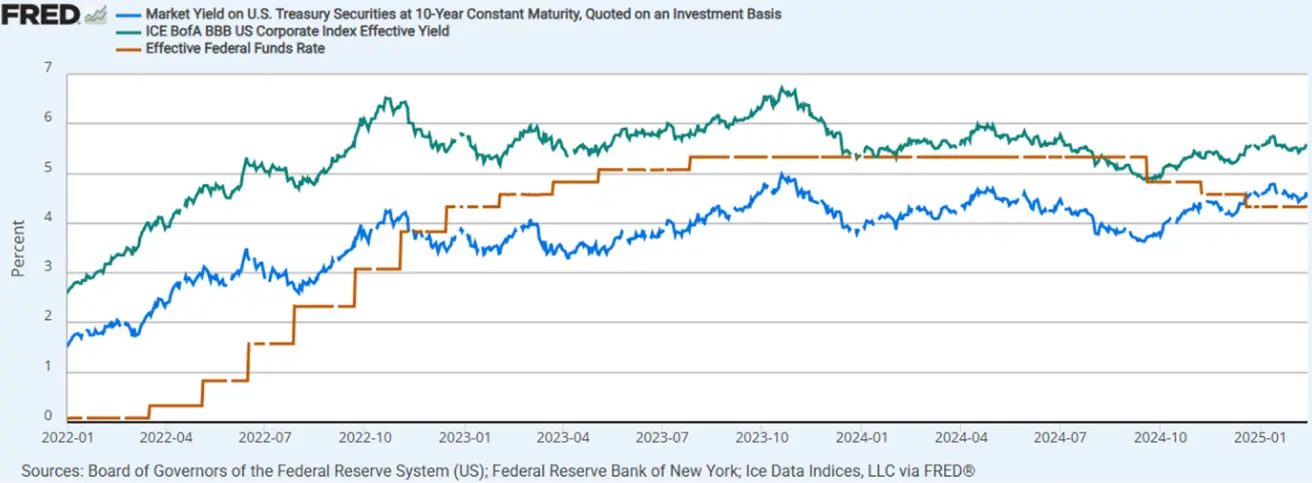
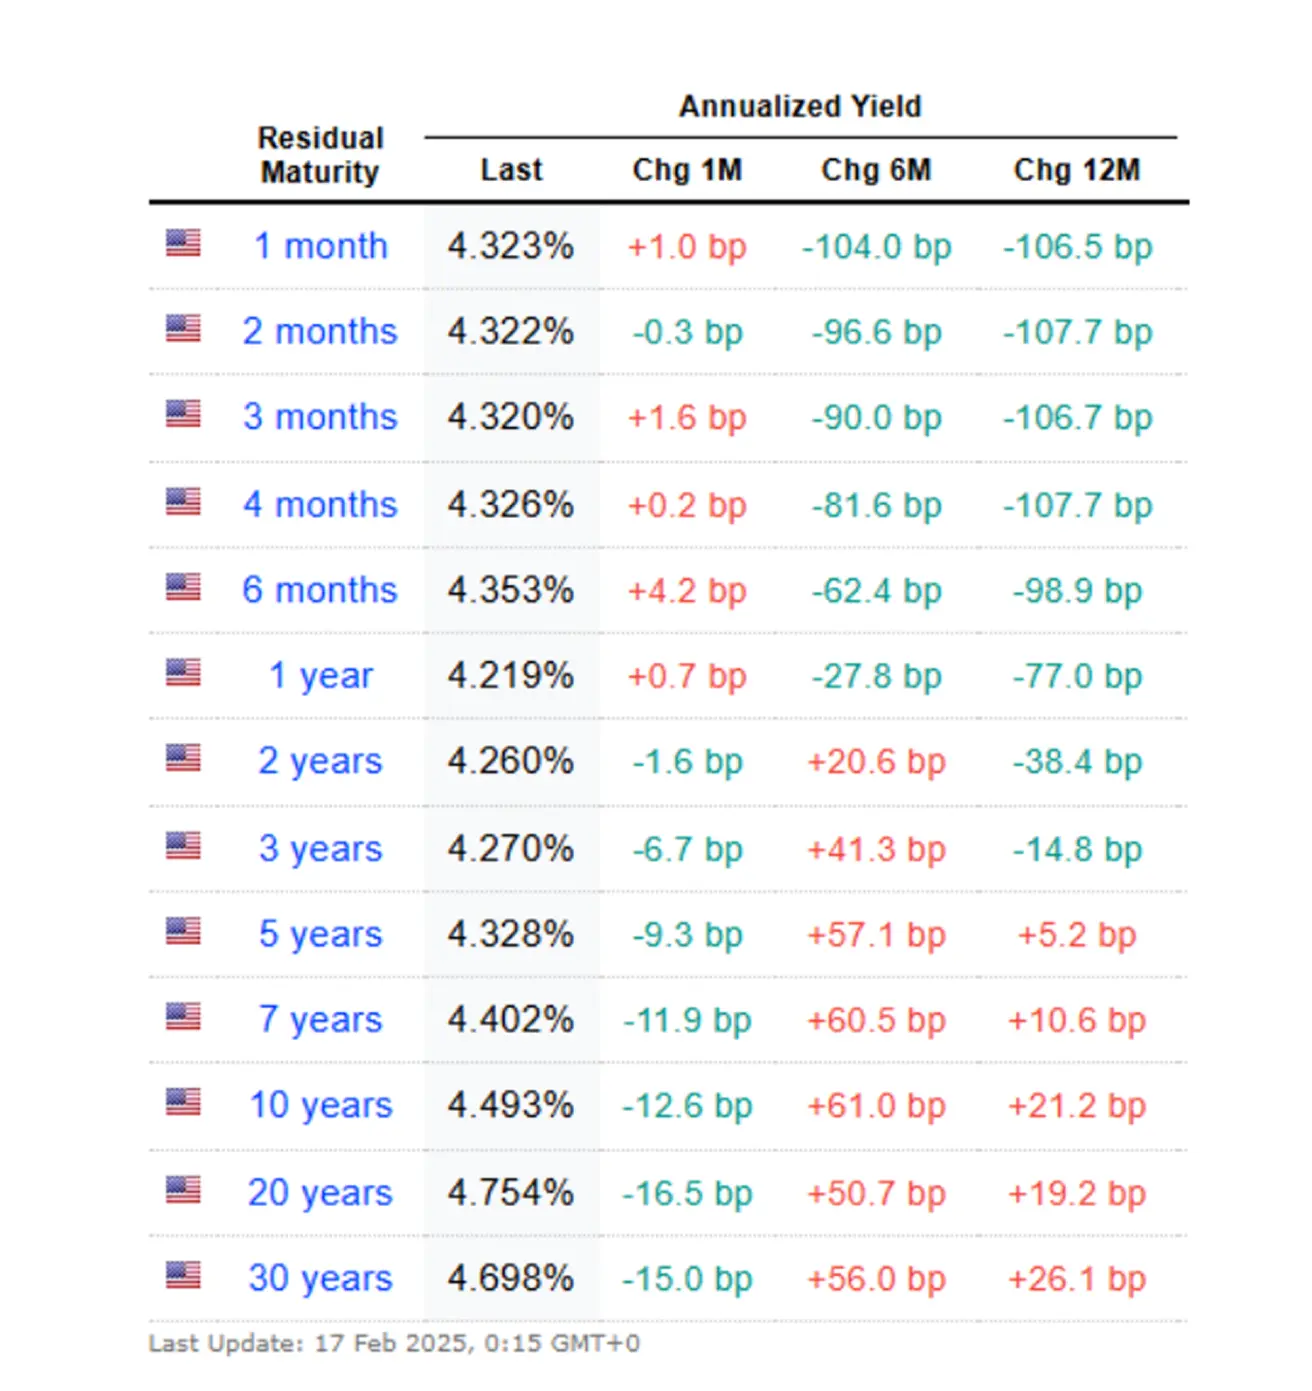
The yield spread between 10-year and 2-year U.S. government bonds is 18.3 versus 19.6 basis points (the difference in yields between long-term and short-term debt). The yield curve for U.S. Treasury bonds shows the yields of bonds with different maturities. It is a key indicator of the state of the economy and market expectations.:
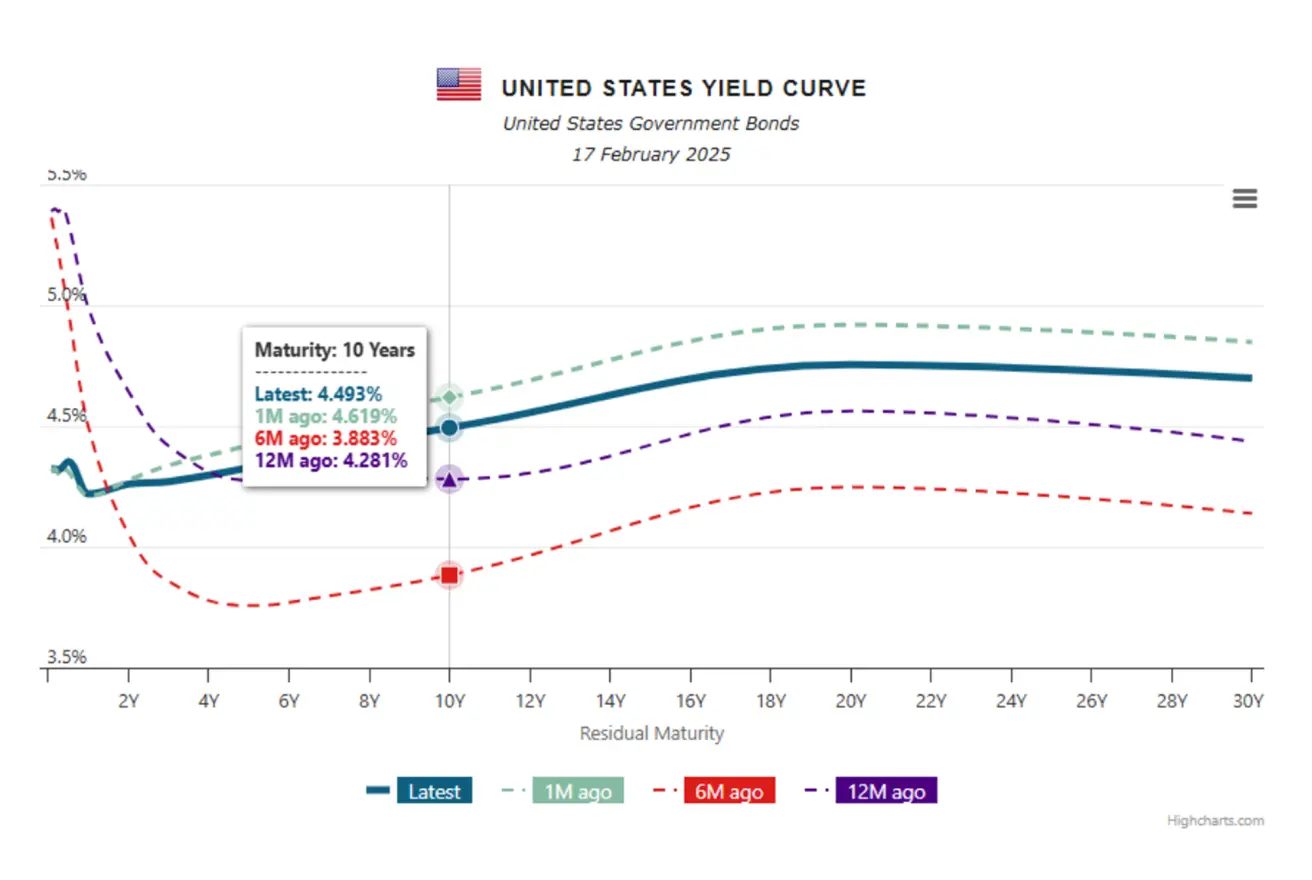
Yield Curve for U.S. Treasuries:
- Short-term (up to 1 year): 4.32 - 4.219%
- Mid-term (3-7 years): 4.27 – 4.402%
- Long-term (10+ years): 4.493-4.698%
GOLD FUTURES (DX)
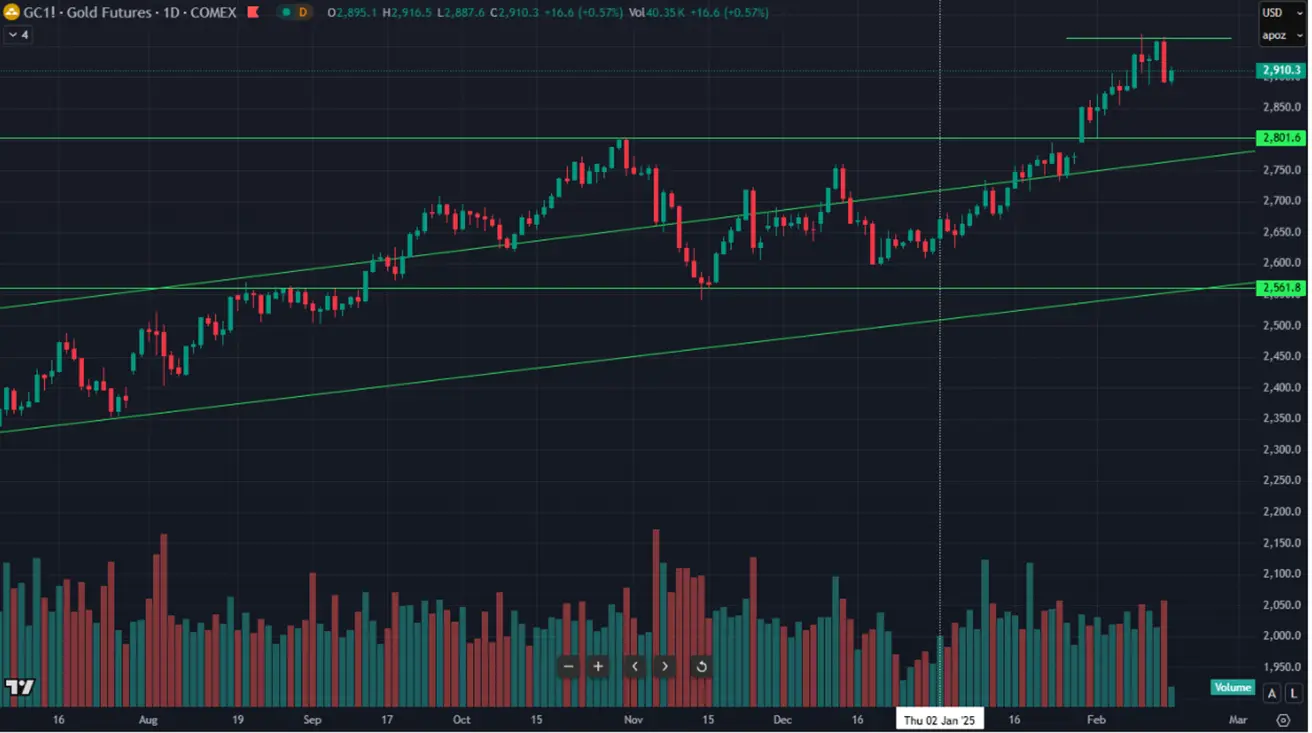
Gold Futures (GC): Gold continues to hit historical highs.
- Weekly performance: +0.26% (weekly close: $2,893.7 per oz.)
- YTD growth: +9.57%
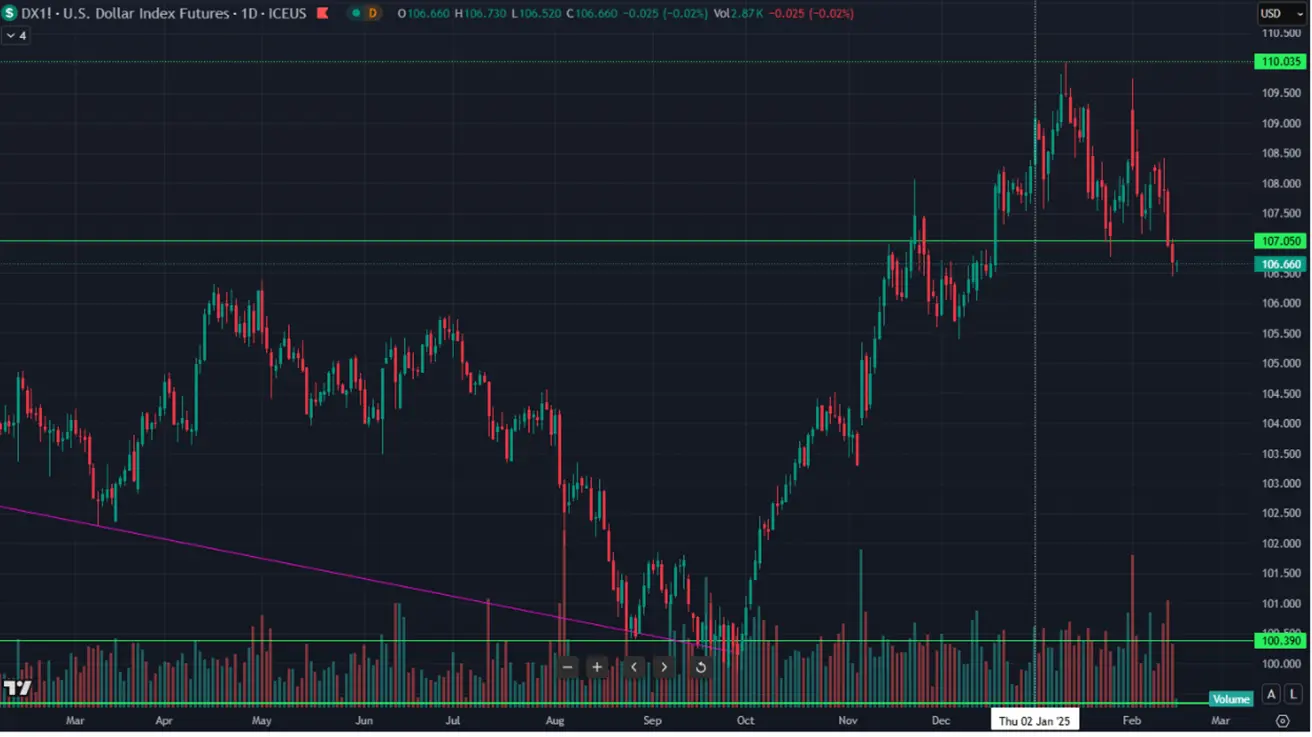
DOLLAR INDEX FUTURES (DX)
Dollar Index Futures (DX):
- Weekly performance: -0.54% (weekly close: 106.685)
- YTD: -1.52%:
OIL FUTURES
OPEC: Global demand estimates for 2025-26 remain unchanged. 2025:105.2 million b/d (+1.45 million b/d), 2026: 106.63 million b/d (+1.43 million b/d). The IEA raised its forecast for demand growth in 2025 by 50 thousand b/d to +1.1 million b/d (104 million b/d). Global oil supplies will increase by 1.6 million b/d to 104.5 million b/d in 2025. Unlike stock indexes, the leading cryptocurrencies did not show a strong positive; generally, the dynamics are neutral. Weekly change: -0.69%, closing at $71.06 per barrel. Year-to-date change: -1.78%.
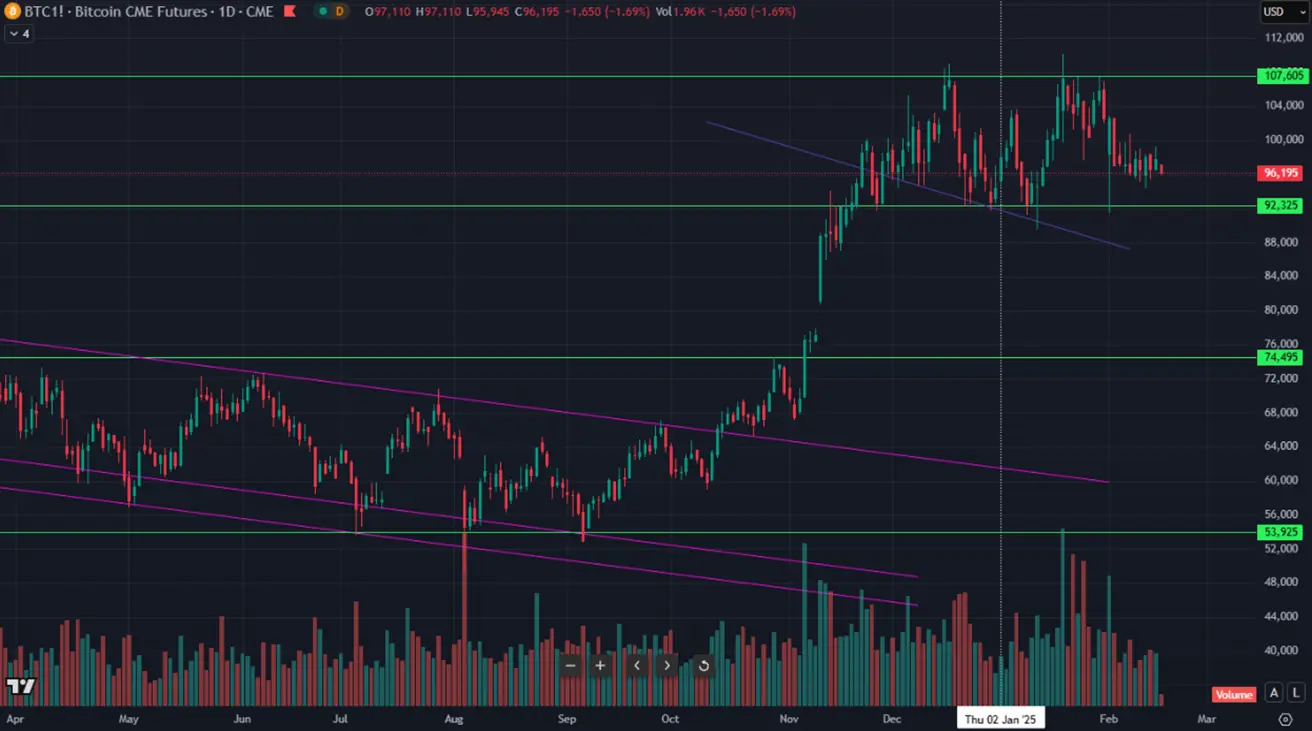
BTC FUTURES
Weekly performance: +1.62% (weekly close: $97,845) YTD growth: +2.70%
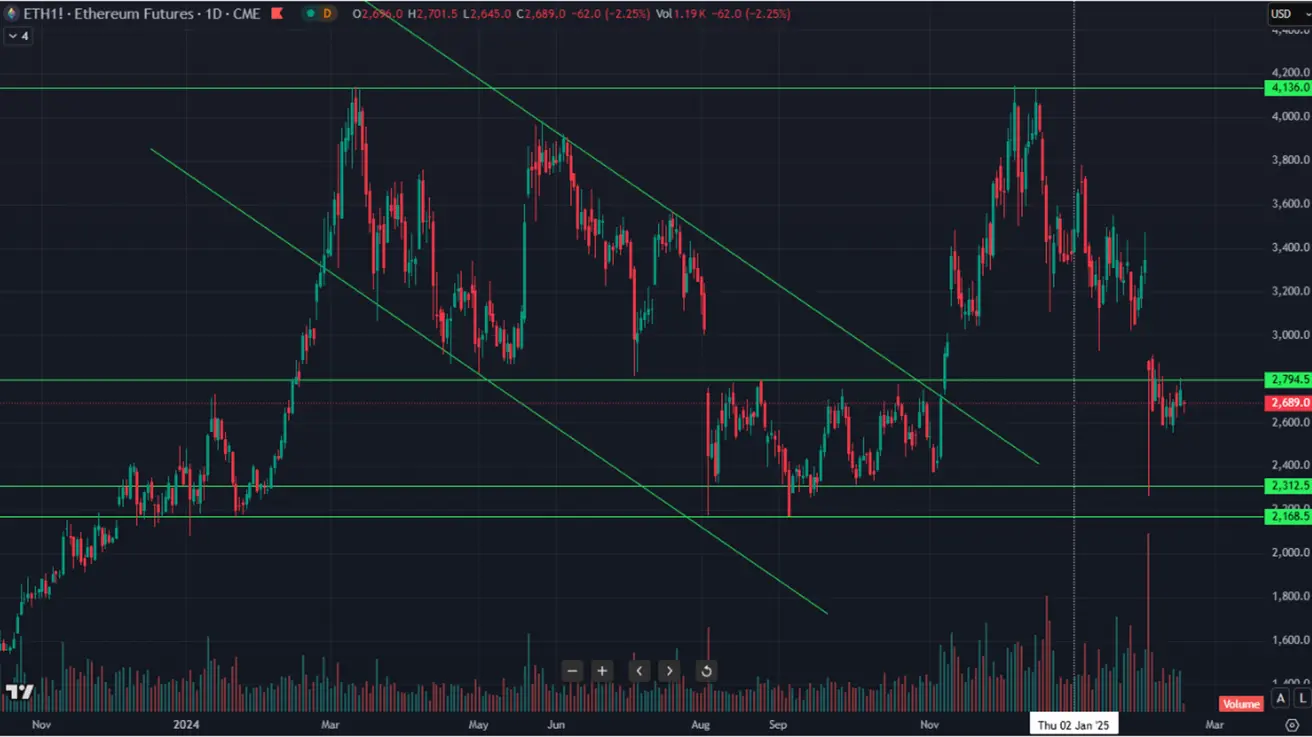
ETH FUTURES
Weekly performance: -0.81% (weekly close: $2,571) YTD decline: -24.02%
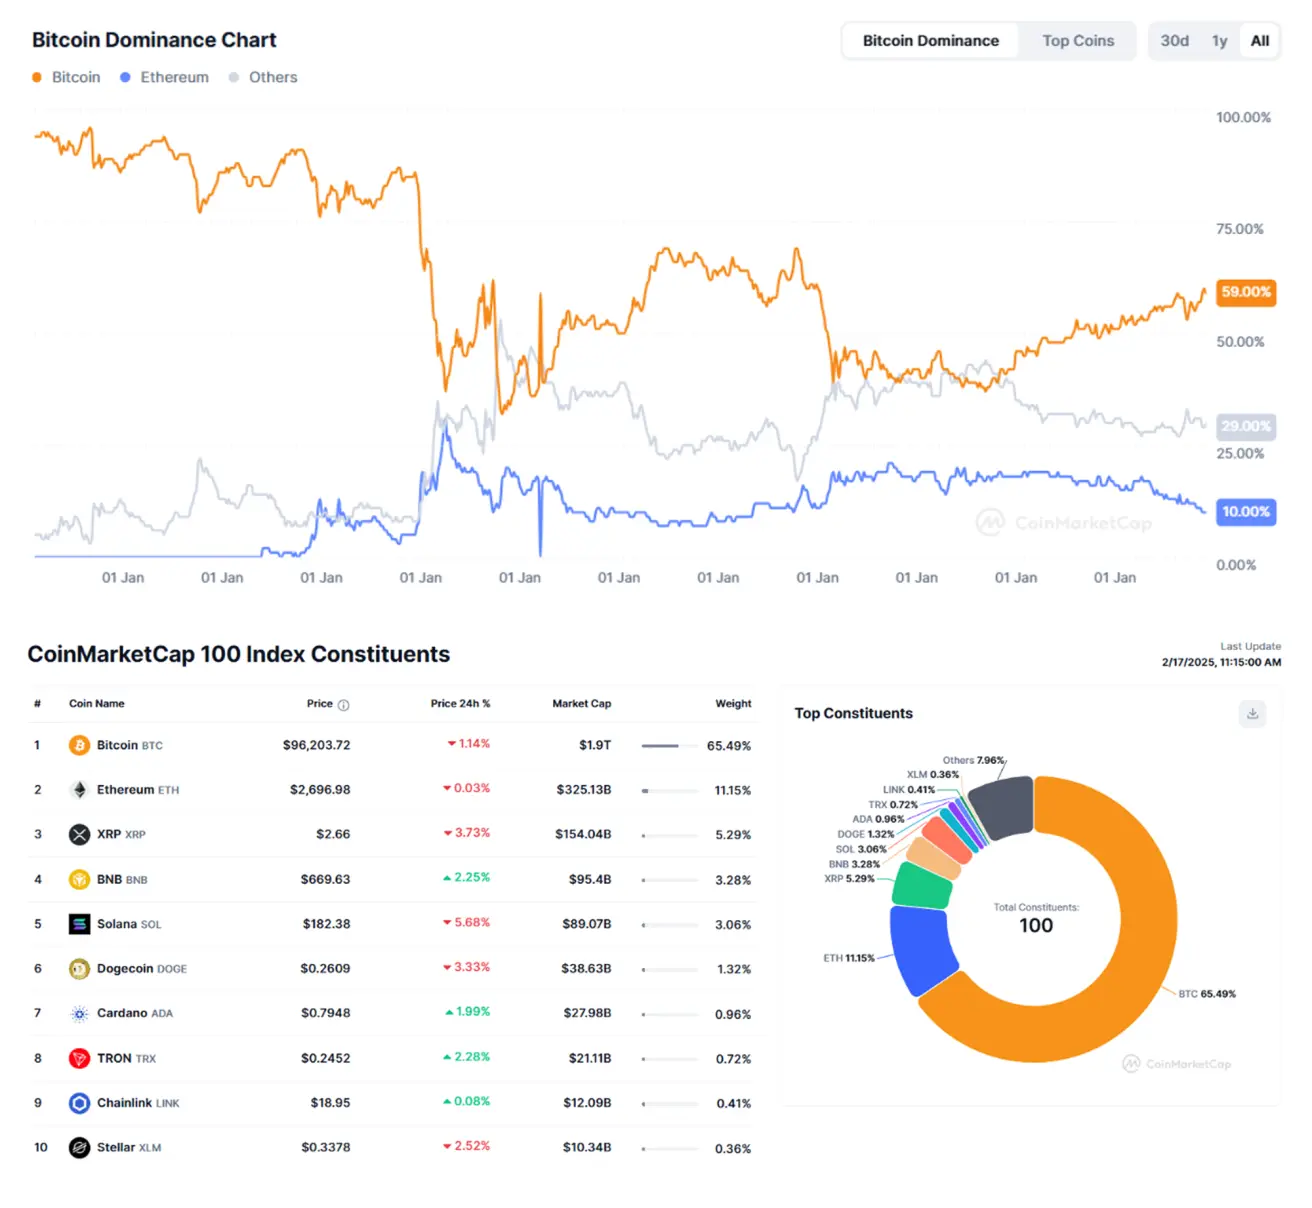
Fed Chairman Powell, in a speech to Congress, said that he supports the creation of a regulatory framework for stablecoins; The U.S. Securities and Exchange Commission has accepted applications for the creation of Solana spot ETFs from iShares, Bitwise, Canary and VanEck; The capitalization of the crypto market is unchanged at $3.19 trillion ($3.19 trillion a week earlier) (coinmarketcap.com )
Bitcoin Market Capitalization: 59.8% (60.7%), Ethereum: 10.2% (9.0%), Others: 30.0%: