Lietuvių
 Русский
 Қазақша
 Eesti
EestiJanuary 20 — January 24: Weekly economic update
Key market updates
MACROECONOMIC STATISTICS
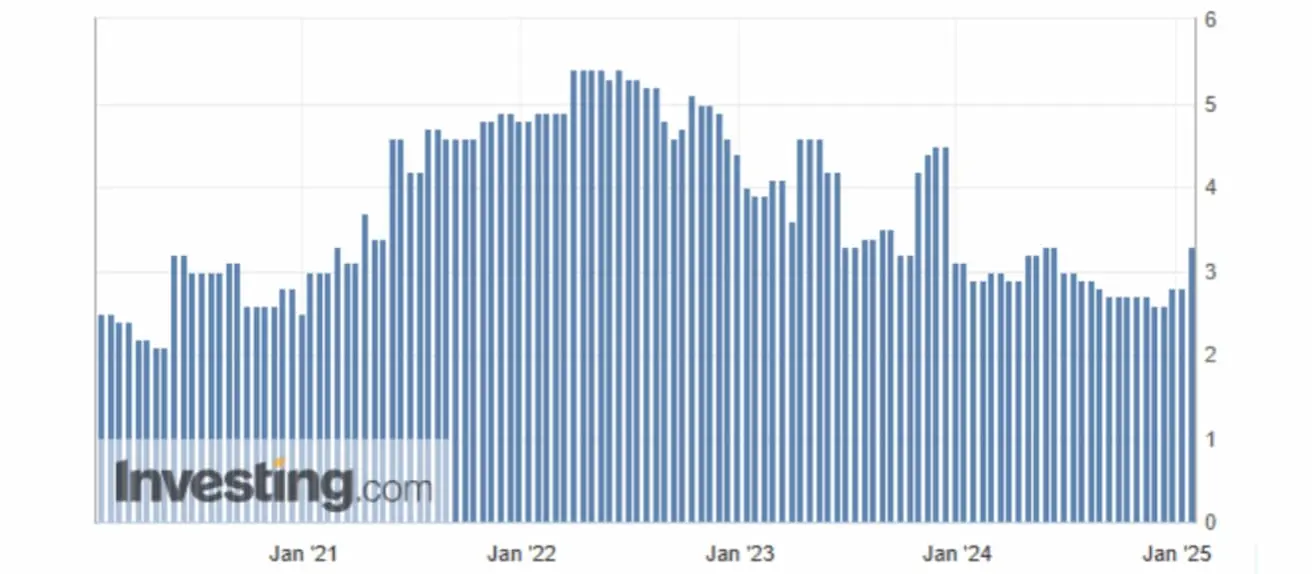
INFLATION
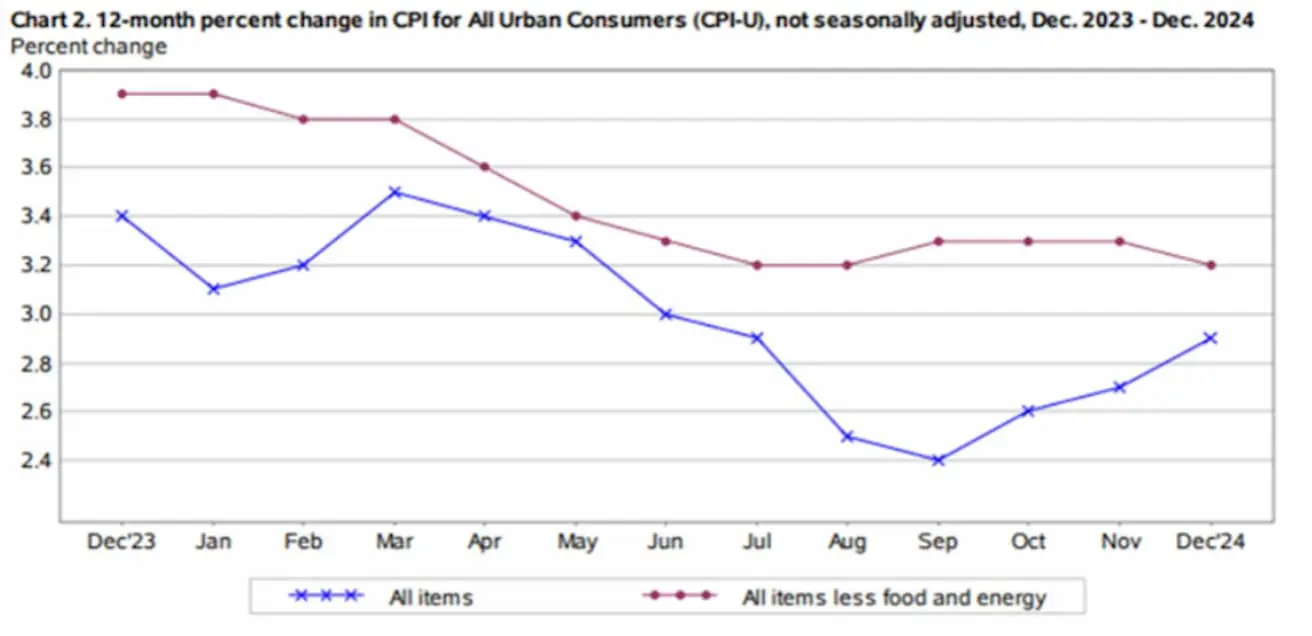
- Core Consumer Price Index (CPI) (m/m) (December): 0.2% (prev: 0.3%);
- Consumer Price Index (CPI) (m/m) (December): 0.4% (prev: 0.3%);
- Core Consumer Price Index (CPI) (y/y) (December): 3.2% (prev: 3.3%);
- Consumer Price Index (CPI) (y/y) (December): 2.9% (prev: 2.7%).
INFLATION EXPECTATIONS (MICHIGAN)
- 12-month expected inflation (December): 3.3%, prev: 2.8%;

- 5-year expected inflation (December): 3.3%, prev: 3.0%.
BUSINESS ACTIVITY INDEX (PMI)
- Services Sector (December): 52.8 (prev: 56.8);
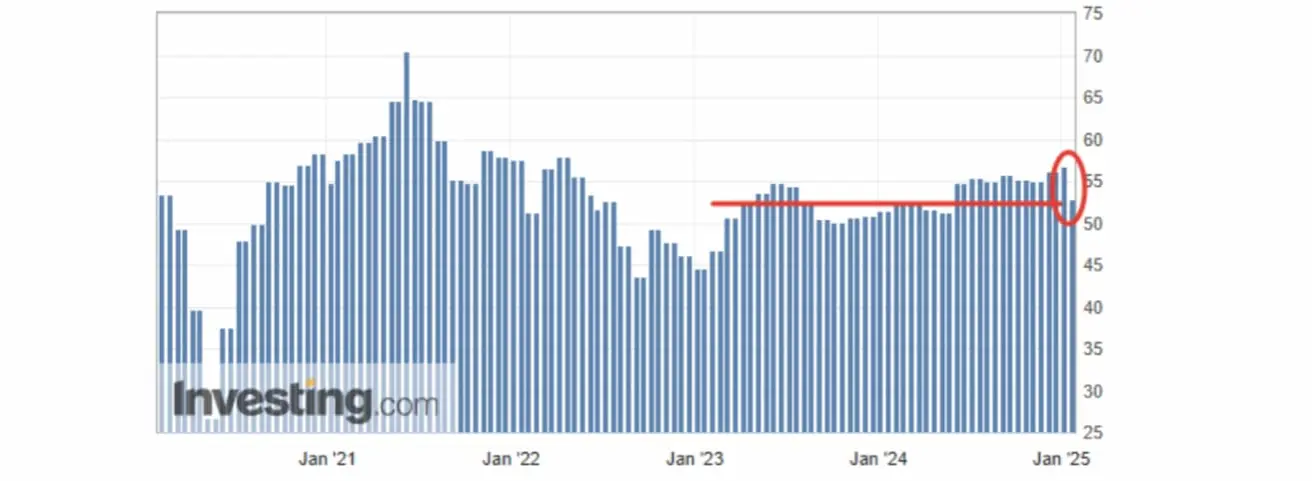
- Manufacturing Sector (December): 50.1 (prev: 49.3);
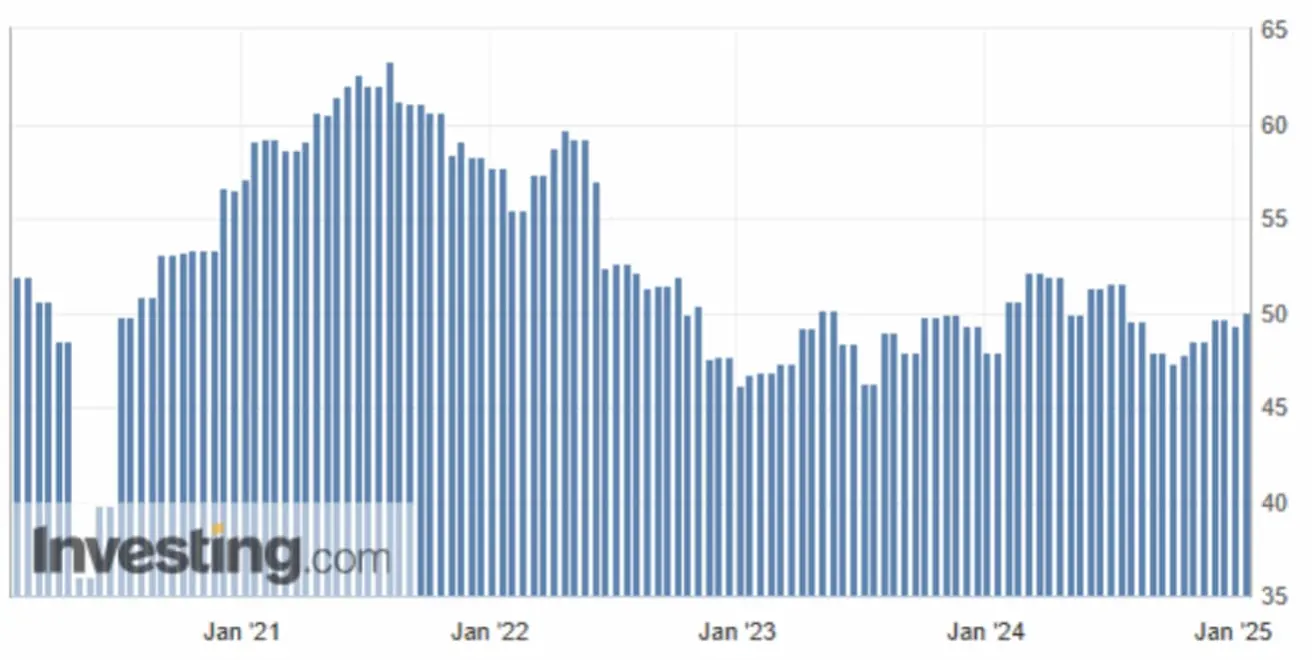
- S&P Global Composite (December): 52.4 (prev: 55.4).
GDP (BEA) (q/q) (3Q), third estimate:
- 3.1% (prev: 3.0%).
LABOR MARKET
- Unemployment Rate (December): 4.1% (prev: 4.2%);
- Nonfarm Payrolls Change (December): 256K (prev: 212K);
- Private Nonfarm Payrolls Change (December): 223K (prev: 182K, revised);
- Average Hourly Earnings (December, y/y): 3.9% (prev: 4.0%).
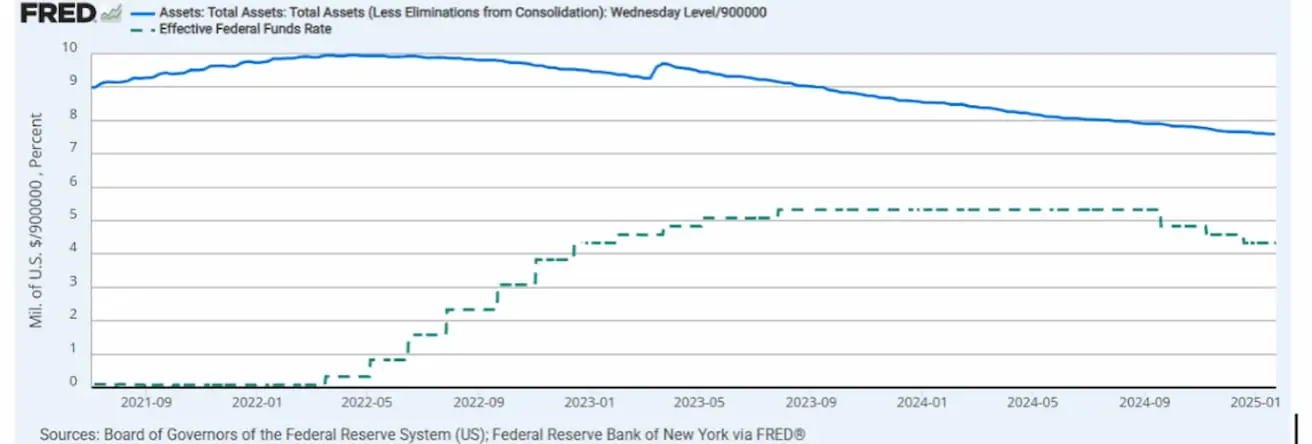
MONETARY POLICY
- Federal Funds Rate (EFFR): 4.25%–4.50% (dotted line);
- The Fed’s balance sheet (in blue) remains almost unchanged: $6.831 trillion (vs. $6.834 trillion the previous week).
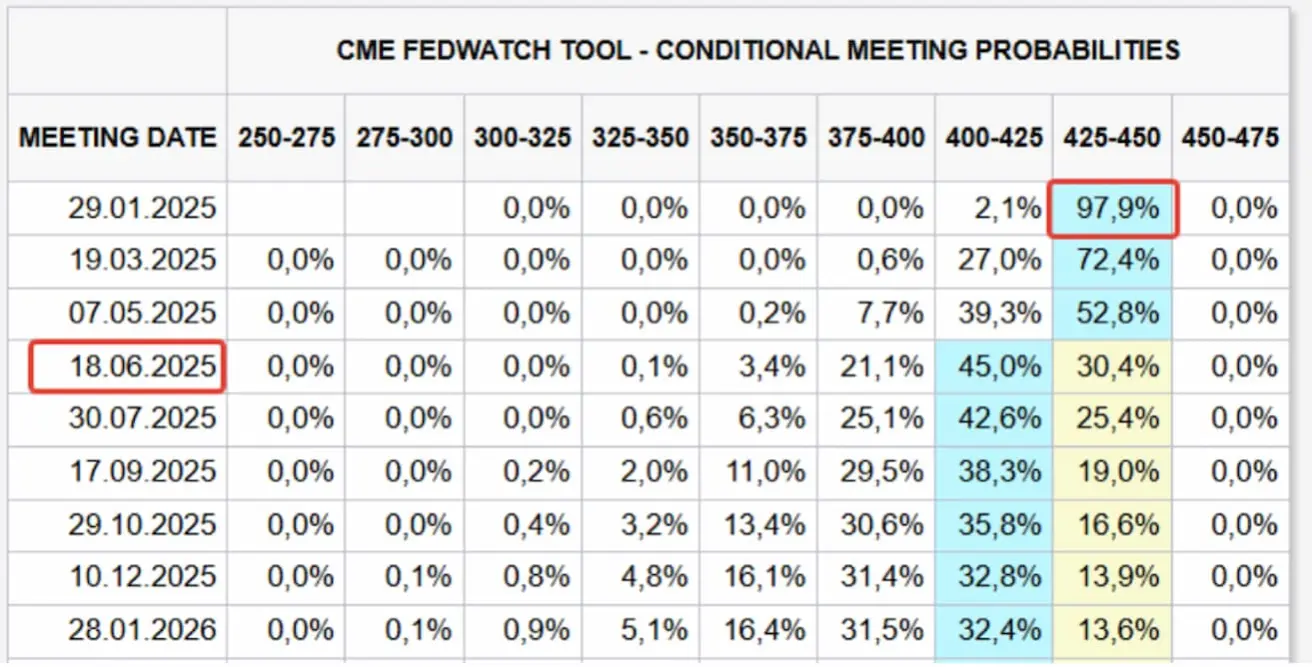
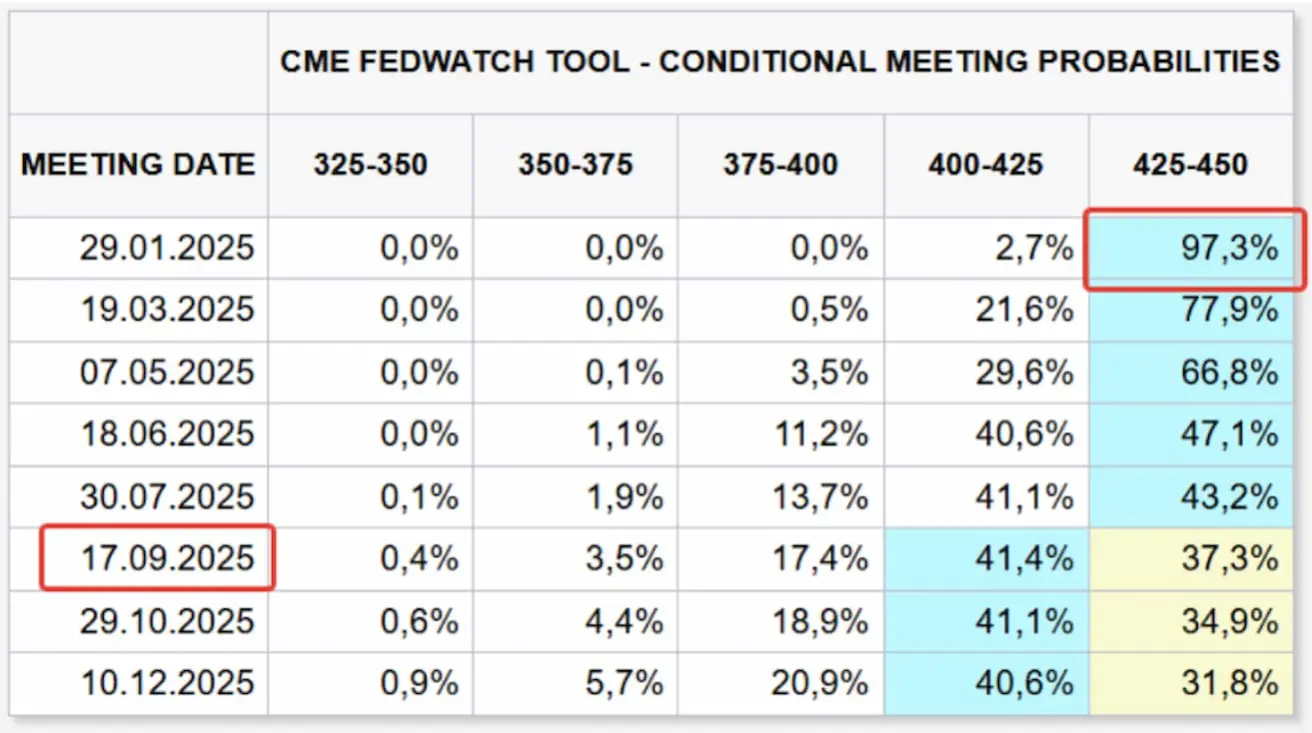
MARKET FORECAST FOR RATE
Today:
A week earlier:
Commentary:
Inflation expectations from the University of Michigan rose again, both for 12 months ahead (to 3.3%) and for 5 years ahead (also to 3.3%). Inflation remains a key focus in financial markets.
Business activity indices (PMI) for the services sector and the composite index dropped to levels last seen in March 2024 (52.8 and 52.4, respectively), but both remain in the expansion zone. However, the decline in the services sector PMI is a positive factor as a leading inflation indicator, given that services inflation constitutes a significant portion of the CPI index.
The main spotlight last week was on Donald Trump's first statements.
Donald Trump officially assumed office as the 47th President of the United States.
At the World Economic Forum in Davos (Switzerland), he announced that he would "demand an immediate reduction in interest rates." During his first term, Trump pressured Federal Reserve Chair Jerome Powell over high rates.
According to the FedWatch tool, nearly all expect the Fed to keep the key rate at 4.25%-4.50% at this week's meeting.
Looking ahead to the next 12 months: a single 0.25% rate cut to a range of 4.00%-4.25% is anticipated in June (shifted from September).
Trump's speech also emphasized reducing oil prices, taxes, and significantly easing cryptocurrency regulations.
He stated that he "would prefer not to apply" tariffs against China.
MARKET
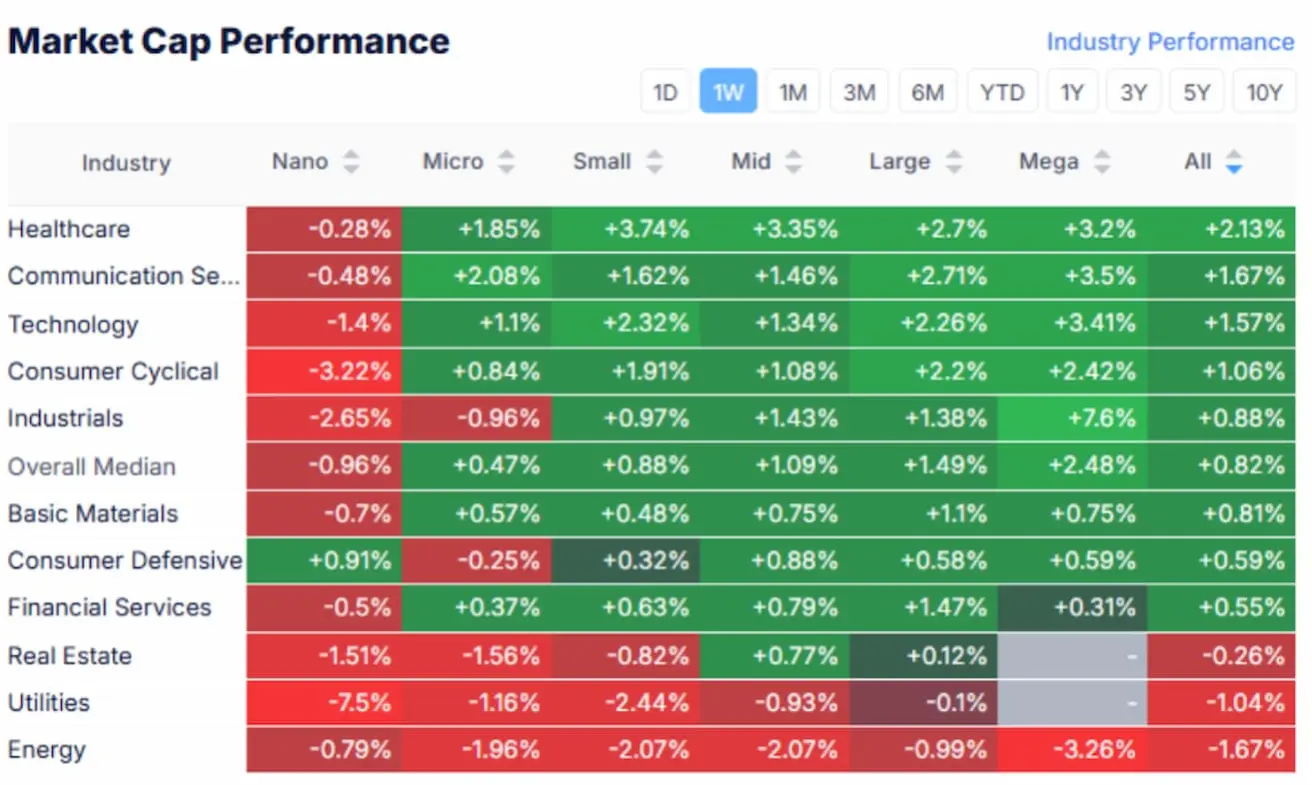
MARKET CAP PERFORMANCE
YTD (Year-to-Date from the beginning of the year to today’s date):
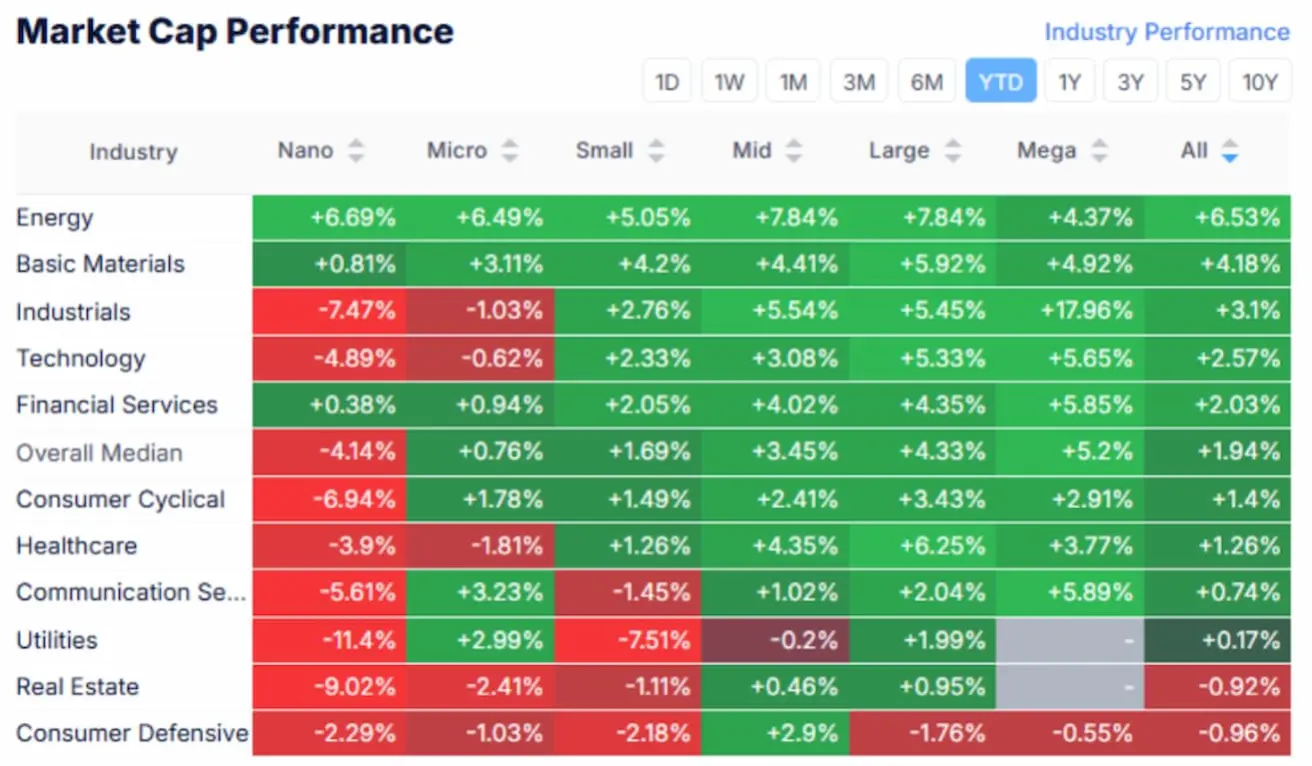
Defensive sectors showed the worst performance last week: utilities, real estate, and energy (the latter clearly under pressure from Trump's plans). However, overall, the stock market continued its Risk-On trend from the start of the year, with the defensive consumer sector being the underperformer.
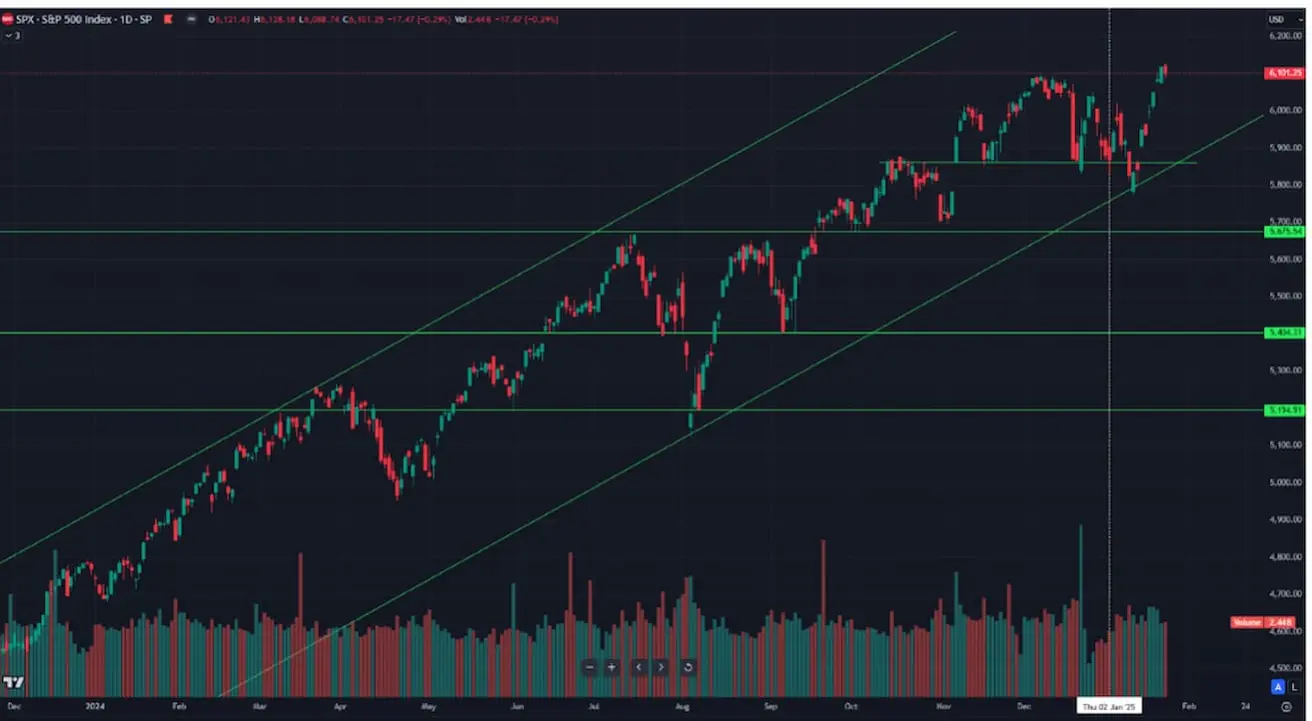
SP500
S&P 500: +1.75% (weekly close at 6,100.84). 2025 growth: +3.35%
NASDAQ100
+1.55% (weekly close at 21,774.01). 2025 growth: +3.10%
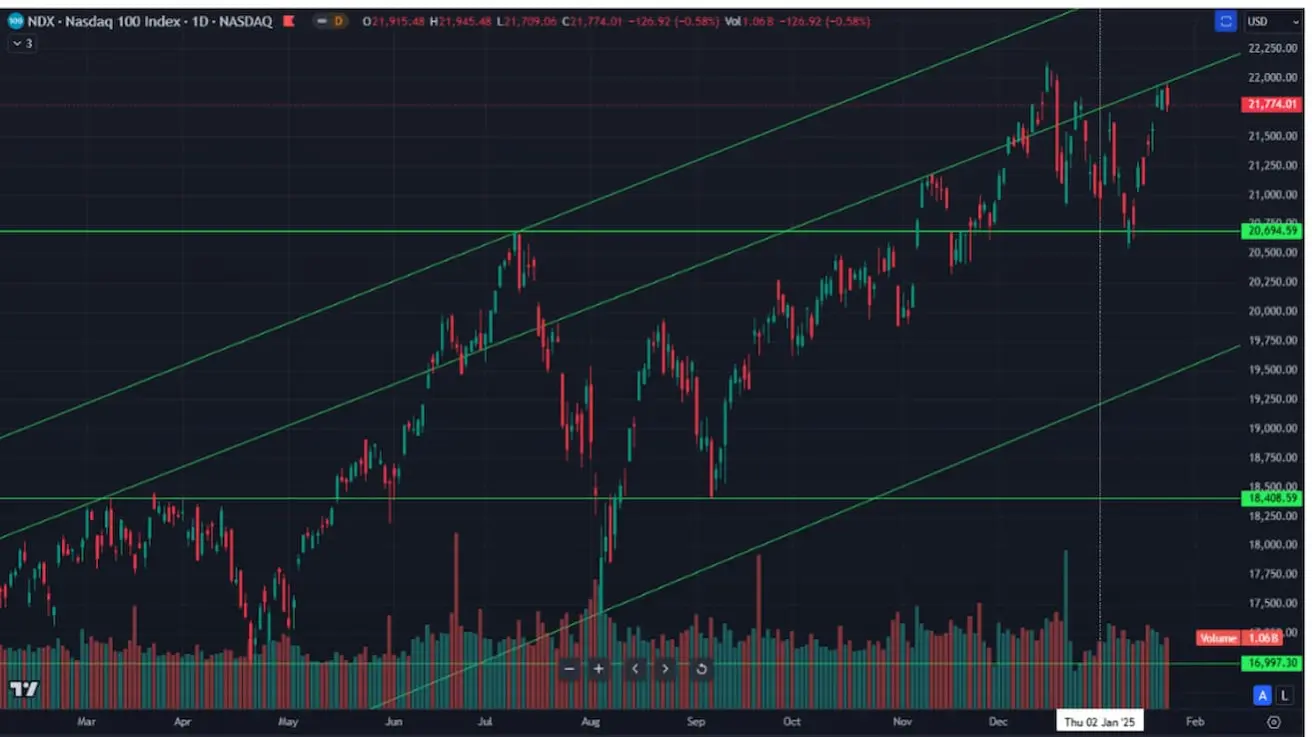
Key indices were in the green last week. The S&P 500 reached another record high at 6,128.18 points, while the Nasdaq 100 slightly lagged behind.
A key focus was on the Chinese AI startup DeepSeek, which surpassed ChatGPT to become the most popular free app in the U.S. App Store. A potential sector leader shift in artificial intelligence might be underway.
BOND MARKET
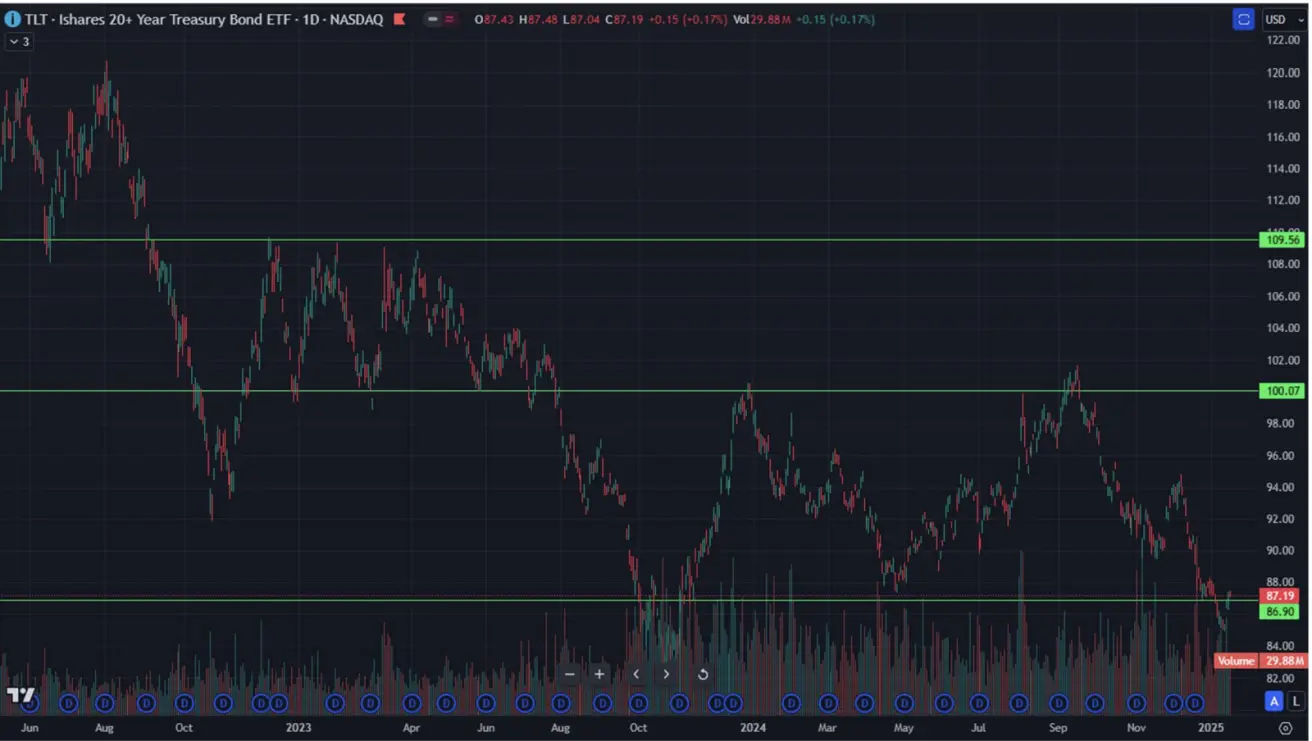
Treasury Bonds 20+ (ETF TLT):
- Weekly: +0.03%. YTD: -0.66%.
YIELS AND SPREADS
Yields and Spreads (01/23/2025 vs. 01/17/2024):
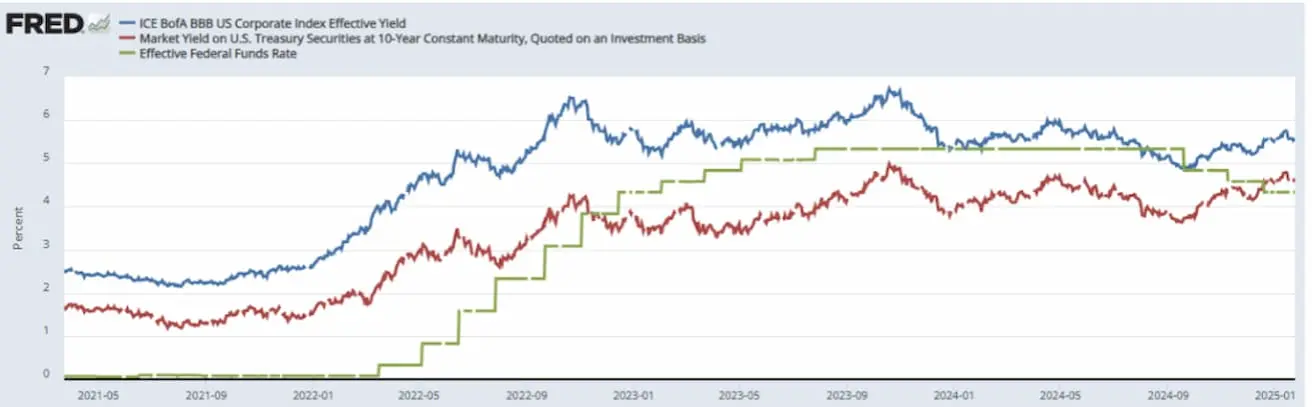
- Market yield on 10-Year U.S. Treasury securities: 4.61% (prev: 4.759%)
- ICE BofA BBB U.S. Corporate Index Effective Yield: 5.57% (prev: 5.62%)
The yield spread between 10-year and 2-year U.S. Treasury bonds is 36.0 basis points (the yield difference between long-term and short-term debt)
The divergence between the Fed rate and US10Y yields:
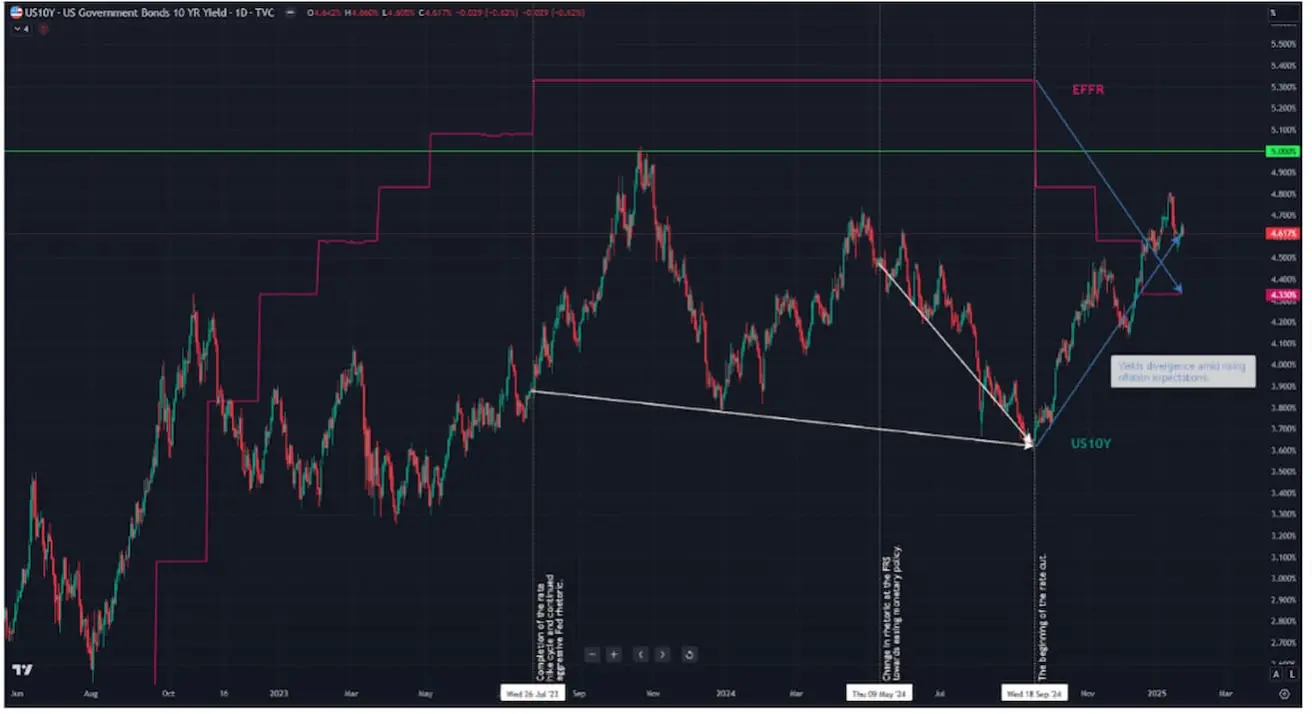
Vertical lines:
- 1st: July 2023 – end of the rate hike cycle.
- 2nd: May 2024 – shift in Fed rhetoric (at this meeting, Powell highlighted increased financial stability risks).
- 3rd: September 2024 – beginning of the rate-cutting cycle.
White arrows indicate that during the rate hold period (no increases) and from the moment the Fed shifted its rhetoric (from aggressive to more neutral), the yield on 10-year US Treasuries decreased. However, during the Fed’s rate-cutting period by 1.0%, the yield on 10-year Treasuries, on the contrary, rose by 1.0%.
Key reasons: rising inflation expectations amid the lack of progress in reducing core consumer inflation (see chart below) and the increase in the overall CPI index. Besides that, pro-inflationary risks associated with Trump’s trade policy and increased money supply exerting pressure on the bond market.
The peak yield in this cycle was 5%. The current yield stands at 4.61%, which is quite attractive in the context of high stock market multipliers.
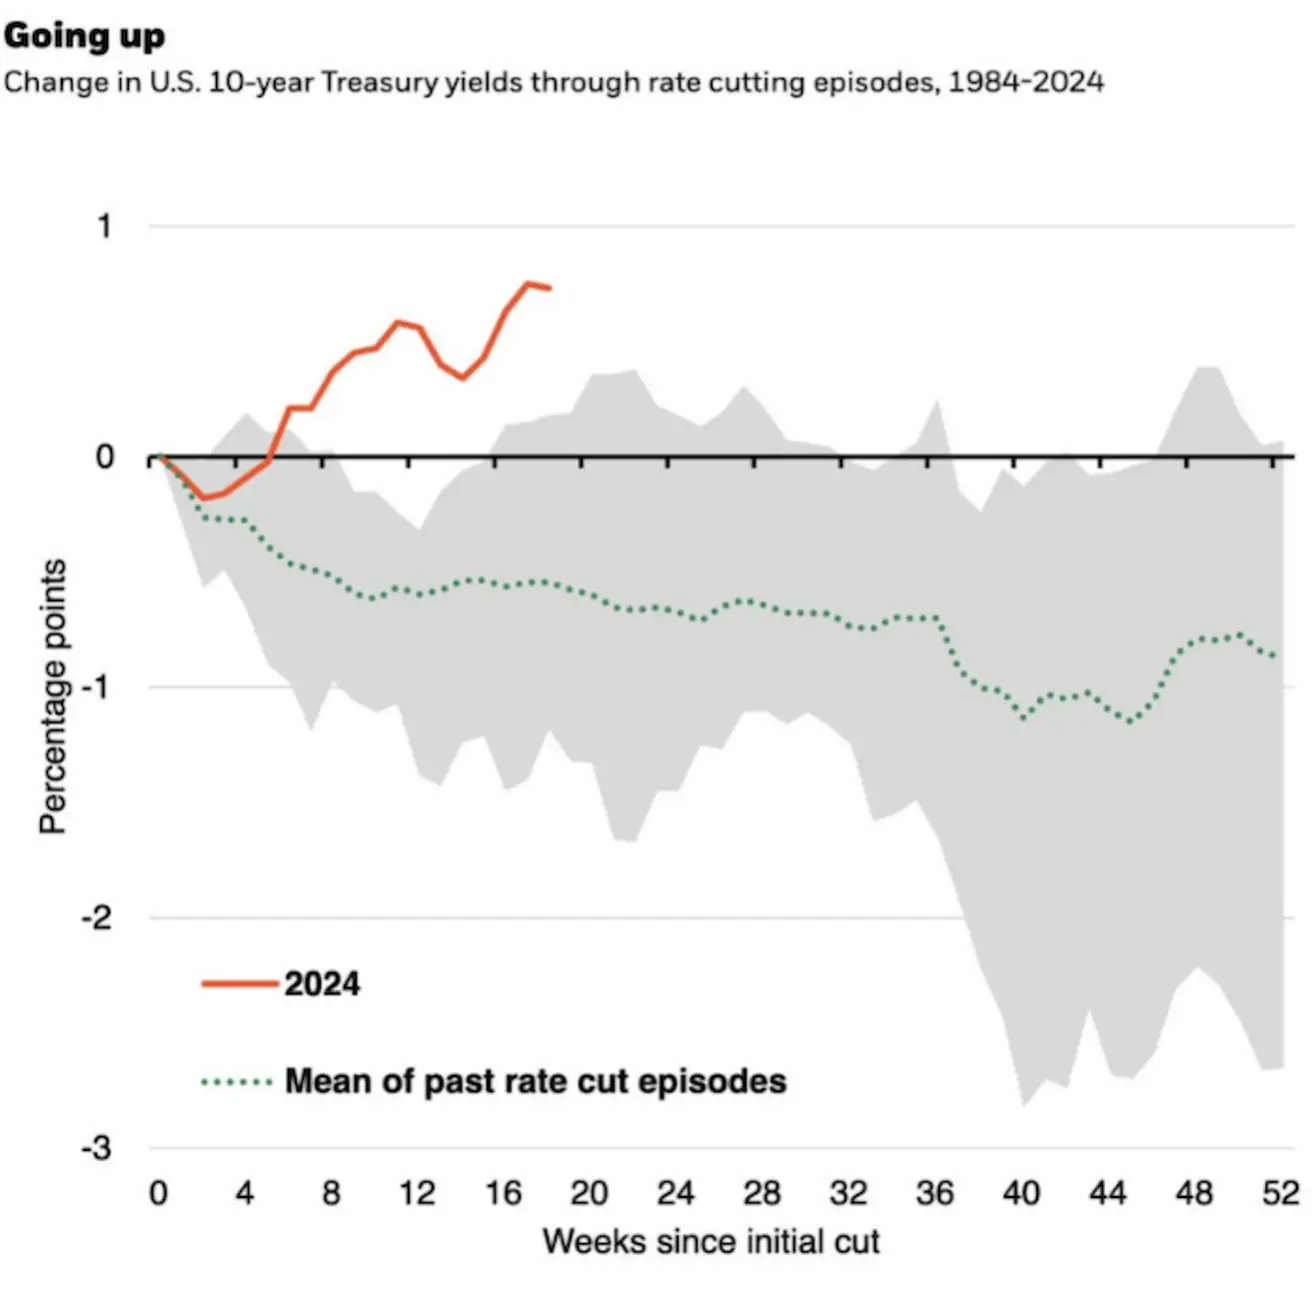
Historical changes in US10Y yields since the beginning of the rate-cutting cycle: The median (dotted line) had a positive correlation with the key rate: as the Fed lowered rates, the benchmark debt yield also decreased. In the current cycle, the dynamics deviate from the overall historical trend.
The yield curve for US Treasury bonds reflects the yields of bonds with different maturities. It is a key indicator of economic conditions and market expectations:
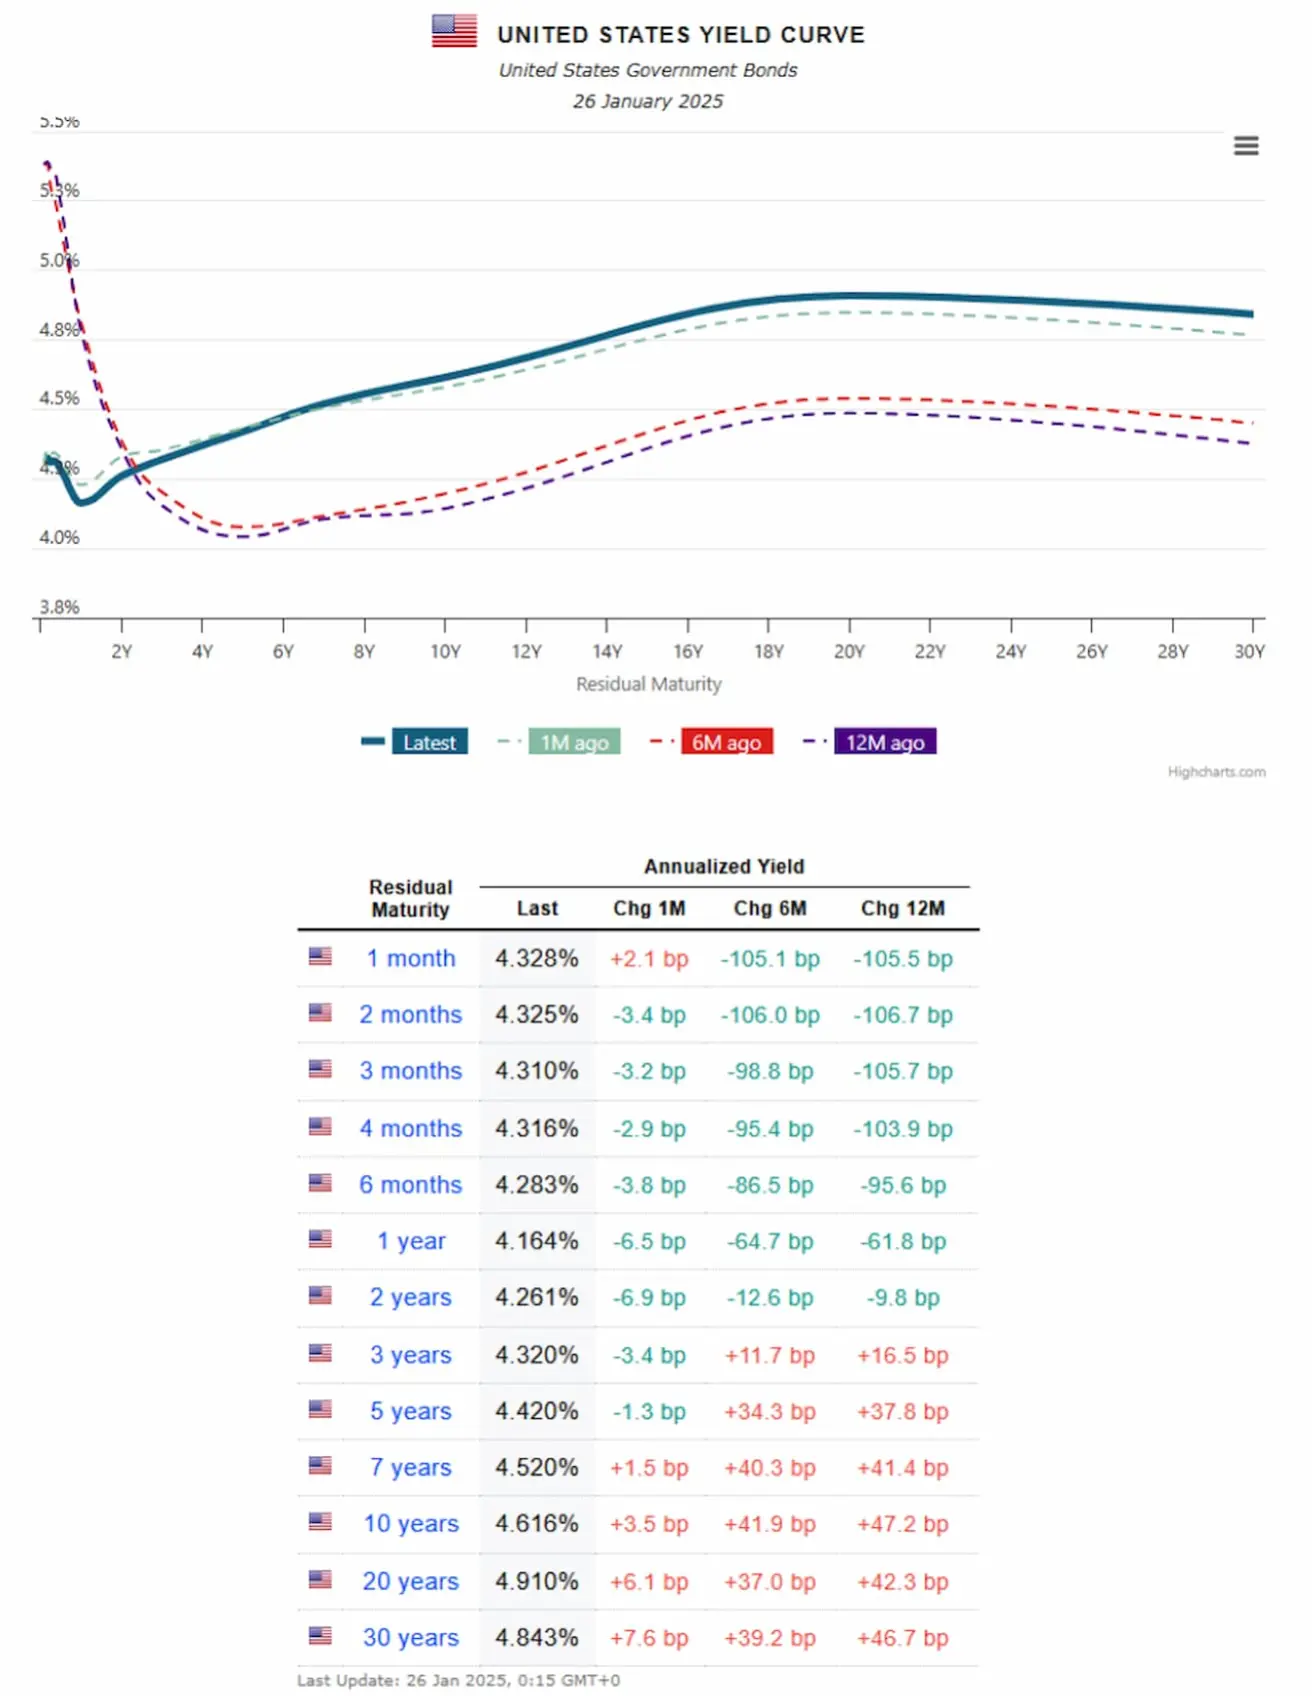
- Money market yield (maturities up to 1 year): 4.23% - 4.3%.
- Medium-term yield (3-7 years): 4.32% – 4.52%.
- Long-term yield (10+ years): 4.61% – 4.84%.
GOLD FUTURES
Gold Futures (GC):
- Weekly: +1.46% (closing at $2,777.4/oz). For 2025: +5.16%.
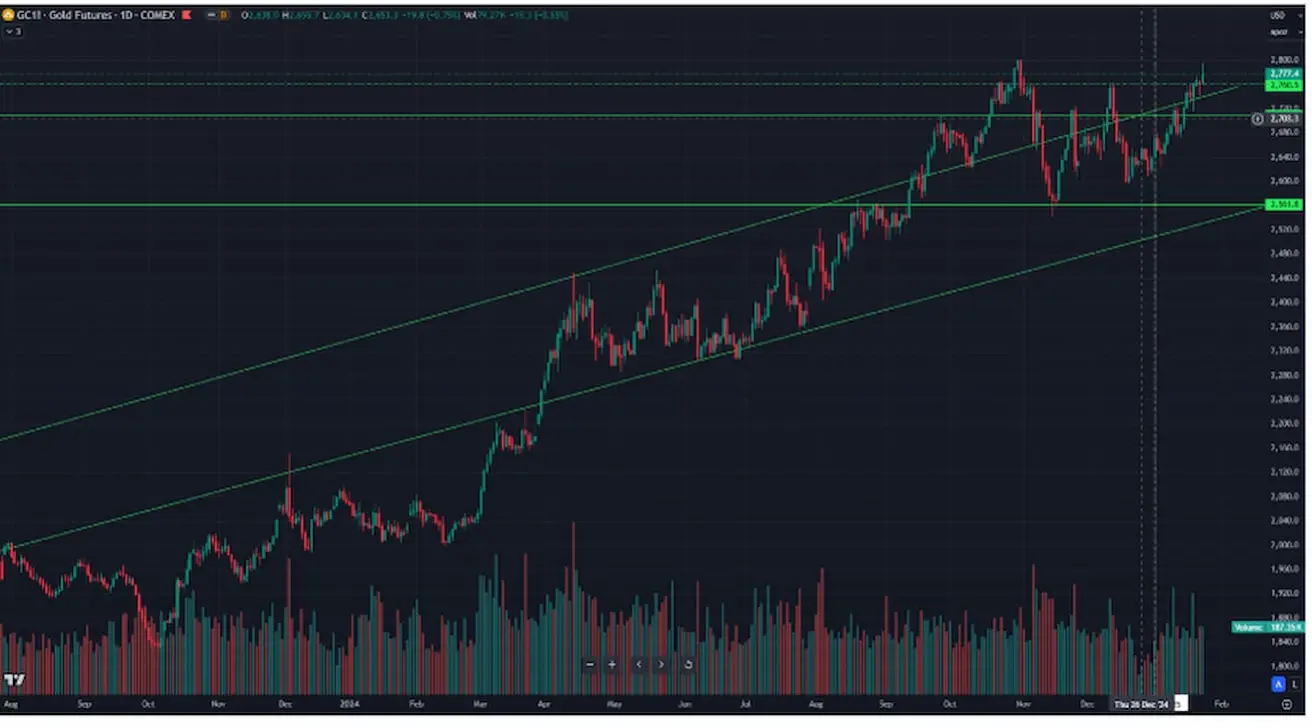
Gold futures have been rising for the fourth consecutive week as the dollar's correction and uncertainty surrounding President Trump's tariff plans have increased the metal's appeal as a safe-haven asset.
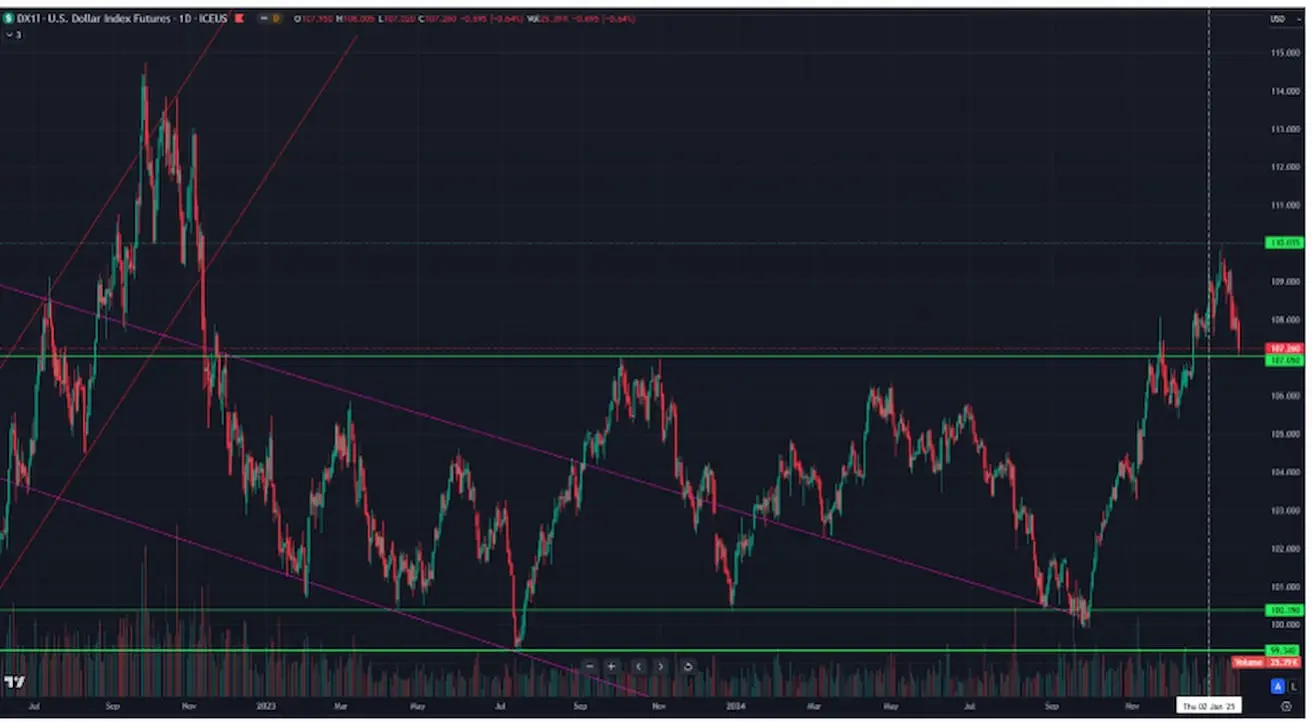
DOLLAR FUTURES
The dollar index futures (DX) corrected to a 2-year support level last week: -1.83%, closing the week at 107.26; year-to-date: -0.99%.
OIL FUTURES
Crude oil futures (CL) recorded their first weekly decline in five weeks: -3.58%, closing the week at $74.60/barrel; year-to-date: +3.83%.
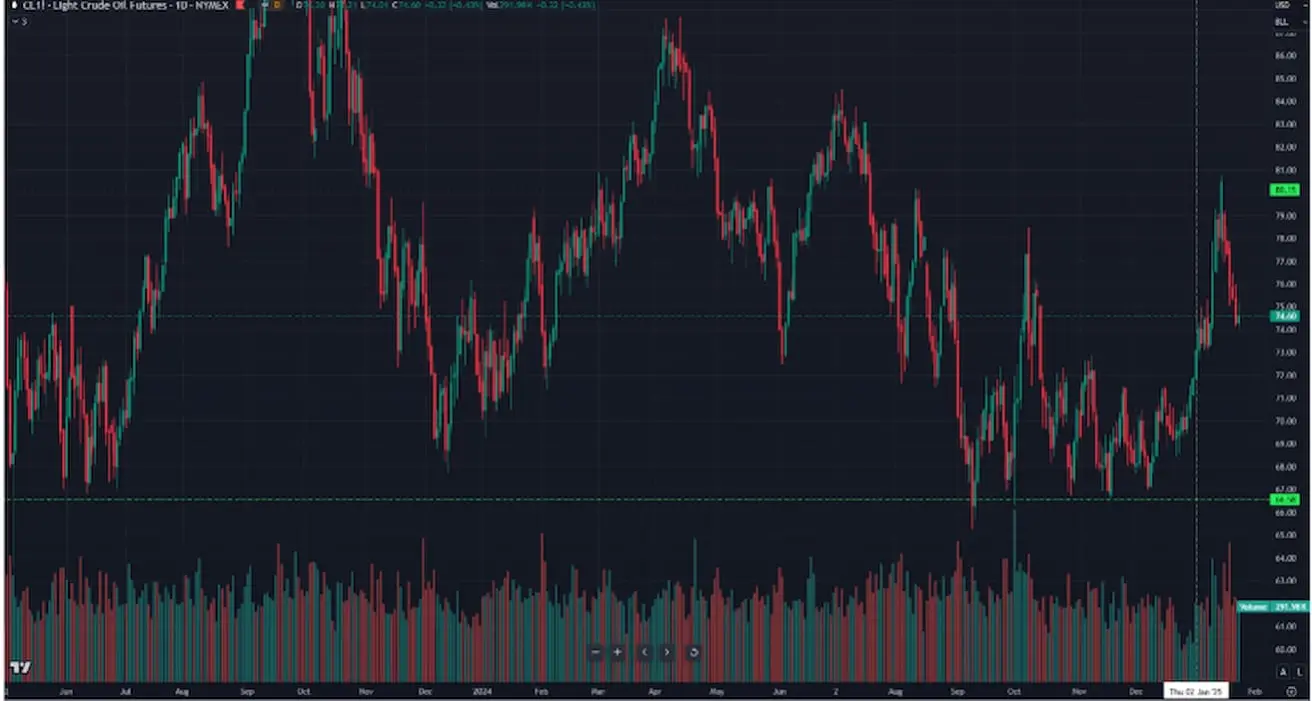
Oil prices fell after President Trump signed executive orders aimed at boosting U.S. production, which is already at record levels.
CRYPTOCURRENCY MARKET
The market's attention was also focused on the new president.
Trump repealed all key Biden-era regulations restricting cryptocurrencies in the U.S., paving the way for legalization.
Notably, the goal includes a ban on the creation and use of central bank digital currencies (CBDCs) in the U.S.
A working group on digital assets will be established, including the Treasury, Department of Justice, SEC, and CFTC. The Federal Reserve is not on the list.
The CEO of Bank of America stated that the U.S. banking sector would adopt cryptocurrencies for payments (with regulatory approval).
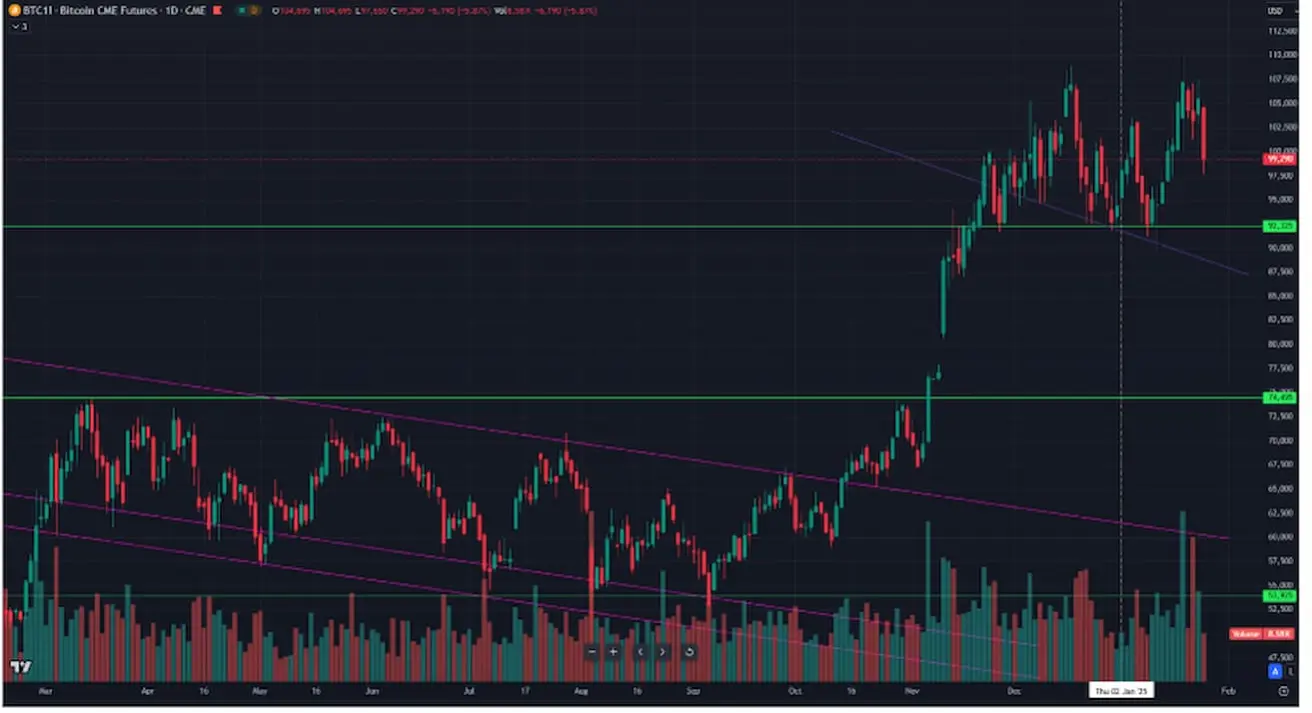
BTC
Bitcoin Futures: +0.34% (weekly close at $104,460). Year-to-date: +10.72%.
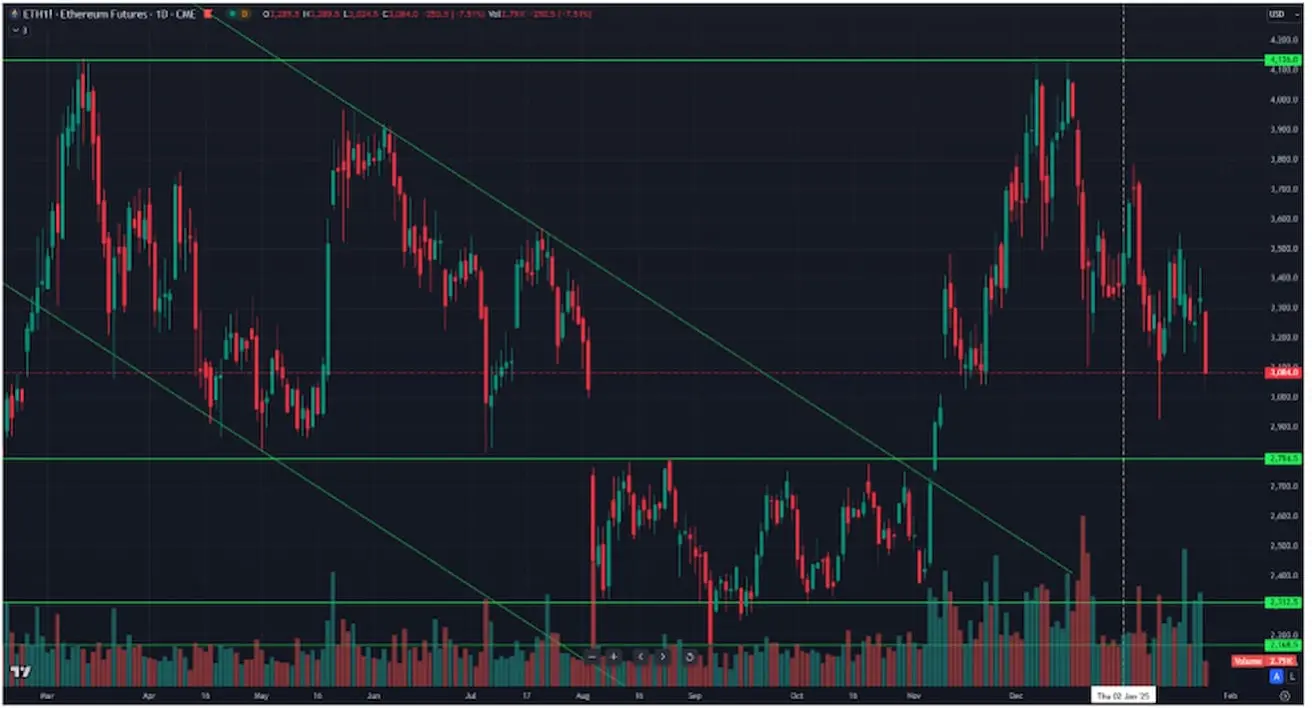
ETH
Ethereum Futures: -4.65% (weekly close at $3,334.5). Year-to-date: -1.46%.
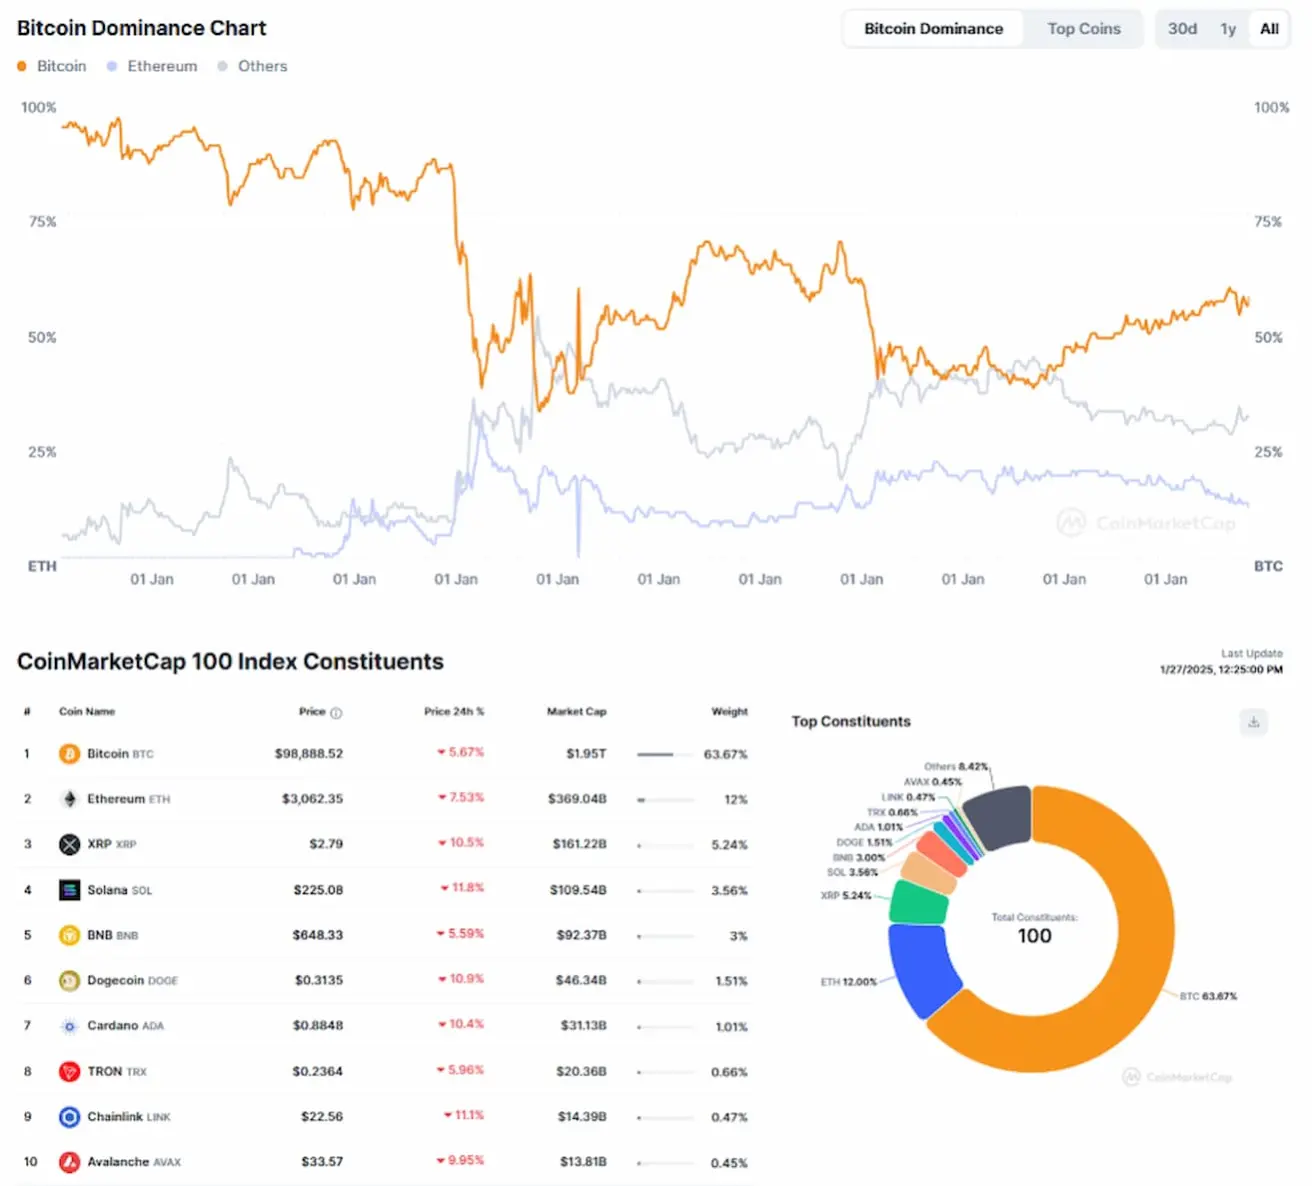
CRYPTO MARKET CAPITALIZATION
$3.36 trillion ($3.21 trillion the previous week) (coinmarketcap.com).
- Bitcoin market cap dominance: 58.2% (prev: 57.2%).
- Ethereum market cap dominance: 11.0% (prev: 11.8%).
- Other cryptocurrencies: 30.8%.
The market share of cryptocurrencies, excluding Bitcoin and Ethereum, has been declining since July 2023.