Lietuvių
 Русский
 Қазақша
 Eesti
EestiJanuary 26 – February 1, 2026: Weekly economic update
Key market updates

Over the past week, equity indices showed mixed performance, while precious metals experienced heightened volatility.
The first Federal Reserve meeting took place, at which a 10–2 majority decided to keep the policy rate unchanged within the 3.50–3.75% range.
The core message was that the economy remains on a solid footing, with risks to inflation and the labor market broadly balanced. There is no need to cut rates at this stage, and future decisions will be data-dependent.
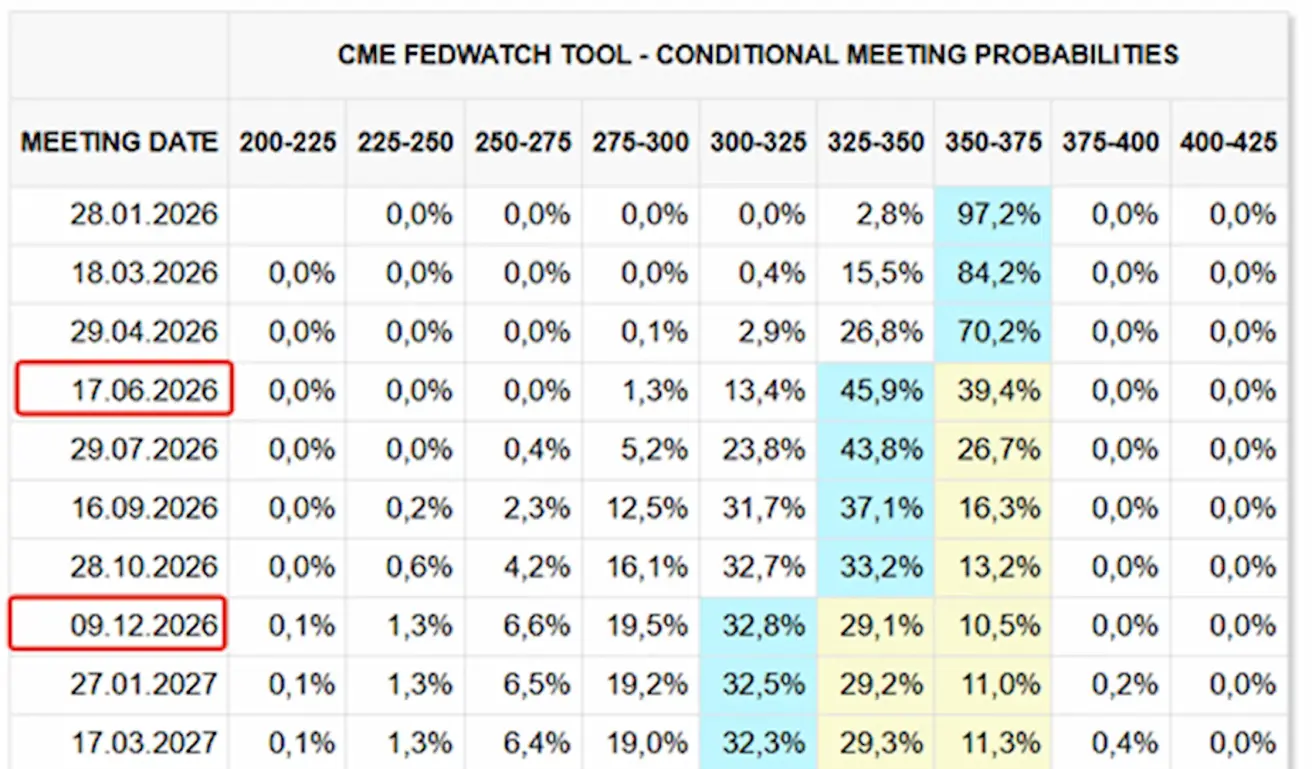
Market expectations reflected in interest rate swaps (FedWatch) remain unchanged and are aligned with the Fed’s December projections: two rate cuts to a target range of 3.00–3.25%. The market expects the first cut to occur after three meetings, in June.
On Friday, January 30, Donald Trump officially nominated Kevin Warsh to serve as Chair of the U.S. Federal Reserve.
Key facts about Warsh:
- Former member of the Federal Reserve Board of Governors (2006–2011);
- Currently an active advocate of interest rate cuts.
Jerome Powell’s term expires in May of this year.
In the United States, a partial government shutdown has begun due to delays in the House of Representatives approving funding. The Senate has already passed the bill. The shutdown is expected to be short-lived.
The Treasury Department, the Department of Defense, the Department of the Interior, the Department of Transportation, the Department of Health and Human Services, and the Department of Labor will undergo the formal shutdown process. A delay in publishing the employment report is possible.
United States (key talking points for the sales team):
- Policy rate unchanged; cautious rhetoric;
- Monetary policy stance remains moderately restrictive, with a gradual shift toward neutral.
- The Fed is maintaining a balance: supporting markets while refraining from signaling rapid rate cuts.
- U.S. macroeconomic data support a soft-landing scenario: economic growth remains above potential, inflation is decelerating, and the labor market is cooling without signs of stress.
Macroeconomic Statistics
INFLATION: CONSUMER PRICE INDEX (SEPTEMBER):
- Core CPI: (m/m) 0.2% (prev: 0.2%); (y/y) 2.6% (prev: 2.6%)
- CPI: (m/m) 0.3% (prev: 0.3%); (y/y) 2.7% (prev: 2.7%).
PRODUCER PRICE INDEX (NOVEMBER):
- PPI (m/m): 0.5%, prev: 0.2%
- Core PPI (m/m): 0.7%, prev: 0.3%.
INFLATION EXPECTATIONS (MICHIGAN) (DECEMBER):
- 12-month inflation expectations: 4.2%, prev: 4.1%
- 5-year inflation expectations: 3.4%, prev: 3.2%.
GDP (U.S. Bureau of Economic Analysis, BEA) (Q3 2025, annualized, second estimate): +4.4% (Q2 2025: +3.8%)
- GDPNow Indicator of the Federal Reserve Bank of Atlanta (Q4): 4.2% (prev: 5.4%).
BUSINESS ACTIVITY INDEX (PMI) (DECEMBER):
(Above 50 indicates expansion; below 50 indicates contraction)
- Services sector: 52.5 (prev: 52.5);
- Manufacturing sector: 51.9 (prev: 51.8);
- S&P Global Composite: 52.8 (prev: 52.7).
LABOR MARKET (BLS) (December)
- Unemployment rate: 4.4% (prev: 4.6%);
- Total number of individuals receiving unemployment benefits in the U.S.: 1,827K (prev: 1,875K, revised);
- Initial jobless claims: 209K (prev: 210K, revised);
- Change in nonfarm payrolls: 37K (prev: 64K);
- Change in private nonfarm payrolls: 37K (prev: 69K);
- Average hourly earnings (y/y): 3.8% (prev: 3.5%);
- Number of job openings (JOLTS): 7.146M (prev: 7.227M).
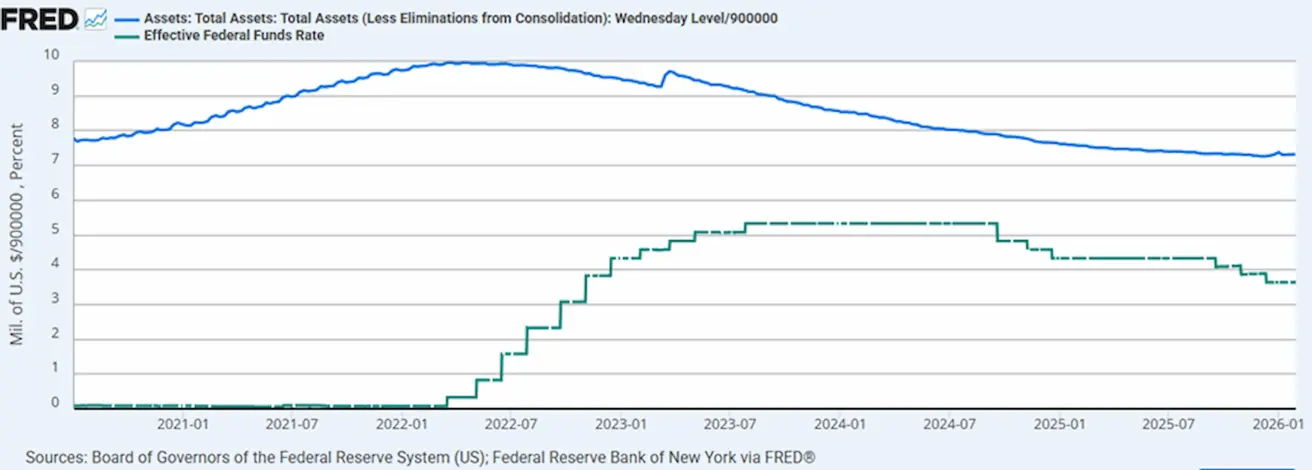
MONETARY POLICY
- Effective federal funds rate (EFFR): 3.50%–3.75%;
- Federal Reserve balance sheet: USD 6.587 trillion, up 0.80% since the suspension of quantitative tightening (USD 6.535 trillion).
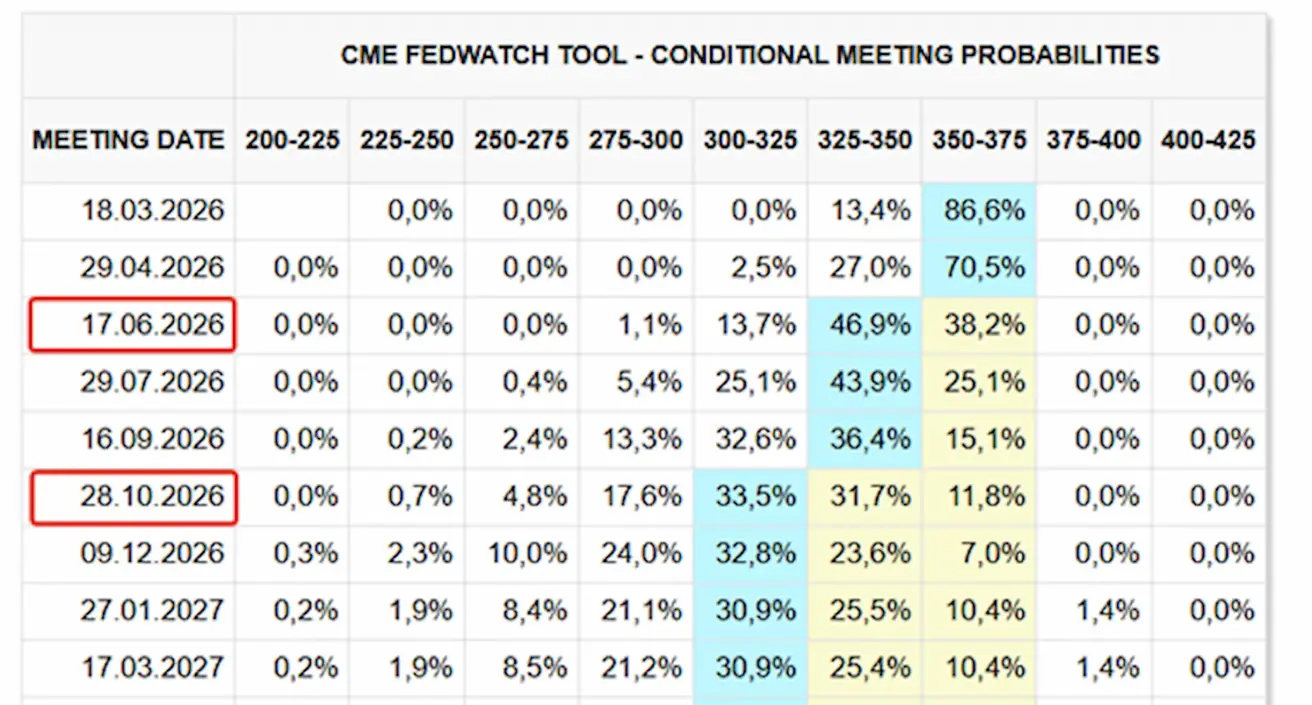
MARKET FORECAST FOR RATE (FEDWATCH)
Next meeting (March 18): the implied probability of a 25 bp rate cut stands at 13.38%.
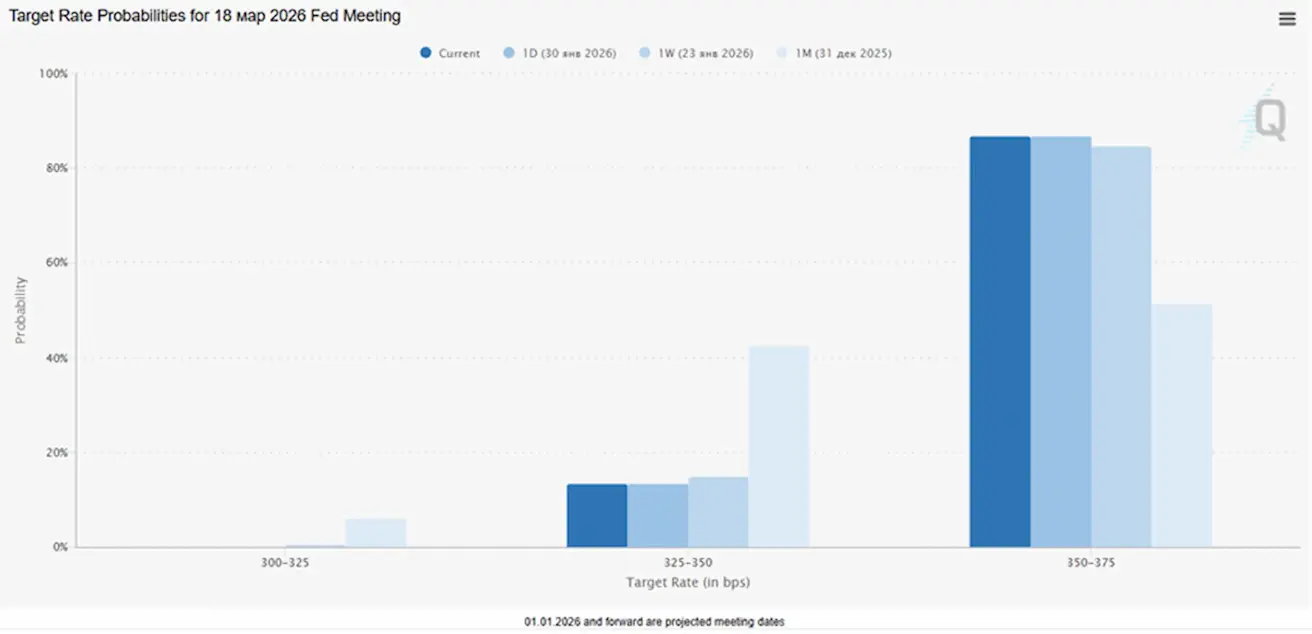
Over the next 12 months, two 25 bp rate cuts are expected, bringing the target range to 3.00–3.25%. The market anticipates the first cut after three meetings, in June.
Today:
A week earlier:
Market
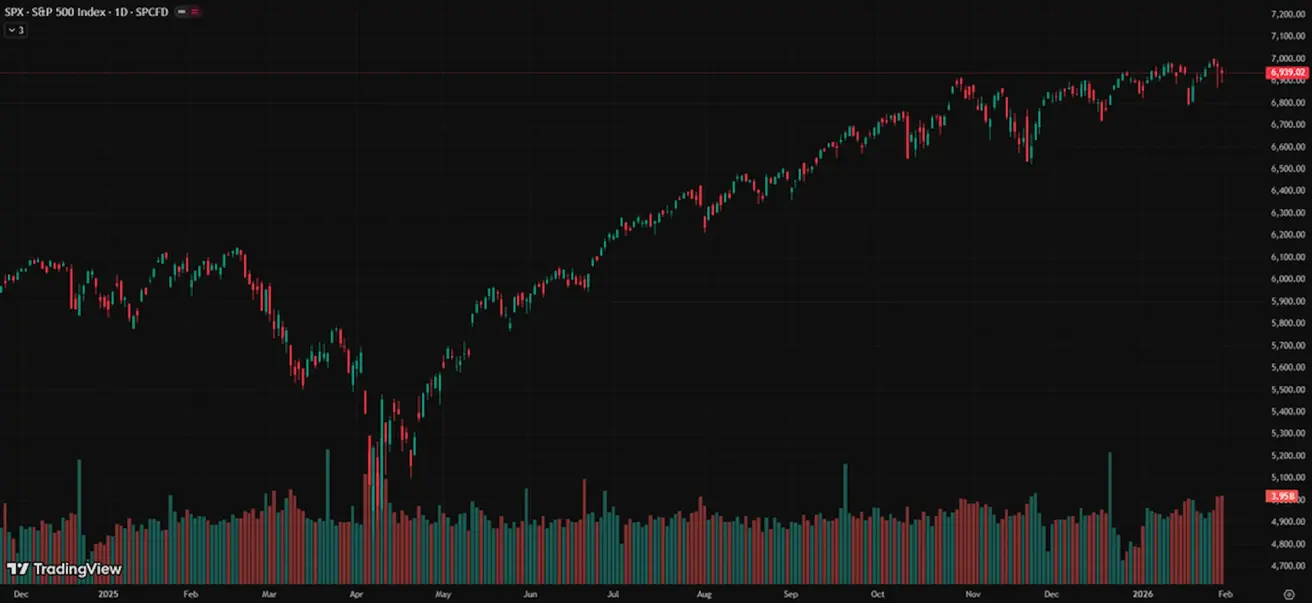
SP500
Weekly performance: +0.34% (week-end close at 6,939.02); year-to-date: +1.37%.
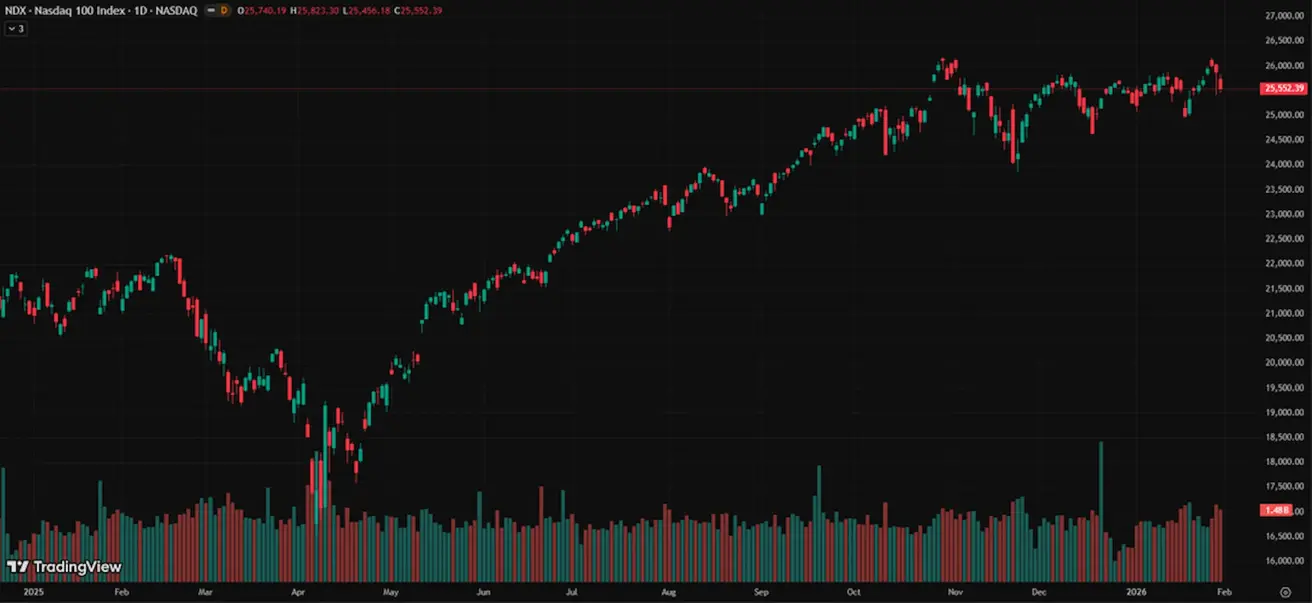
NASDAQ100
Weekly performance: -0.21% (week-end close at 25552.39); year-to-date: +1.20%.
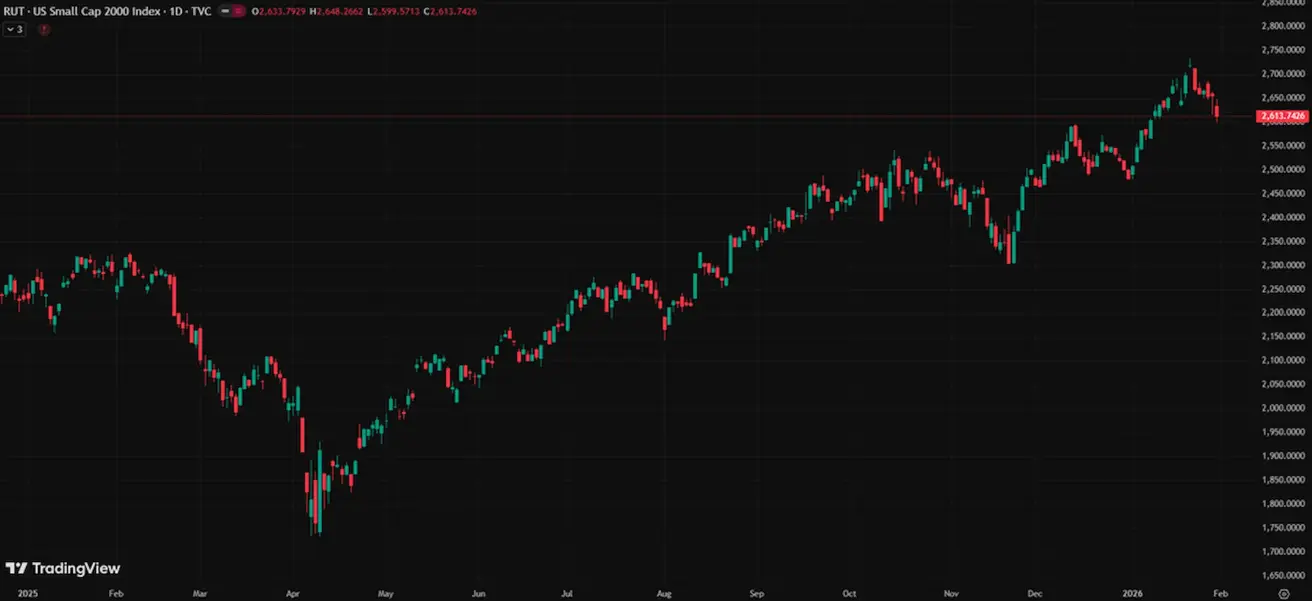
RUSSEL 2000 (RUT)
Weekly performance: -2.08% (week-end close at 2613,74); year-to-date: +5,31%.
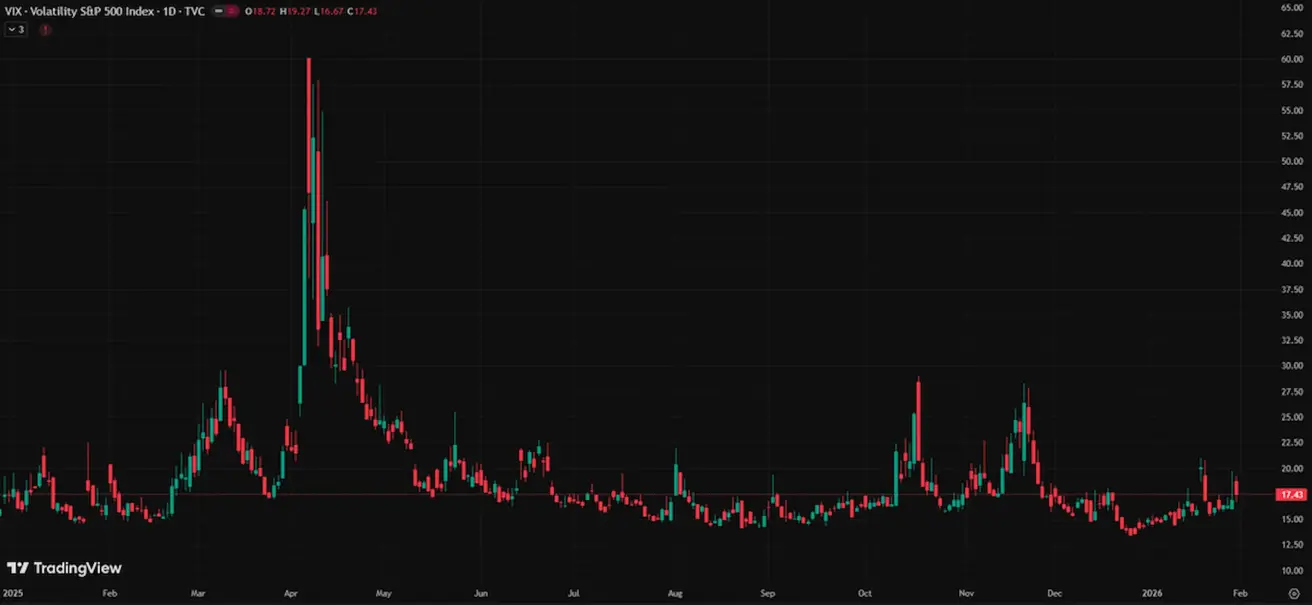
VIX
The VIX volatility index is 17,43.
Eurozone
- Policy rates unchanged; inflation remains under control;
- Monetary policy stance is neutral, with the balance of risks shifting from inflation toward economic weakness;
- As trade tensions ease, the ECB has revised its GDP and inflation forecasts upward for the coming years; Europe is stabilizing but continues to lag behind the U.S. in terms of growth momentum.
Interest rates:
- Deposit facility rate: 2.0% (previous: 2.0%);
- Marginal lending facility rate: 2.4% (previous: 2.4%) — the rate at which banks can borrow overnight from the central bank;
- Short-term (main policy) rate: 2.15% (previous: 2.15%).
Inflation: Consumer Price Index (CPI), December:
- Core CPI (y/y): 2.3% (previous: 2.4%);
- CPI (m/m): 0.2% (previous: −0.3%); (y/y): 1.9% (previous: 2.1%).
GDP, Q4 (final):
- q/q: 0.3% (previous: 0.3%);
- y/y: 1.3% (previous: 1.4%).
Unemployment rate (December): 6.20% (previous: 6.23%).
Purchasing Managers’ Index (PMI), January:
- Services: 51.9 (previous: 52.4);
- Manufacturing: 49.4 (previous: 48.8);
- S&P Global Composite: 51.5 (previous: 51.5).
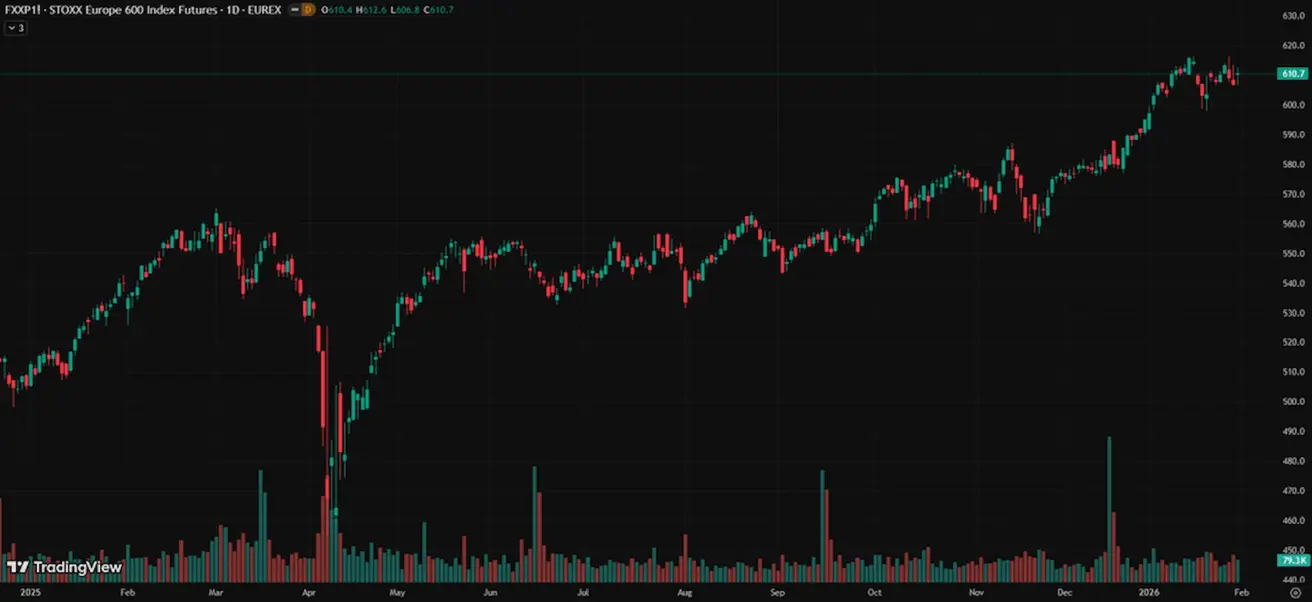
EURO STOXX 600 (FXXP1!)
Weekly performance: +0.43% (Week-end close: 610.7); January performance: +2.81%.
China The economy is stabilizing on the back of exports, while domestic demand and investment remain weak; policy stimulus remains targeted and cautious.
- Policy rates unchanged;
- Monetary policy stance remains accommodative.
- China has confirmed the continuation of fiscal support for economic growth under its 2026 plan, including measures to stimulate domestic demand, optimize tax incentives and subsidies, and modernize industry.
Interest rates:
- 1-year Loan Prime Rate (medium-term lending): 3.00%;
- 5-year Loan Prime Rate (benchmark influencing mortgage rates): 3.50%.
Inflation indicators (December):
- Consumer Price Index (CPI), m/m: 0.2% (previous: −0.1%); y/y: 0.8% (previous: 0.7%);
- Producer Price Index (PPI), y/y: −1.9% (previous: −2.2%).
GDP, Q4 (final):
- q/q: 1.2% (previous: 1.1%);
- y/y: 4.5% (previous: 4.8%).
Unemployment rate (December): 5.1% (previous: 5.1%).
Industrial production (December), y/y: 5.9% (previous: 4.8%).
Fixed asset investment (December), y/y: −3.8% (previous: −2.6%).
Retail sales (December), y/y: 0.9% (previous: 1.3%).
Trade (December):
- Imports, y/y: 5.7% (previous: 1.9%);
- Exports, y/y: 6.6% (previous: 5.9%);
- Trade balance (USD): USD 114.30 bn (previous: USD 111.68 bn).
Purchasing Managers’ Indices (PMI), November:
- Manufacturing: 49.3 (previous: 49.2);
- Non-manufacturing: 49.4 (previous: 49.0);
- Composite PMI: 50.7 (previous: 49.1).
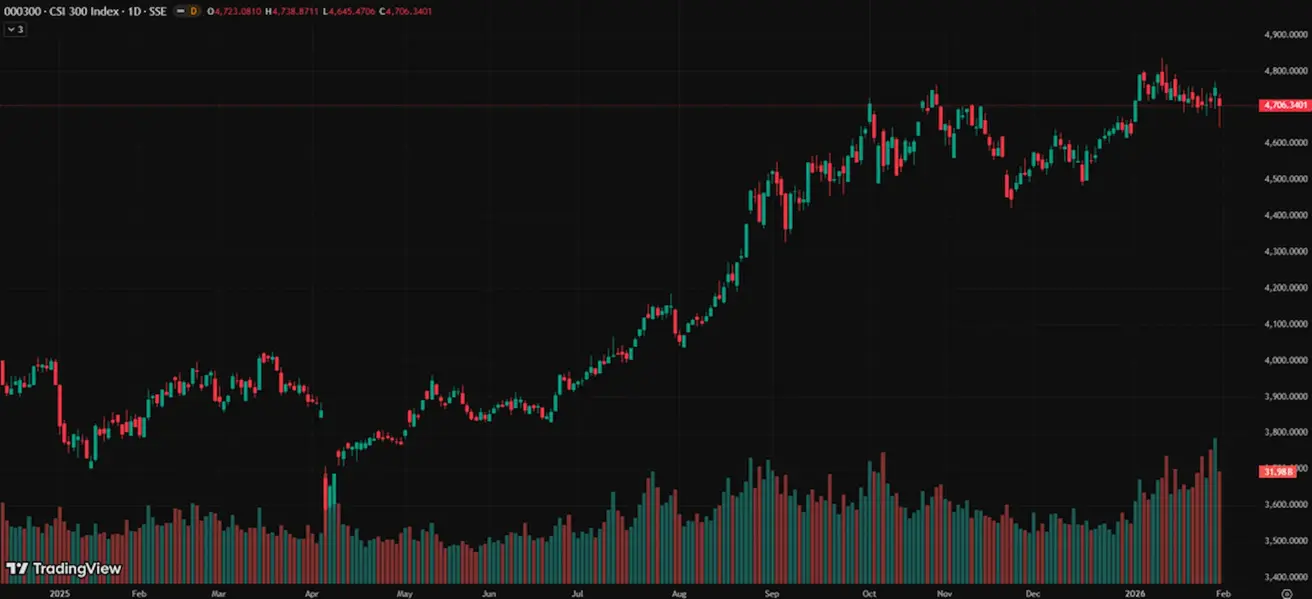
CSI 300 INDEX (000300.HK)
Weekly performance: +0.08% (week-end close at 4706,34); year-to-date: +1.65%.
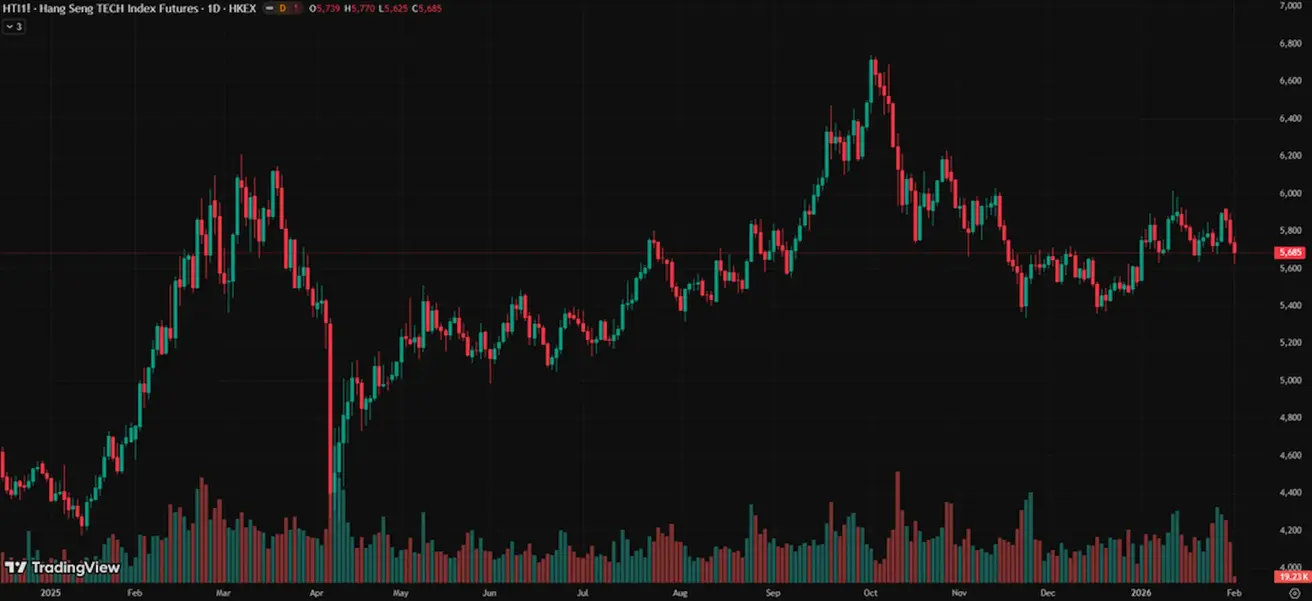
Hang Seng TECH Index (HTI1!)
Weekly performance: −0.83% (week-end close: 5,739.0); January performance: +4.26%.
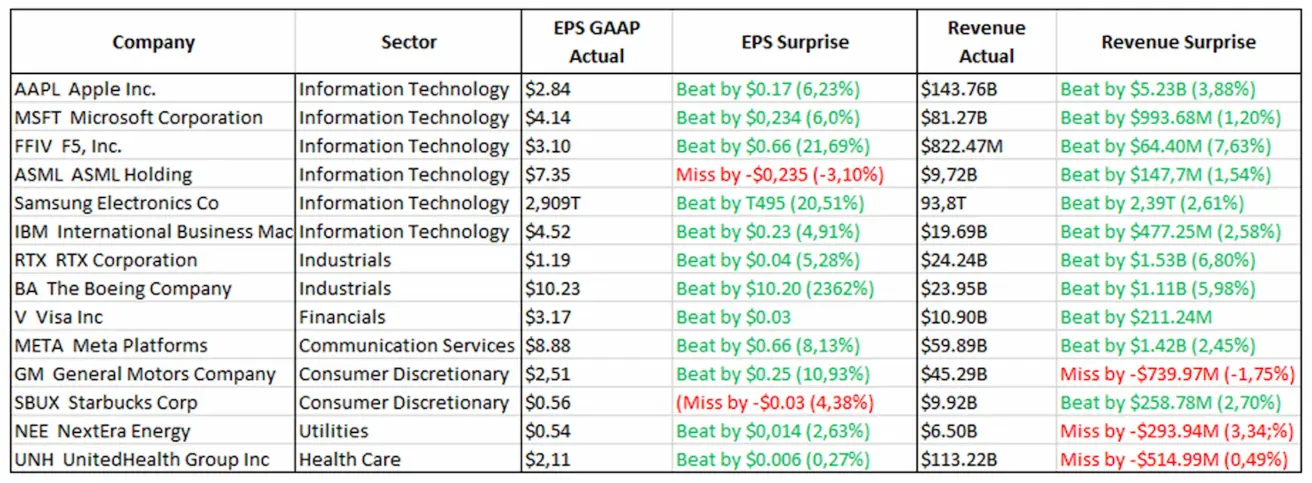
Earnings (key takeaways): AAPL, META, and MSFT delivered strong performance, supported by their large installed user bases, continued cloud expansion, and rising investment in AI.
- AAPL: strong demand for iPhones, including in China.
- META: user growth accompanied by an increase in capital expenditures.
- TSLA: improved profitability metrics, though year-on-year growth was more modest.
- IBM: demonstrated stable monetization of AI solutions at the enterprise level. Overall, this week’s results confirmed that the market’s leading companies continue to deliver solid growth momentum.
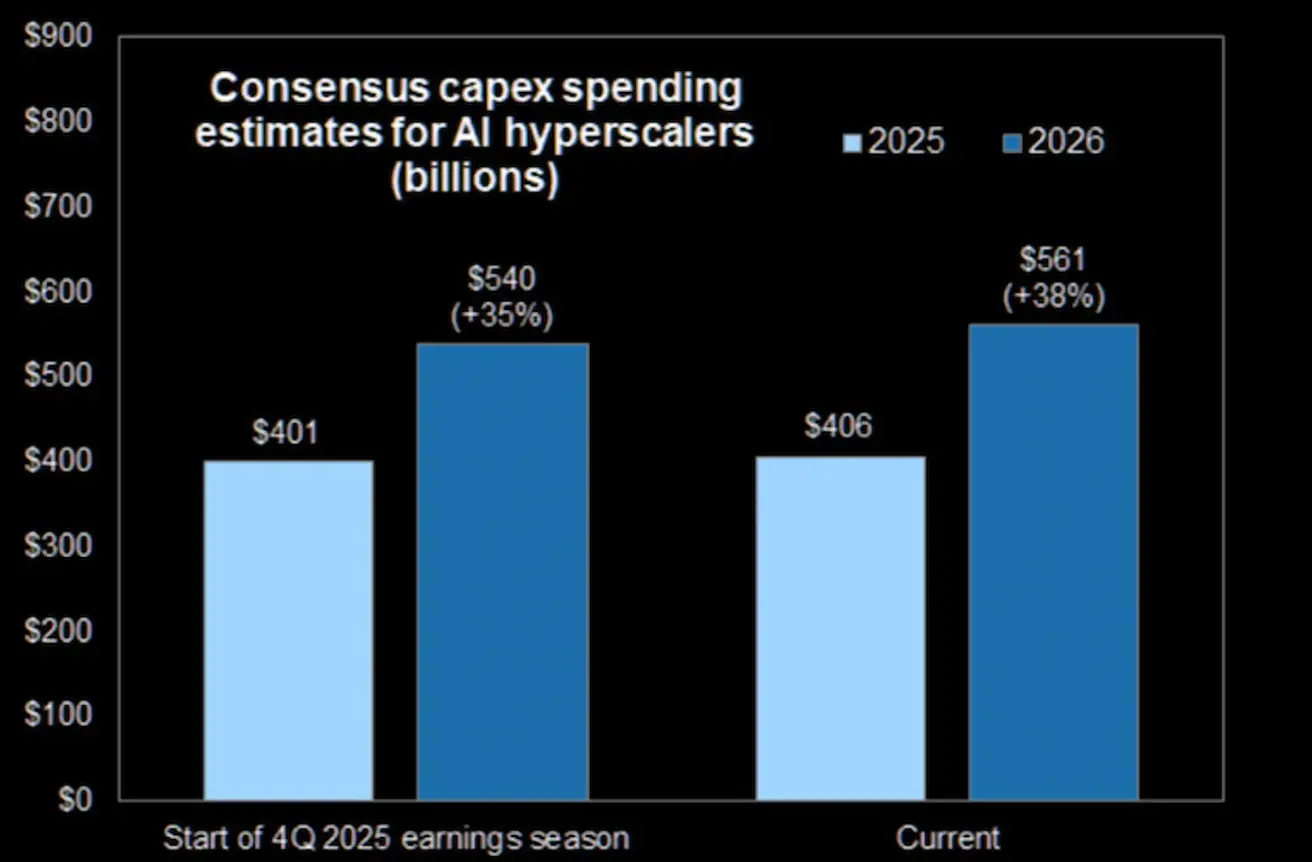
Since the start of the earnings season, capital expenditure forecasts of major AI-focused companies have been revised upward.
BOND MARKET
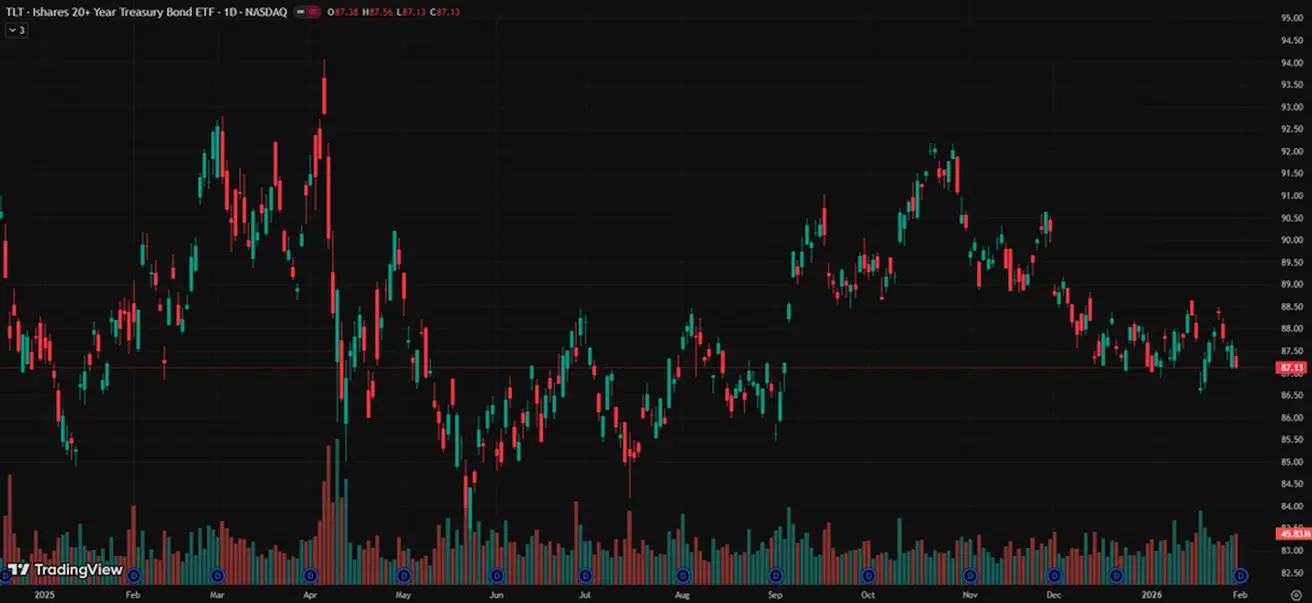
U.S. fixed income market: Treasury yields rose over the week amid Kevin Warsh’s nomination as Fed Chair and a modest uptick in manufacturing inflation indicators.
Yield levels and credit spreads do not point to a deep recession or systemic risk.
20+ Year U.S. Treasury Bonds (TLT ETF): weekly performance: −0.91% (week-end close: 87.13); January performance: −0.03%.
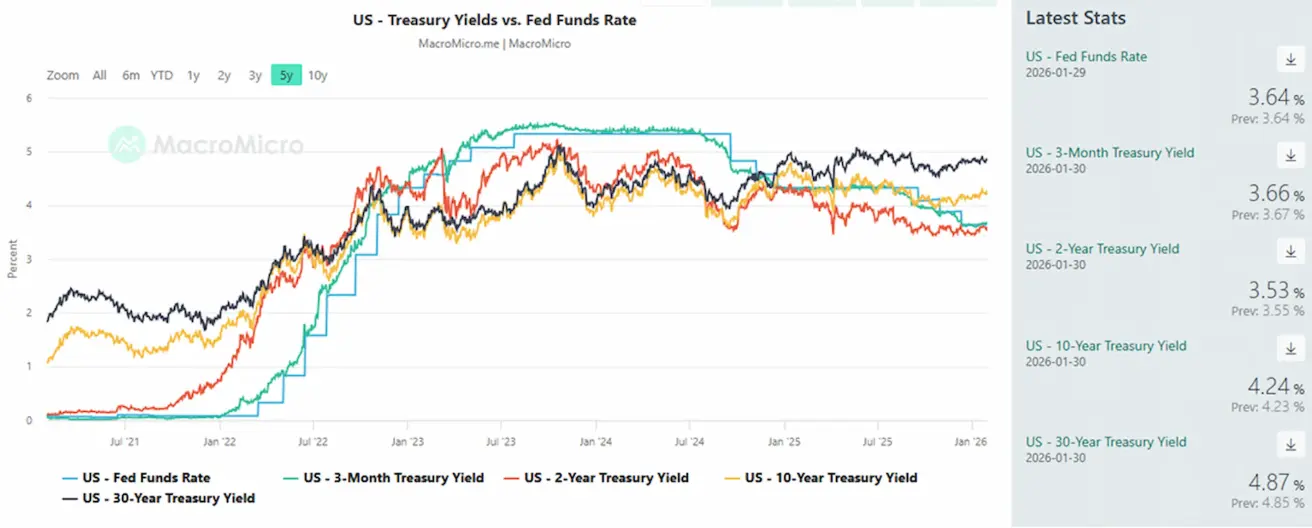
YIELDS AND SPREADS
Market Yield on U.S. Treasury Securities at 10-Year Constant Maturity: 4.24% (previous: 4.21%);
2-year Treasury yield: 3.53% (previous: 3.59%);
- ICE BofA BBB U.S. Corporate Index Effective Yield: 5.03% (previous: 5.00%).
- Yield spread between 10-year and 2-year U.S. Treasuries: 71 bps (previous: 63);
- Yield spread between 10-year and 3-month U.S. Treasuries: 58 bps (previous: 59). U.S. 5-year credit default swap (CDS) spread (sovereign default protection): 28.33 bps (vs. 26.09 bps last week).
GOLD FUTURES (GC)
Weekly performance: −2.34%, however, from the intraweek peak the decline reached −15% (week-end close: $4,970.1 per troy ounce).
The upward trend in gold prices remains intact, supported by sustained demand from central banks and the rapid growth of global debt amid persistent geopolitical and macroeconomic uncertainty.
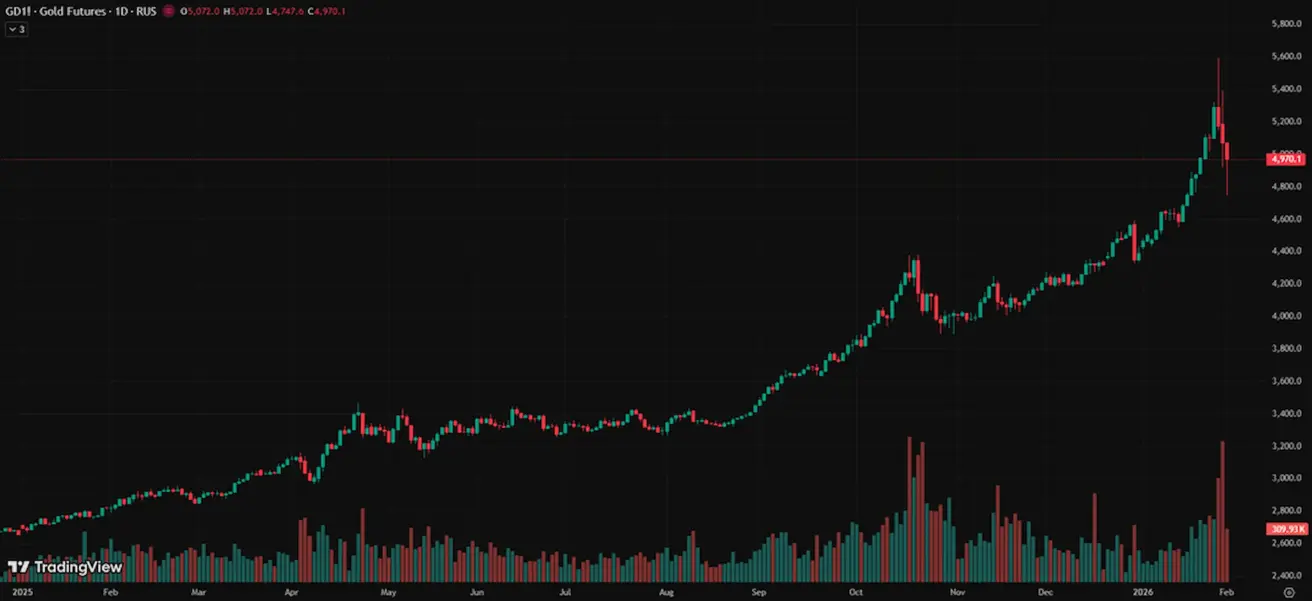
Upside drivers:
- A weaker U.S. dollar and a sell-off in U.S. Treasuries;
- Heightened geopolitical risks and policy uncertainty under Trump;
- Pre-meeting expectations of Fed monetary policy easing increased the attractiveness of precious metals.
- Strong buying activity from central banks and gold-backed ETFs;
- Inflows from large private players, including Tether, which reportedly holds around 140 tonnes of gold.
Drivers of the pullback: Real interest rates and Fed expectations, as the rhetoric favored keeping rates at current levels, gold typically benefits from declining real rates. Against this backdrop, large players took profits following an overheated rally (gold posted a very strong uptrend throughout 2025 and early 2026 with virtually no deep corrections).
Judging by candlestick patterns and trading volumes, stop-losses on long positions were triggered, leverage was unwound, and the move was likely amplified by options hedging.
Nevertheless, gold has not lost its role as a safe-haven asset; it is simply digesting an excessively rapid price increase.
DOLLAR INDEX FUTURES (DX)
Weekly performance: -0.61% (week-end close at 96,685); year-to-date: -1.15%.
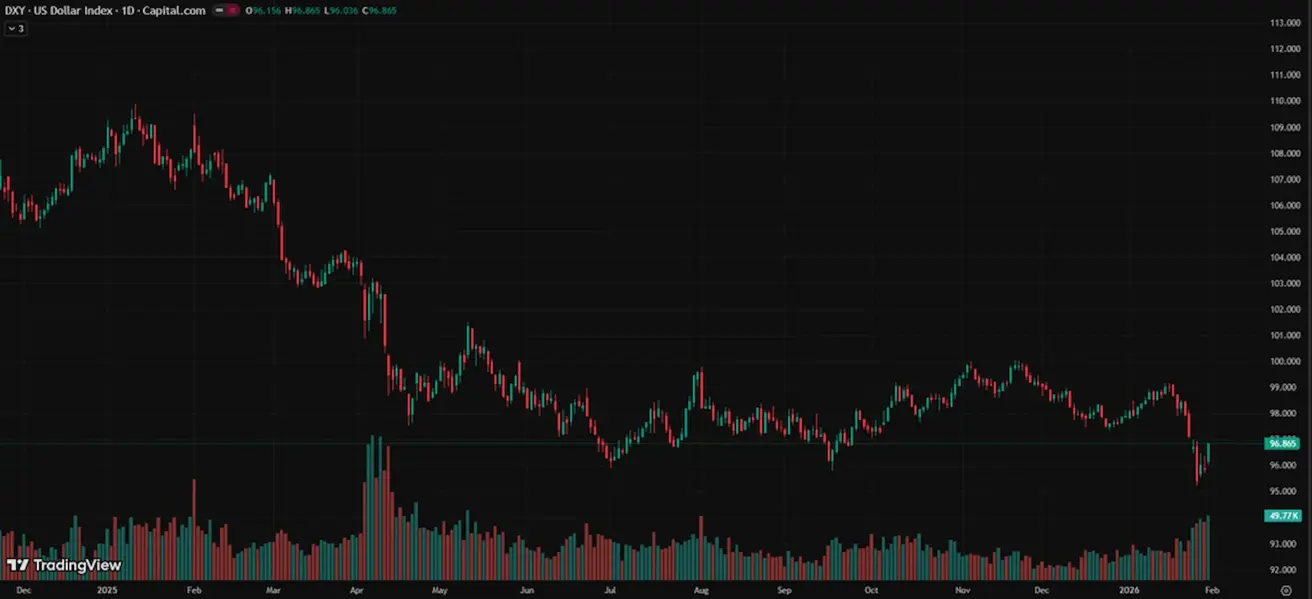
Signals from U.S. policy and official statements
- The sharp sell-off at the start of last week was driven by discussions around a potential joint currency intervention by the United States and Japan to support the yen following its significant depreciation against the dollar.
- The Federal Reserve Bank of New York and the U.S. Treasury conducted so-called “rate check calls” with FX dealers — a signal that often precedes official intervention;
- Japan’s Ministry of Finance made similar calls, which markets interpreted as a willingness by authorities to stabilize the yen, triggering a spike in JPY and pressure on the dollar;
- This mechanically increased demand for Asian and international market currencies and reduced demand for the dollar as a safe-haven asset.
-
Following the verbal intervention, comments from the U.S. President stating that he is “not concerned about a weaker dollar” and prefers a weaker currency were also interpreted by the market as a signal for further dollar selling.
-
The need to launch the BRICS Pay payment system was announced. The initiative originates from the Reserve Bank of India, and if approved at the 2026 summit, it would represent the first meaningful alternative to the dollar-based infrastructure in decades.
Its key distinction from SWIFT is the absence of a centralized control point. BRICS Pay proposes linking the central bank digital currencies of member states into a peer-to-peer network in which participants cannot be “disconnected” for political reasons. This is an architectural response to the vulnerabilities exposed in 2022.
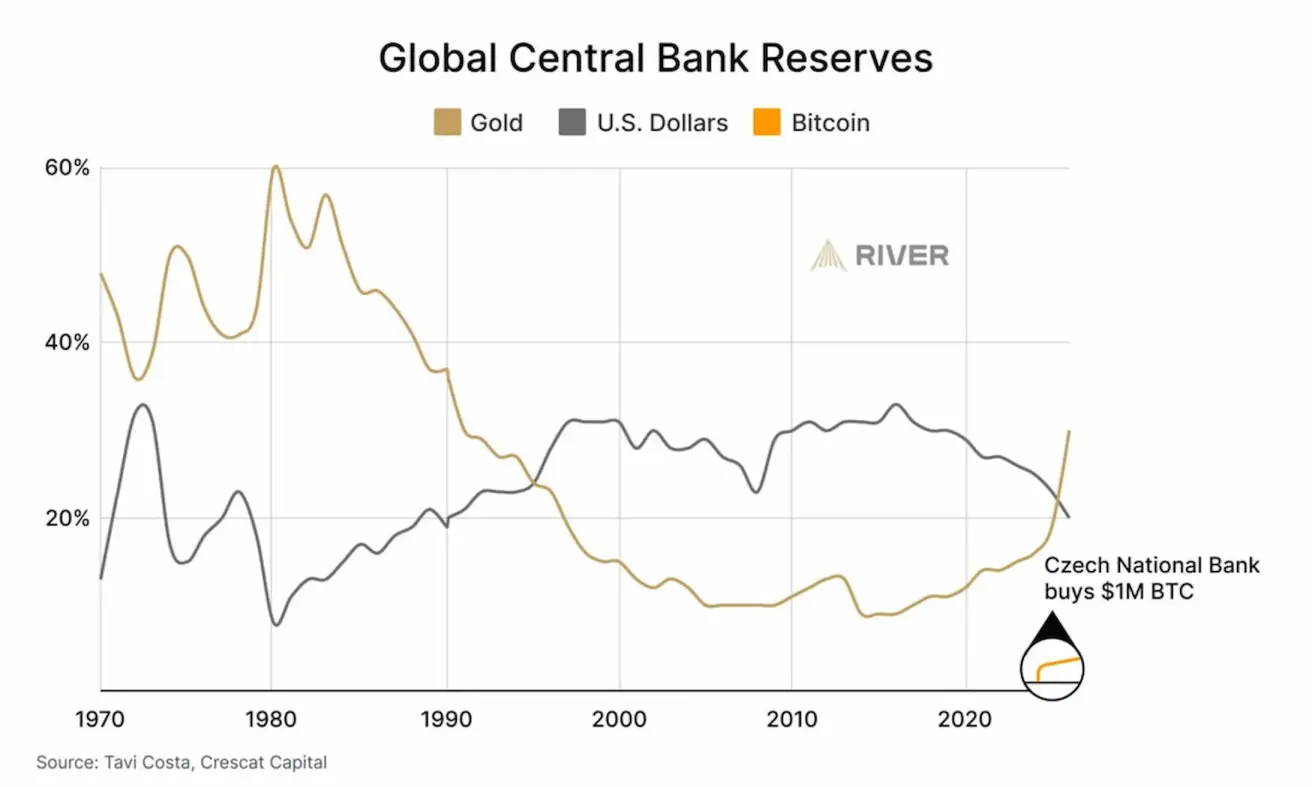
Central bank reserves Gold is increasingly becoming the world’s primary reserve asset amid a reduction in U.S. dollar holdings, while Bitcoin is only beginning to appear in central bank reserves.
OIL FUTURES
Weekly performance: +6.59% (week-end close at $65.21 per barrel); year-to-date: +13.59%.
- Supply growth forecasts in the oil market remain in place.
- Despite higher prices, OPEC+ intends to maintain production curbs through the first quarter of this year.
- Geopolitical risks in the Middle East — protests and rising tensions in Iran are heightening concerns over supply disruptions.
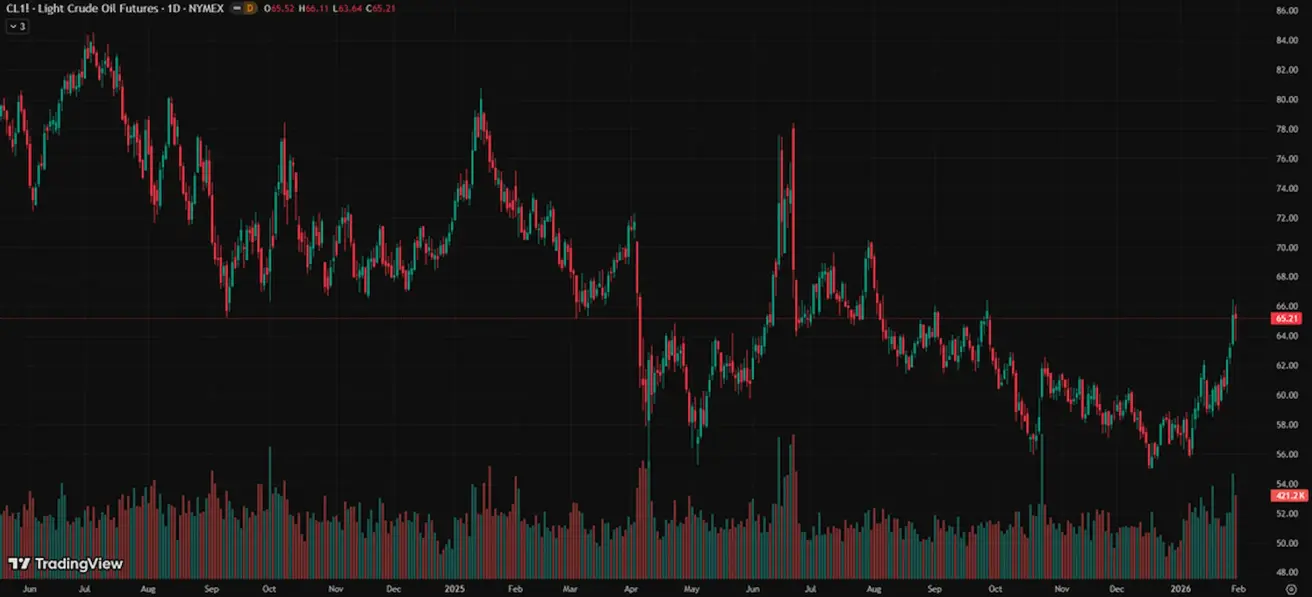
Bloomberg experts note that U.S. strikes on Iran remain a plausible scenario and estimate that further escalation of geopolitical tensions could push Brent crude prices up to $72 per barrel over the next three months.
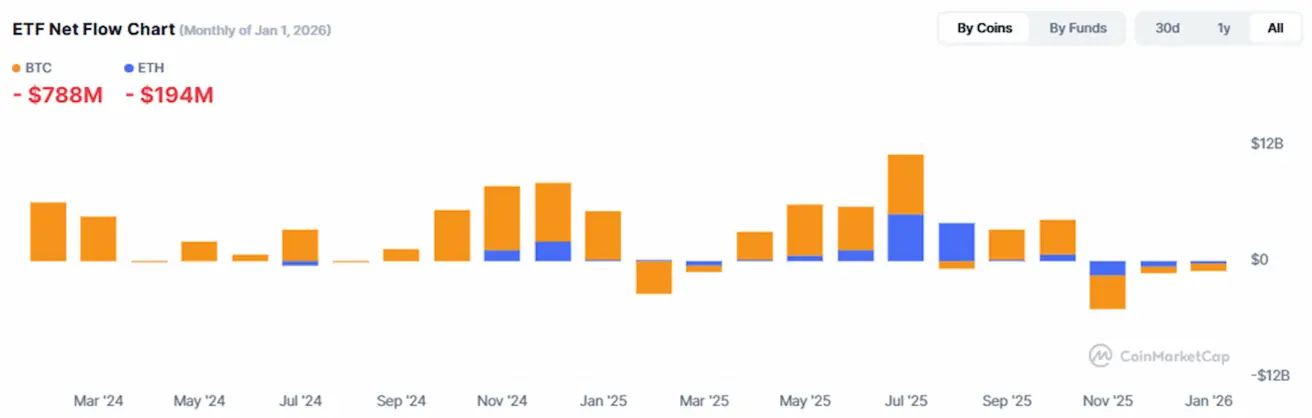
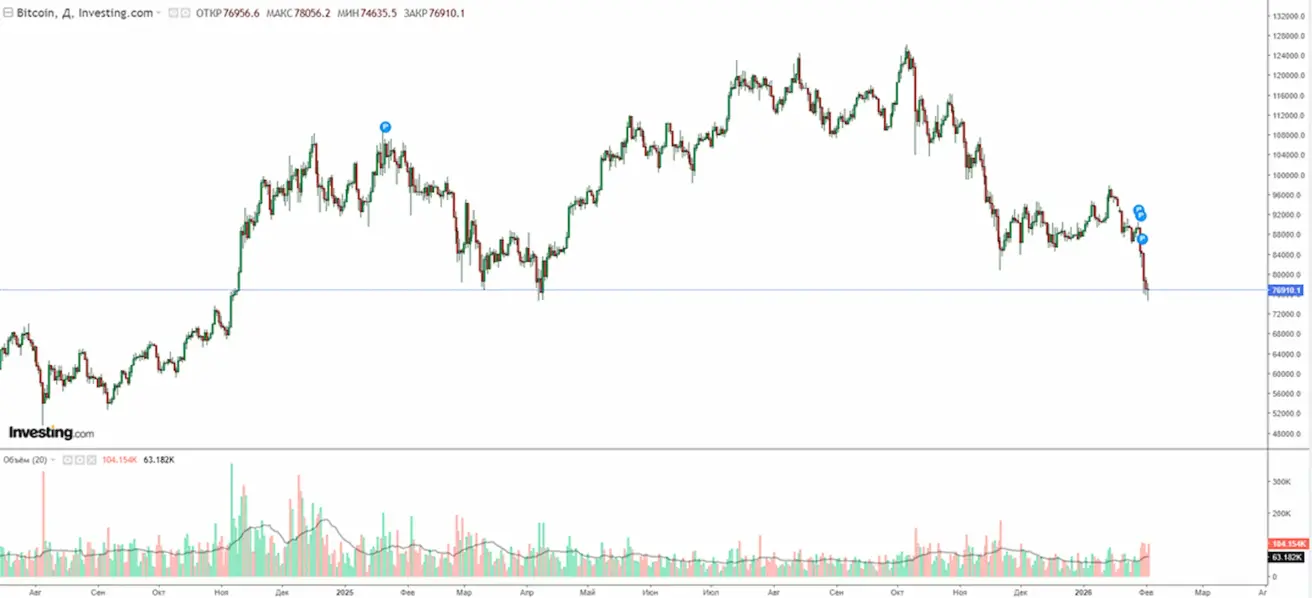
BTC FUTURES
Weekly performance: -11.07% (week-end close at $76976,1); year-to-date: -12.25%.
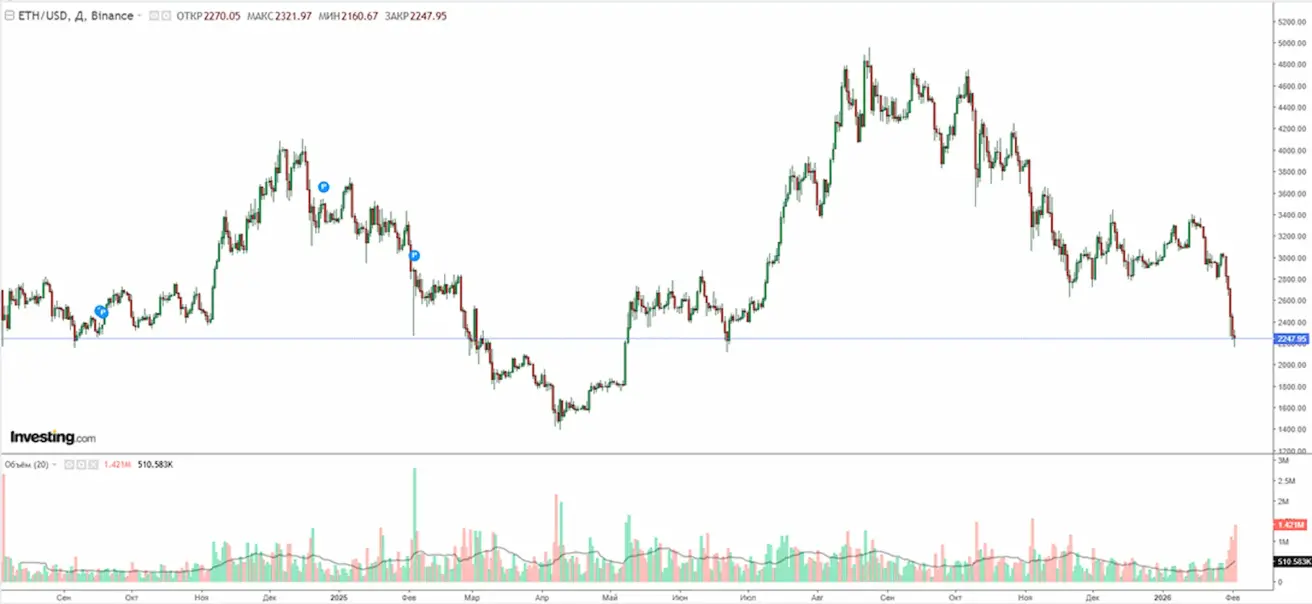
ETH FUTURES
Weekly performance: -19.35% (week-end close at $2269,72); year-to-date: -23.68%.
The cryptocurrency market had also been pricing in more dovish Fed rhetoric and liquidity support. A break below key technical levels increased selling pressure, triggered stop-losses, and accelerated the decline.
In the news:
Binance announced that it will convert its entire Secure Asset Fund for Users (SAFU) into Bitcoin, valued at approximately USD 1 billion. The fund, created to compensate users in the event of hacks or emergency situations, had previously been held predominantly in stablecoins.
The conversion will be carried out gradually over the next 30 days. Binance stated that it views BTC as the core asset of the crypto ecosystem and a long-term store of value, which is why it decided to shift the reserve into Bitcoin.
If, due to BTC volatility, the fund's value falls below USD 800 million, Binance has committed to replenishing it with Bitcoin to USD 1 billion. In other words, the company is prepared to absorb declines in the fund’s BTC holdings to maintain the reserve.
This can be interpreted as a structural, long-term vote of confidence in Bitcoin.
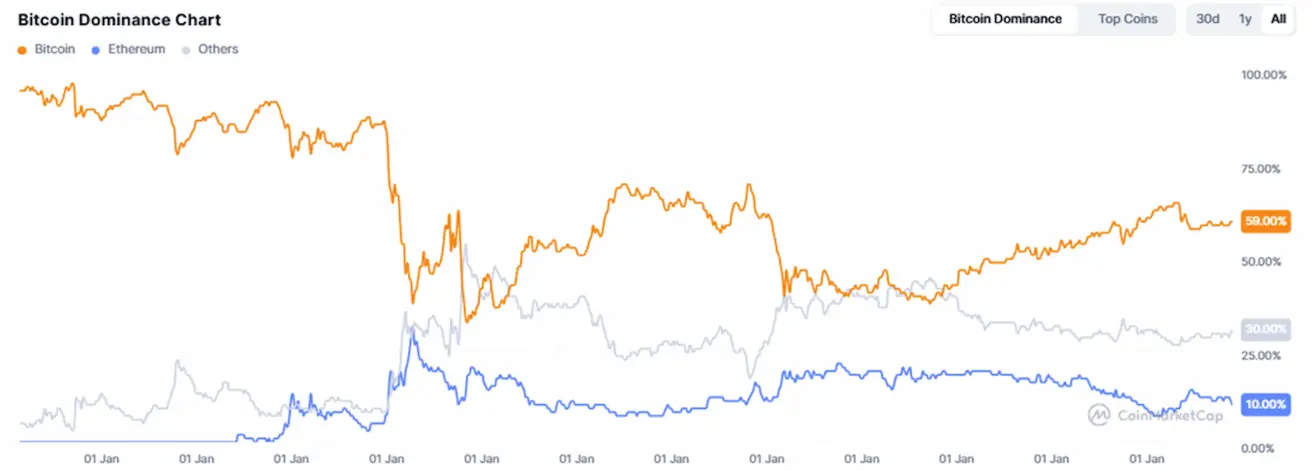
TOTAL CRYPTOCURRENCY MARKET CAPITALIZATION
$2.61T (vs. $3.23T a week earlier) (CoinMarketCap)
Market Share by Asset:
- Bitcoin: 54.9% (58.9%).
- Ethereum: 10.5% (12.5%).
- Other cryptoassets: 30.1% (28.6%).
ETF Net Flows Chart: