Lietuvių
 Русский
 Қазақша
 Eesti
EestiJanuary 6 — 10: Weekly economic update
Key market insights

MACROECONOMIC STATISTICS
INFLATION
- Core Consumer Price Index (CPI) (m/m) (December): 0.3% (prev: 0.3%);
- Consumer Price Index (CPI) (m/m) (December): 0.3% (prev: 0.2%);
- Core Consumer Price Index (CPI) (y/y) (December): 3.3% (prev: 3.3%);
- Consumer Price Index (CPI) (y/y) (December): 2.7% (prev: 2.6%).
INFLATION EXPECTATIONS (MICHIGAN)
- 12-month expected inflation (December): 3.3%, prev: 2.8%;
- 5-year expected inflation (December): 3.3%, prev: 3.0%.
BUSINESS ACTIVITY INDEX (PMI)
- Services sector (December): 56.5 (pre: 56.1);
- Manufacturing sector (December): 49.3 (pre: 48.4);
- S&P Global Composite (December): 55.4 (pre: 54.9).
GDP BEA (U.S. Bureau of Economic Analysis):
- Quarterly (q/q) (3Q, third estimate): 3.1% (previous: 3.0%).
LABOR MARKET
- Unemployment rate (December): 4.1% (previous: 4.2%).
- Nonfarm payroll changes (December): 256K (previous: 212K).
- Private nonfarm payroll changes (December): 223K (previous revised: 182K).
- Average hourly earnings (December, y/y): 3.9% (previous: 4.0%).
MONETARY POLICY
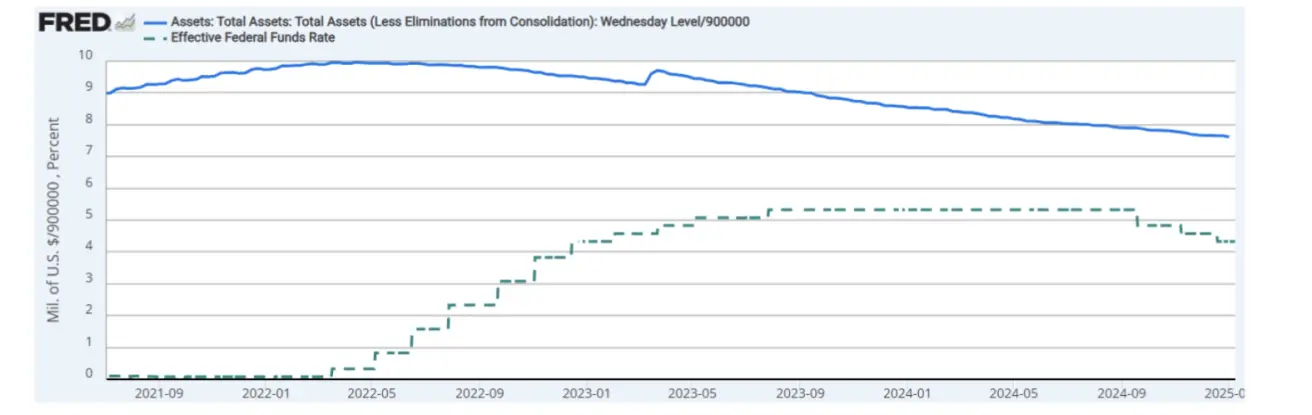
- Federal funds rate (EFFR): 4.25% - 4.50% (target range).
- Federal Reserve balance sheet (in trillions): $6.852 trillion (previous week: $6.853 trillion).
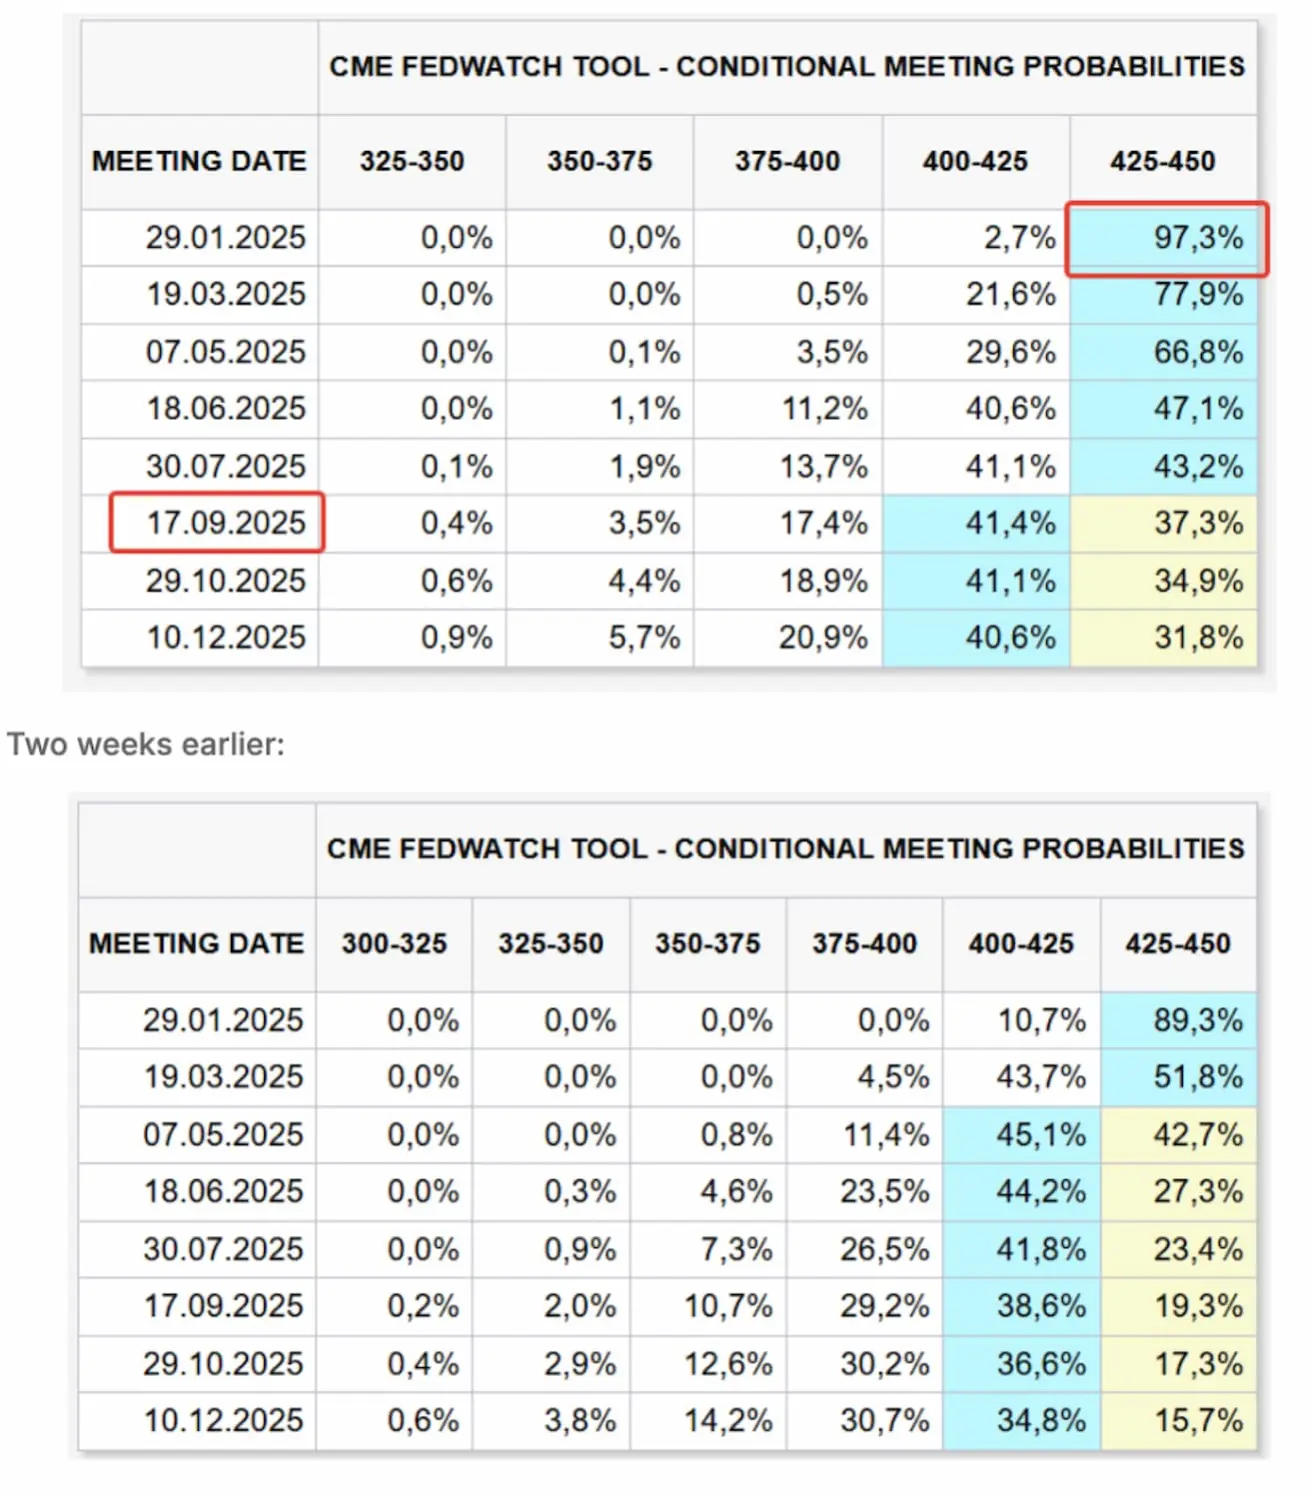
MARKET FORECAST FOR RATE
Today:
Commentary:
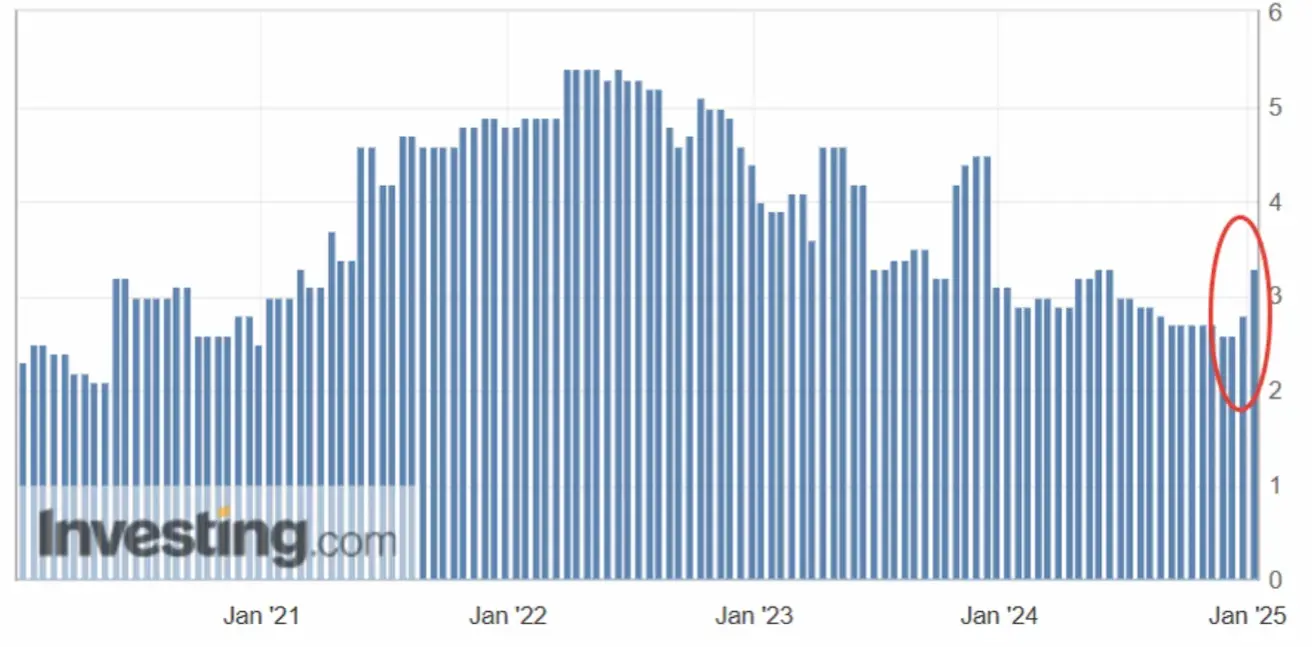
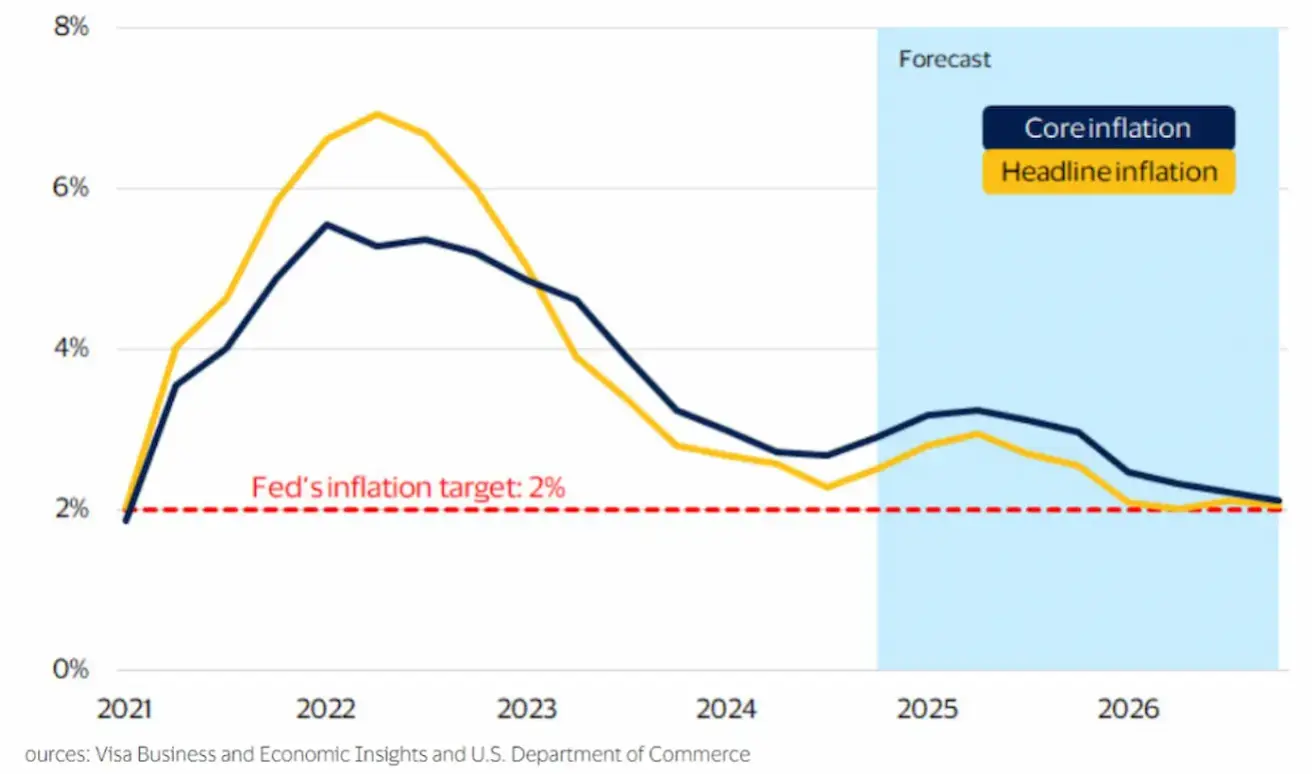
Inflation in the US based on the CPI index remains stable at 3.3% for the core index and 2.7% including energy and food.
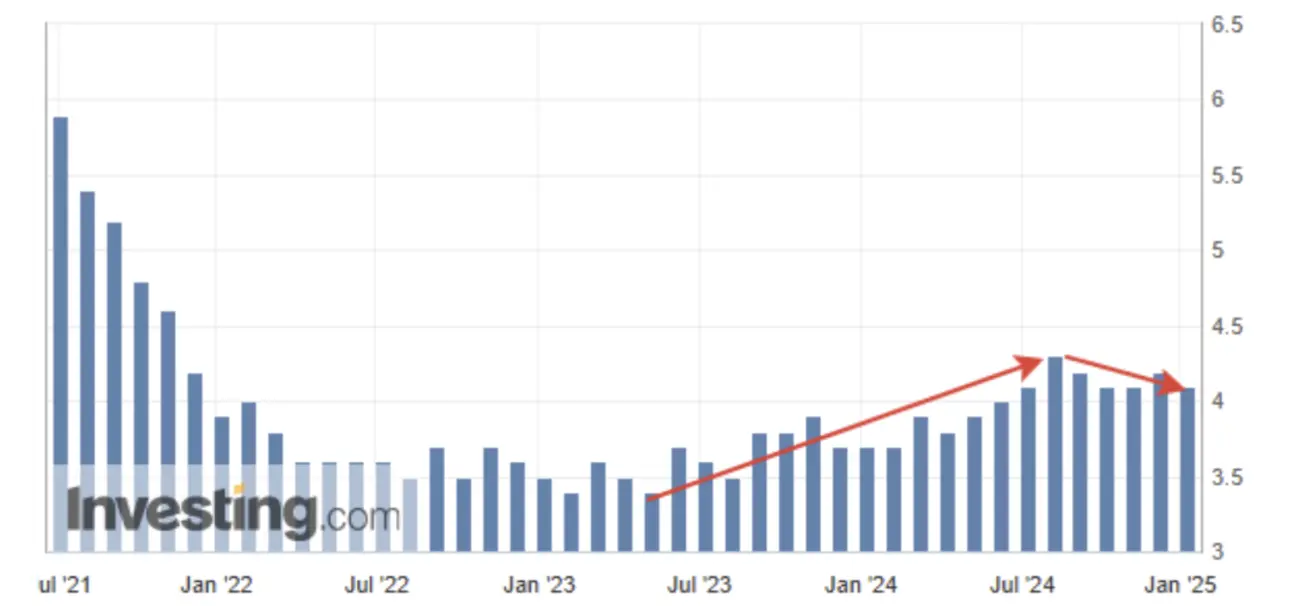
Inflation expectations for December for the next 12 months stabilized at 2.7% from September to December, but the last two releases showed a spike to 3.3%.
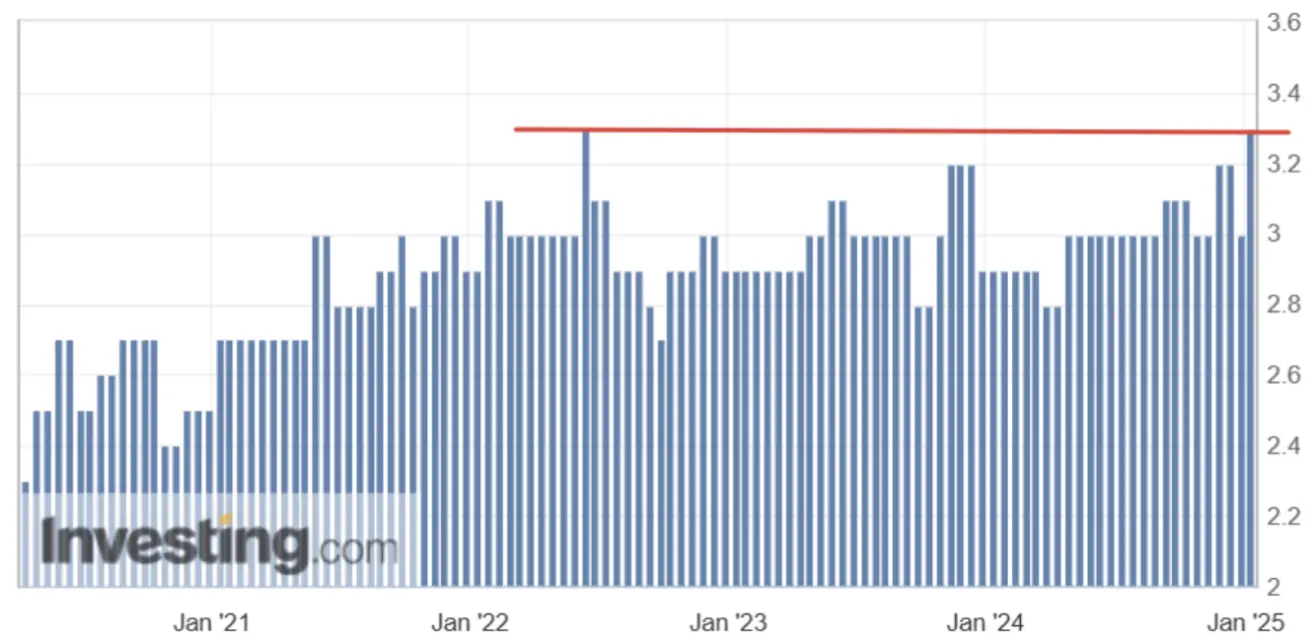
Long-term expectations also show a peak of 3.3% since June 2022 (near the start of the rate hike cycle). The unemployment rate in December slightly decreased to 4.1% from 4.2%, and over the last six months, the rate has been in a declining phase. In December, 256K jobs were created, significantly exceeding expectations — the labor market is not slowing down as the Federal Reserve desires.
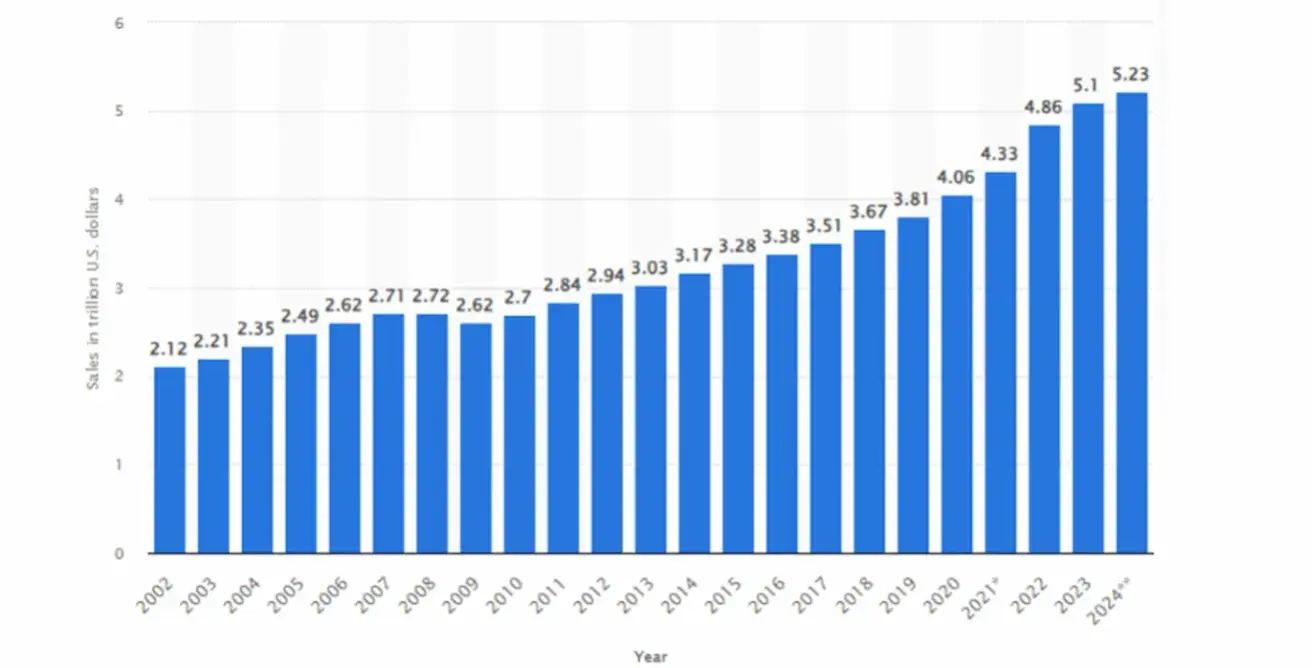
Economic growth in 2024 was much stronger than many analysts anticipated, even considering high interest rates. Disposable income growth remains steady, supporting consumer spending. Consumer spending in the US continues to be the main driver of the economy: annual growth of 2.33%.
Retail Sales in the U.S. (2002–2024) (in trillions $) (+2.33%):
According to the U.S. Department of Commerce, real disposable income is projected to continue growing at an average of 1.5%. Despite slower growth rates, income increases will support consumer spending with some deceleration, thereby keeping the economy afloat (a "soft landing" scenario).
Real Disposable Income (Annual Percentage Change):
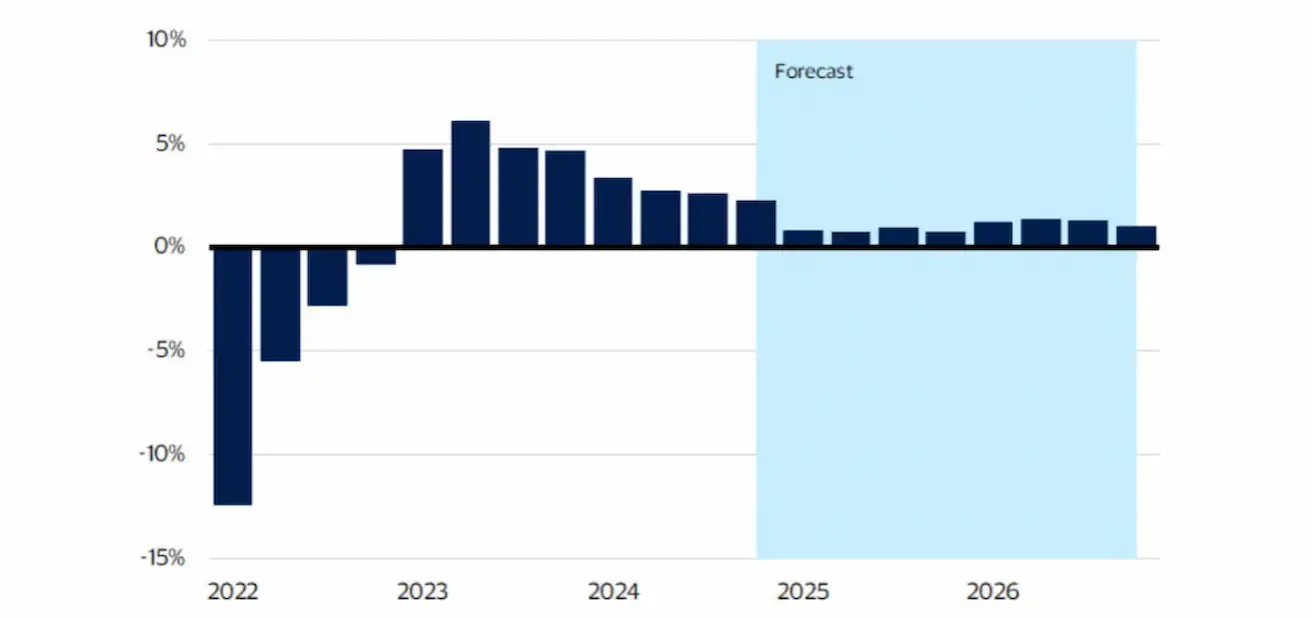
The U.S. Department of Commerce forecasts for core inflation suggest achieving a 2% target by 2026, with growth expected in 2025, which generally aligns with Federal Reserve projections.
Conclusion:
Given the rise in inflation expectations for 2025, sustained consumer spending, and recent labor market data releases, the situation does not favor a rate cut.
Last week, the minutes of the December Federal Reserve meeting were released. Key takeaways (consistent with macroeconomic data):
Members of the regulator see risks of higher inflation due to potential tariff hikes by President-elect Trump. The process of moving inflation toward 2% may take longer than previously expected. The committee is at or near a point where it would be appropriate to slow the pace of policy easing. Today, committee members are less certain about where rates stand relative to the unobservable "neutral" level. The next Federal Reserve meeting will take place on January 29, where it is expected that the regulator will leave the rate unchanged. Over the next 12 months, one rate cut of 0.25% to a range of 4.00%-4.25% is projected for September.
MARKET
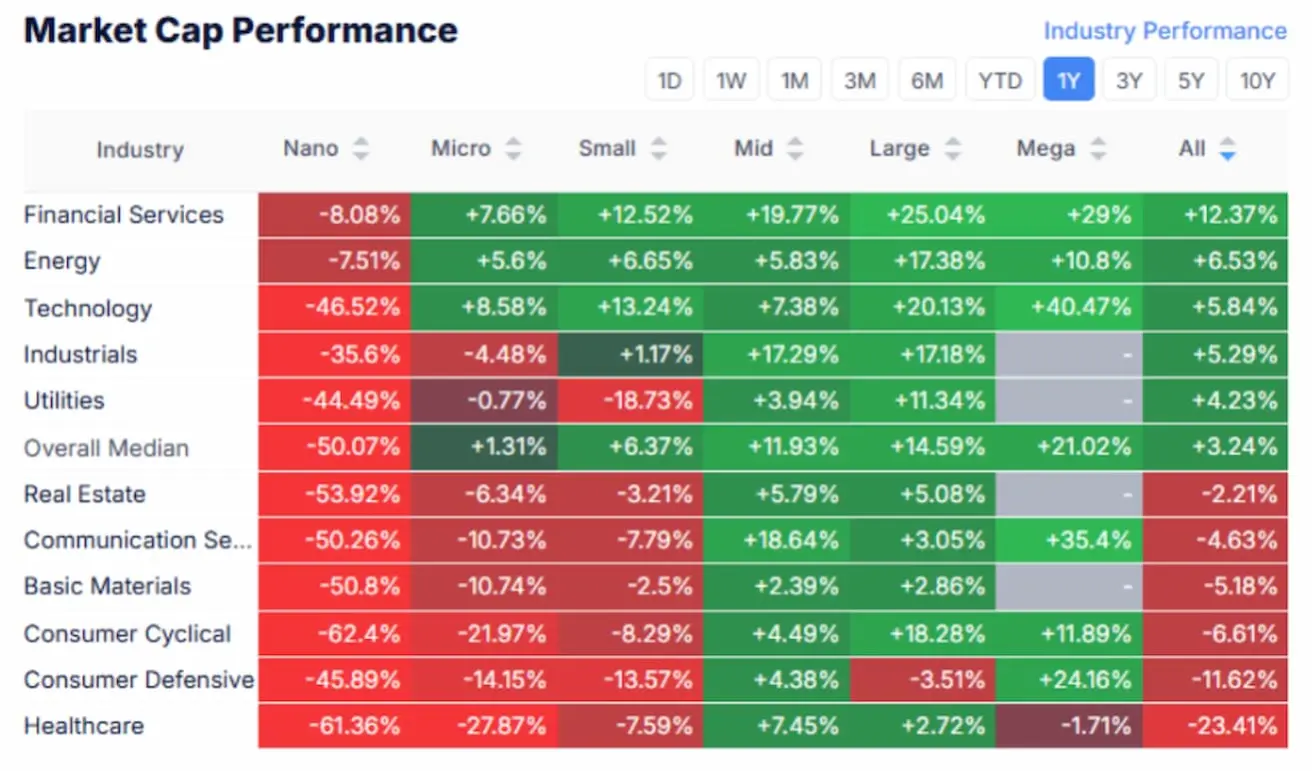
MARKET CAP PERFORMANCE
Stock market:
Last week, except for the energy sector, the stock market experienced risk-off behavior, with sell-offs across all sectors and capitalizations. Markets are under pressure due to changes in Federal Reserve monetary policy and the December employment report, which could trigger a correction in the stock market.

Annual Returns for 2024:
Best performance: Financial sector, energy, and technology. Worst performance: Defensive sectors (consumer goods and healthcare).
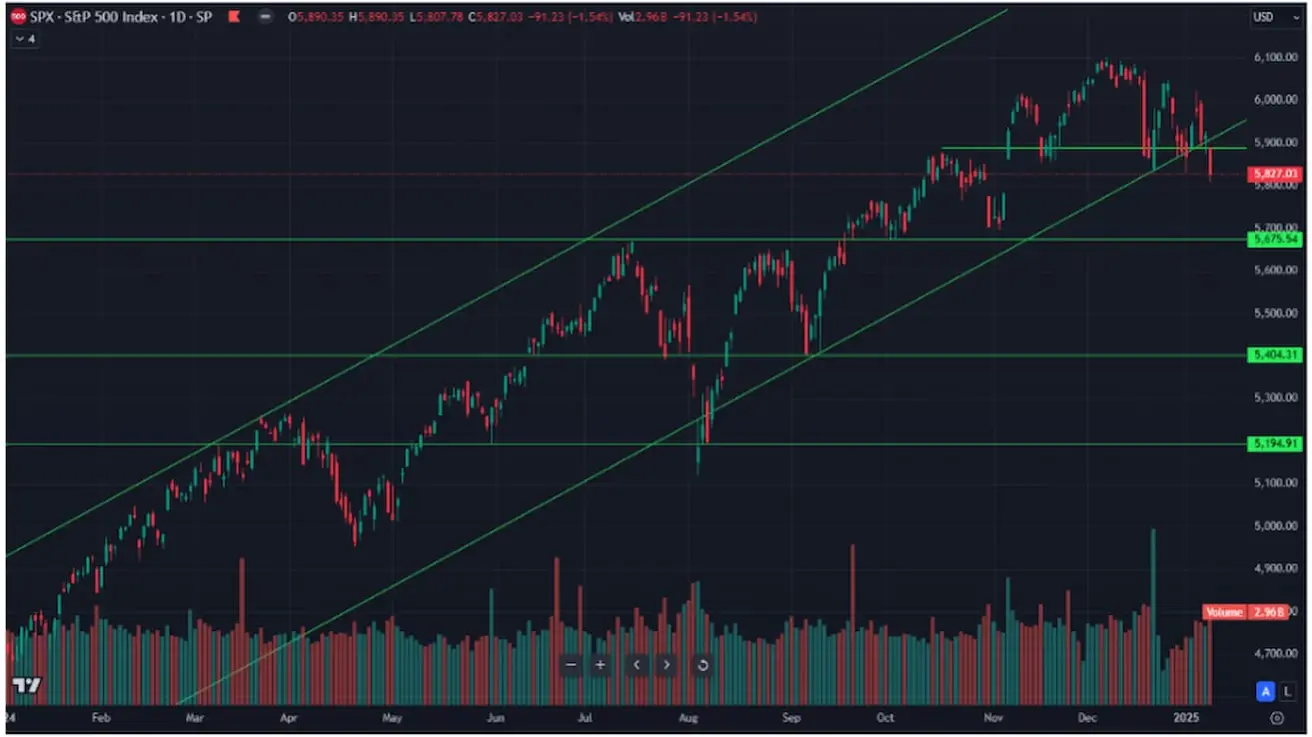
SP500
-2.61% (weekly close: 5827.03). Growth in 2024: 27.12%.
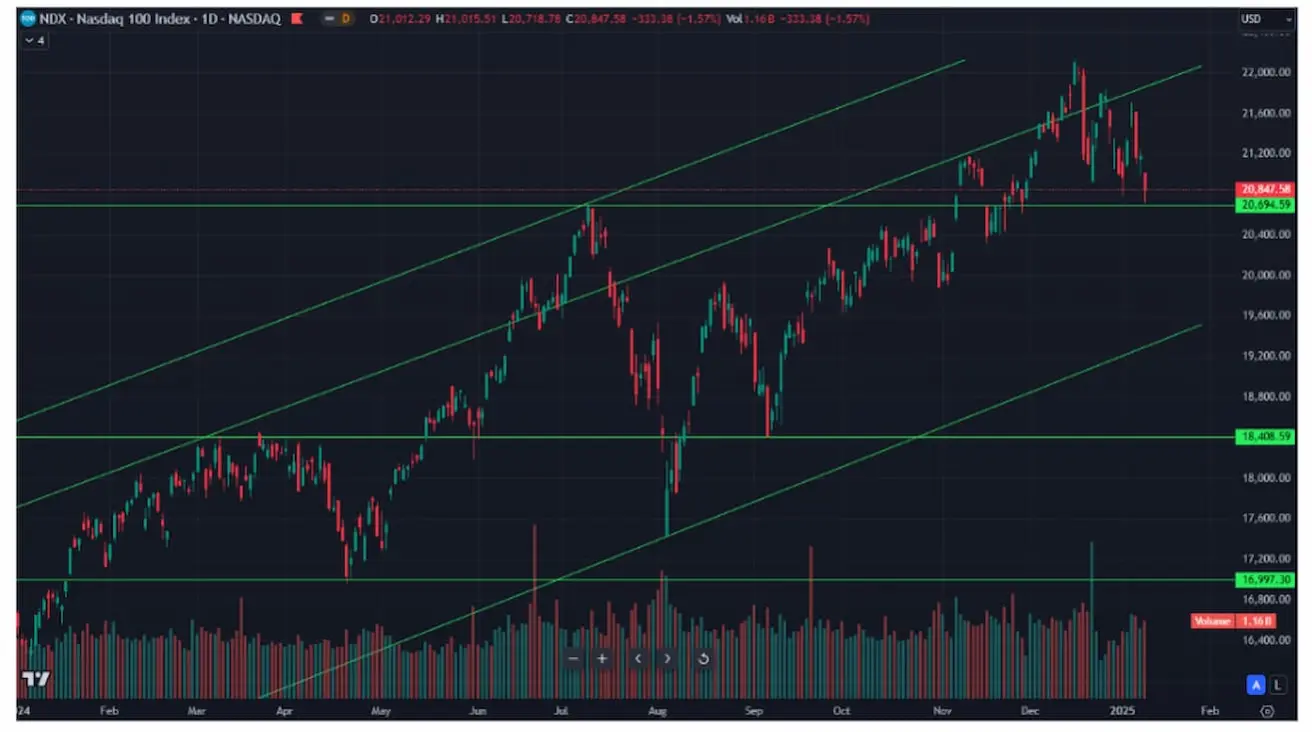
NASDAQ100
-3.24% (weekly close: 20848.90). Growth in 2024: 26.07%.
Comparative Valuation of Stock Markets by Multiples:
China ranks among the top five undervalued stock markets. Today’s overvalued markets are Denmark, India, and, in third place, the United States, with inflation risks and rate retention.

BOND MARKET
Prolonged rate retention continues to pressure bonds.
- Treasury Bonds (ETF TLT): -0.91%. Decline in 2024: -3.61%

Yields and Spreads
Yields and Spreads (2025/01/09 vs 2024/01/02):
- Market Yield on U.S. Treasury Securities at 10-Year Constant Maturity: 4,759% (4,57)%;
- ICE BofA BBB US Corporate Index Effective Yield: 5,62% (5,55%):
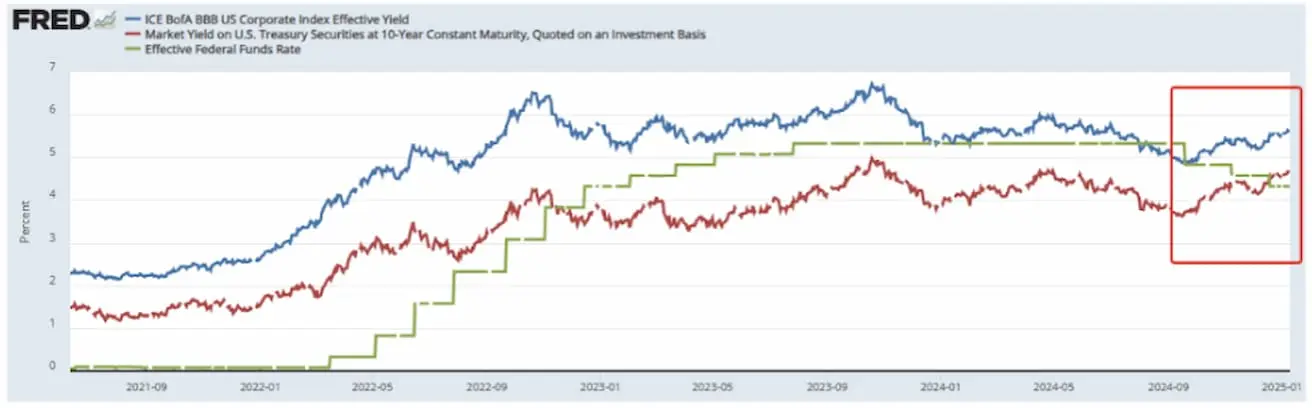
Yields are rising — the Federal Reserve is cutting rates, while both long-term Treasuries and corporate bonds continue to decline. The bond market reflects risks of rising inflation and sustained high rates.
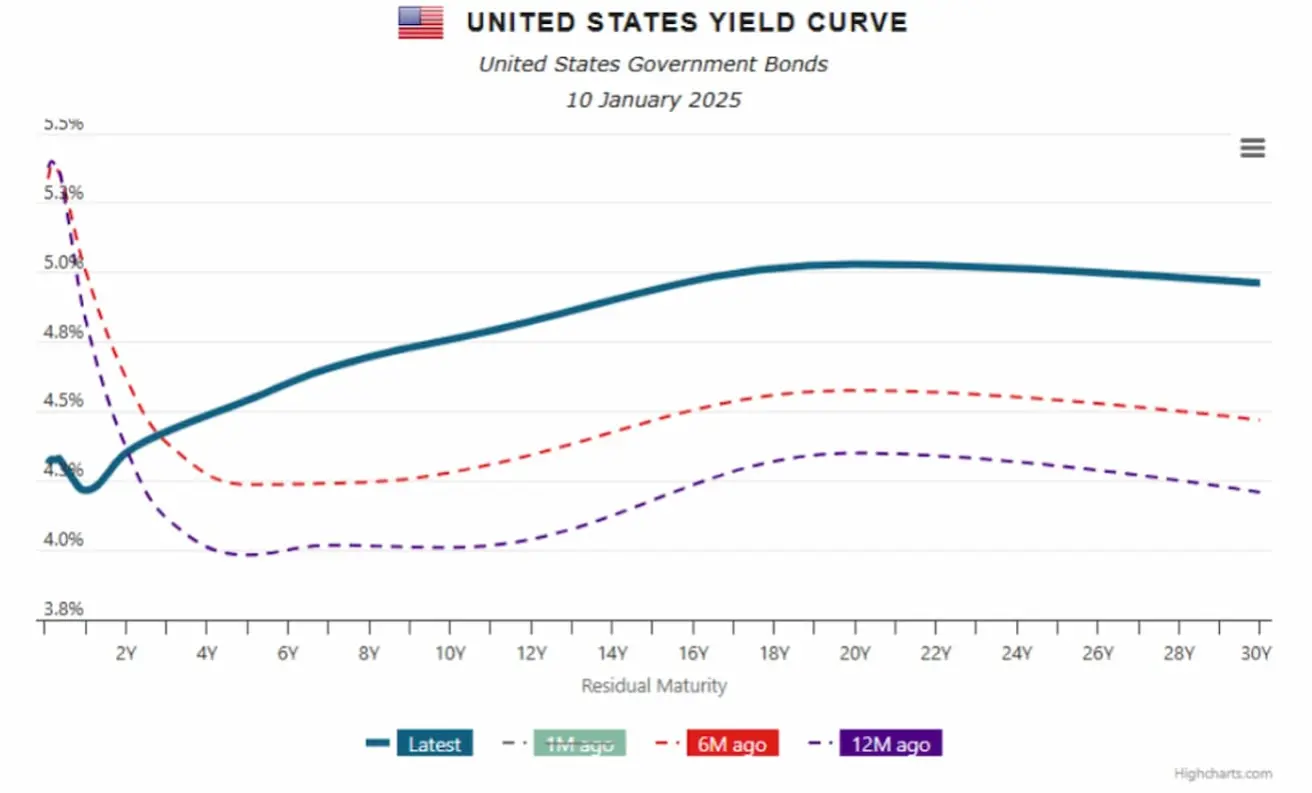
U.S. Treasury Yield Curve:
- The U.S. Treasury yield curve shows the yields of bonds with different maturities. It serves as a key indicator of the state of the economy and market expectations.
- The curve has returned to its normal shape ("normal convexity"). Historically, the transition from an inverted curve to normal convexity has always been accompanied by a recession or crisis. In this phase of the cycle, the recurrence of such a situation remains uncertain.
IPO Market (2024) (Data from RenaissanceCapital.com):
- Number of IPOs: 150 (+38.89% y/y). These levels are comparable to 2017–2019.
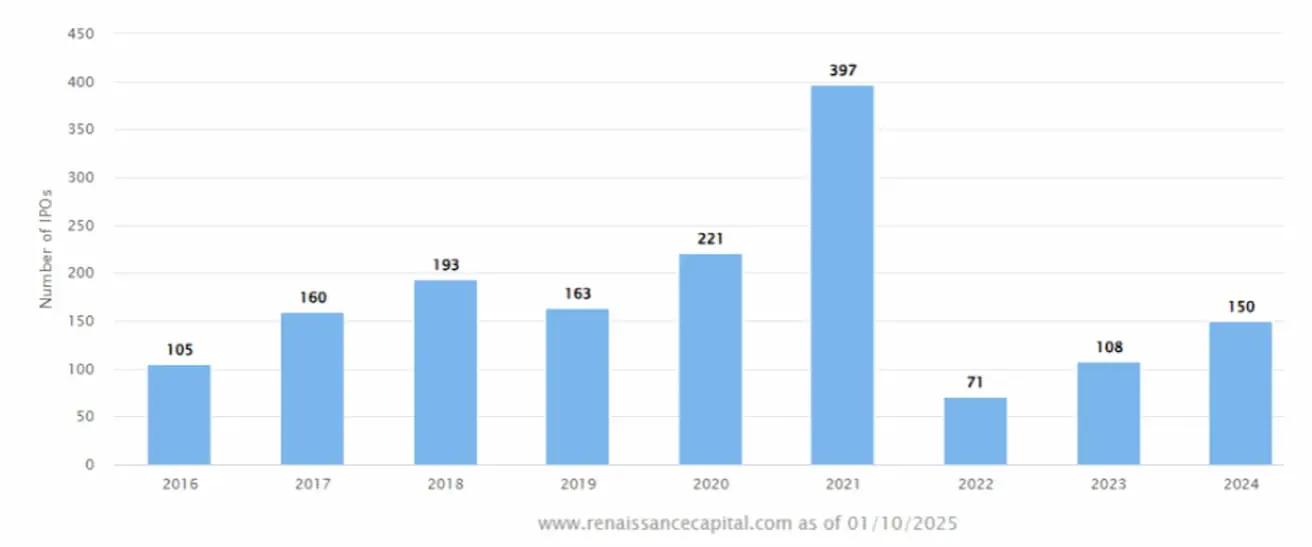
- Total funds raised: $29.6 billion (+52.58%).
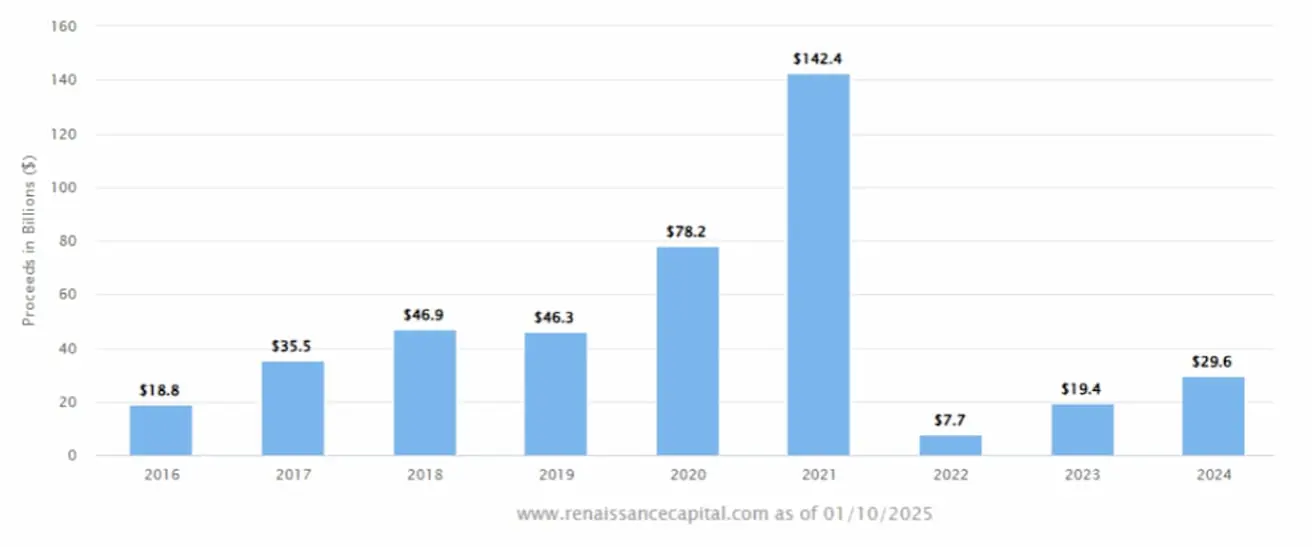
The IPO market continues to recover.
Total equity issuance in the U.S. (including SPOs, IPOs, and preferred stocks) for 2024 reached $221.4 billion (+59.3% y/y).
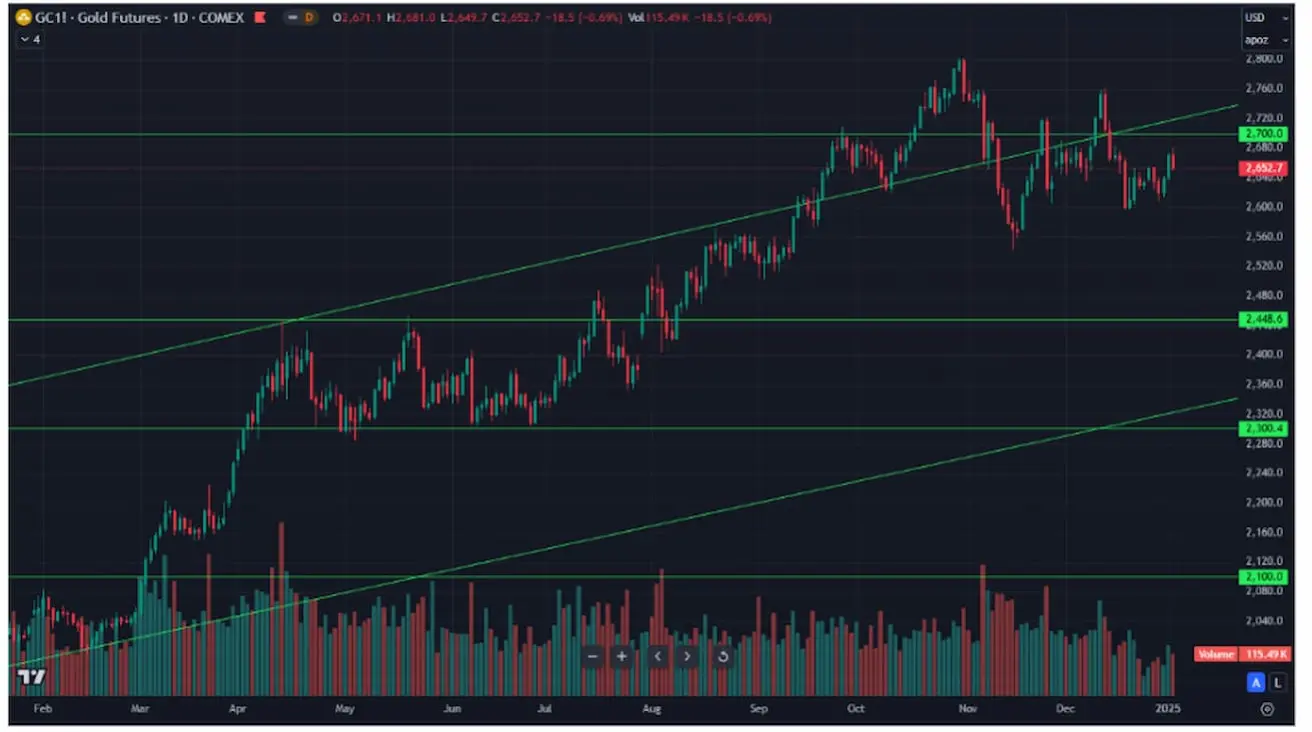
GOLD FUTURES
Last week: +2.41%, weekly close: $2717.4/oz. Annual growth in 2024: +7.14%.
DOLLAR FUTURES (DX)
The dollar continues to strengthen in the international currency market: +0.63%, weekly close: $109.485. Annual growth: +7.14%.

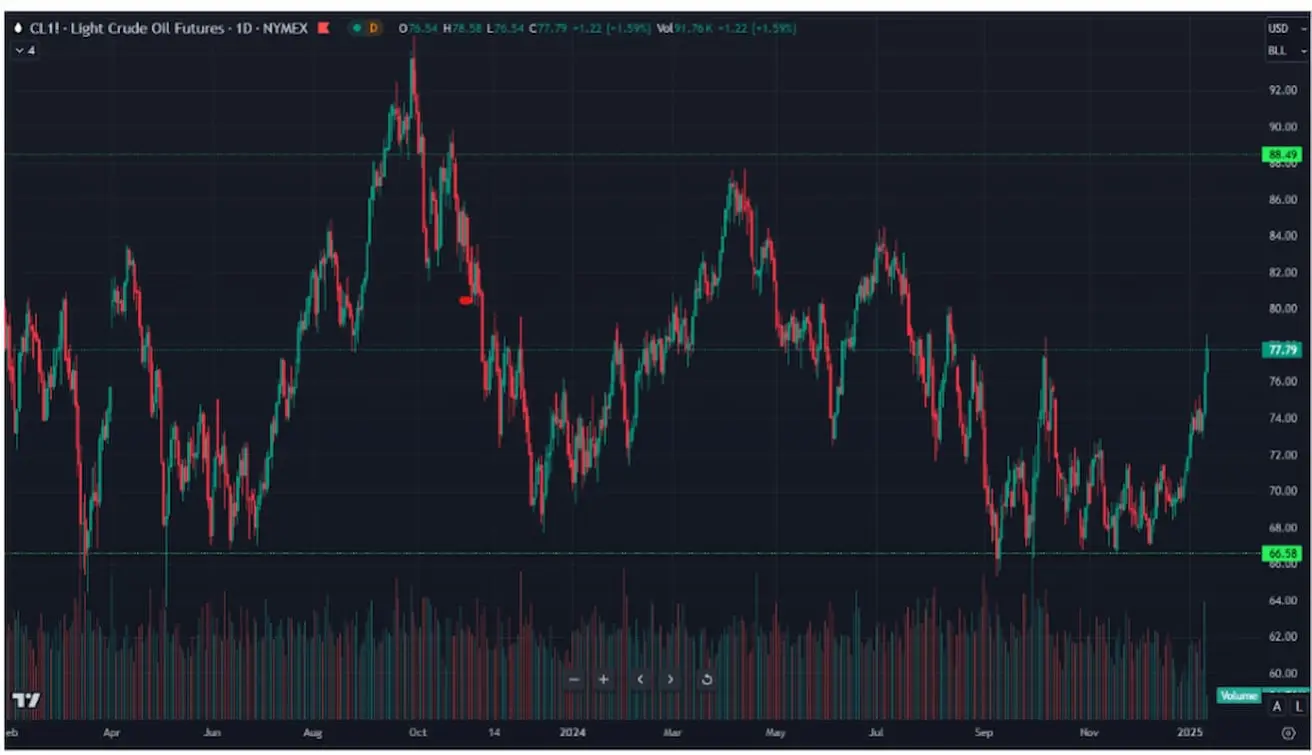
OIL FUTURES
Rose by 3.35%, weekly close: $76.57/barrel.
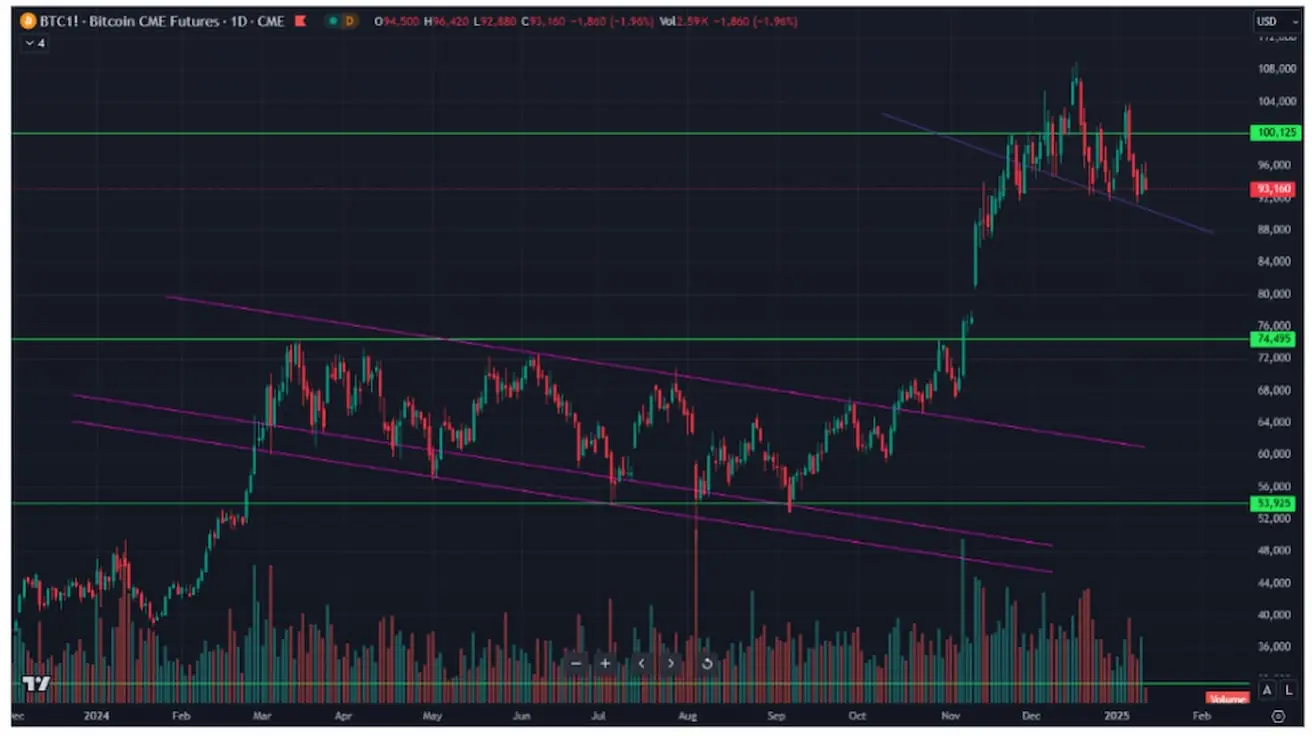
BTC
The cryptocurrency market continues to correlate with the U.S. stock market and has been declining since December last year.
Bitcoin Futures: Weekly decline: -4.44%, weekly close: $95020. Annual growth: 114%.
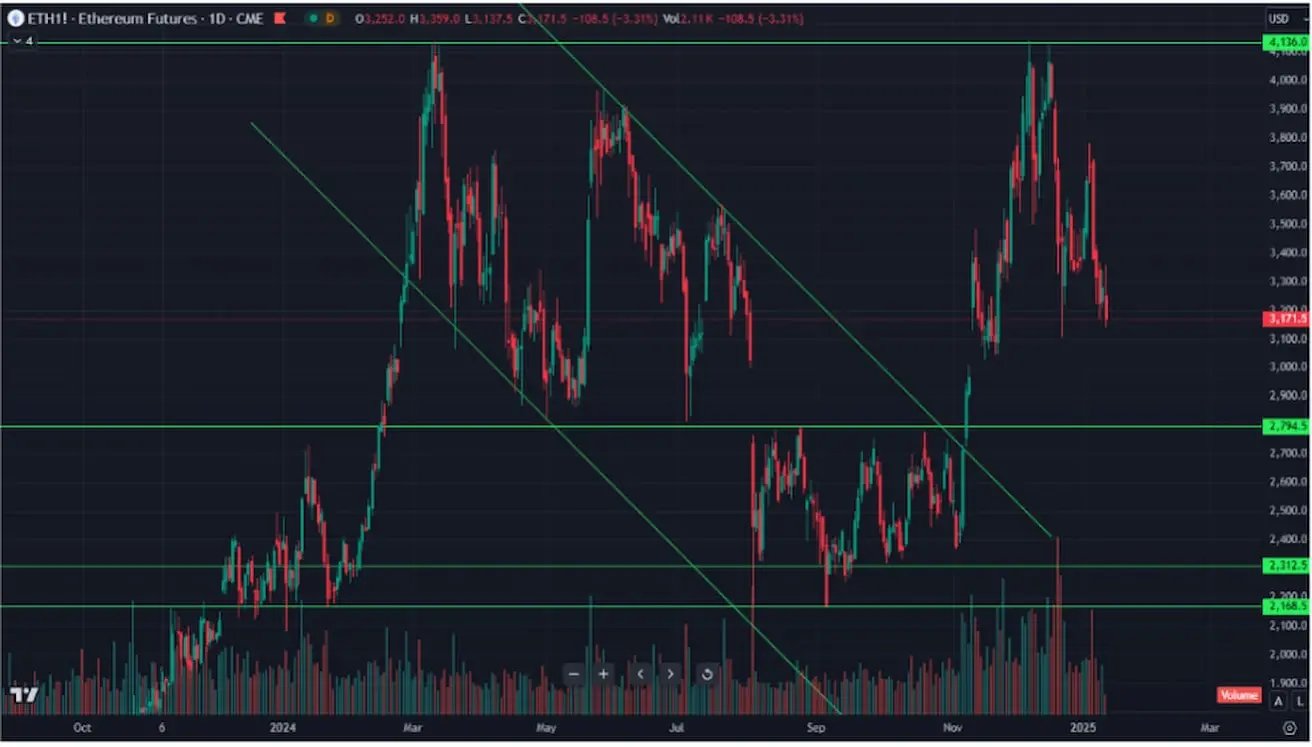
ETH
Weekly decline: -11.44%, weekly close: $3280. Annual growth: 42%.
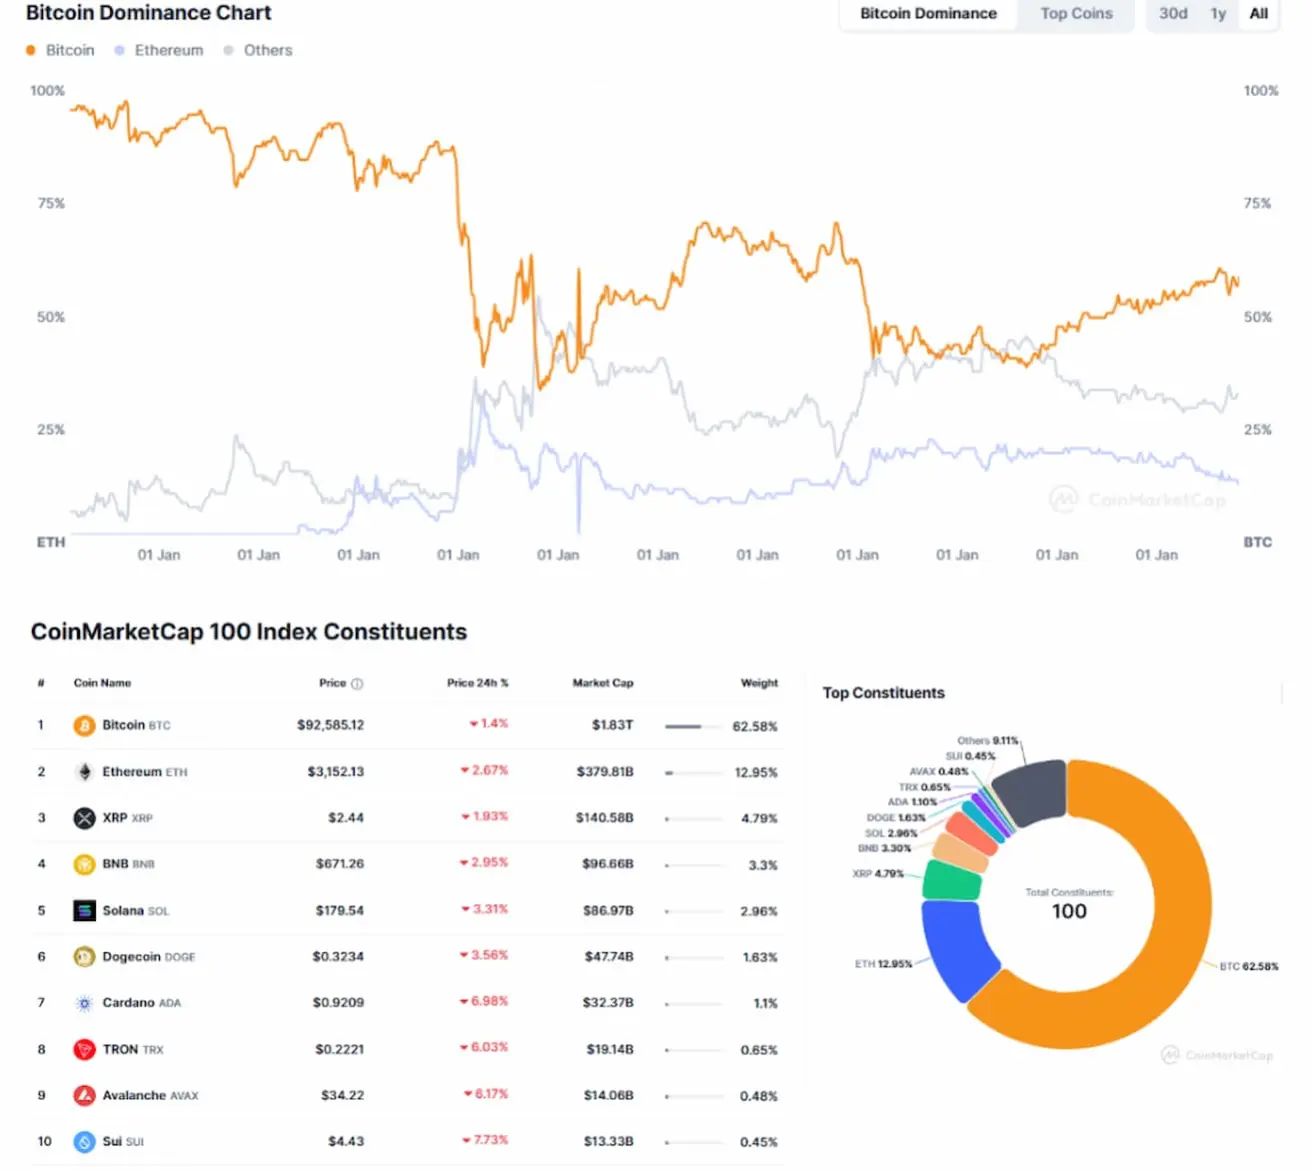
THE CAPITALIZATION OF THE CRYPTO MARKET
Total: $3.21 trillion (prev: $3.66 trillion a week before) (coinmarketcap.com);
- Bitcoin Market Cap: 57.2% (55.7%);
- Ethereum Market Cap: 11.8% (12.6%);
- Others: 31.0%.