Lietuvių
 Русский
 Қазақша
 Eesti
EestiMarch 10 - 14, 2025: Weekly economic update
Key market updates

MACROECONOMIC STATISTICS
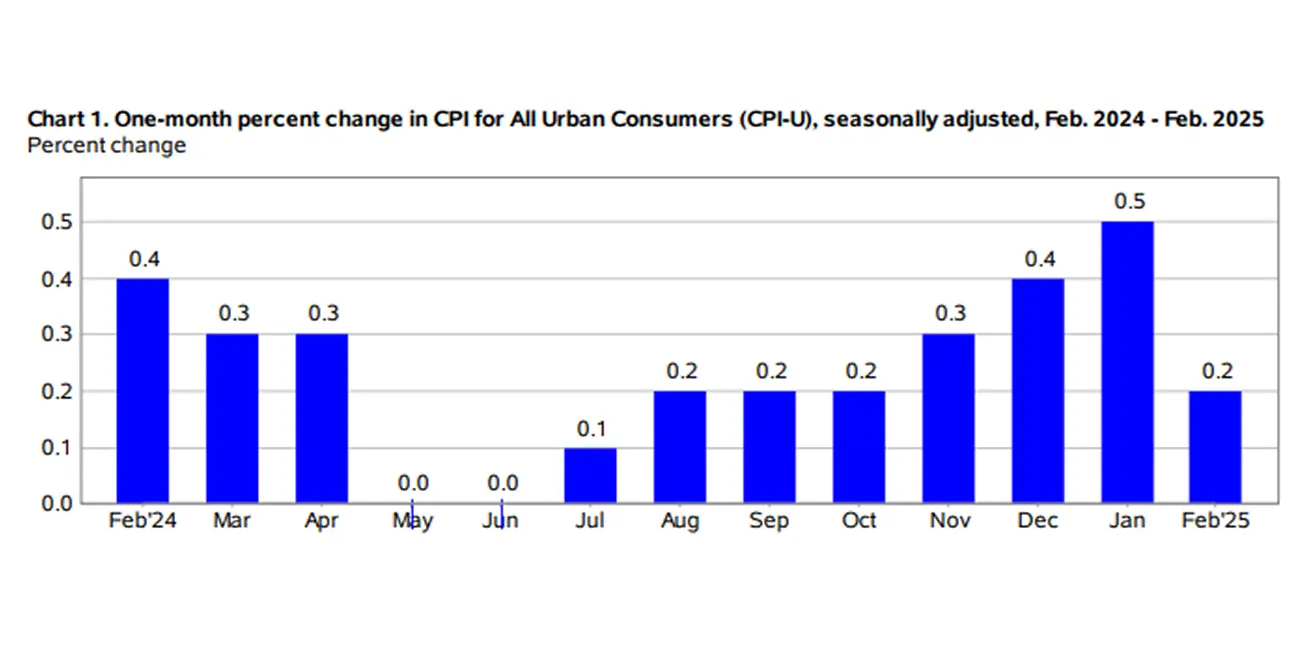
INFLATION
- Core Consumer Price Index (CPI) (m/m) (February): 0.2% (prev: 0.4%);
- Consumer Price Index (CPI) (m/m) (February): 0.2% (prev: 0.5%);
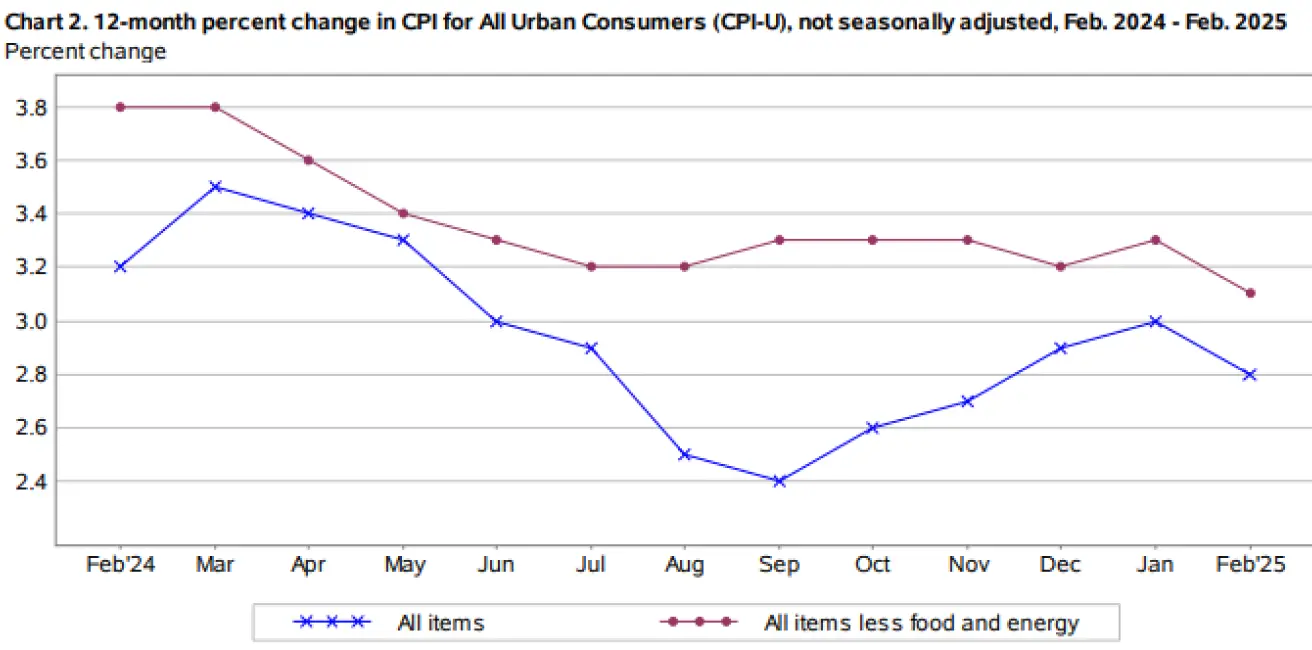
- Core Consumer Price Index (CPI) (y/y) (February): 3.1% (prev: 3.3%);
- Consumer Price Index (CPI) (y/y) (February): 2.8% (prev: 3.0%).
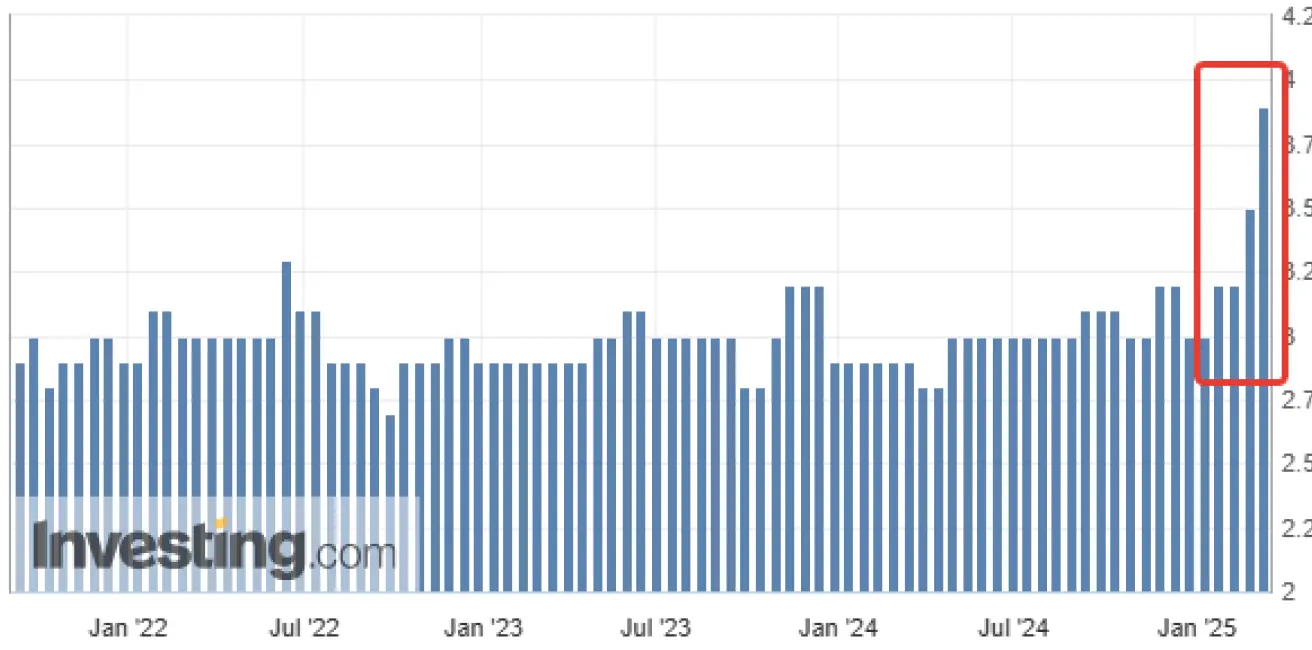
INFLATION EXPECTATIONS (MICHIGAN)
- 12-month expected inflation (February): 4.9%, prev: 4.3%;
- 5-year expected inflation (February): 3.9%, prev: 3.5%.
** GDP (BEA – U.S. Bureau of Economic Analysis) (q/q) (Q) (Preliminary Estimate): 2.3% (prev: 3.1%)**
BUSINESS ACTIVITY INDEX (PMI):
- Services Sector (February): 51 (prev: 49.7);
- Manufacturing Sector (February): 52.7 (prev: 51.6);
- S&P Global Composite (February): 51.6 (prev: 50.4).
LABOR MARKET:
- Unemployment Rate (February): 4.1% (prev: 4.0%);
- The change in non-agricultural employment for February stands at 151K (prev 81K);
- Average Hourly Earnings (February, y/y): 4.0% (prev: 3.9%).
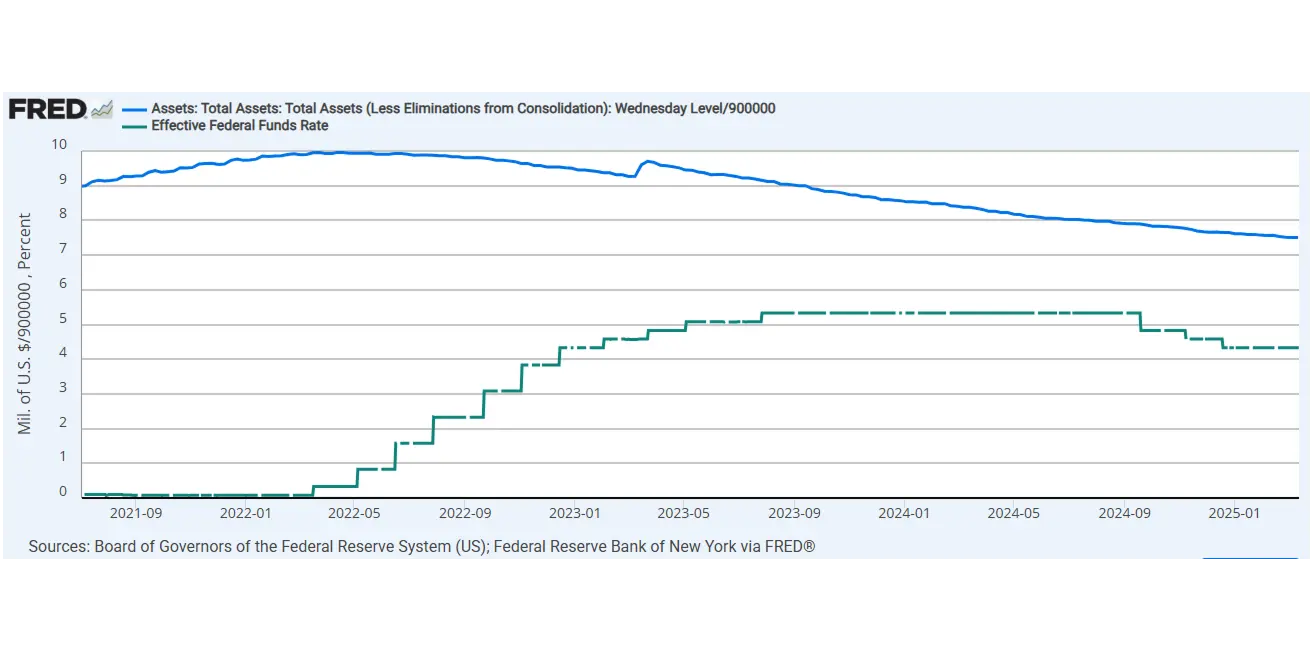
MONETARY POLICY
- Federal Funds Rate (EFFR): 4.25%–4.50% (dotted line);
- Fed Balance Sheet (blue): $6.759 trillion (vs previous week: $6.756 trillion)
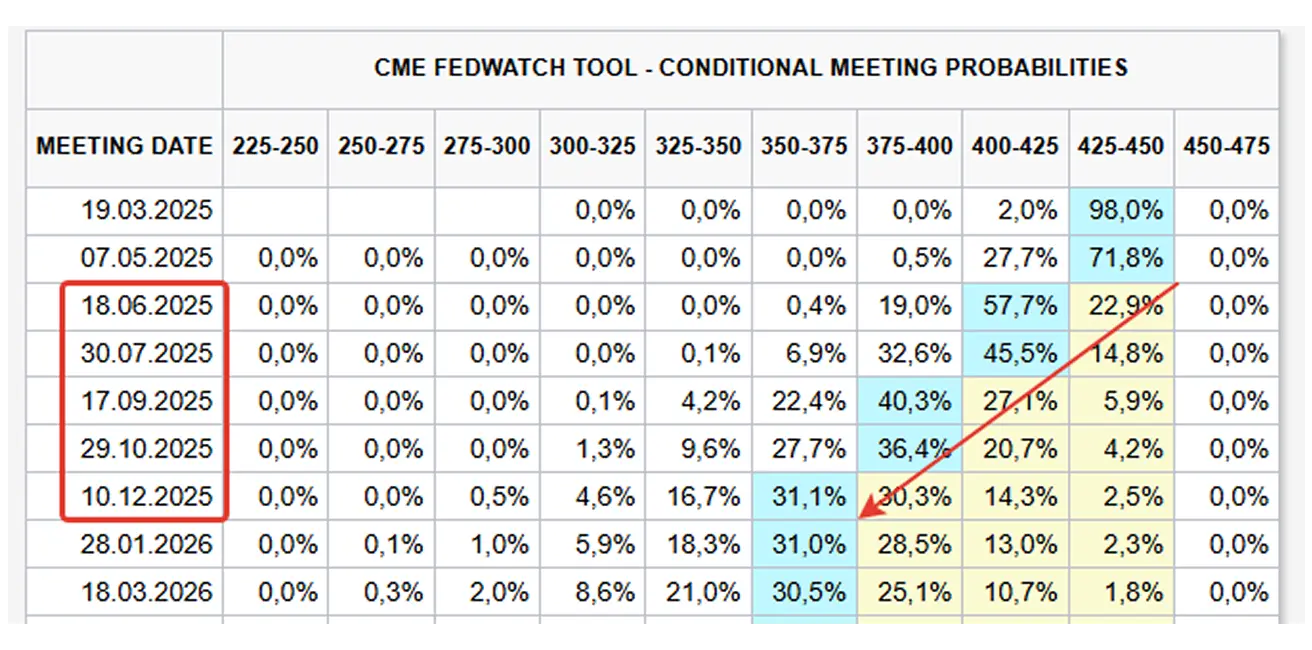
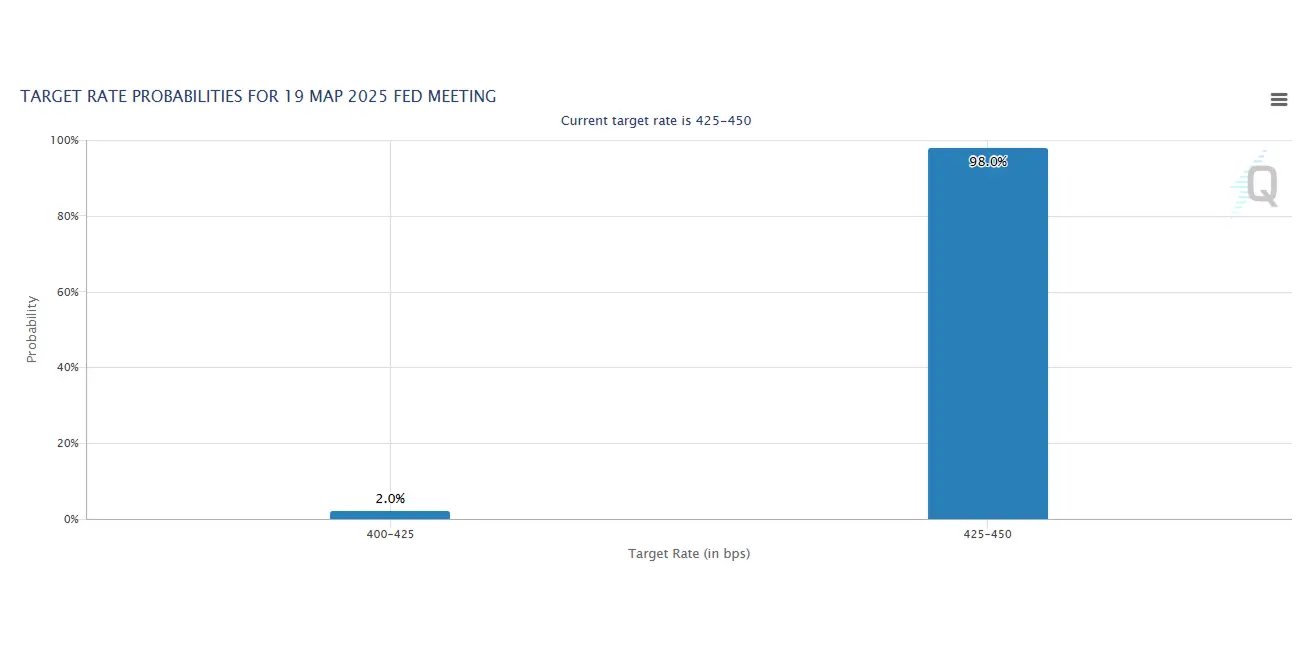
MARKET FORECAST FOR RATE
Today:
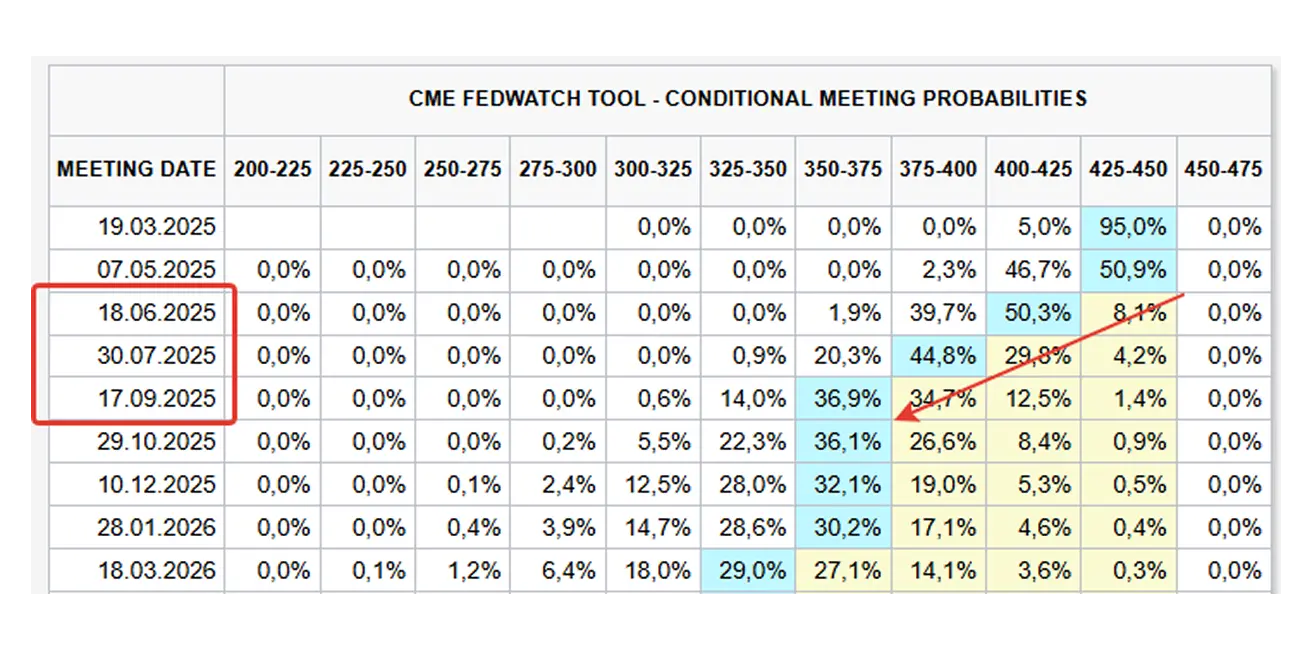
А week earlier:
Commentary:
The past week saw a global escalation in the trade war, heightened political uncertainty, and a sharp decline in equity markets. Despite these concerns, business activity indices remain above the 50 threshold, signaling continued economic expansion. The services sector, which in the previous release dipped below 50 for the first time in two years, did not continue contracting.
Labor Market Overview Non-farm payroll employment rose by 151,000 in February, while the unemployment rate increased slightly to 4.1%. Job gains were concentrated in healthcare, financial activities, transportation, warehousing, and social assistance, while federal government employment declined. The Atlanta Fed's GDPNow model has been projecting a 2.4% economic contraction for the third consecutive week.
Macroeconomic Outlook The next official GDP release by the Bureau of Economic Analysis is also expected to confirm a slowdown, and markets have already priced in this expectation. In the Eurozone, macroeconomic data remains broadly positive.
- The ECB cut rates from 2.9% to 2.65%.
- Inflation and unemployment have declined while GDP and business activity continue to expand.
- However, European bond markets declined after Germany announced €500 billion in new debt issuance to support public spending, with defense expected to grow fastest. In China, business activity remains in expansion, but CPI data signals deflation as weak consumer demand persists. This is likely to require further monetary stimulus from the PBoC.
Trade War Developments
Last week, Trump imposed new 25% tariffs on Mexico and Canada and additional tariffs on China. However, many Canadian and Mexican goods were later granted a temporary exemption for one month. In response, China, Mexico, and Canada have already introduced retaliatory tariffs. Market sentiment remains highly uncertain regarding the scope and escalation of the trade war.
Key Takeaways from the Fed's Monetary Policy Report and Powell's Remarks:
- The Federal Reserve sees no urgency and prefers to wait for clarity.
- The path to 2% inflation is expected to be uneven.
- Uncertainty surrounding policy changes and their economic impact remains high.
- Most indicators suggest a resilient and broadly balanced labor market.
- The U.S. economy remains strong despite elevated uncertainty.
- Recent data indicate a potential slowdown in consumer spending growth.
- Short-term inflation expectations have risen, influenced by tariffs.
- Policy uncertainty under the Trump administration continues to weigh on economic outlooks.
- The Fed's policy stance is not predetermined—it may maintain restraint if inflation slows or ease policy if the labor market unexpectedly weakens or inflation undershoots expectations.
- The zero lower bound is no longer the baseline scenario.
- "We will consider allowing moderate inflation overshoots." This effectively implies a higher inflation target, suggesting that zero interest rates are off the table and that the neutral rate can be anchored around 3% for the EFFR in the long run.
- "There is no need to redefine price stability. We should not react to short-term price fluctuations."
- "It is still unclear what will be tariffed and for how long. If this escalates into a series of actions, tariffs increase, or expectations shift, the Fed must respond accordingly."
- The economy does not require immediate action from the Fed.
- Fed officials are revising potential growth estimates upward.
Market Expectations – Fed Policy & Rate Cuts According to FedWatch futures:
- Markets anticipate three consecutive 25 bps rate cuts from June to August.
- The expected Fed Funds target range for 2025 is 3.50–3.75%.
- Investors are pricing in a more aggressive monetary easing cycle from the Fed.
Market
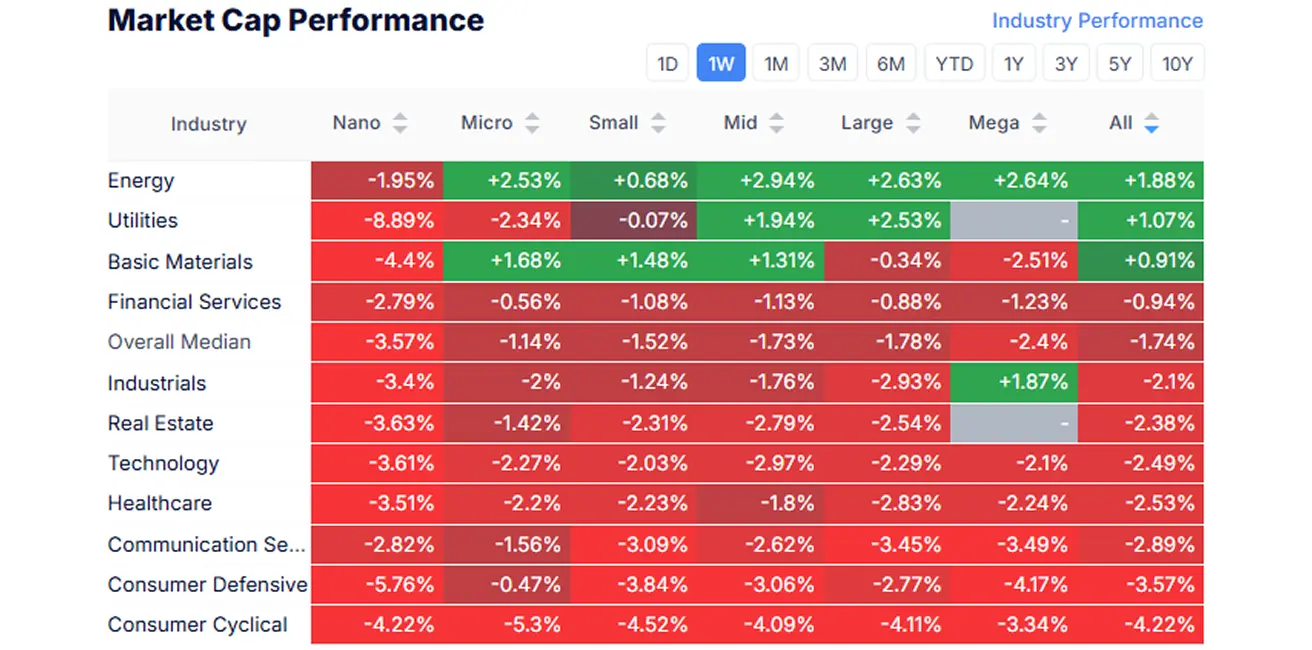
MARKET CAP PERFORMANCE
Last week, the stock market remained red across all sectors except for basic materials, utilities, and energy. The median market decline stood at 1.74%.
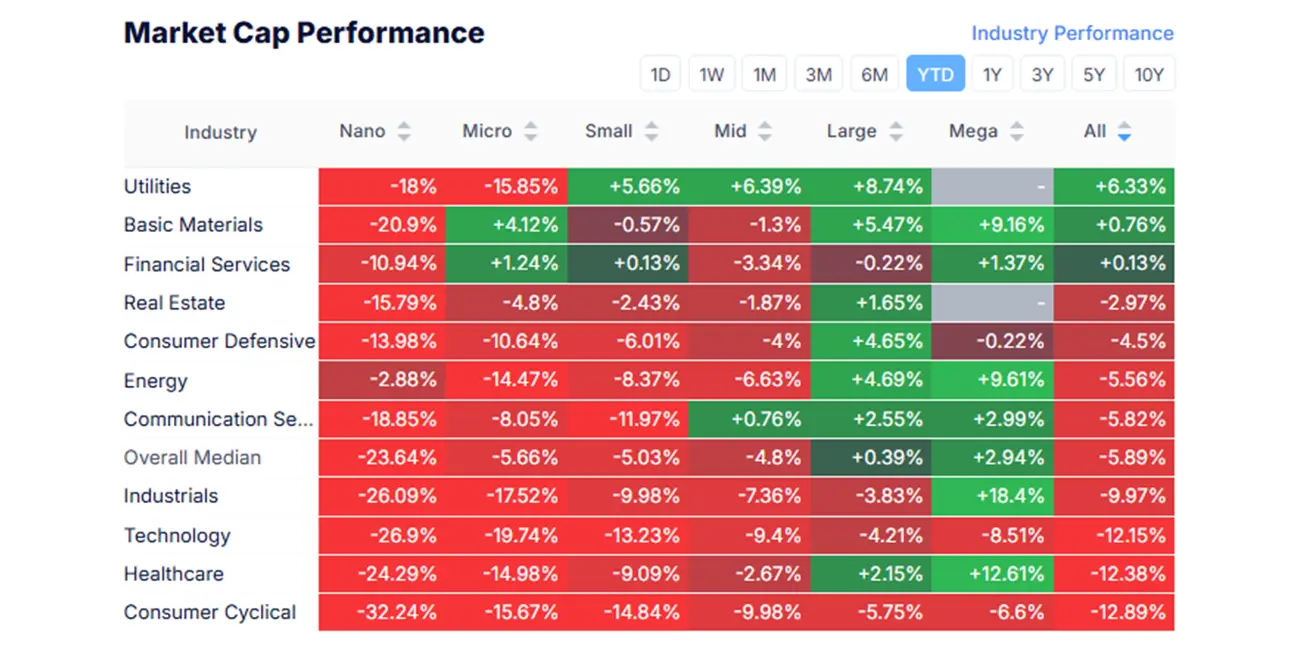
YTD (Year-to-Date: the period from the beginning of the year to the present date).
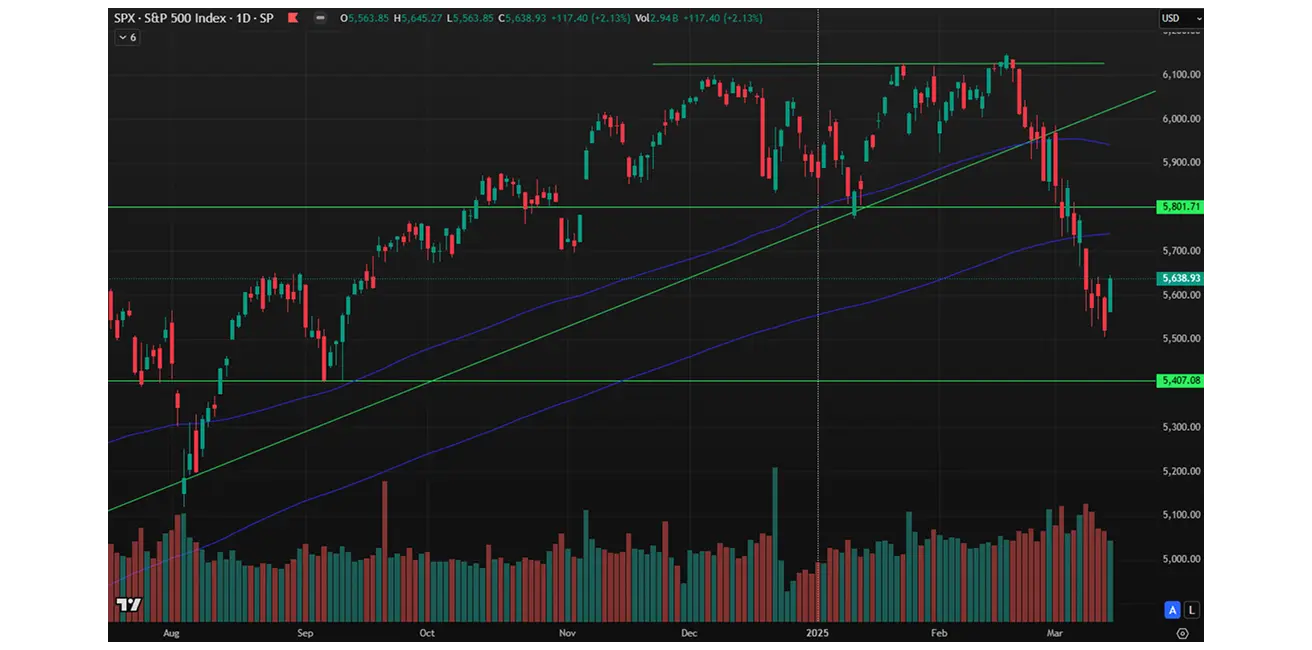
SP500
Weekly performance: -2.27% (week's closing at 5,638.93). Year-to-date growth in 2025: -4.48%.
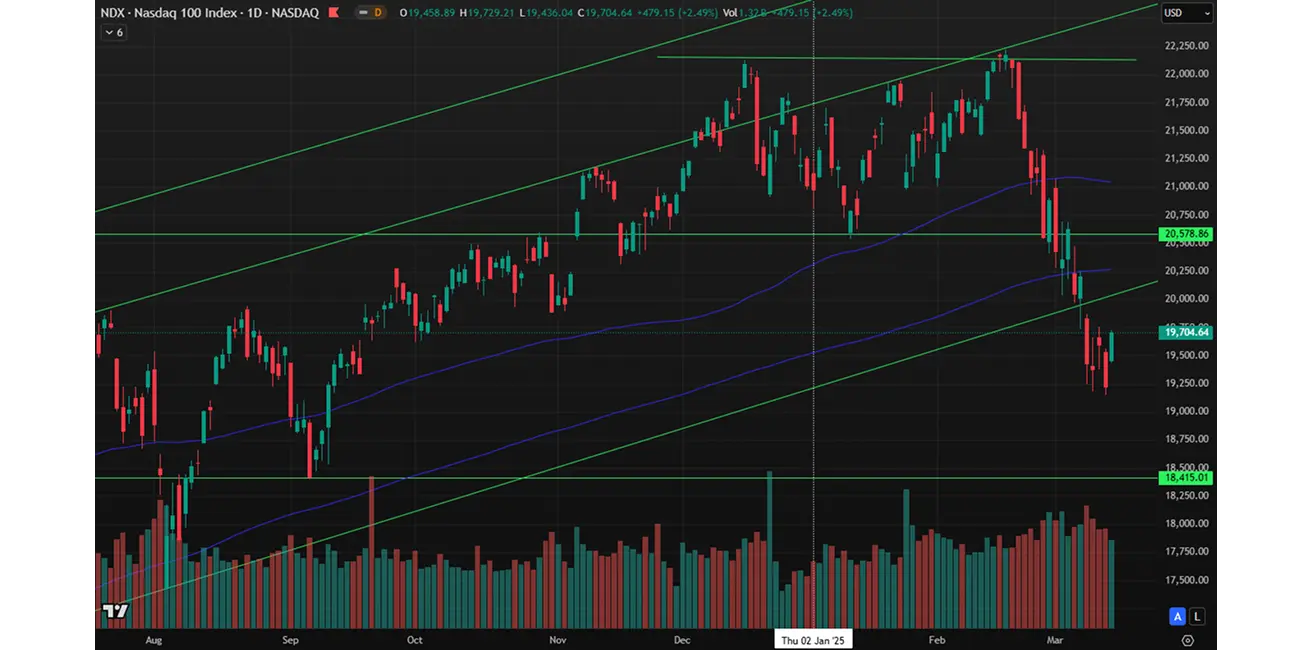
NASDAQ100
Nasdaq 100: Weekly performance: -3.08% (week’s closing at 19,578.86). Year-to-date decline in 2025: -7.30%.
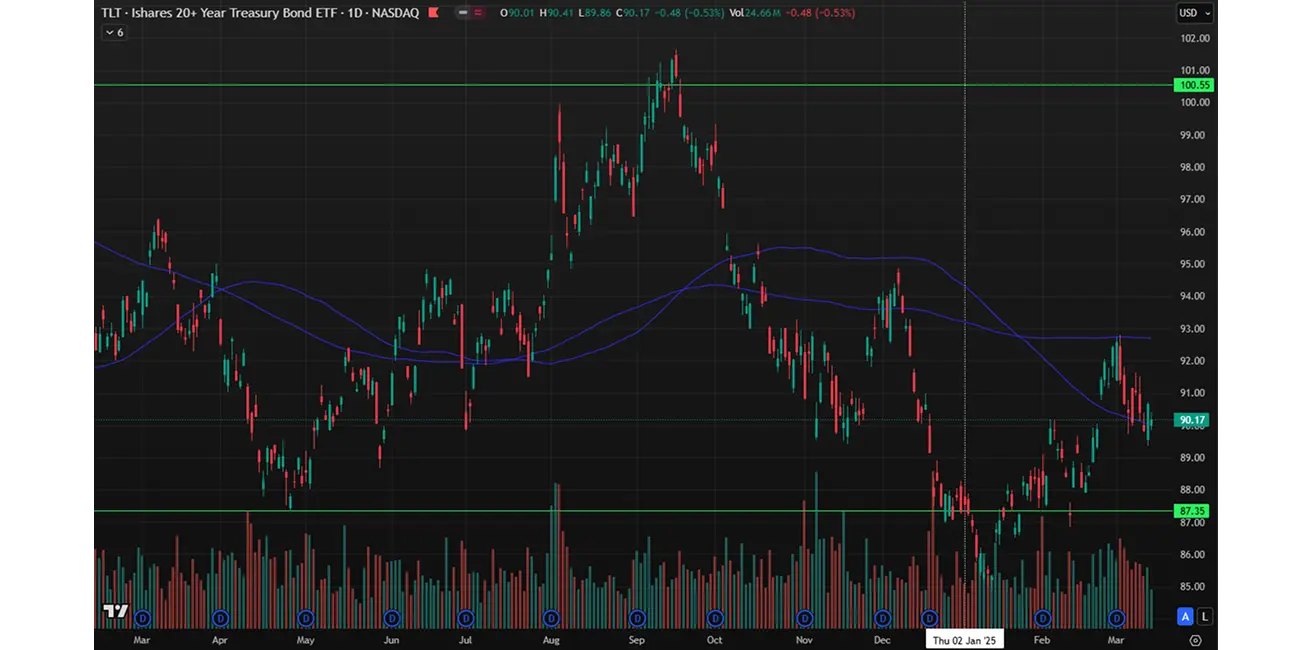
BOND MARKET
Treasury Bonds 20+ (ETF TLT): +0.07% (week’s closing at $90.17). Year-to-date performance in 2025: +2.7%.
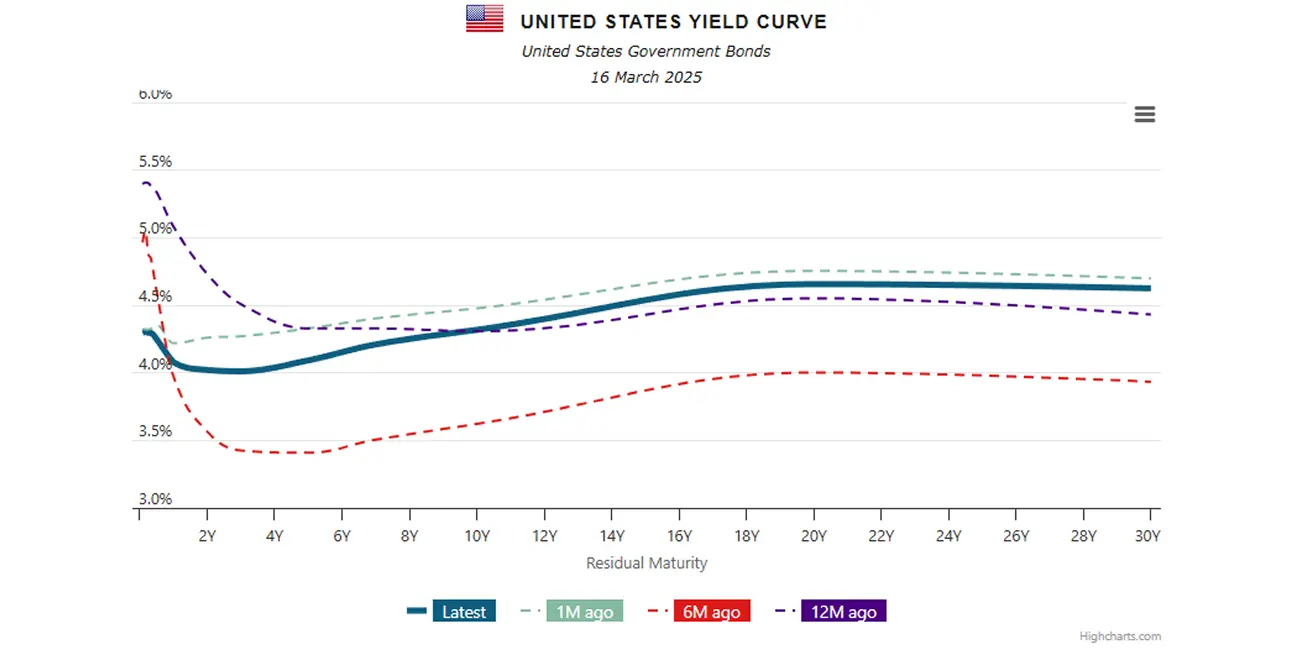
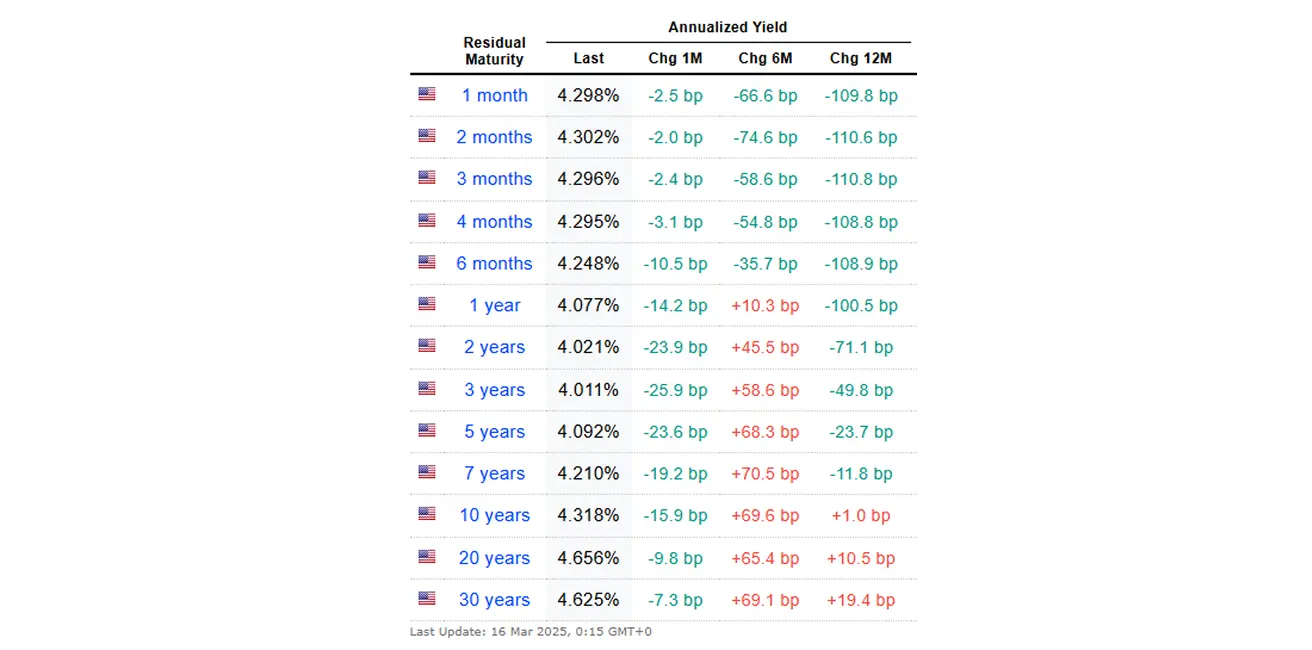
YIELDS AND SPREADS
The yield spread between 10-year and 2-year U.S. Treasury bonds currently stands at 29.7 vs. 31.0 basis points, reflecting the differential between long-term and short-term debt yields.
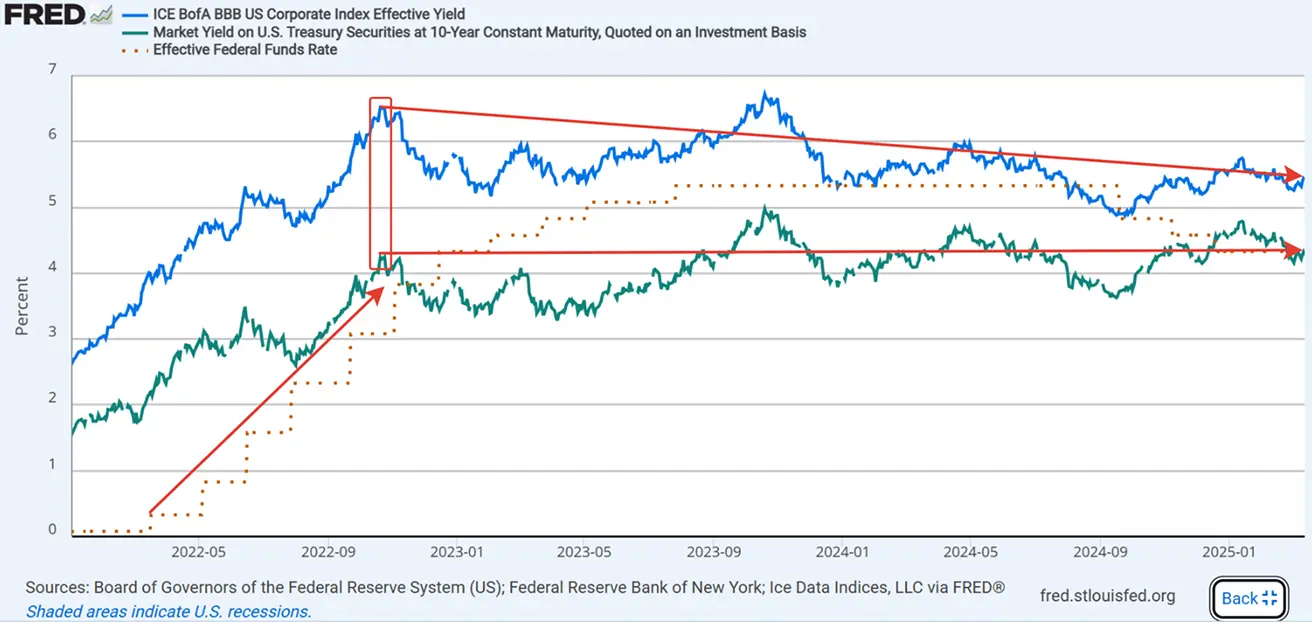
- Market Yield on U.S. Treasury Securities at 10-Year Constant Maturity: 4.318% (vs. 4.193%)
- ICE BofA BBB U.S. Corporate Index Effective Yield: 5.42% (vs. 5.38%)
The spread reflects the market's assessment of risk or the cost of risk relative to the benchmark—the least risky asset.
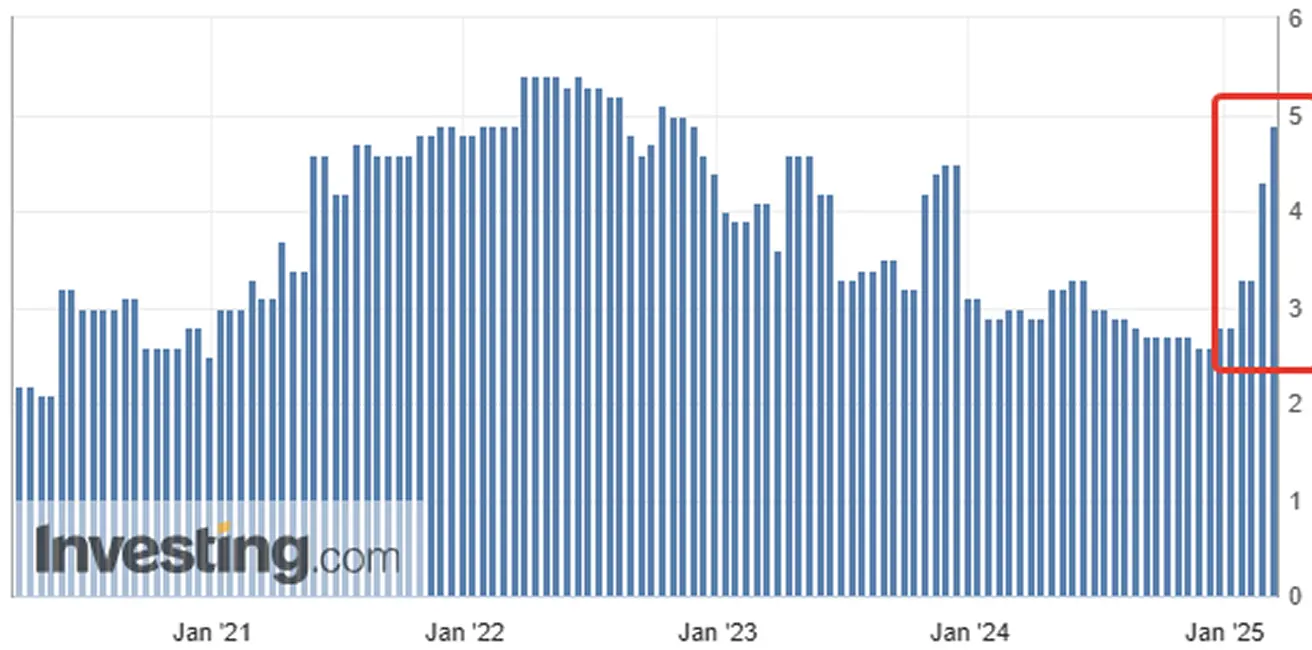
Today, the spread between 10-year Treasuries and BBB-rated corporate bonds stands at 1.15%, marking its lowest since October 2022. At that time (highlighted in the rectangle), the spread peaked at 2.25%, coinciding with the Federal Reserve's aggressive rate hikes of 50 basis points per step.
Since then, the spread has halved and continues to tighten. The yield on the benchmark 10-year Treasuries has remained nearly unchanged (as indicated by the horizontal line), while the borrowing costs for BBB-rated corporate bonds have declined by over 1%.
Moreover, there has been no spread widening since mid-February, when the stock market correction began:
However, as shown in the chart below, yields on BB-rated speculative-grade corporate bonds (red line) have slightly increased, while yields on CCC-rated junk bonds (upper line) have sharply spiked.
Thus, it would be inaccurate to conclude that markets are experiencing a broad-based risk-off scenario when analyzing credit spreads. Instead, we see an exodus from weaker companies while demand remains steady for debt securities of mid-tier credit quality and above. In other words, investors are reallocating into safer assets.
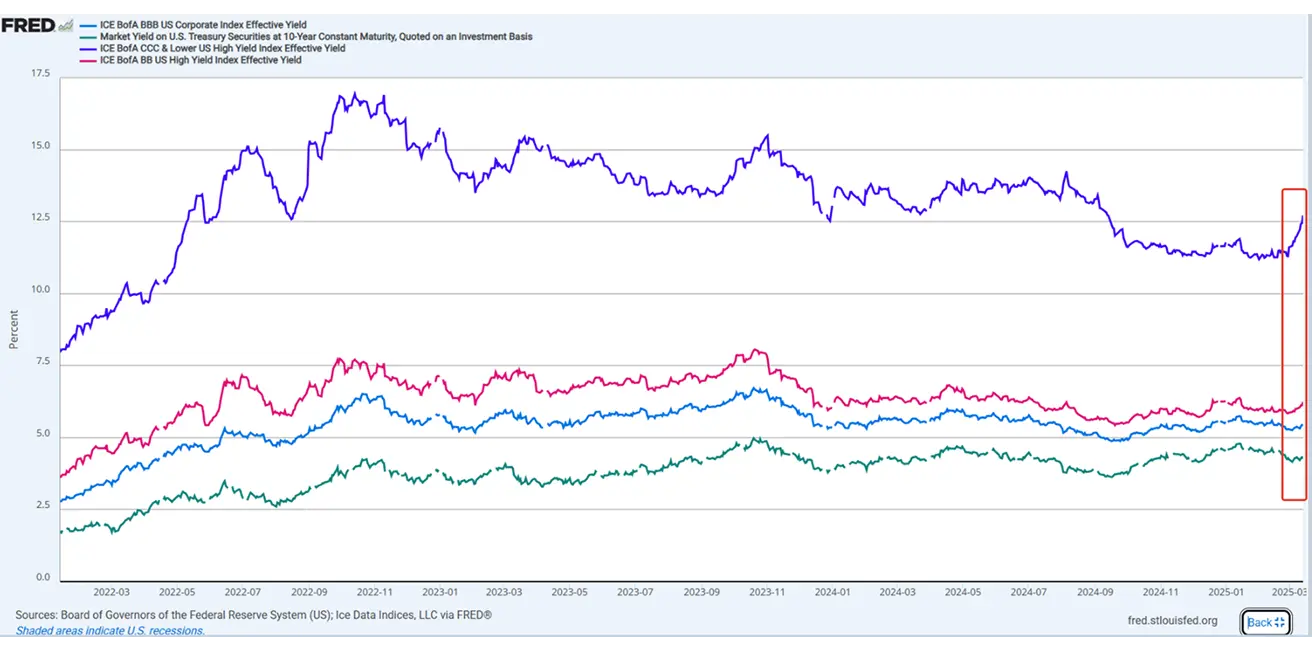
In conclusion, historical trends suggest that if BB/CCC spreads continue to widen while BBB spreads keep tightening, this typically signals a localized stock market correction rather than a broader panic in the credit market. The Friday rebound in equity indices may indicate that the correction has found a bottom and that the market could start recovering from this pullback. However, the overall sentiment remains negative. Long-term tariff risks and inflationary pressures persist, posing potential headwinds for equities. Additionally, with the Federal Reserve meeting on Wednesday, any hawkish shift in Powell's rhetoric could trigger further declines. Meanwhile, Goldman Sachs, Citigroup, and HSBC have lowered their outlooks on equity markets, downgrading their previous "overweight" (bullish) ratings to "neutral." On the other hand, Citigroup upgraded China to "overweight," signaling a buy recommendation.
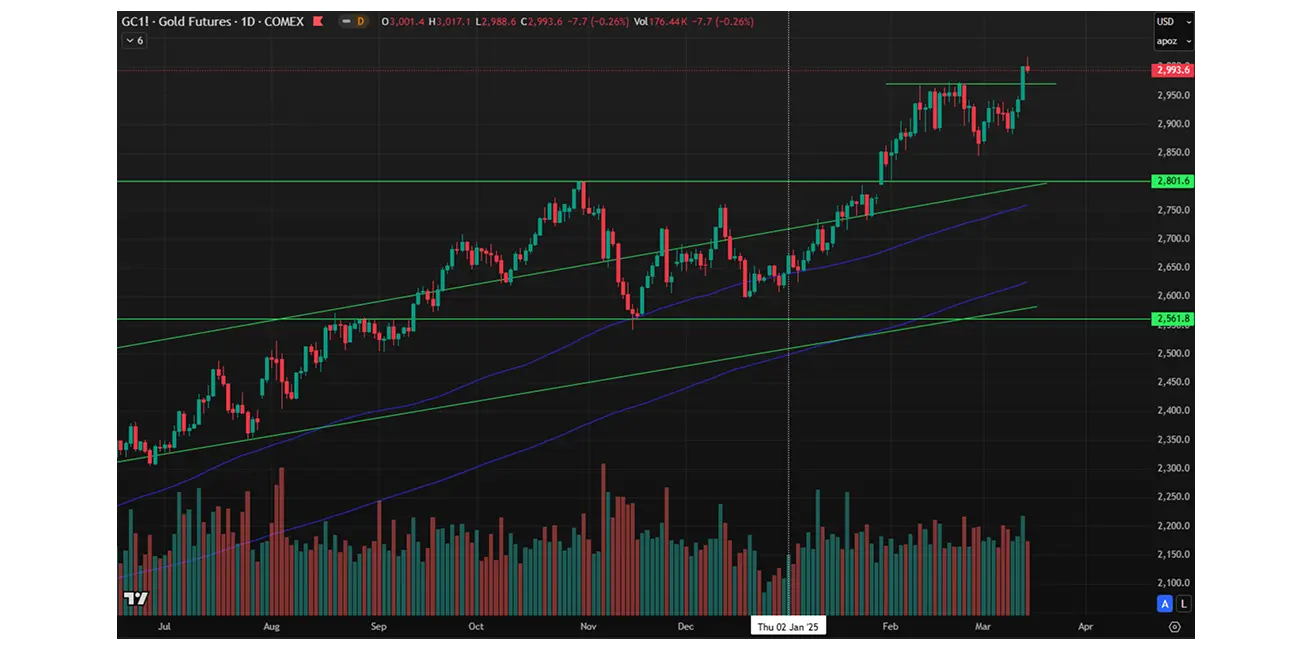
GOLD FUTURES (GC)
Gold futures: +2.6%, weekly close at $2,993.6 per troy ounce. Year-to-date 2025: +13.35%.
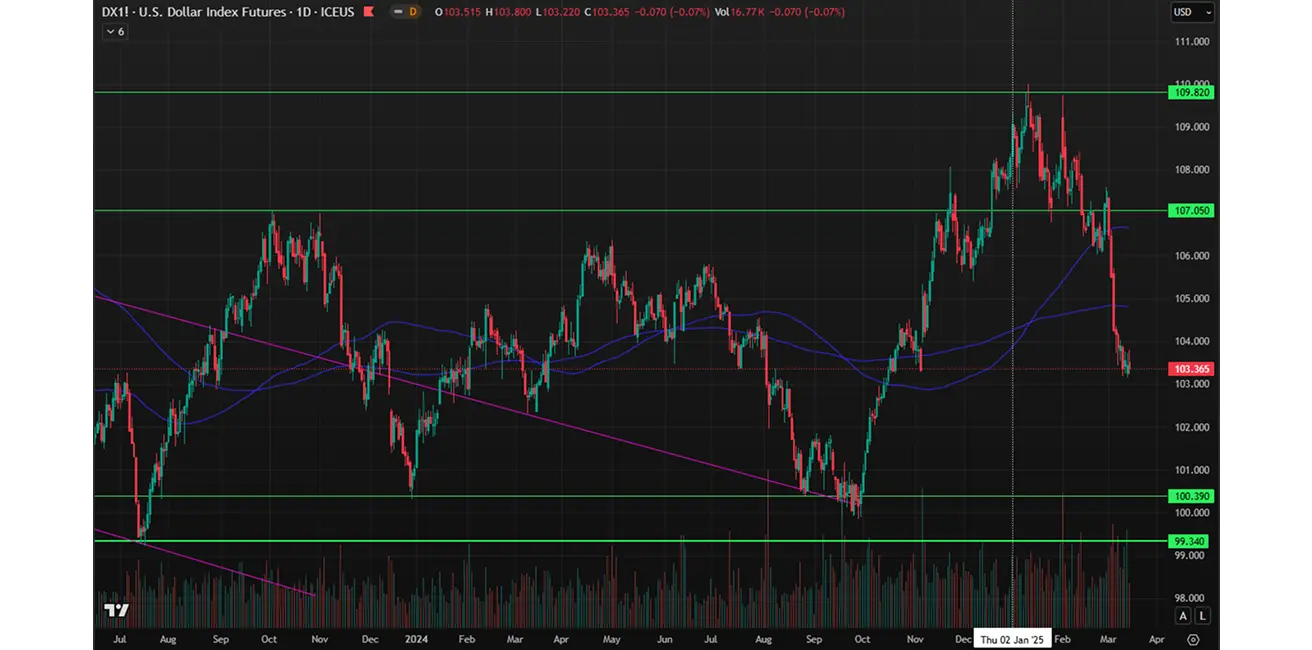
DOLLAR INDEX FUTURES (DX)
U.S. Dollar Index futures (DX): -0.47%, weekly close at 103.365.
Year-to-date 2025: -4.58%.
OIL FUTURES
Weekly performance: +0.21%, closing at $67.19 per barrel.
Year-to-date performance: -6.49%.
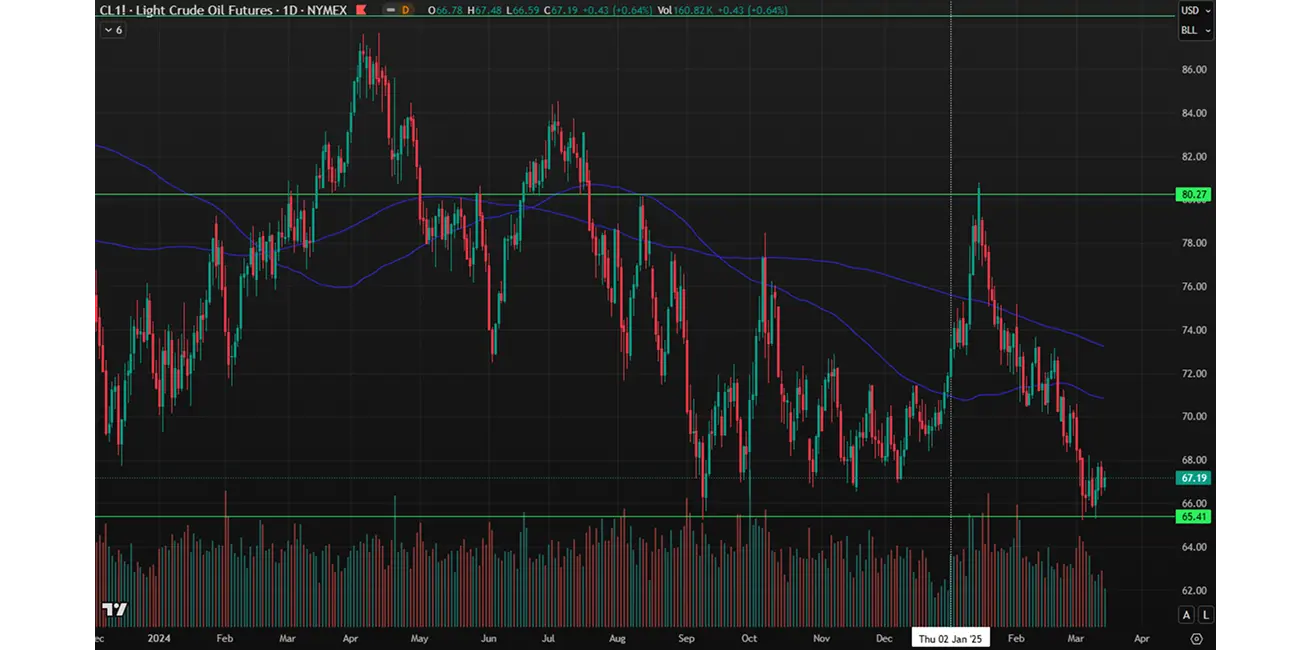
OPEC Monthly Report: Global demand estimates for 2025-2026 remain unchanged:
- 2025: 105.2 million bpd (+1.45 million bpd)
- 2026: 106.63 million bpd (+1.43 million bpd) Full report
IEA Oil Market Report – March 2025: Global oil demand growth is expected to accelerate to just over 1 million bpd this year, up from 830,000 bpd in 2024, reaching 103.9 million bpd. Global oil supply could exceed demand by approximately 600,000 bpd this year. If OPEC+ extends the rollback of production cuts beyond April without restraining supply from members exceeding their quotas, an additional 400,000 bpd could enter the market. The scale and scope of tariffs remain uncertain, and given the ongoing trade negotiations, it is still too early to assess their impact on market outlooks. Full report
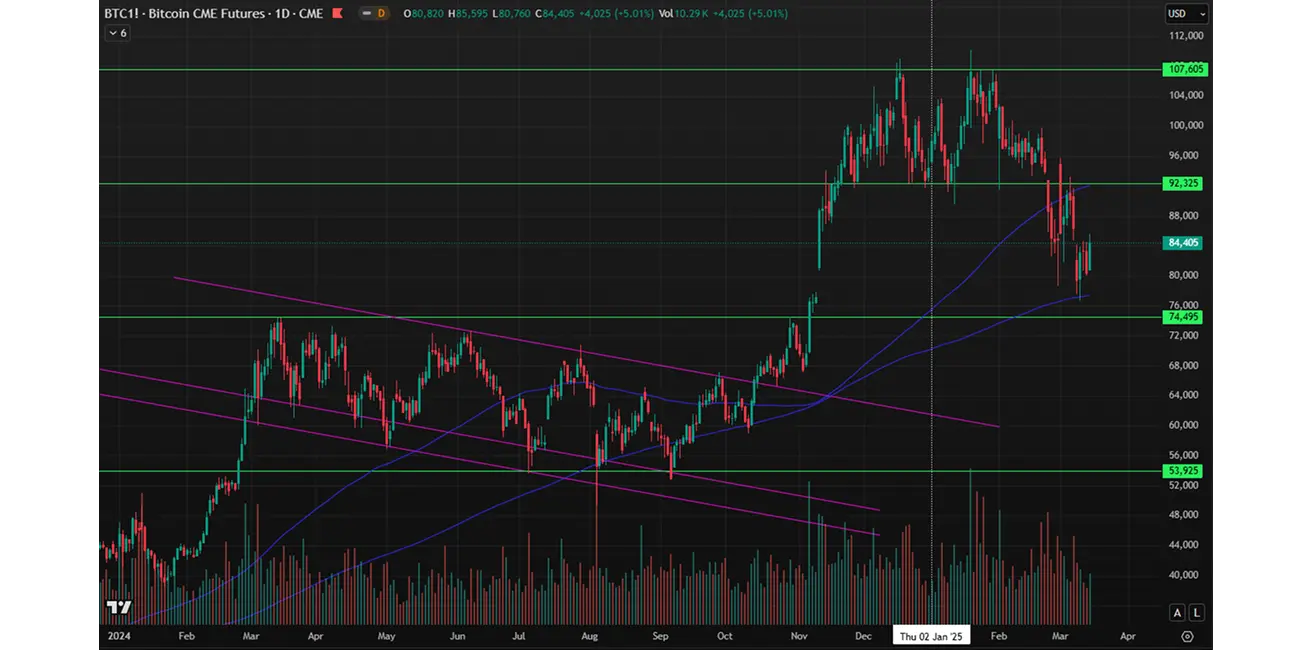
BTC FUTURES
Weekly performance: -2.34% ($84 405). Year-to-date performance in 2025: -11.40%.
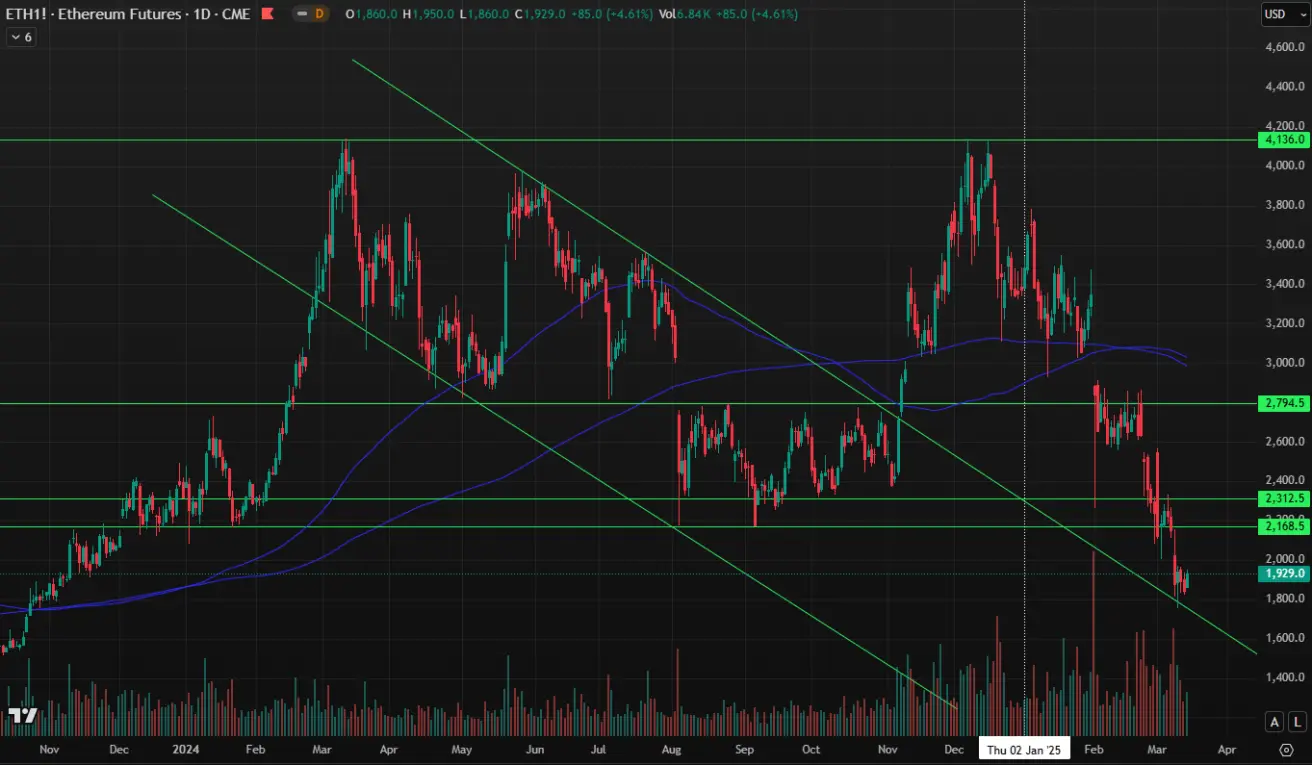
ETH FUTURES
Weekly performance: -10.32% ($1 929).
Year-to-date performance in 2025: -43.00%.
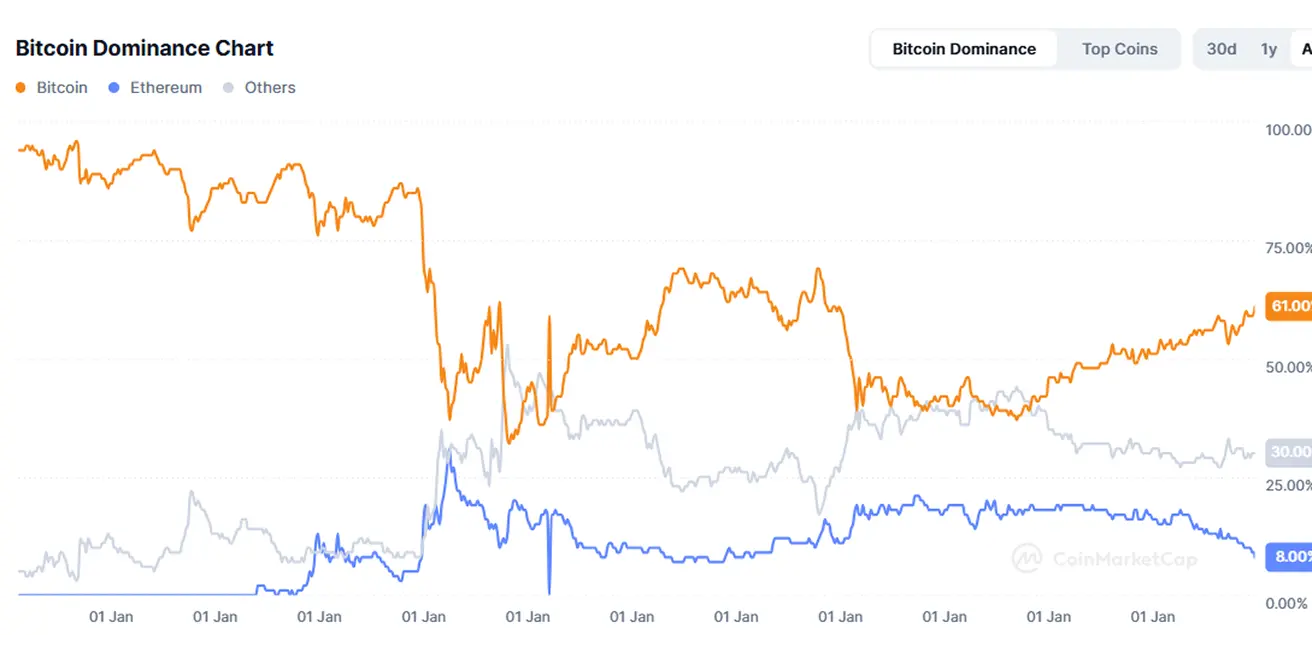
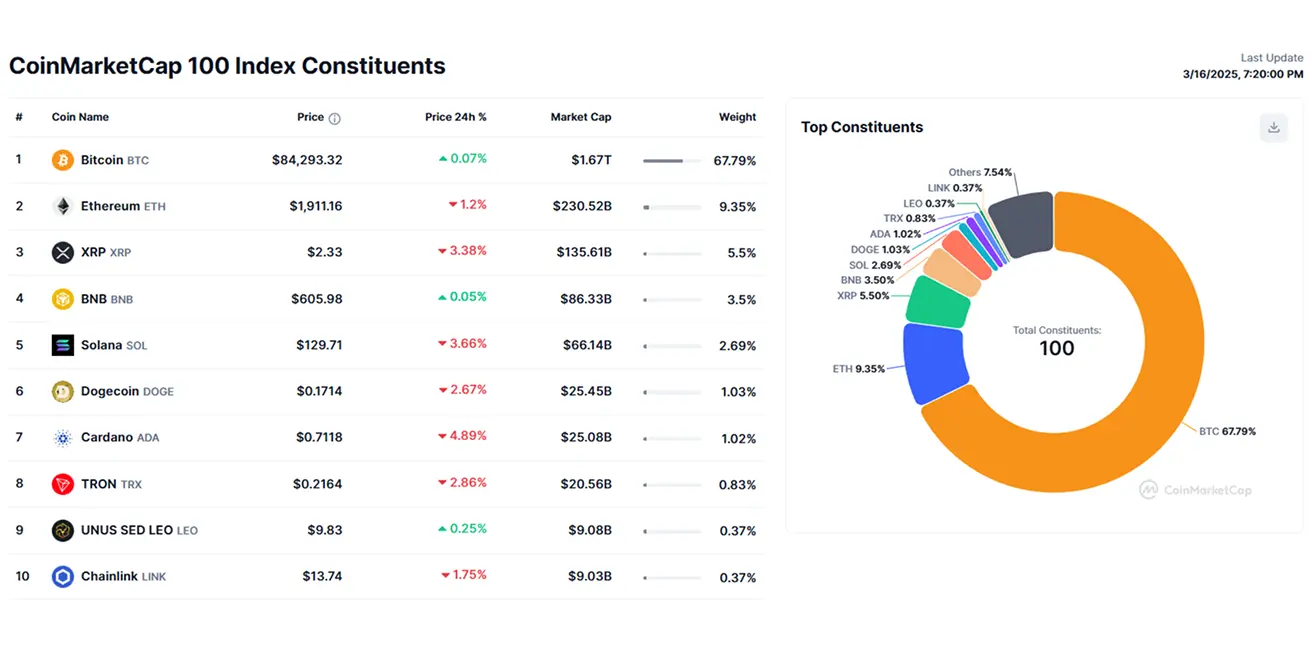
Crypto Market Capitalization: $2.74 trillion ($2.66 trillion a week ago) (Source: CoinMarketCap)
- Bitcoin dominance: 61.0% (61.0%)
- Ethereum dominance: 8.4% (8.7%)
- Other cryptocurrencies: 30.6% (30.2%)
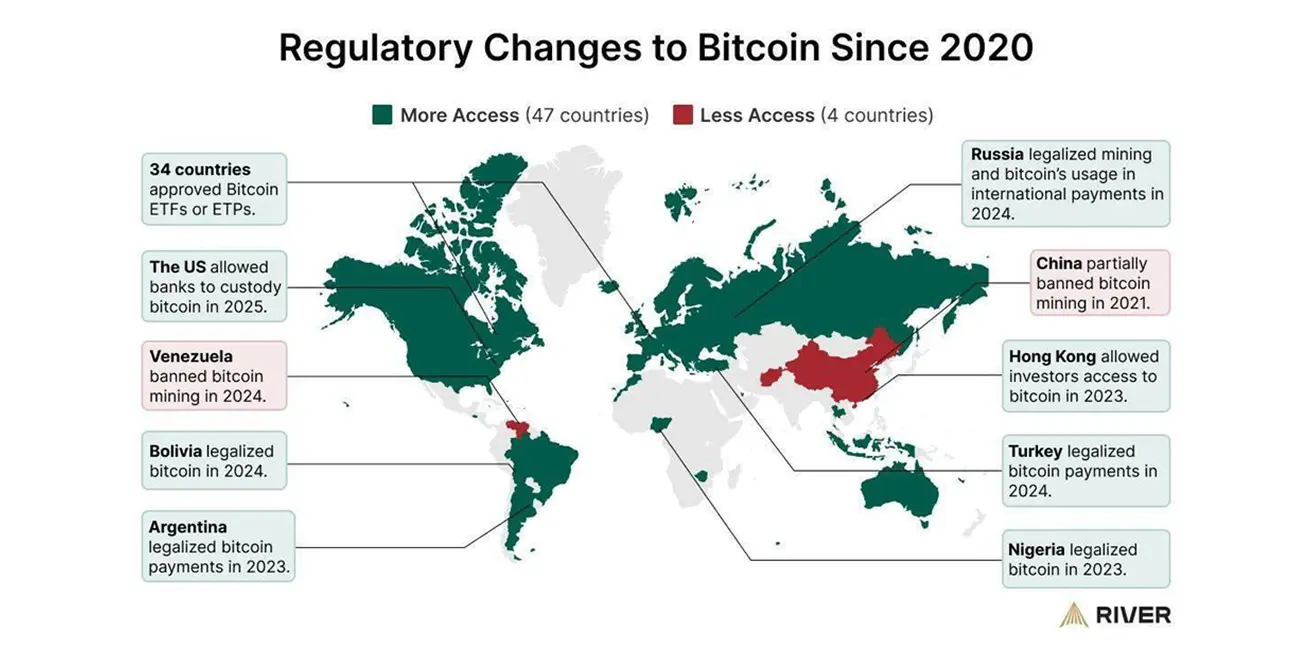
News: The Office of the Comptroller of the Currency (OCC) has announced that U.S. banks are now permitted to:
- Act as validators in public blockchain networks
- Custody cryptocurrencies on behalf of clients
- Hold stablecoins on their balance sheets
Since 2020, 47 countries have eased or simplified cryptocurrency regulations, while four countries have tightened restrictions or completely banned cryptocurrency and mining.