Lietuvių
 Русский
 Қазақша
 Eesti
EestiOctober 06–10, 2025: Weekly economic update
Key market updates

Macroeconomic Statistics
INFLATION
- Core Consumer Price Index (CPI) (m/m) (August): 0,3% (previous: 0.3%)
- Consumer Price Index (CPI) (m/m) (August): 0.4% (previous: 0.2%)
- Core Consumer Price Index (CPI) (y/y) (August): 3.1% (previous: 2.9%)
- Consumer Price Index (CPI) (y/y) (August): 2.9% (previous: 2.7%)
INFLATION EXPECTATIONS (MICHIGAN)
- 12-month expected inflation (August): 4.6% (prev: 4.7%)
- 5-year expected inflation (August): 3.7% (prev: 3.7%)
PRODUCER PRICE INDEX (PPI)
- PPI (m/m) (August): -0.1%, prev: 0.7%
- Core PPI (m/m) (August): -0.1%, prev: 0.7%
GDP (U.S. Bureau of Economic Analysis, BEA) (Q2 2025, annualized, second estimate): +3.8% (advance estimate: 3.30%; Q1 2024: – 0.5%)
Business Activity Index (PMI):
(Above 50 indicates expansion; below 50 indicates contraction)
- Services sector (August): 54.2 (previous: 54.5)
- Manufacturing sector (July): 52.0 (previous: 53,0)
- S&P Global Composite (August): 53.9 (previous: 53.6)
LABOR MARKET:
- Unemployment rate (August): 4.3% (previous: 4.2%)
- Total number of individuals receiving unemployment benefits in the US: 1,926K (vs 1,920K).
- Change in nonfarm payrolls (August): 22K (previously revised: 79K)
- Change in U.S. private nonfarm payrolls (August): 38K (previous: 77K)
- Average hourly earnings (August, y/y): +3.7% (previous: +3.9%)
- JOLTS job openings (August): 7.227M (vs. 7.181M)
- ADP Nonfarm Payroll Change (Submitted): -32К (vs-3К)
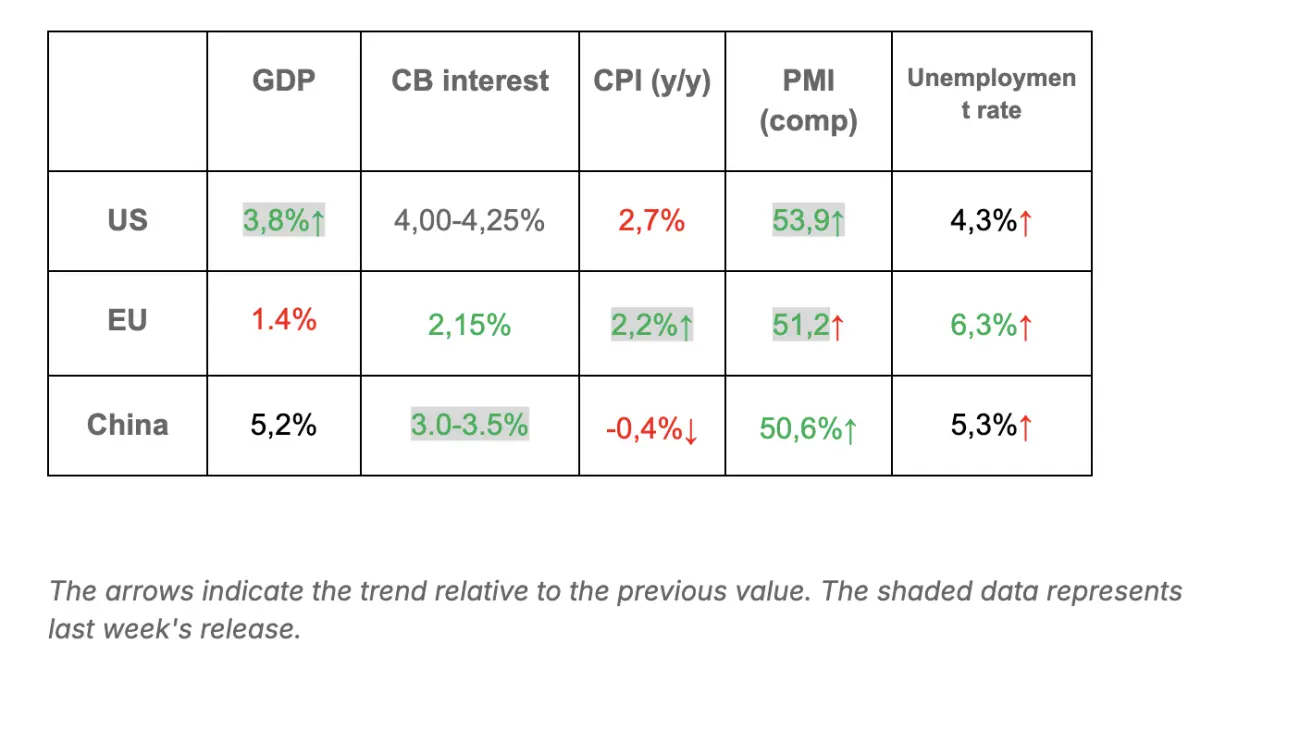
Summary of Key Macro Data: USA, EU, and China*
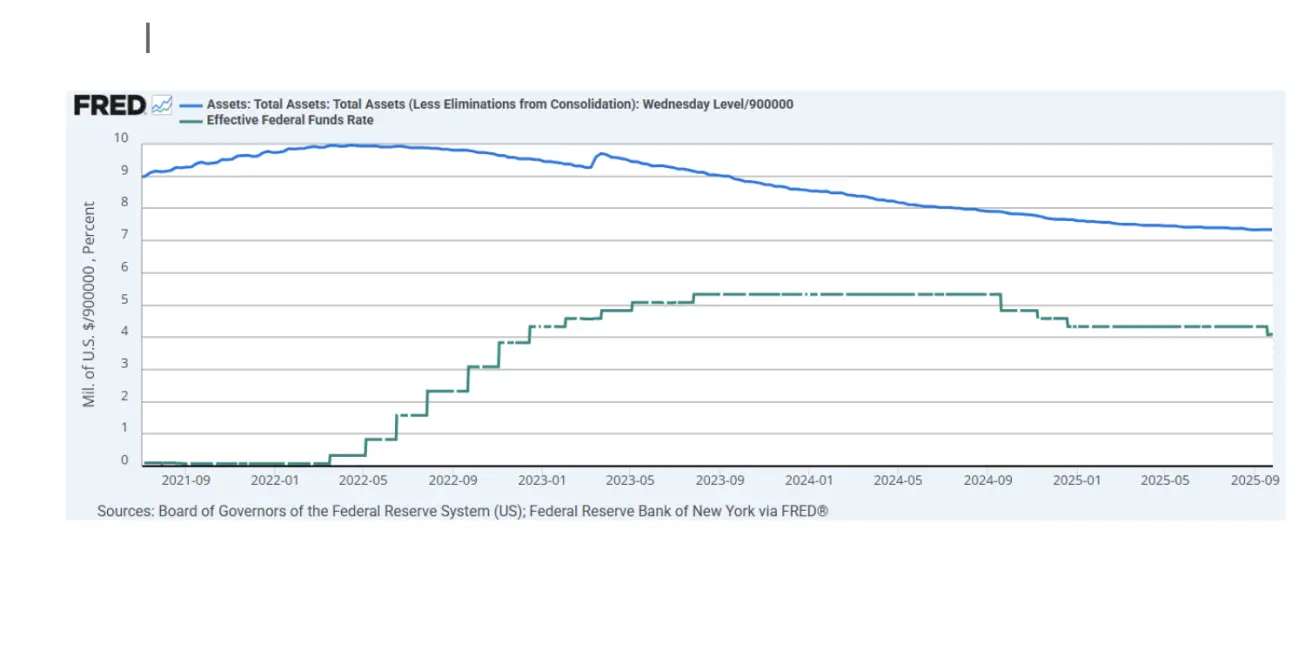
MONETARY POLICY
- Federal Funds Effective Rate (EFFR): 4.00% - 4.25% (unchanged)
- Federal Reserve balance sheet increased: $6,590T (vs. previous week: $6,587T)
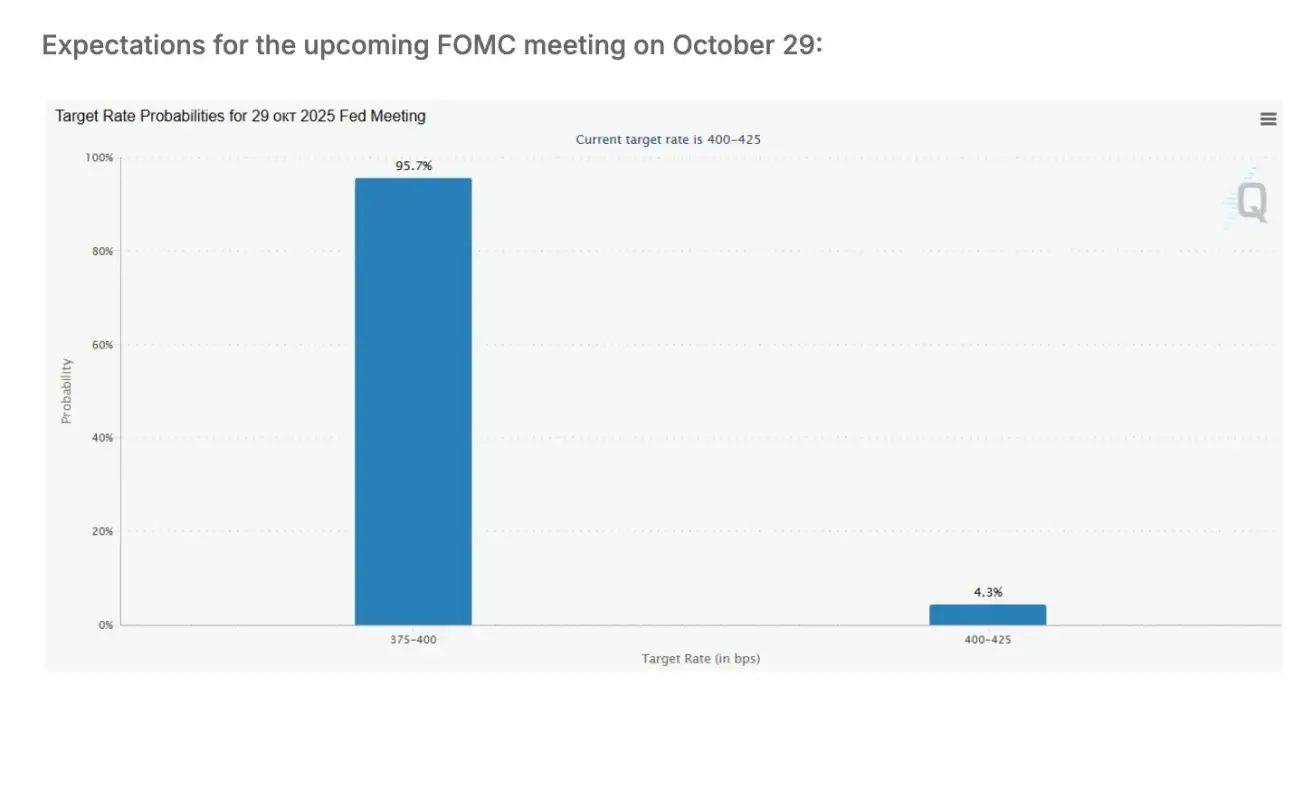
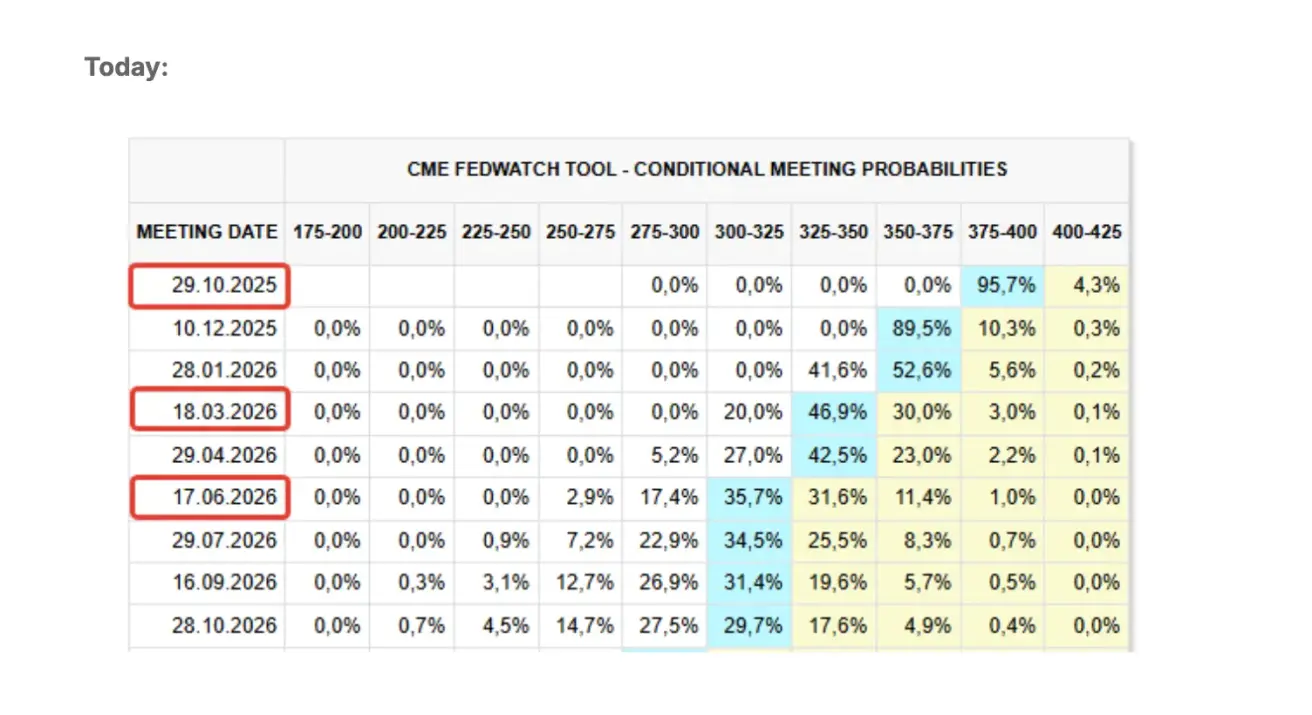
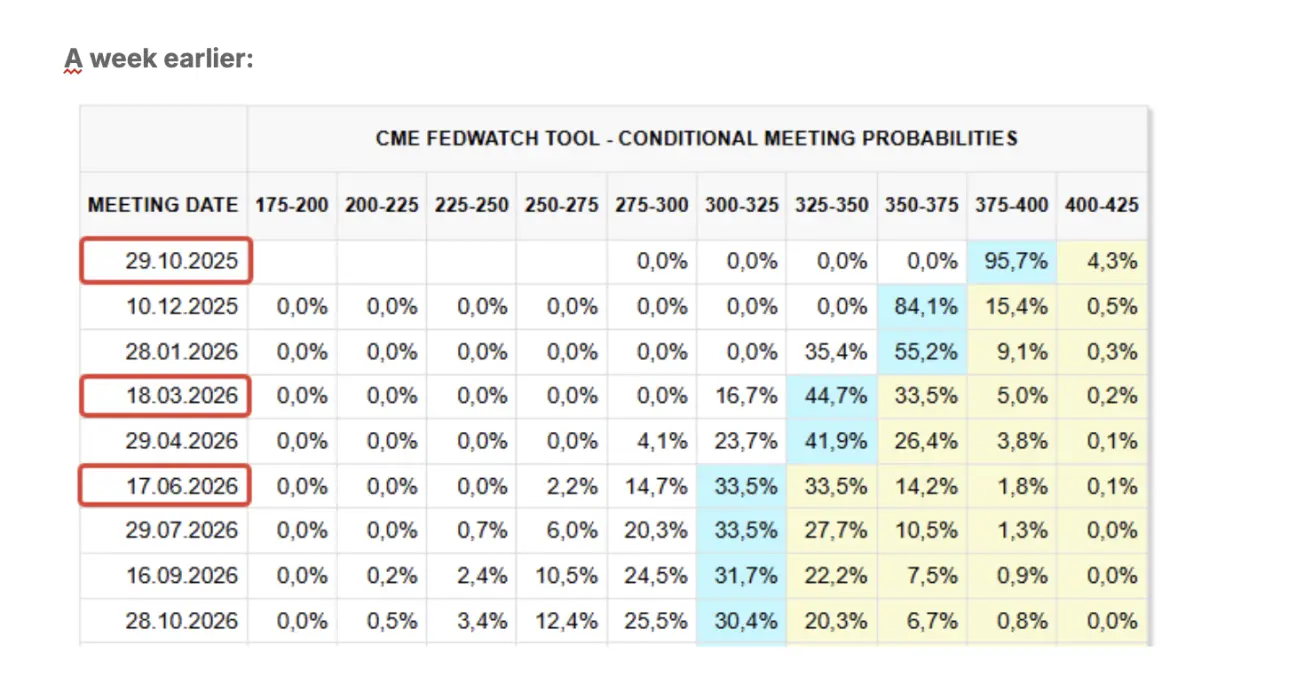
MARKET FORECAST FOR RATE (FEDWATCH)
Commentary
Last week, risk-on sentiment dominated the U.S. equity market through Thursday. Major indices hit fresh all-time highs, supported by strong gains in AI-related tech stocks and semiconductor manufacturers. AMD shares surged as much as 11% intraday after investors reacted positively to its newly announced partnership with OpenAI. CEO Jensen Huang noted that demand for computing power has increased substantially this year.
But on Friday, global equity markets sold off sharply amid a renewed escalation of Trade War 2.0. Earlier in the week, China expanded its export restrictions on rare earth metals—its primary leverage in trade negotiations with the U.S. Beijing controls over 70% of the global supply. Under the new rules, foreign exporters must now obtain a license from China’s Ministry of Commerce.
Starting October 14, China will impose a fee of 400 yuan per net ton on U.S. vessels docking at its ports, rising annually to 1,120 yuan by 2028. Beijing frames this as a reciprocal response to similar U.S. measures and argues that Washington’s actions violate international trade norms.
These restrictions were introduced ahead of the highly anticipated Xi–Trump meeting set to take place at the APEC summit in South Korea in two weeks. Initial U.S. tariffs against China were postponed until November 9, and markets had been expecting potential progress during that meeting.
In retaliation for China’s rare earth curbs, Trump announced that starting November 1, the U.S. would introduce an additional 100% tariff on all Chinese imports, on top of the existing duties. The U.S. will also impose export controls on any critical software. On Friday, Trump wrote on X (Twitter) that he saw “no point” in meeting with Xi.
This rhetoric triggered a risk-off shift across markets.
However, on Sunday, Trump posted again: “Don’t worry about China, everything will be fine! Chairman Xi doesn’t want a depression for his country, and neither do I. The U.S. wants to help China, not hurt it. I will attend the meeting and hope it takes place.” Markets interpreted this tone more positively, viewing it as a potential de-escalation. As a result, equity indices have started to rebound today, gaining more than 2%.
Factors That Could Support Equities
-
Resolution of the government shutdown
-
A constructive outcome from the Xi–Trump meeting
-
A Fed rate cut on October 29
If trade tensions continue to escalate, markets will undoubtedly move lower. But judging by today’s reaction, sentiment remains cautiously optimistic. The rhetoric may stay just that—rhetoric. Much, however, will depend on Beijing’s next steps.
New York Fed Survey Highlights
-
Household inflation expectations rose in the short term (to 3.4%) and long term (to 3.0%), while remaining unchanged in the medium term (3.0%).
-
Despite a slight uptick in expected employment growth, broader labor market sentiment continued to deteriorate: respondents reported weaker income growth expectations, higher perceived risk of job loss, and a greater likelihood of rising overall unemployment.
Market Expectations — FedWatch:
-
Next FOMC meeting (29 October): the implied probability of a 0,25 bps rate cut is 95.7%, indicating one reduction by year-end.
-
Next 12 months: markets are pricing in three 0,25 bps cuts, bringing the target range to 3.00–3.25%.
MARKET
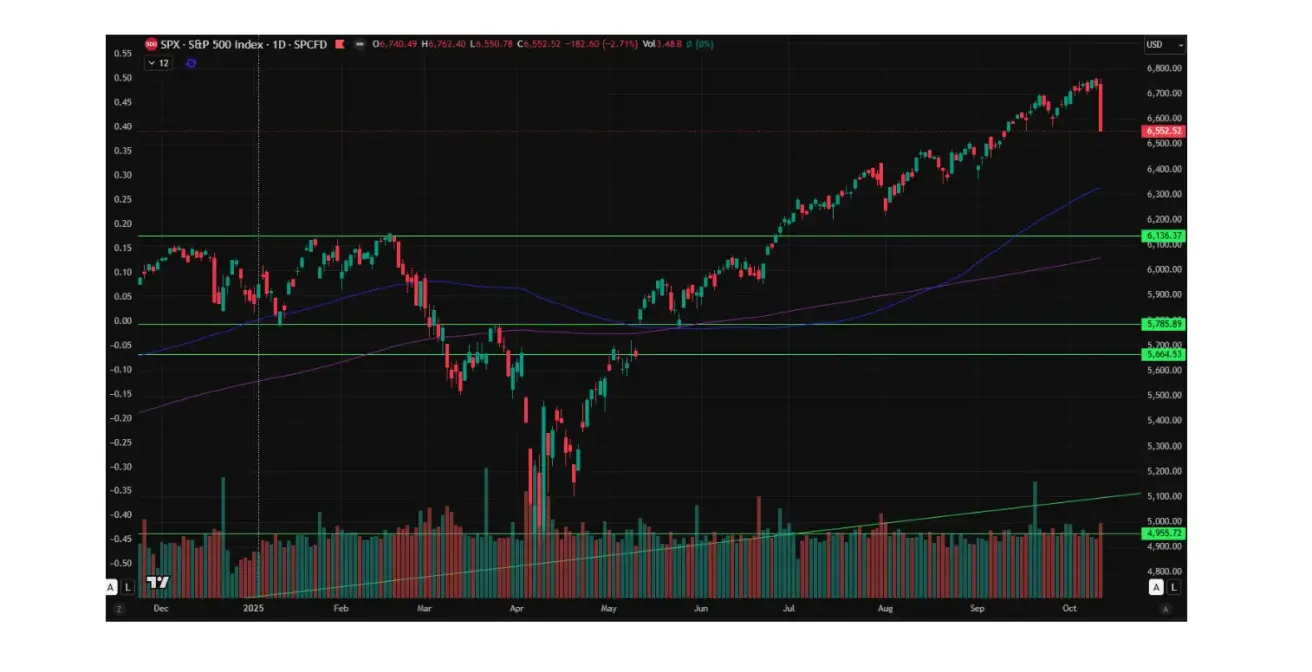
SP500
The S&P 500 index ended the week down -2,43%, closing at 6552,52. Year to date, the index is up +11.00%.
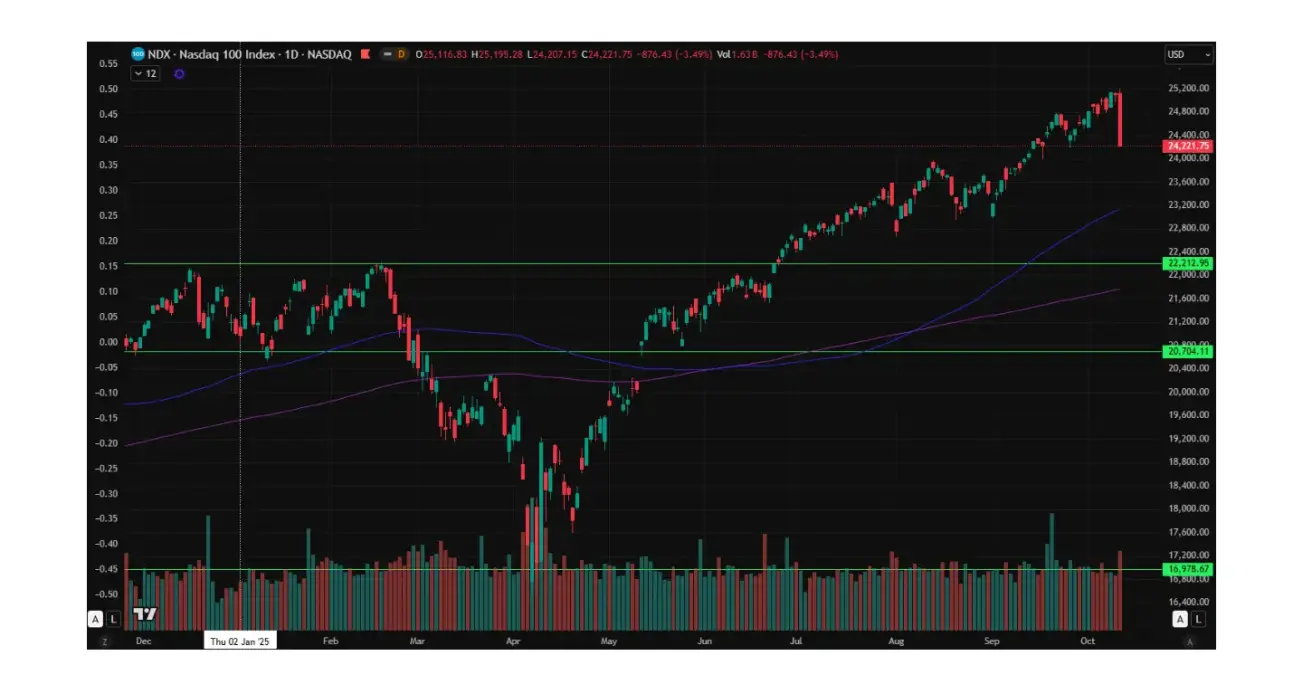
NASDAQ100
The Nasdaq 100 ended the week down -2,27%, closing at 24221. Year to date, the index is up +14.66%.
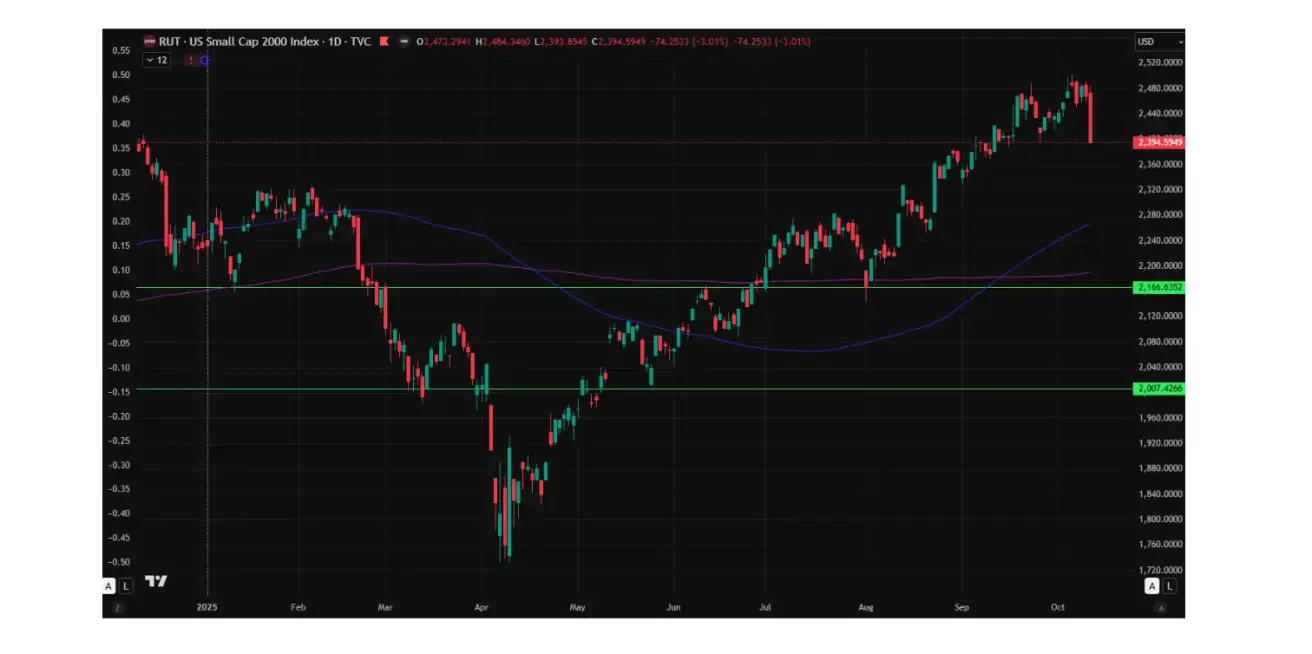
Russel 2000
Russel 2000 ended the week down -3,29, closing at 2394,59. Year to date, the index is up 6,84%.
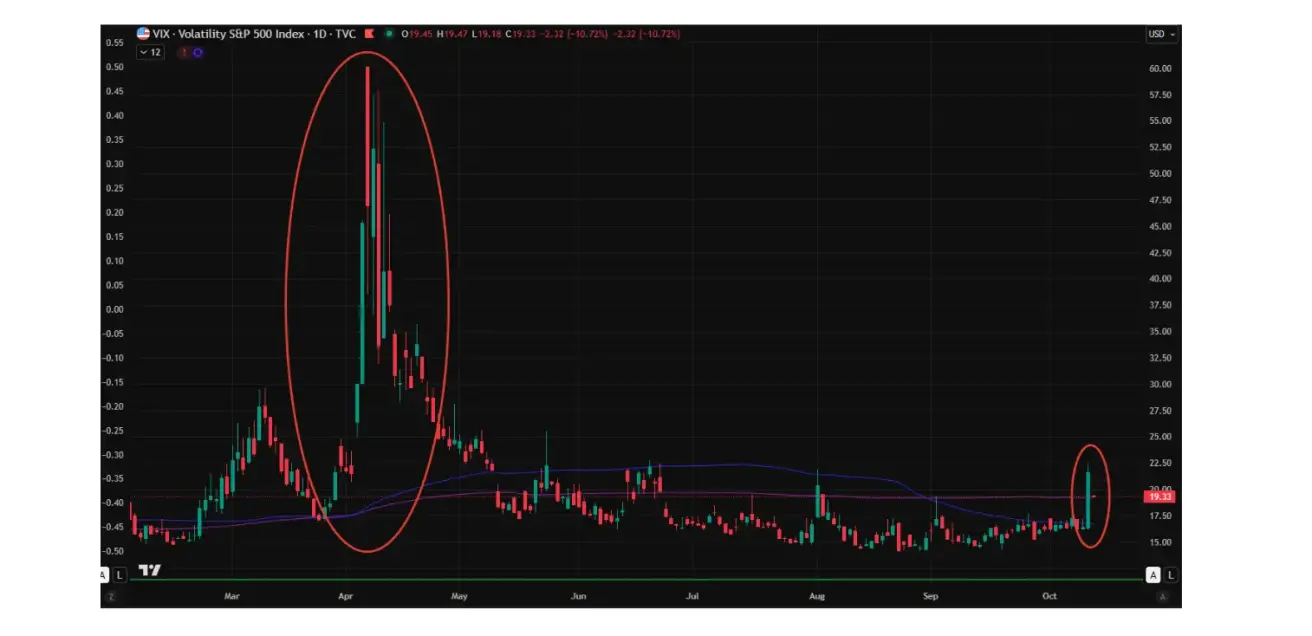
VIX
The market’s reaction was clearly reflected in volatility metrics: VIX spiked 32% on Friday alone. For comparison, the previous wave of trade war escalation back in April had sent the index soaring by as much as 237%.
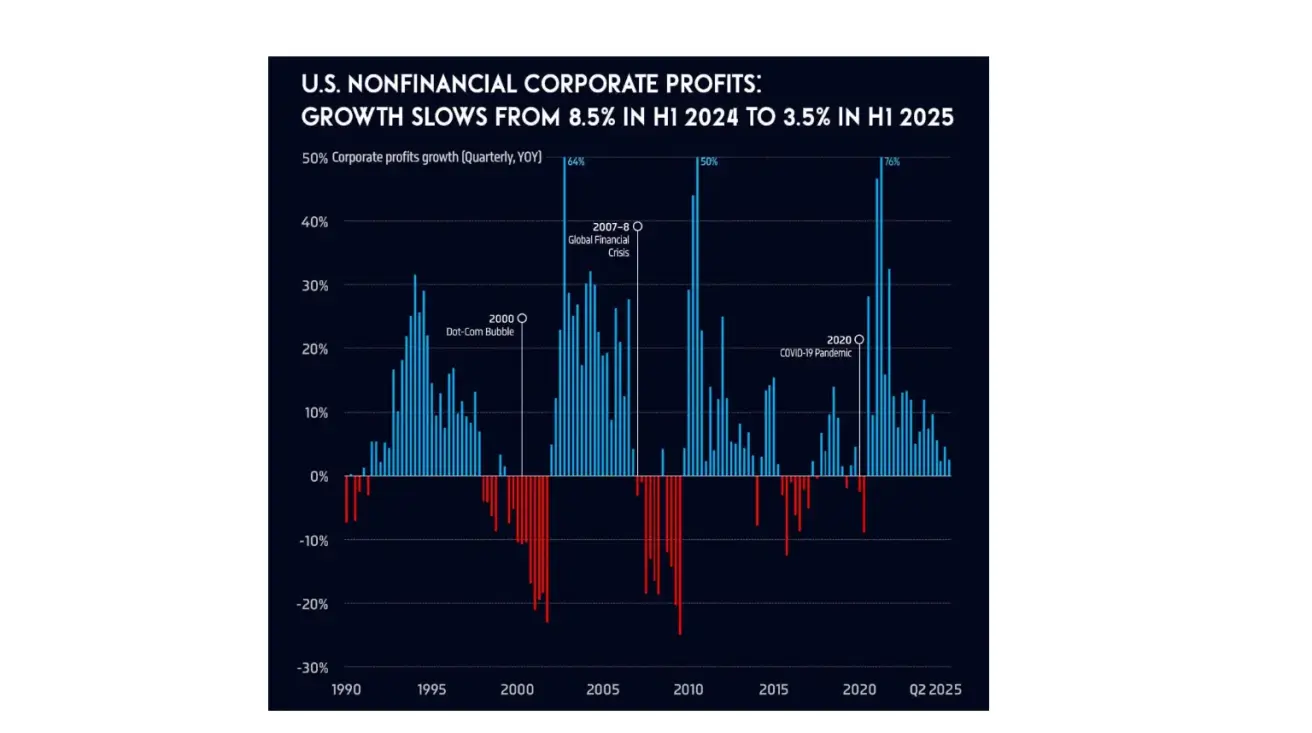
Earnings season for Q3 kicks off on Tuesday. Profit growth among U.S. non-financial corporations is expected to slow — from 8.5% in the first half of 2024 to just 3.5% in the first half of 2025.
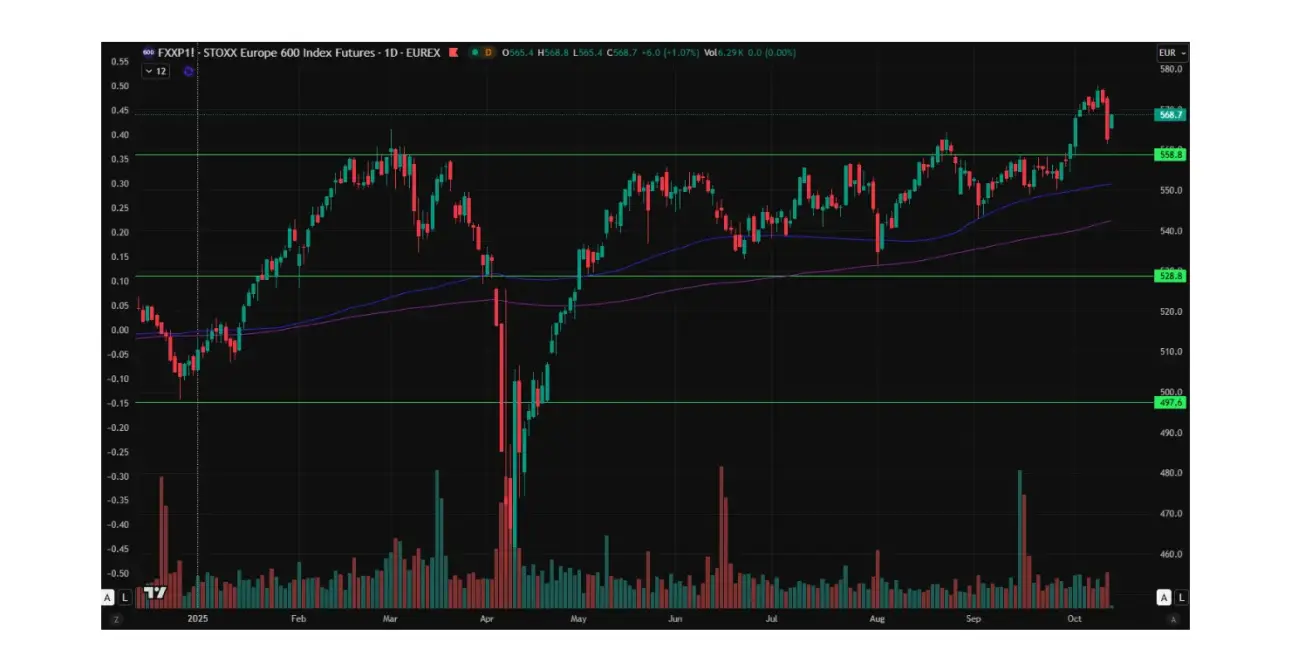
Euro Stoxx 600
The Euro Stoxx 600 ended the week down -1,59%, closing at 562,7. Year to date, the index is up +11.29%.
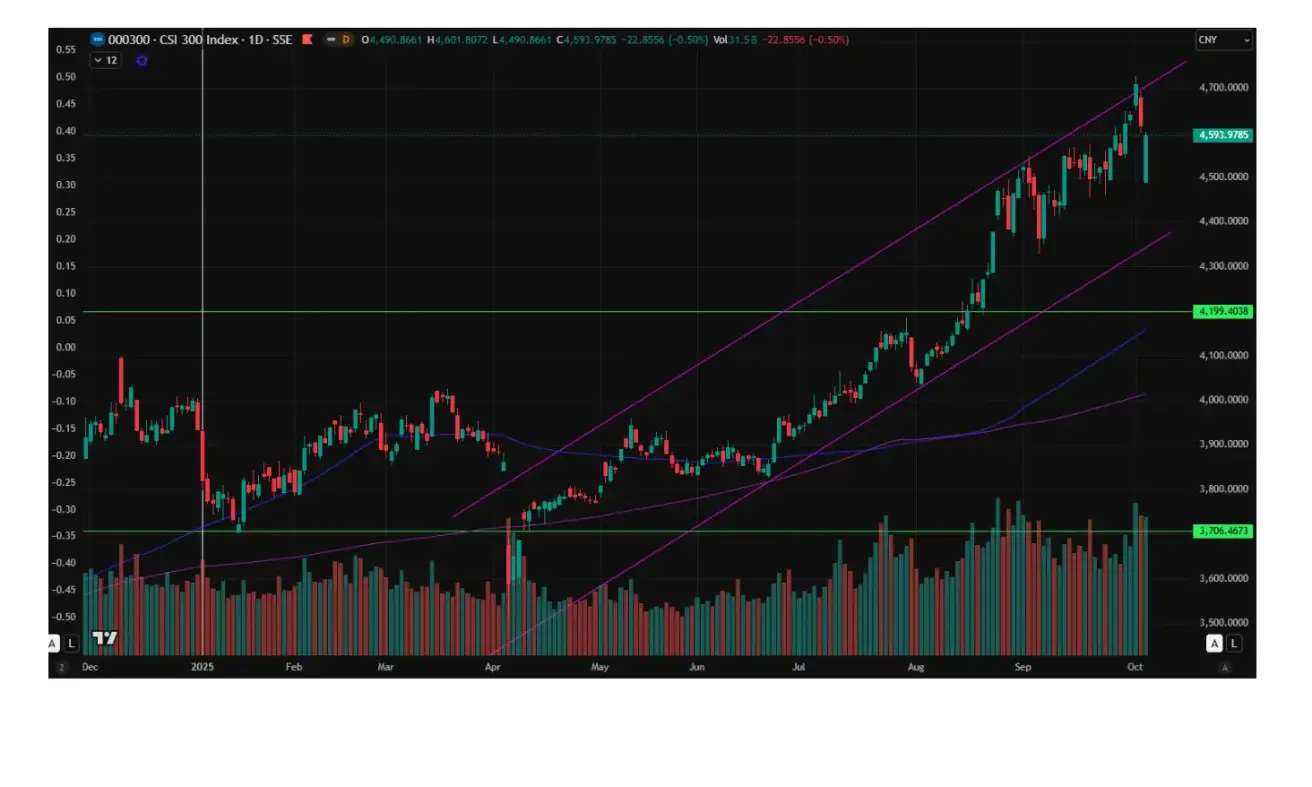
CSI 300 Index
The CSI 300 Index closed the week at 4616,83, down 0.51%, with a year-to-date gain of 17.45%.
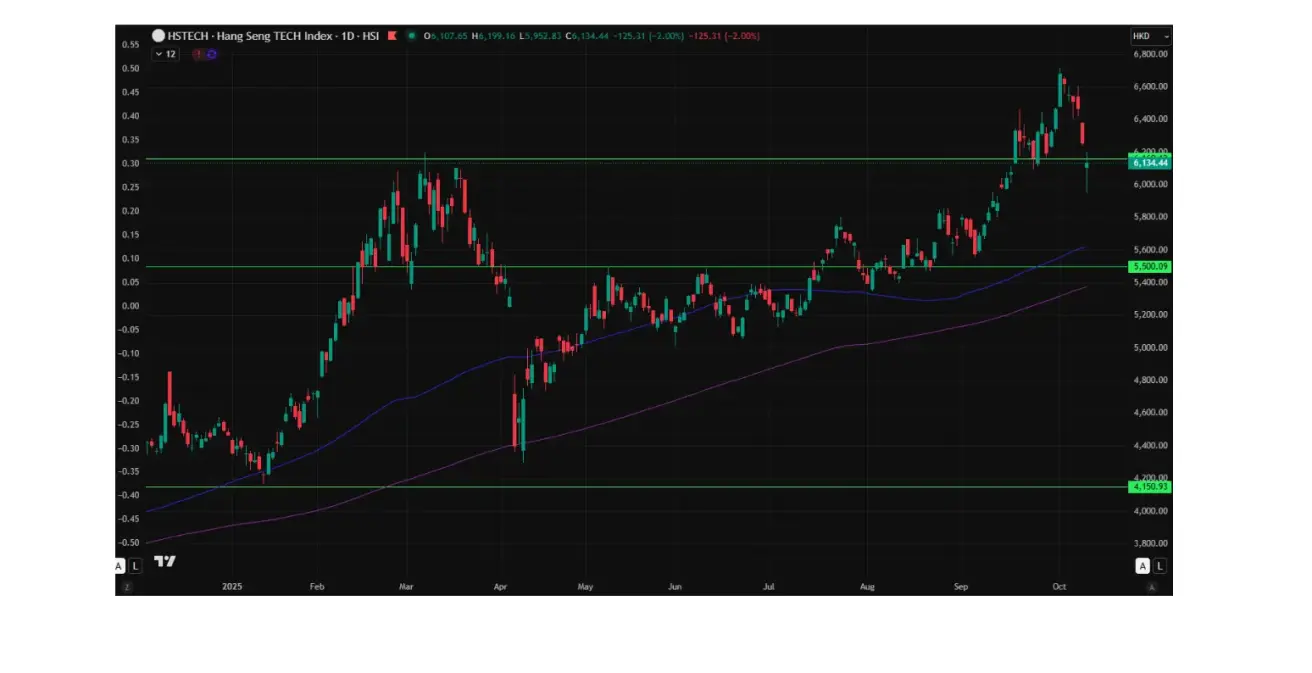
Hang Seng TECH Index (HSTECH.HK)
The Hang Seng TECH Index (HSTECH.HK) opened Monday down 5.48%, at 6259,75. Year to date, the index has advanced +41.09%.
National Bank of Kazakhstan
-
Due to actual inflation significantly exceeding previous forecasts, the Monetary Policy Committee decided to raise the base rate by 150 basis points to 18%, with a corridor of ±1 percentage point.
-
Inflation has accelerated across all key metrics. Annual inflation reached 12.9% in September (vs. 12.2% in August), exceeding the central bank’s projections. The food component remains the main driver, rising 12.7% year-on-year. Certain food categories are becoming more expensive at an even faster pace, largely due to rising production costs and higher import prices.
-
Inflation expectations among households over a 12-month horizon remain elevated and volatile, with a high degree of uncertainty. Market professionals have also revised their inflation forecasts upward—from 11.3% to 12% for the current year.
-
Pro-inflationary risks are primarily domestic, stemming from persistently strong internal demand, second-round effects linked to tariff reforms and fuel market liberalization, as well as the inflationary impact of tax changes, including VAT adjustments.
-
Economic growth accelerated to 6.5% year-on-year in January–August 2025 (vs. 3.7% in the same period of 2024). The strongest contributions came from transport and warehousing (+21.5%), construction (+18.1%), trade (+8.9%), as well as mining (+9.6%) and manufacturing (+6.5%).
-
The central bank noted that if the current level of monetary tightening proves insufficient to stabilize inflation, further policy tightening will be considered.
Kazakhstan Stock Exchange Index (KASE) ended the week up +0.14%.
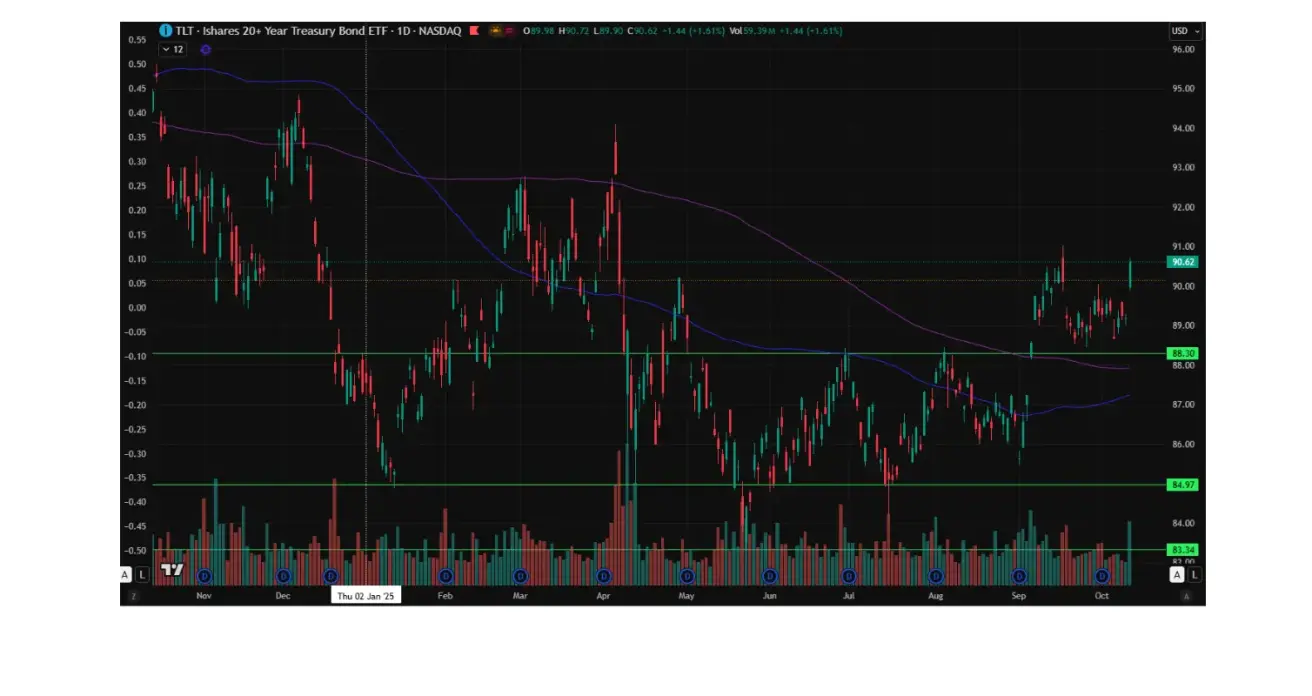
BOND MARKET
The 20+ Year U.S. Treasury Bond ETF (TLT) ended the week up +1,39%, closing at 90,62. Year to date, the index is up +3.21%.
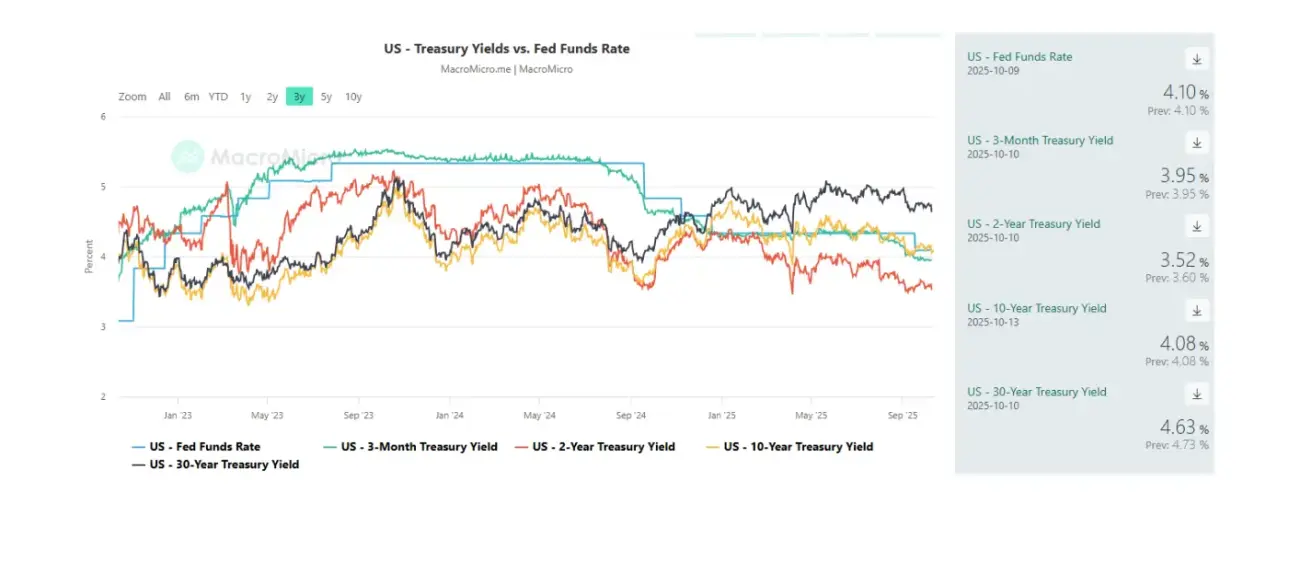
YIELDS AND SPREADS
-
Market yield on U.S. Treasury securities (10-year constant maturity): 4.08% (vs. 4.15%).
-
ICE BofA BBB U.S. Corporate Index effective yield: 5.01% (vs. 4.95%).
-
Yield spread — 10-year vs. 2-year Treasuries: 57.0 bps (vs. 53.0 bps).
-
Yield spread — 10-year vs. 3-month Treasuries: 19.0 bps (vs. 19.0 bps).
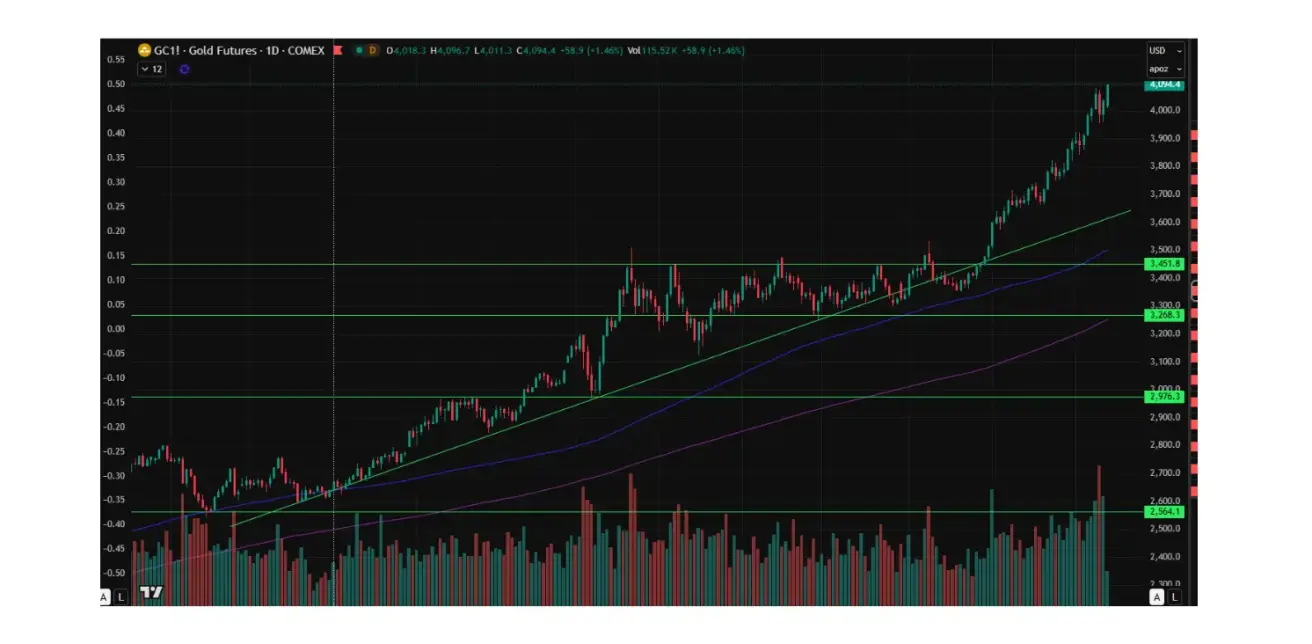
GOLD FUTURES (GC)
The gold futures (GC) contract ended the week up 3.15%, closing at $4035,5 per troy ounce. Year to date, it has gained +52.80%.
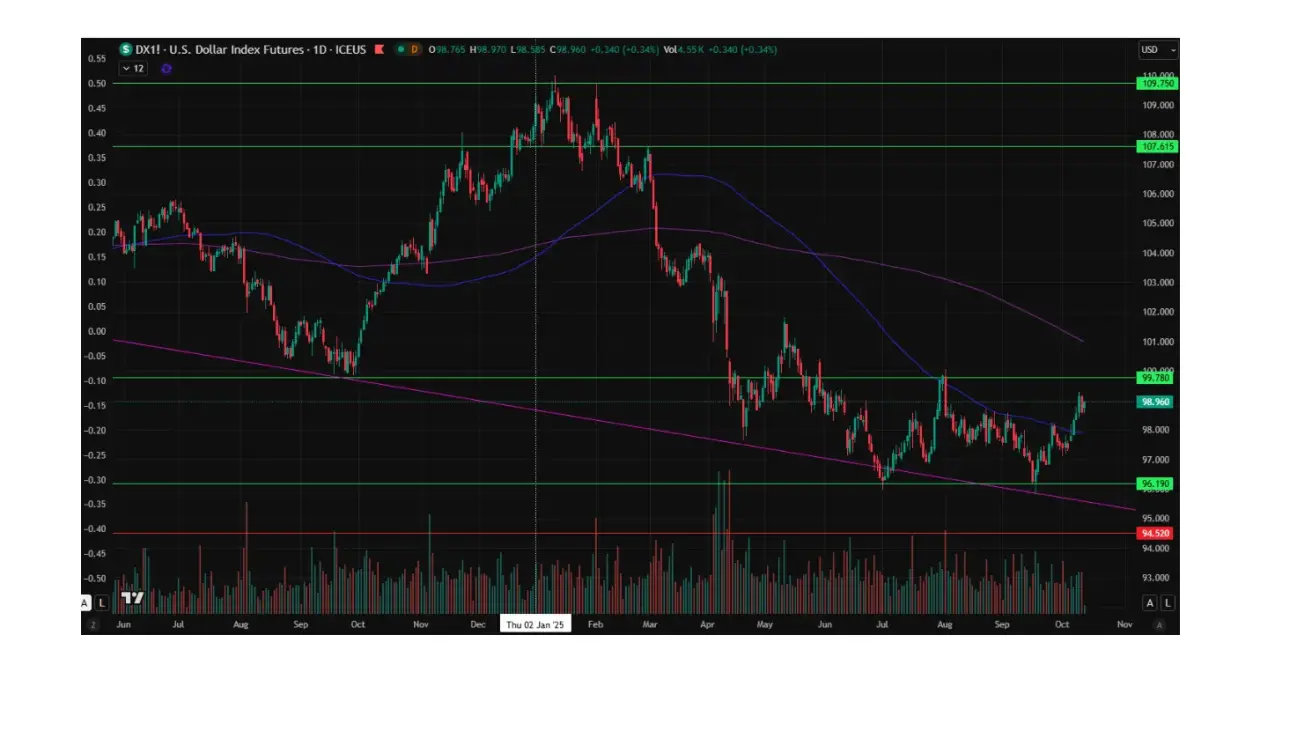
DOLLAR INDEX FUTURES (DX)
The U.S. Dollar Index futures (DX) ended the week up +1.24%, closing at 98.62. Year to date, the index is down –8.96%.
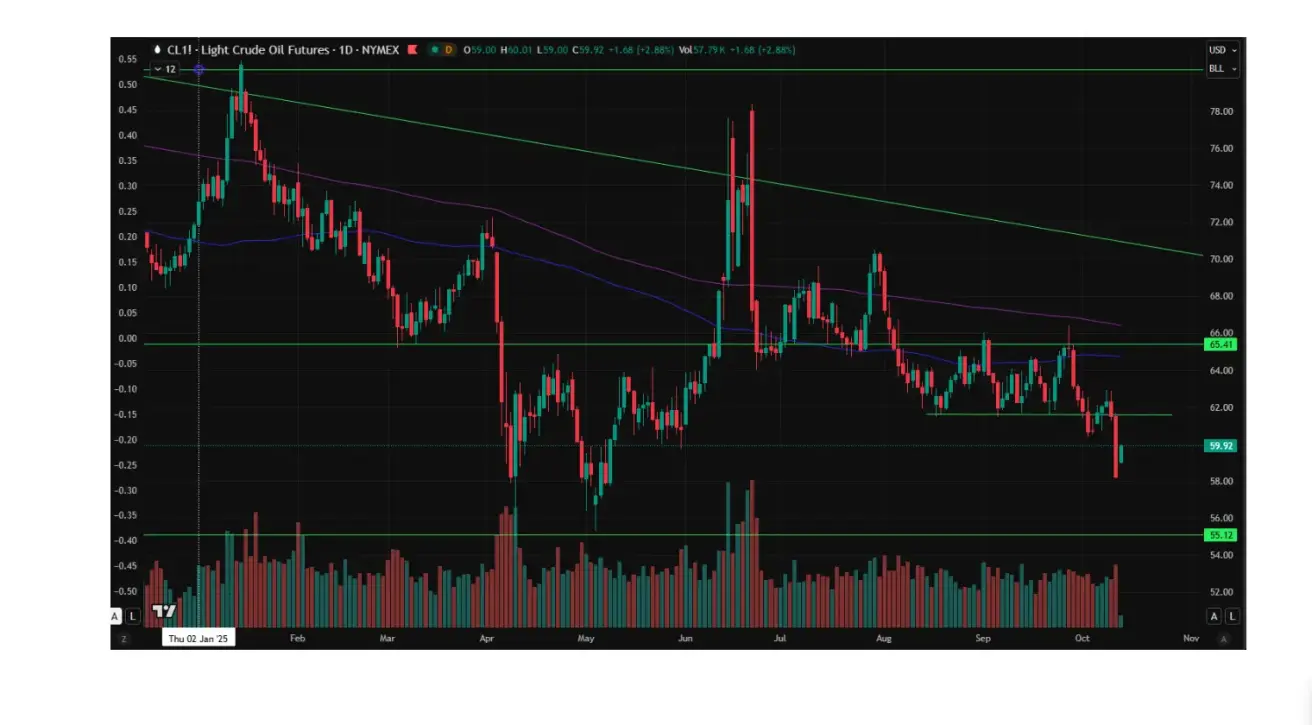
OIL FUTURES
The crude oil futures (CL) contract ended the week down -58.24%, closing at $60.69 per barrel. Year to date, it is down –18.94%.
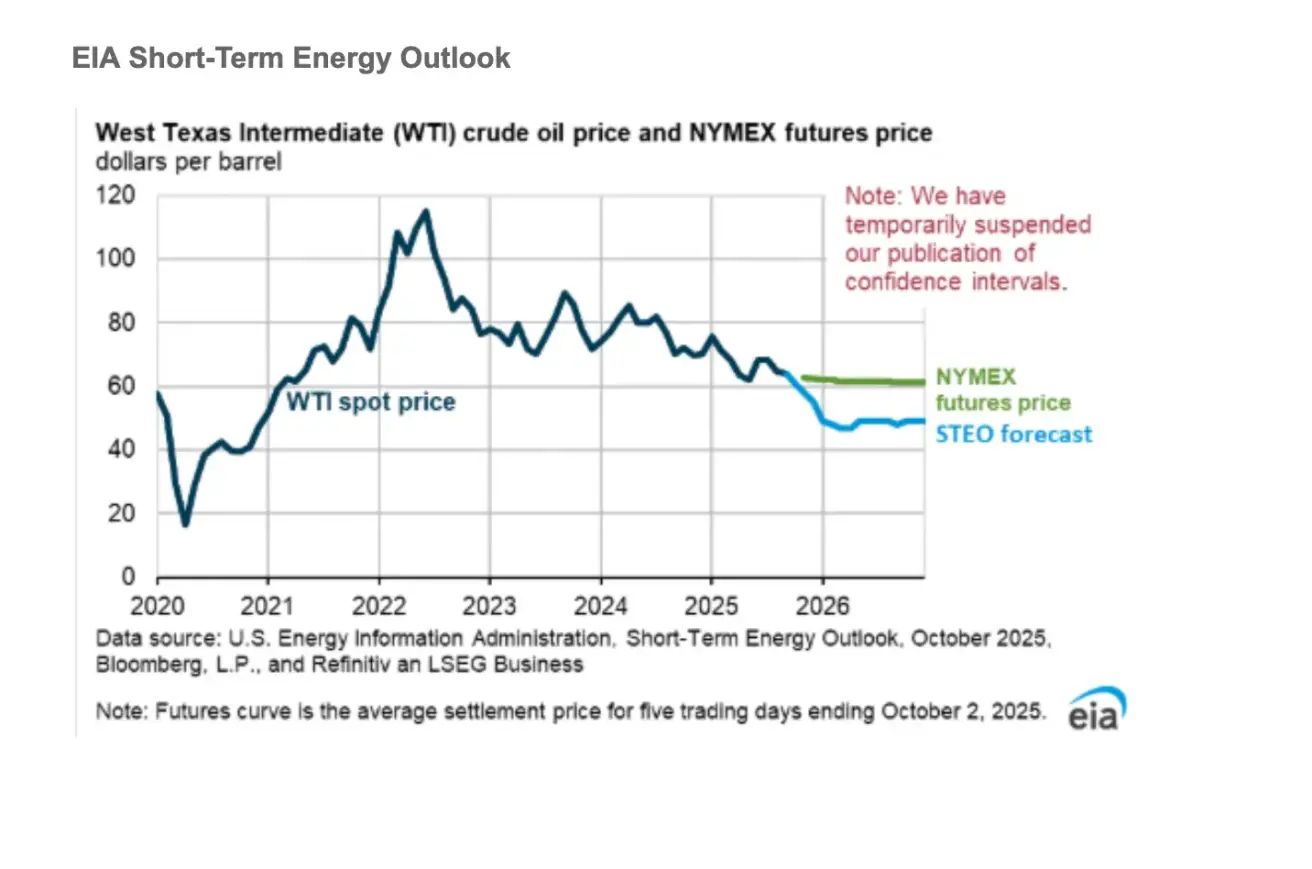
Global Oil Prices.
We expect global oil inventories to continue building through the end of 2026, which will put significant downward pressure on crude prices in the coming months. We forecast Brent crude to average $62 per barrel in Q4 2025 and $52 per barrel in 2026.
Global Oil Production.
Global output is rising throughout the entire forecast period, which we expect will contribute to further inventory accumulation.
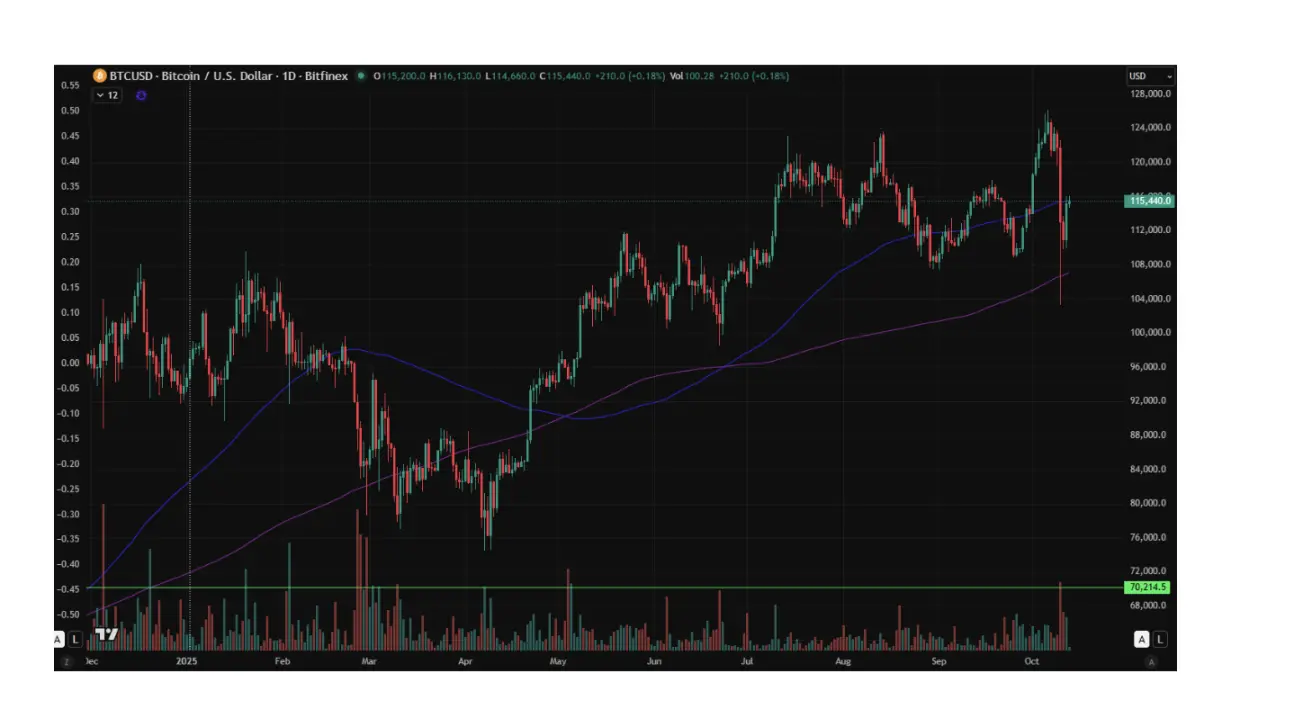
BTC FUTURES
Bitcoin ended the week down -6.68%, closing at $115230. Year to date, it has gained +22.90%.
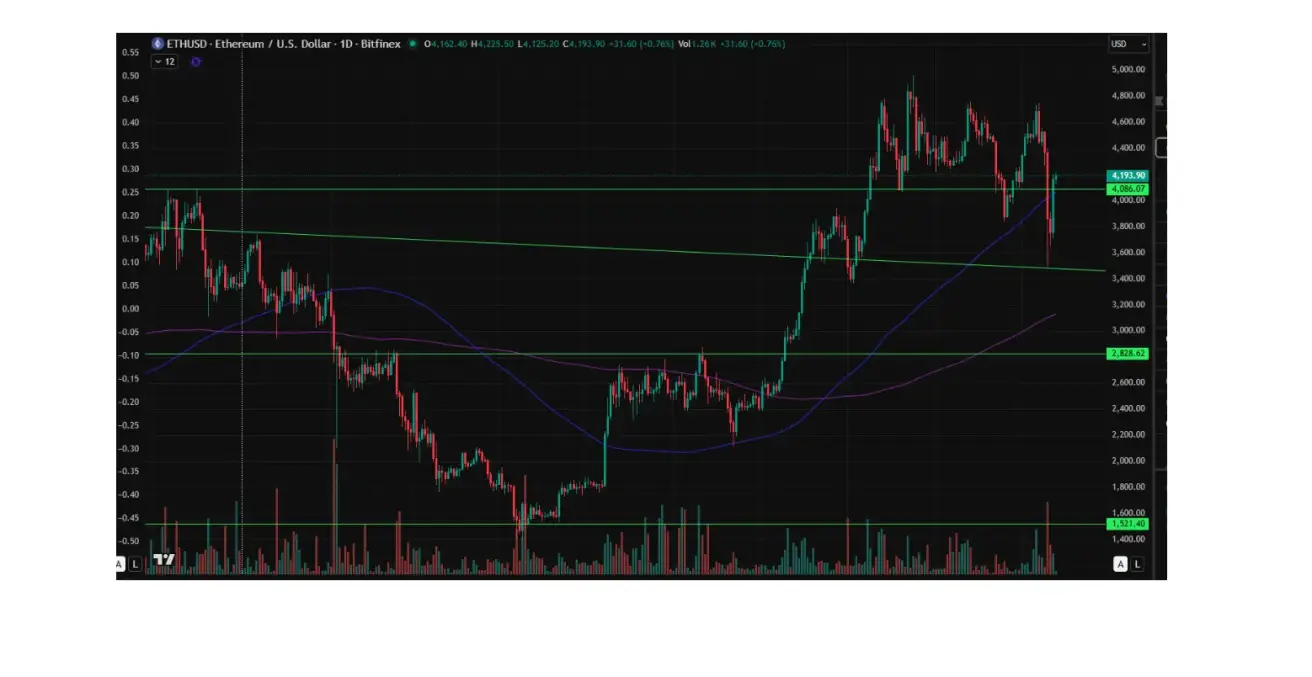
ETH FUTURES
Ethereum ended the week down -7.79%, closing at $4162.30. Year to date, it has gained +24.46%.
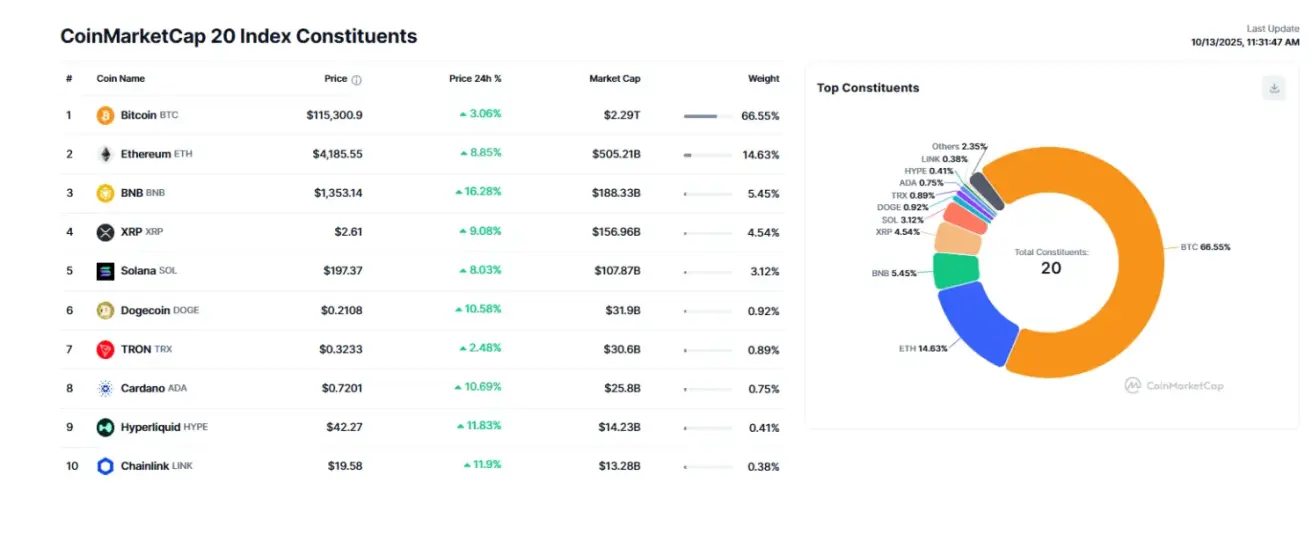
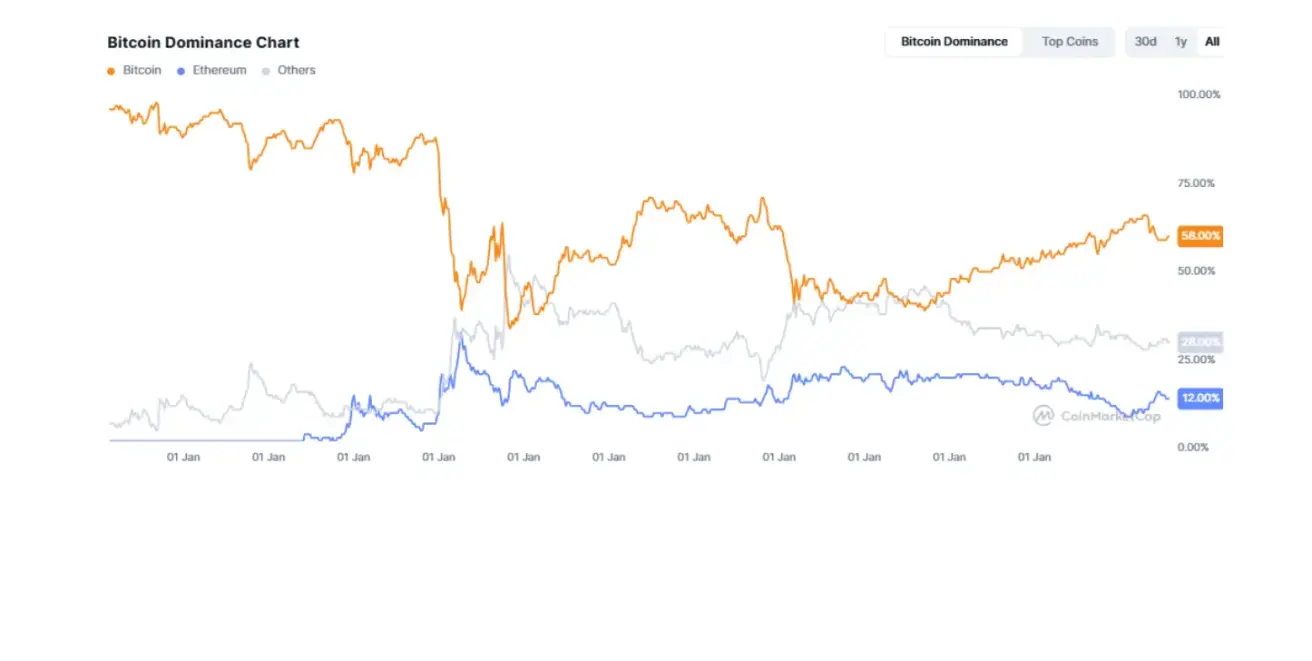
The total cryptocurrency market capitalization stands at $3.93 trillion (vs. $4.22 trillion a week earlier) (source: CoinMarketCap).
- Bitcoin’s share is 58.5% (vs. 58.4%),
- Ethereum’s share is 12.9% (vs. 13.0%),
- Other assets account for 28.6% (vs. 28.7%).
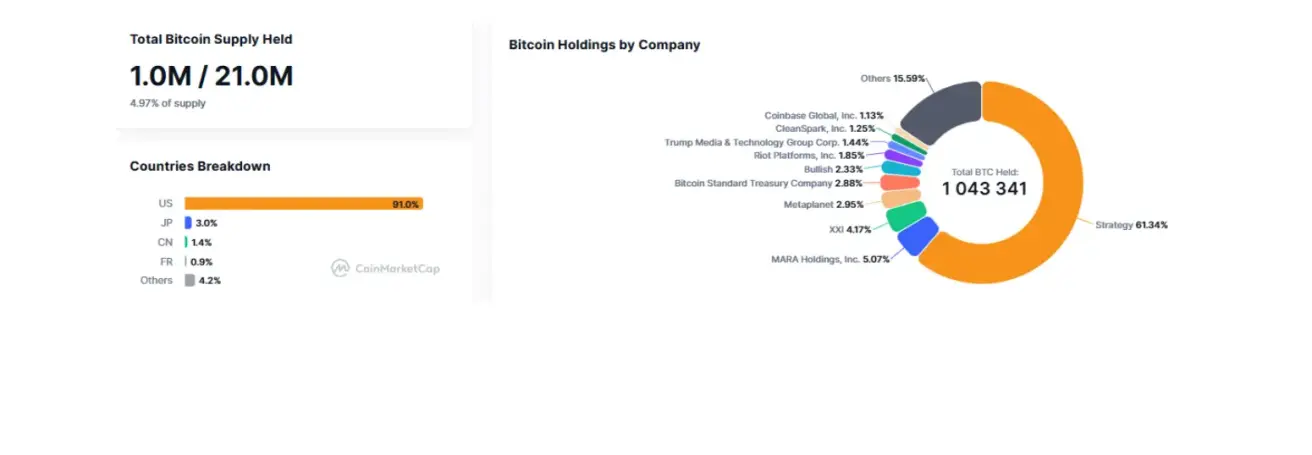
Public companies with a Bitcoin treasury strategy hold 4.97% of the total Bitcoin supply (vs. 4.92% a week earlier) — the share remained unchanged from the prior week’s level.
CoinMarketCap Top 10 Index Constituents: