Lietuvių
 Русский
 Қазақша
 Eesti
EestiMay 11 – May 17, 2026: Weekly economic update
Key market updates

Key takeaways:
- The policy rate remains unchanged, while the rhetoric remains cautious;
- Monetary policy remains moderately restrictive;
- US macroeconomic data continue to support the soft-landing scenario: inflation risks are rising, the labor market is cooling without showing signs of recession, and there is currently no need for a rate cut.
Macroeconomic Statistics
INFLATION: CONSUMER PRICE INDEX (MARCH):
Core CPI: (MoM) 0,4% (prev: 0.2%); (YoY) 2.8% (prev: 2.6%).
CPI: (MoM) 0.6% (prev: 0.9%); (YoY) 3.8% (prev: 3.3%).
PRODUCER PRICE INDEX (MARCH):
PPI (m/m): 1.4%, prev: 0.7%.
Core PPI (m/m): 1.0%, prev: 0.2% revised:
INFLATION EXPECTATIONS (MICHIGAN) (MARCH):
- 12-month inflation expectations: 4.5% (prev: 4.7%);
- 5-year inflation expectations: 3.4% (prev: 3.5%).
GDP (U.S. Bureau of Economic Analysis, BEA) (Q1 2025, annualized, advance estimate): +2.0% (Q4 2025: +0.5%); forecast: 2.2%.
The Atlanta Fed’s GDPNow indicator (a “real-time” estimate of official GDP prior to its release): 4.0% (previous: 3.7%).
BUSINESS ACTIVITY INDEX (PMI) (APRIL, PRELIMINARY DATA):
(Above 50 indicates expansion; below 50 indicates contraction)
- Services sector: 51.0 (prev: 49.8);
- Manufacturing sector: 54.0 (prev: 52.3);
- S&P Global Composite: 51.7 (prev: 50.3).
LABOR MARKET (BLS) (APRIL)
- Unemployment rate: 4.3% (prev: 4.3%);
- Total number of continuing jobless claims in the U.S.: 1,766K (prev: 1,776K);
- Initial jobless claims: 200K (prev: 190K);
- Change in nonfarm payroll employment: 109K (prev: 61K);
- Change in private nonfarm payroll employment: 186K (prev: -129K);
- Average hourly earnings (y/y): 3.6% (prev: 3.4%);
- JOLTS job openings: 6.866M (prev: 6.922M).
MONETARY POLICY
Kevin Warsh has been officially confirmed by the Senate as Chair of the Federal Reserve, securing approval by the narrowest margin in the institution’s history (54 votes to 45). His appointment intensifies speculation around the future trajectory of US interest rates, particularly amid mounting political pressure from Donald Trump.
A deeply divided Senate: The historically slim confirmation margin reflects significant concern among lawmakers regarding the future direction of monetary policy.
Conflict-of-interest concerns: Democrats fear that Warsh may ultimately yield to Trump’s demands for immediate and aggressive cuts to borrowing costs.
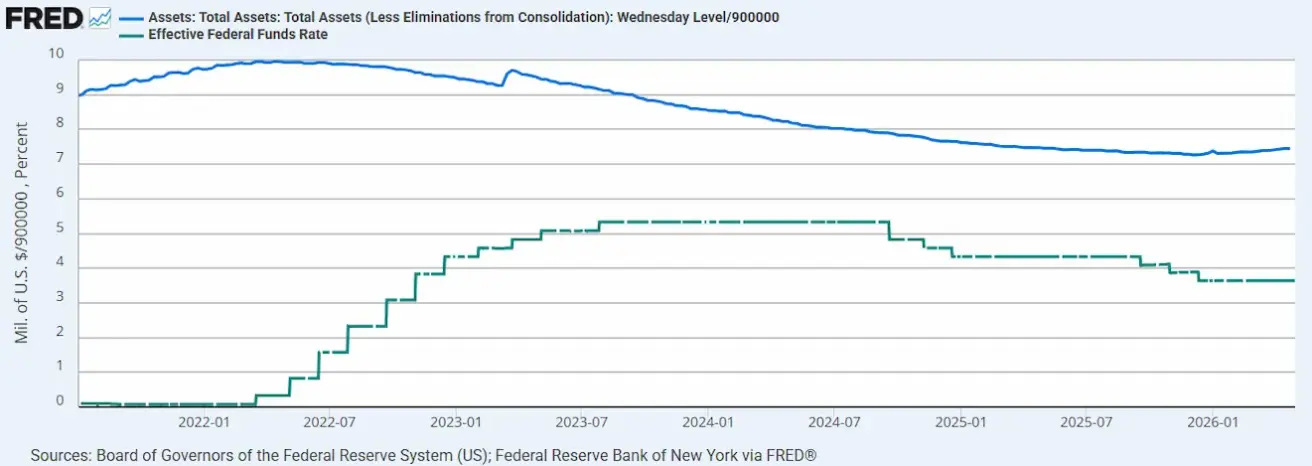
Commitment to independence: Warsh has publicly pledged to preserve the Fed’s “strict independence” and to ensure that policy decisions remain insulated from political influence. He has also advocated for a gradual reduction of the Federal Reserve’s balance sheet ($6.7 trillion), rather than pursuing further expansion.
- Effective Federal Funds Rate (EFFR): 3.50%–3.75%;
- Federal Reserve balance sheet: $6.728 trillion, up 2.95% since the suspension of QT ($6.535 trillion).
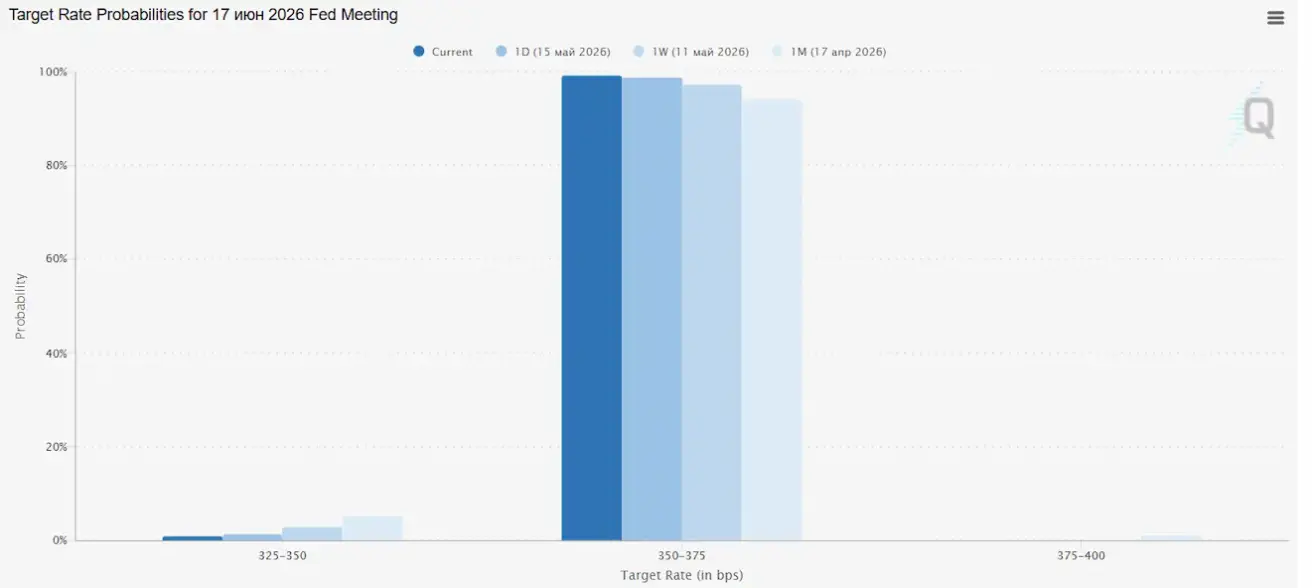
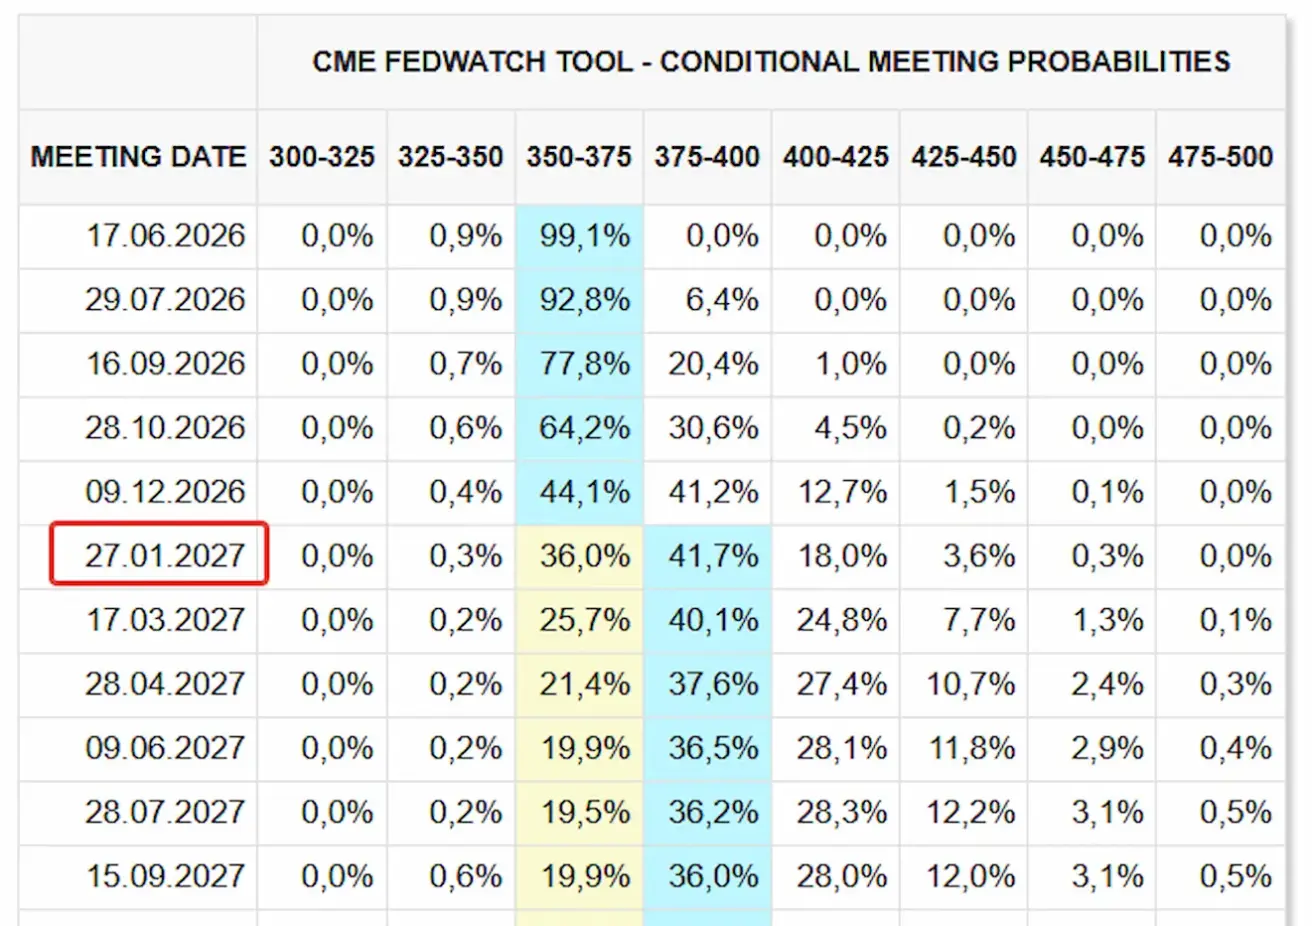
MARKET FORECAST FOR RATE (FEDWATCH)
At the next meeting (June 17), the estimated probability of the rate remaining unchanged stands at 99.09%.
Over the next 12 months, the market is pricing in a 25 bps rate hike in January 2027, bringing the target range to 3.75 – 4.00%.
Market
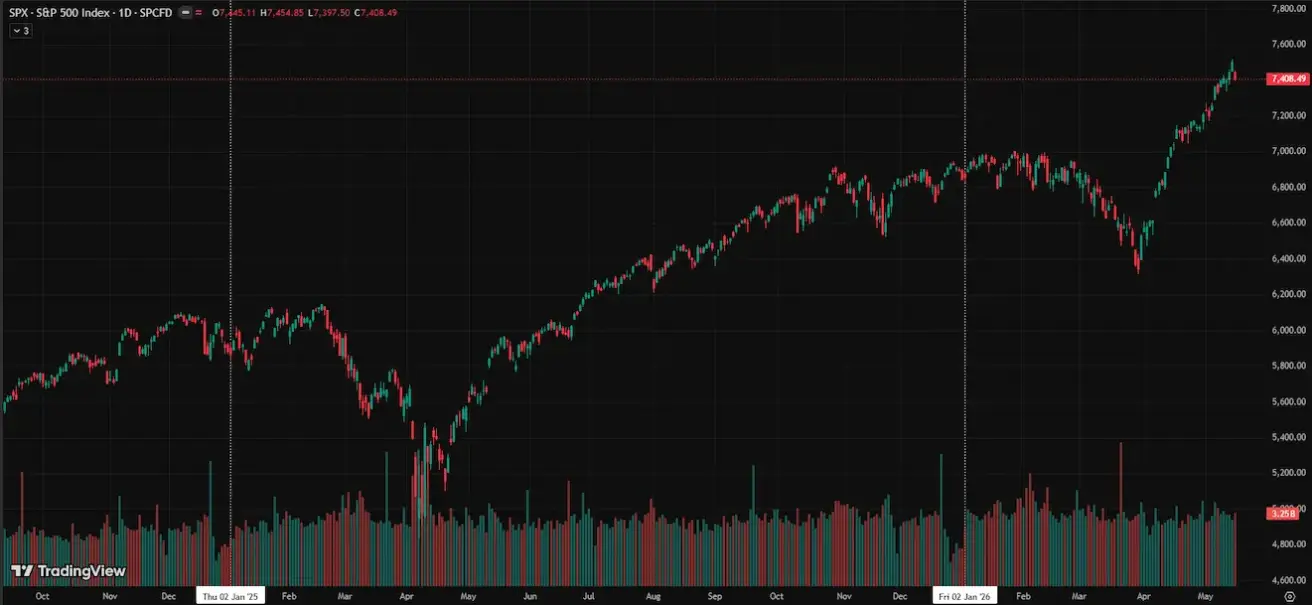
SP500
Weekly performance: +0,13% (week-end close at 7408,49); year-to-date: +8,22%.
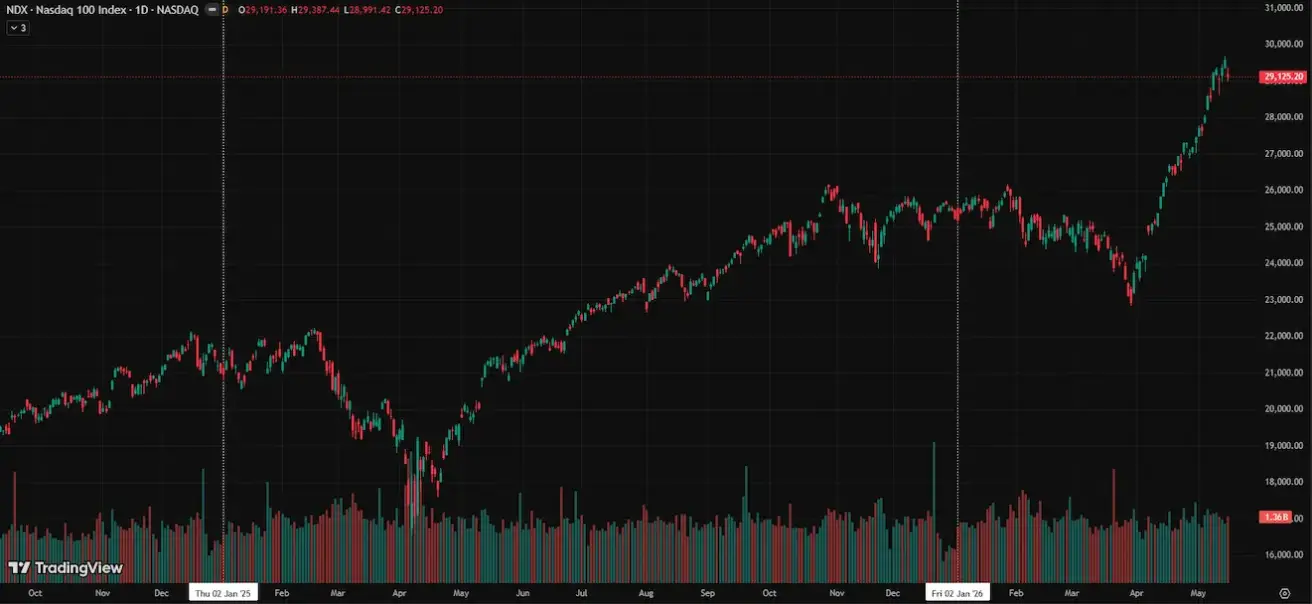
NASDAQ100
Weekly performance: -0,38% (week-end close at 29125,2); year-to-date: +15,35%.
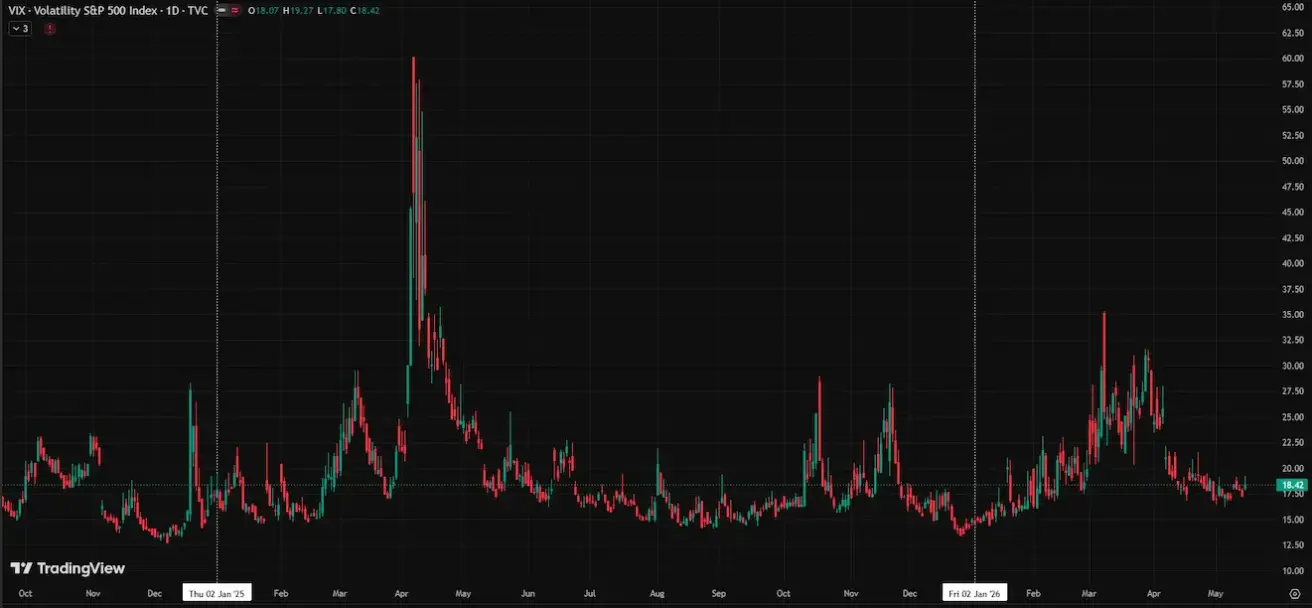
VIX
VIX (volatility index): week closing at 18,42 points.
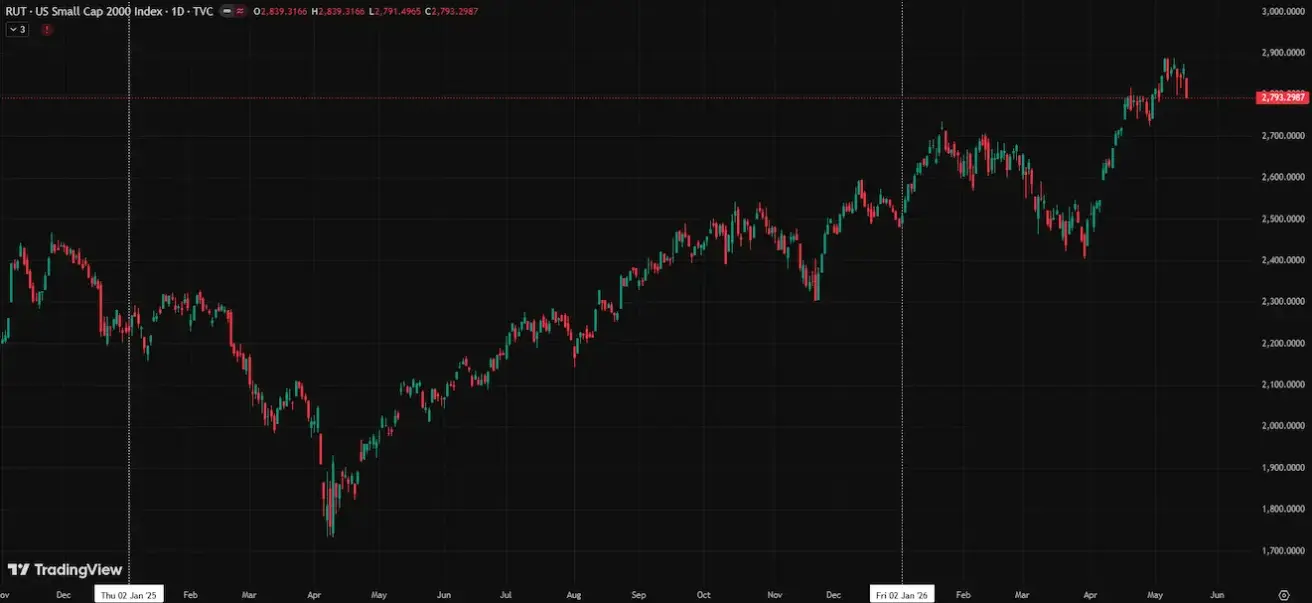
RUSSEL 2000 (RUT)
Weekly performance: -2,37% (week-end close at 2793,29); year-to-date: +12,55%.
Morgan has raised its year-end 2026 S&P 500 target to 8,000 from 7,800.
Contribution of AI investment to US real GDP growth (in basis points):
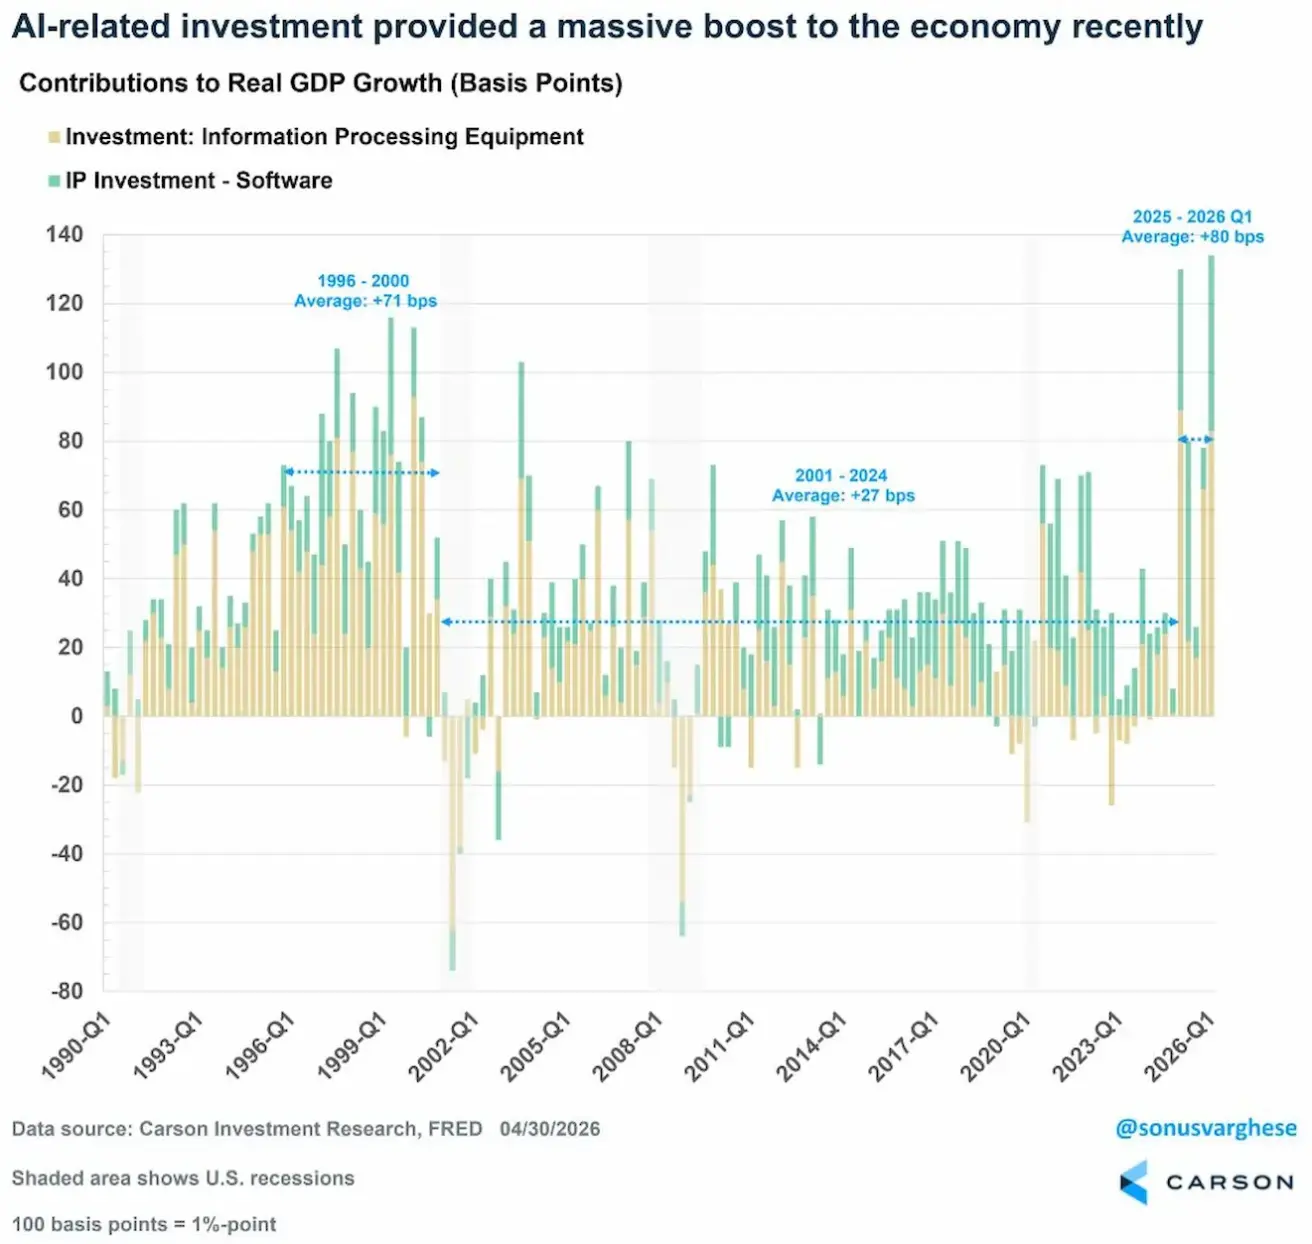
- Yellow: information processing equipment (servers, GPUs, data centers, hardware);
- Green: investment in software and intellectual property (AI software, models, digital infrastructure).
The contribution of AI-related investment to the US economy is now at its highest level since the dot-com era.
- 1996–2000 (dot-com boom): average contribution of +71 bps (driven by the internet, computers, and the software cycle);
- 2001–2024: average contribution of just +27 bps (following the dot-com crash, the technology sector became less capital-intensive, while overall economic growth moderated).
- 2025–2026: the average contribution has already reached approximately +80 bps (the AI cycle has now surpassed the contribution of the late-1990s technology boom).
This helps explain the resilience of the US economy. Despite restrictive interest rates, elevated borrowing costs, and QT, the economy has avoided slipping into recession. AI-driven capex is partially offsetting the effects of tight monetary policy.
Eurozone
- The policy rate remains unchanged for now, although inflation risks continue to rise;
- Monetary policy is currently neutral, but the balance of risks is increasingly tilted towards inflation;
- As the conflict in the Middle East escalates, the ECB has revised its GDP forecasts downward and raised its inflation outlook for the coming years.
The regulator’s overall messaging reflects an increasingly hawkish backdrop.
Christine Lagarde (President of the ECB):
- Acknowledges inflation as the primary threat due to its significant deviation from the 2% target;
- Effectively rules out the possibility of strong economic growth this year.
Philip Lane (Chief Economist of the ECB):
- Notes a sharp shock-driven increase in energy prices of 11% in April;
- Expresses serious concern over persistent inflation in the services sector, which remains at 3%.
Luis de Guindos (Vice-President of the ECB):
- Calls for caution regarding the pace of rate hikes;
- Expects the European economy to cool and weaken in the near term.
Interest Rates
- Deposit facility rate: 2.0% (prev. 2.0%);
- Marginal lending facility rate: 2.4% (prev. 2.4%) — the rate at which banks can access overnight funding from the regulator;
- Main refinancing (policy) rate: 2.15% (prev. 2.15%).
Inflation — Consumer Price Index (CPI)(April, preliminary data)
- Core CPI (YoY): 2.2% (prev. 2.3%).
- CPI (MoM): 1.0% (prev. 1.3%);
- CPI (YoY): 3.0% (prev. 2.6%).
GDP — Q1 (preliminary)
- QoQ: 0.1% (prev. 0.2%, revised);
- YoY: 0.8% (prev. 1.2%).
Labor Market
- Unemployment rate (March): 6.3% (prev. 6.2%).
Industrial Production
- Industrial production (MoM, February): 0.4% (prev. -0.8%).
Purchasing Managers’ Index (PMI) — April
PMI indicators remain in expansion territory overall, although momentum is slowing.
- Services sector: 47.6 (prev. 50.2);
- Manufacturing sector: 52.2 (prev. 51.6);
- S&P Global Composite: 48.6 (prev. 50.7).
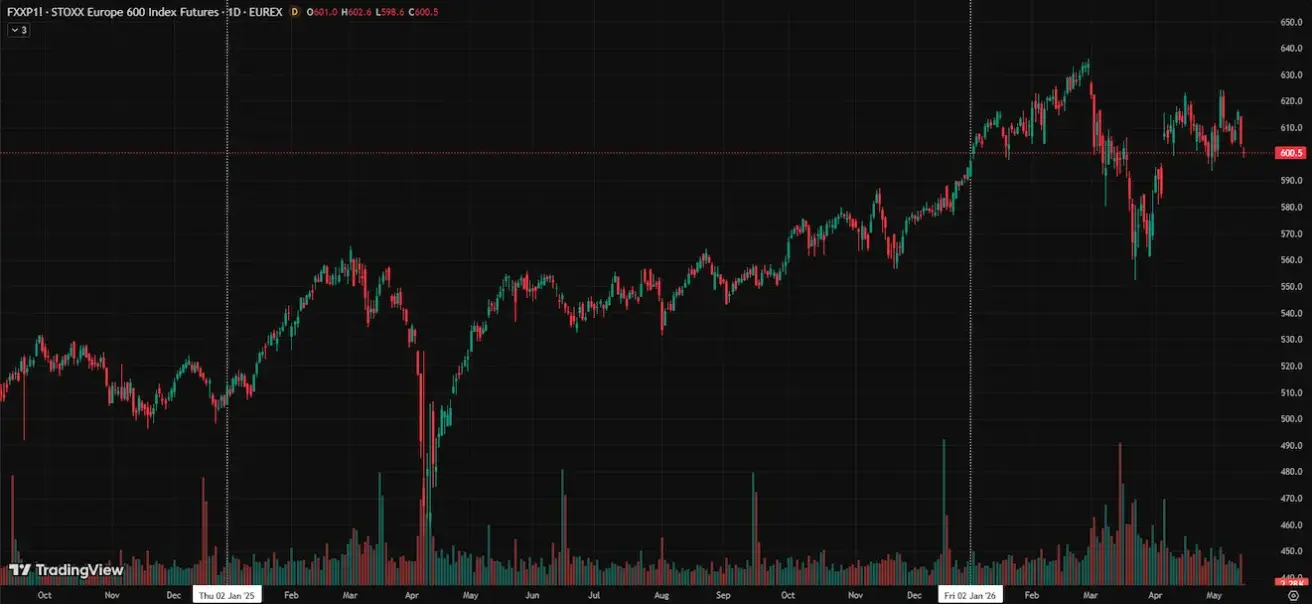
EURO STOXX 600 (FXXP1!)
Weekly performance: -0,87% (Week-end close: 604,3); Year-to-date: +1,73%.
China
The economy is stabilizing, supported by exports, while domestic demand and investment continue to recover. Policy stimulus remains targeted and cautious.
- Interest rates remain unchanged;
- Monetary policy remains accommodative;
- China has confirmed the continuation of fiscal support measures under its 2026 economic plan, including policies aimed at stimulating domestic demand, optimizing tax incentives and subsidies, and accelerating industrial modernisation.
Interest Rates
- 1Y Loan Prime Rate (medium-term lending rate): 3.00%;
- 5Y Loan Prime Rate (benchmark five-year rate influencing mortgage lending): 3.50%.
Inflation Indicators (April)
- Consumer Price Index (CPI): MoM: +0.3% (prev. -0.7%); YoY: 1.2% (prev. 1.0%).
- Producer Price Index (PPI): YoY: +2.8% (prev. -0.5%).
GDP — Q1 2026
- QoQ: 1.3% (prev. 1.2%);
- YoY: 5.0% (prev. 4.5%).
Labor Market
- Unemployment rate (April): 5.2% (prev. 5.4%).
- Industrial production (April, YTD YoY): 5.6% (prev. 6.1%).
- Fixed asset investment (April, YoY): -1.6% (prev. 1.7%).
- Retail sales (March, YoY): 0.9% (prev. 1.3%).
Trade
- Imports (April, YoY): 25.3% (prev. 27.8%);
- Exports (April, YoY): 14.1% (prev. 2.5%).
- Trade balance (April, USD, YoY): $84.80 bn (prev. $51.13 bn).
Purchasing Managers’ Index (PMI) — March
- Manufacturing sector: 50.3 (prev. 50.4);
- Non-manufacturing sector: 49.4 (prev. 50.1);
- Composite PMI: 50.1 (prev. 50.5).
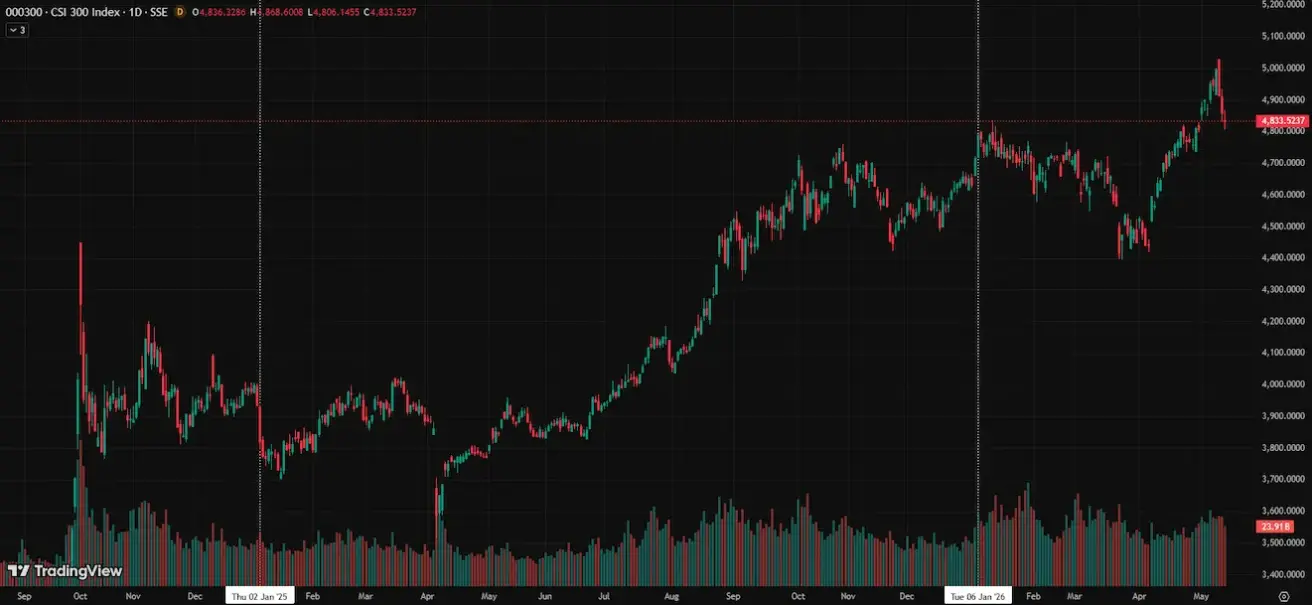
CSI 300 INDEX (000300.HK)
Weekly performance: -0,79% (week-end close at 4833,5237); Year-to-date: +3,69%.
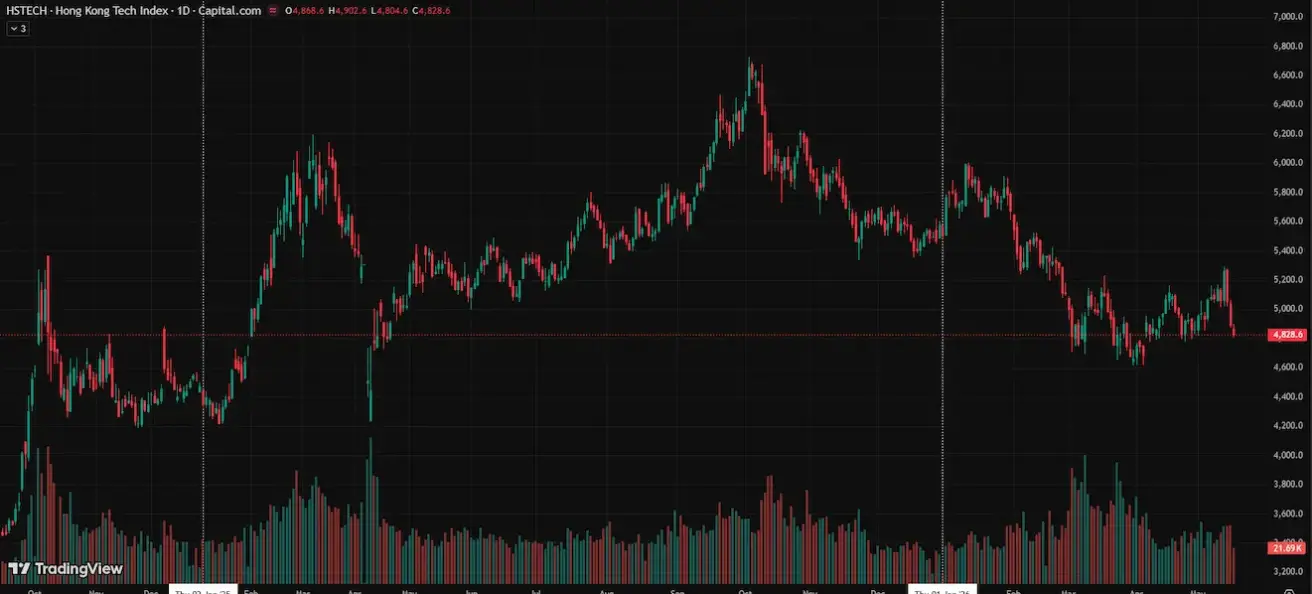
Hang Seng TECH Index (HSTECH)
Weekly performance: -3,57% (week-end close: 4891,2); year-to-date: -11,14%.
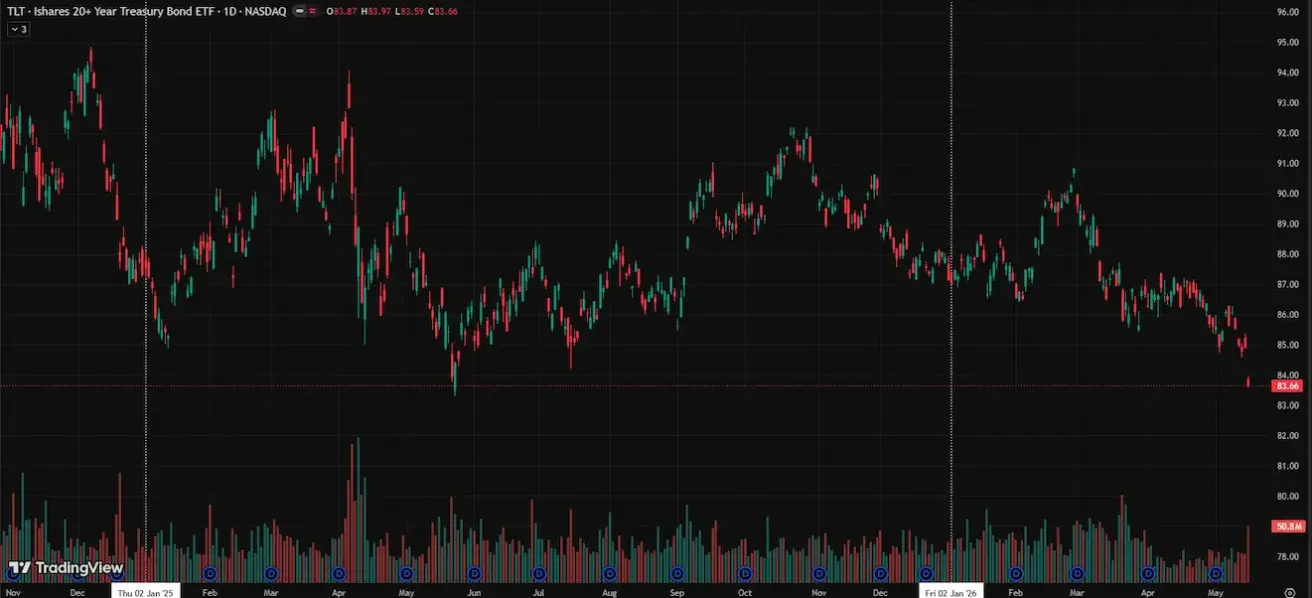
BOND MARKET
U.S. Treasuries 20+ (ETF TLT): weekly performance: -2,81% (week close: 84,92); year-to-date: -4,02%.
YIELDS AND SPREADS
Market Yield on U.S. Treasury Securities at 10-Year Constant Maturity: 4.63% (prev. 4.39%); 2-year Treasury yield: 4.10% (prev. 3.92%);
ICE BofA BBB US Corporate Index Effective Yield: 5.34% (prev. 5.27%).
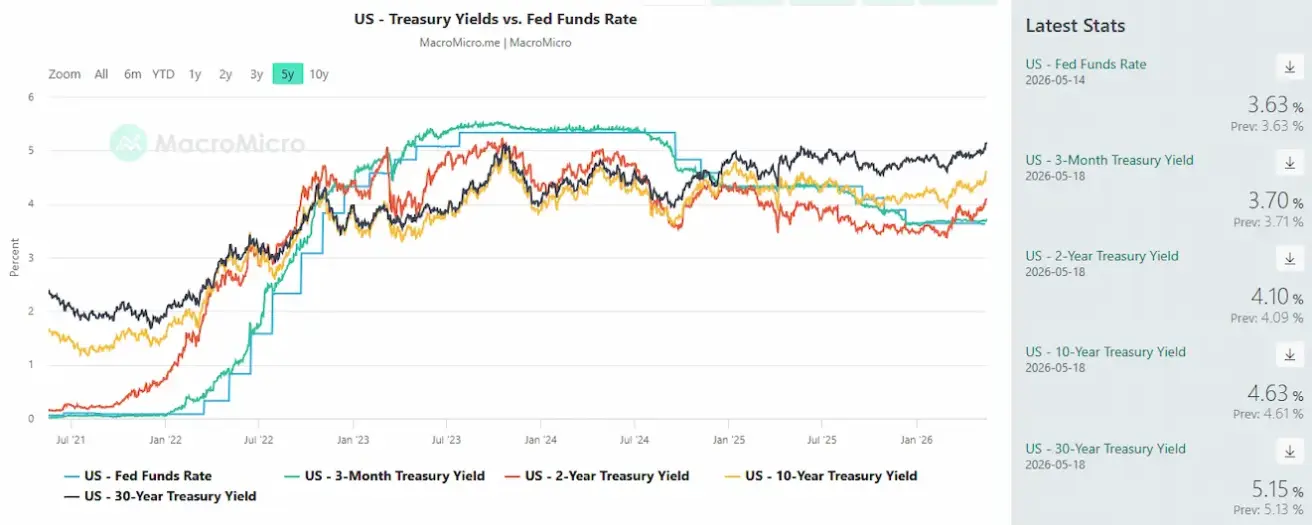
- The yield spread between 10-year and 2-year US Treasury securities stands at 53 basis points (prev. 47 bps);
- The yield spread between 10-year and 3-month US Treasury securities stands at 93 basis points (prev. 70 bps).
The cost of a 5-year US credit default swap (CDS) — insurance against sovereign default — rose to 37.29 bps (vs 35.08 bps last week).
US 3-year Treasury note auction yield: 3.965% (prev. 3.897%).
US 30-year Treasury bond auction yield: 5.050% (prev. 4.876%).
US Treasury yield curve:
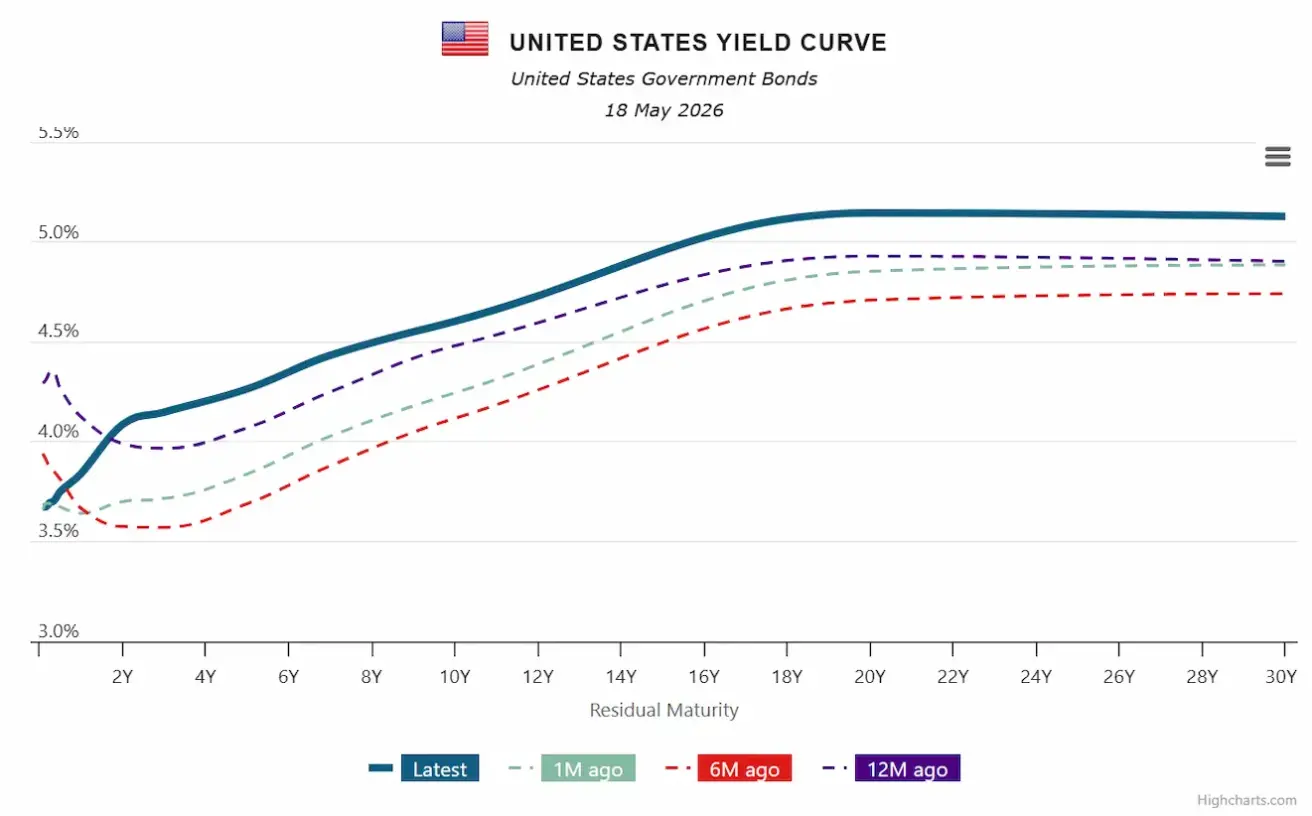
The key takeaway is that the yield curve has shifted materially higher across the entire maturity spectrum. Most notably, the long end (20Y–30Y) is now holding above the 5% level.
The market no longer expects rapid rate cuts. Instead, investors increasingly see an economy characterized by resilience and sticky inflation. The US economy does not currently appear to be in a recession, but the cost of capital is becoming structurally higher.
Equity markets have so far absorbed the rise in yields, supported by strong corporate earnings, the ongoing AI investment cycle, and continued share buybacks.
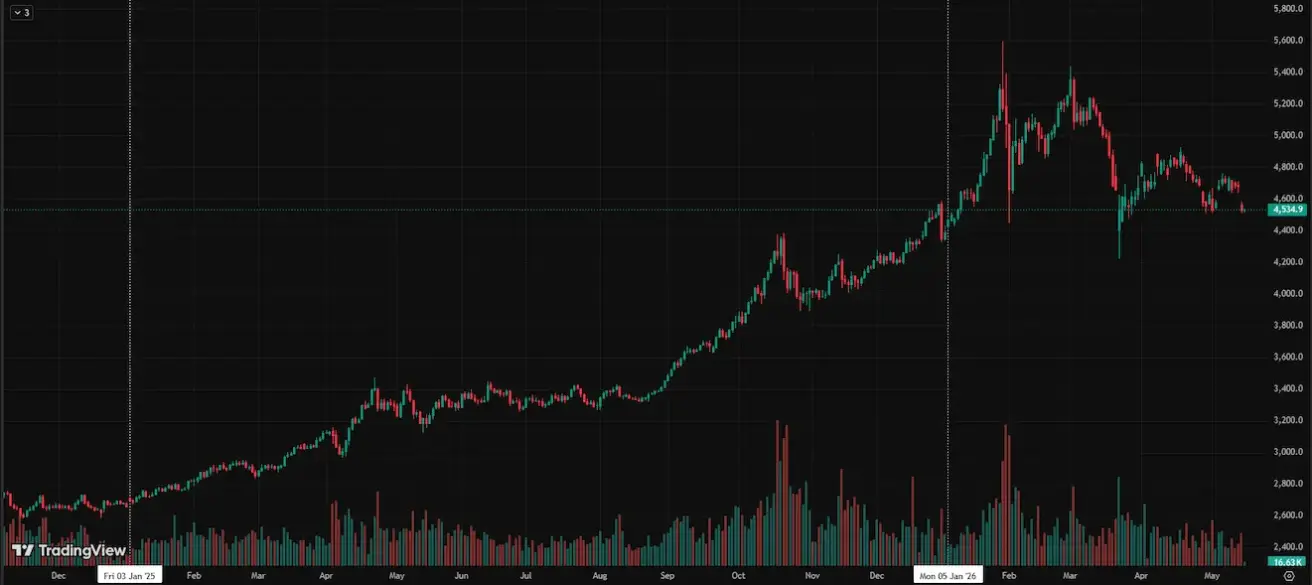
GOLD FUTURES (GC)
Weekly performance: -3,68% (week close: $4534,2 per troy ounce); Year-to-date: +4,37%.
OIL FUTURES
Weekly performance: +7,59% (week-end close: $102,66 per barrel). Year-to-date performance: +78,82%.
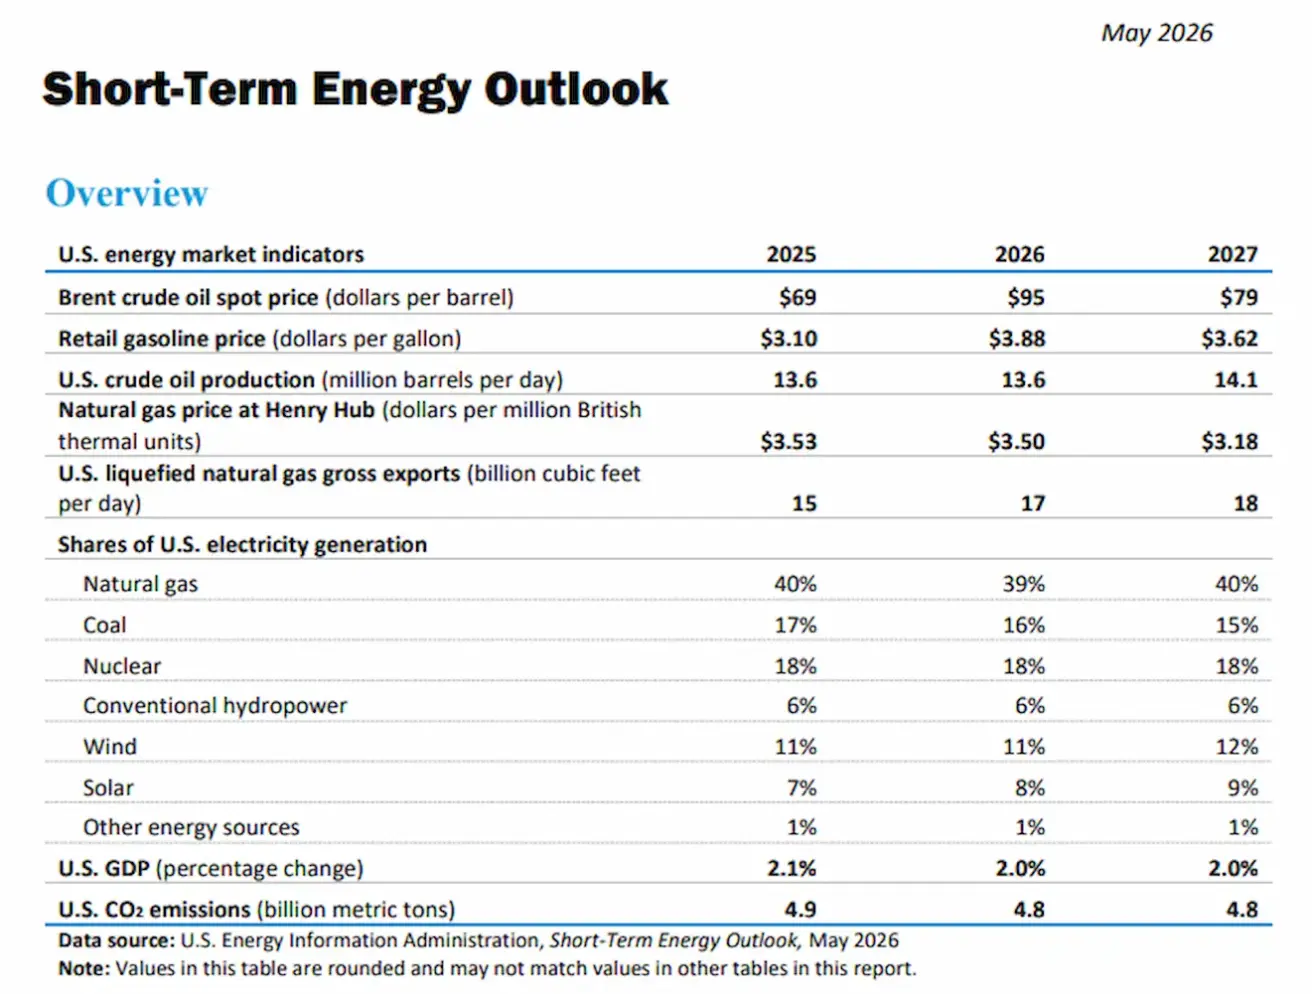
US Energy Information Administration (EIA) short-term outlook:
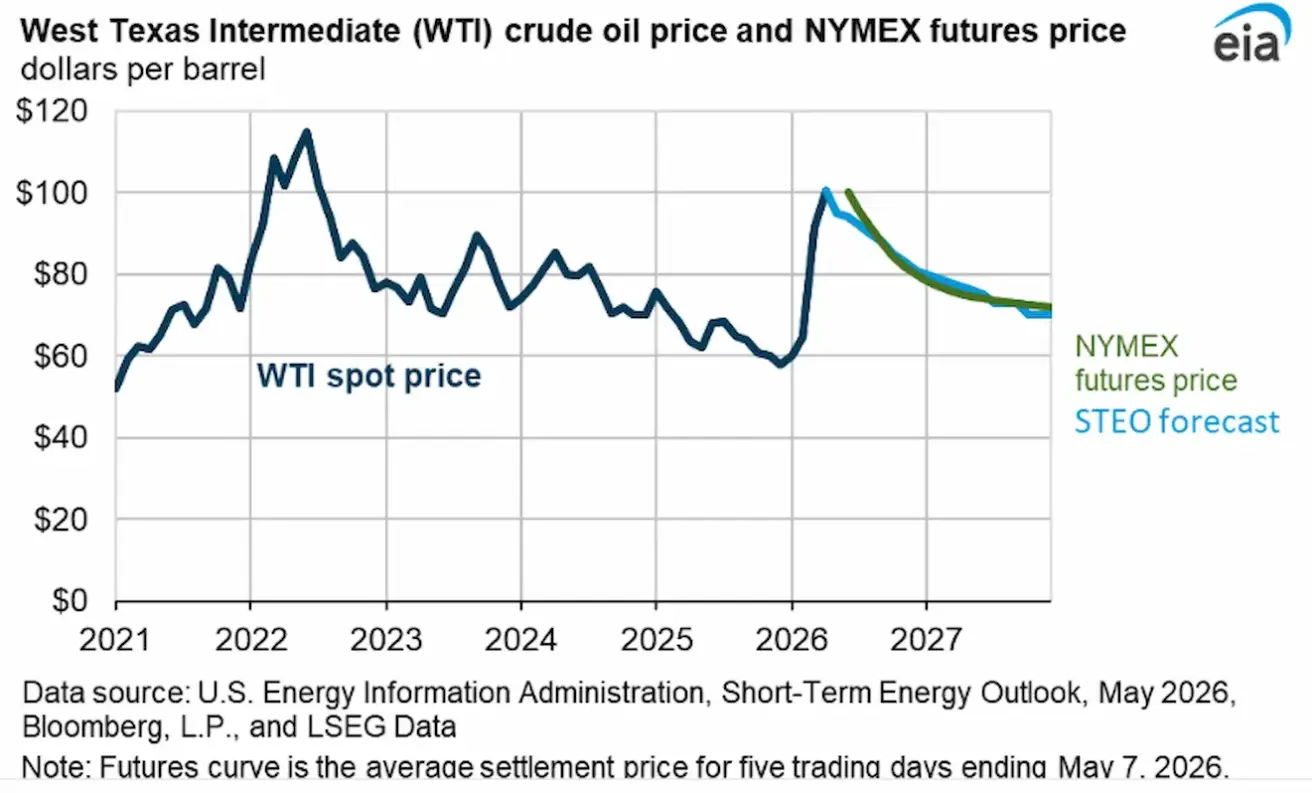
Backwardation persists across energy markets — a structure in which near-term delivery contracts trade at a significant premium to longer-dated contracts, signaling an immediate physical supply shortage.
Key takeaways from the US Energy Information Administration (EIA) report:
- The Strait of Hormuz is expected to remain effectively closed until the end of May, although shipping activity is likely to begin gradually resuming in June. Nevertheless, oil flows through the strait are unlikely to return to pre-conflict levels before the end of the year. The EIA expects part of Middle Eastern oil production to remain disrupted throughout this period.
- The agency now forecasts global oil inventories to decline by 2.6 million barrels per day this year, compared with a projected drawdown of 0.3 million barrels per day in last month’s outlook.
- Global oil inventories are expected to decline by an average of 8.5 million barrels per day in Q2 2026, supporting Brent crude prices at approximately $106 per barrel in May and June. As oil production in the Middle East gradually recovers, the EIA expects prices to ease, averaging around $89 per barrel in Q4 2026 and declining further to approximately $79 per barrel in 2027.
International Energy Agency (IEA)
- Record inventory drawdown: Global commercial crude oil and refined product inventories are declining at a pace significantly faster than historical averages.
- Middle East factor: Supply disruptions and rerouted shipping logistics are extending tanker transit times, effectively removing additional volumes from immediate market availability.
- Prolonged supply deficit: The agency expects the downward trend in inventories to persist at least throughout the summer.
Key figures from the OPEC report
- Sharp production decline: In April, OPEC+ countries cut output by 1.6 million barrels per day from March.
- Record underproduction: The cumulative shortfall versus the agreed production target has reached an unprecedented 9.9 million barrels per day.
- Weaker demand outlook for 2026: OPEC has cut its forecast for global oil demand growth this year by 210 thousand barrels per day, to 1.17 million barrels per day.
- Demand boom expected in 2027: OPEC has raised its global oil demand growth forecast for next year by 200 thousand barrels per day, bringing the projection to 1.54 million barrels per day. OPEC expects the economic slowdown projected for 2026 to give way to a strong cyclical recovery in global demand in 2027.
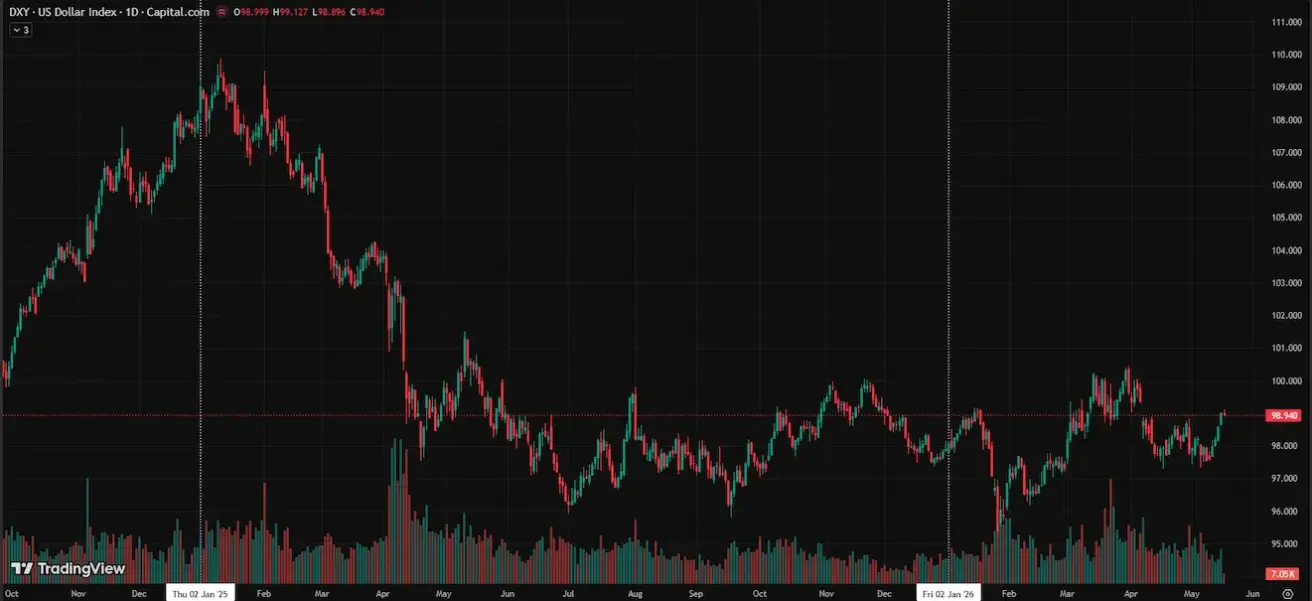
DOLLAR INDEX FUTURES (DX)
Weekly performance: +1,49% (week-end close: 99,00). Year-to-date performance: +1,03%.
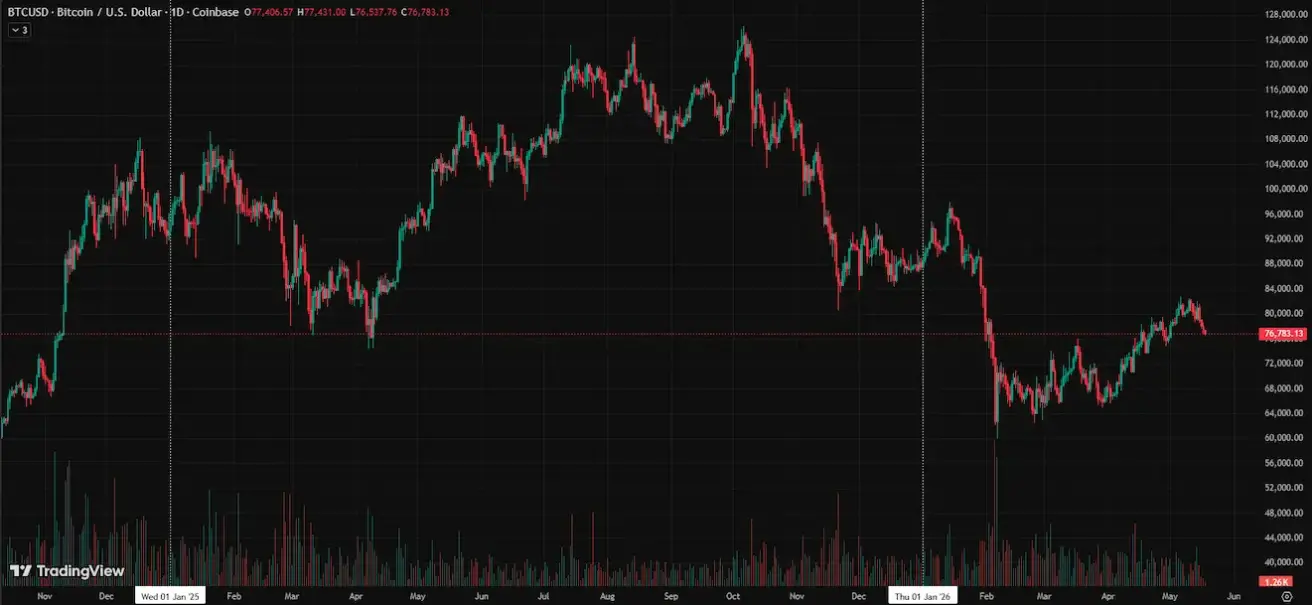
BTC FUTURES
Weekly performance: -5,83% (week-end close: $77407,59); year-to-date: -11,76%.
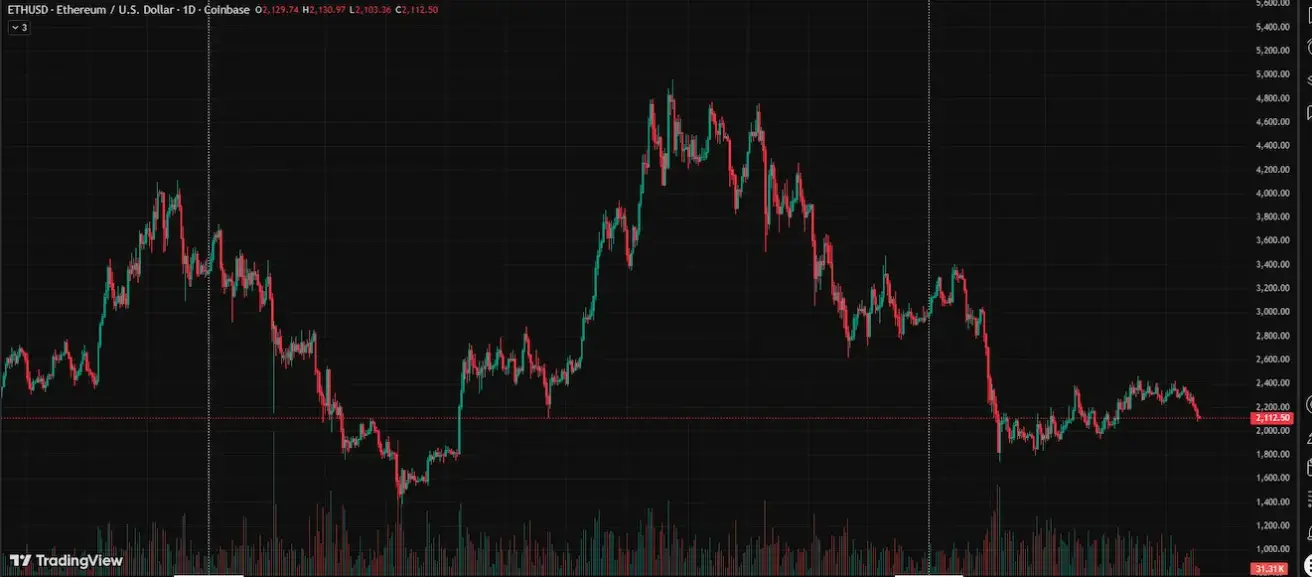
ETH FUTURES
Weekly performance: -10,18% (week-end close: $2129,74); year-to-date: -28,39%.
The US Senate Banking Committee approved the bipartisan bill on the structure of the digital asset market (CLARITY Act). The vote ended 15 to 9 in favor of advancing the document for consideration by the full Senate.
Key points on the vote and the essence of the CLARITY Act
- Bipartisan breakthrough: Two Democrats — Senators Ruben Gallego and Angela Alsobrooks — joined Republicans, ensuring the bill's successful advancement.
- Division of jurisdictions: The document clearly separates the powers of the Securities and Exchange Commission (SEC) and the Commodity Futures Trading Commission (CFTC), placing decentralized tokens under the CFTC's softer supervision as commodities.
The essence of the previous dispute over stablecoins
- Competition for deposits: Banks fear that stablecoins generating interest income will prompt clients to withdraw large sums from their current bank accounts.
- Impact on lending: The outflow of liquidity from banks will reduce their ability to lend to businesses and households, creating risks to the stability of the entire US economy.
- Regulatory arbitrage: The American Bankers Association (ABA) demands that stablecoin issuers be subject to the same strict reserve, insurance, and supervisory rules as commercial banks.
- A compromise on stablecoins was nevertheless reached during the vote: Senators agreed on rules that limit the accrual of passive interest income on payment stablecoins while allowing transaction incentives.
What’s next: During the full Senate vote (expected before August), the bill will need to secure at least 60 votes, which will require even broader Democratic support. If supported by Democrats in the Senate, the bill must then be reconciled with the House of Representatives version, after which it will be sent to Donald Trump for signature.
Institutional-grade confidentiality is becoming the main trend for institutional capital in the crypto industry. As noted by Matt Hougan of Bitwise, major players are seeking a balance between protecting commercial secrecy and complying with regulatory requirements.
Why is privacy important for institutional investors?
- Protection of strategies: Funds cannot execute large transactions on fully public blockchains because competitors can see their balances and copy their positions.
- Regulatory compromise: Next-generation projects offer “selective privacy” — data is hidden from the public but remains accessible to auditors and regulators.
- Scale of investments: The $1 billion raised by Arc, Canton, and Tempo funds proves that venture capital is betting on this infrastructure.
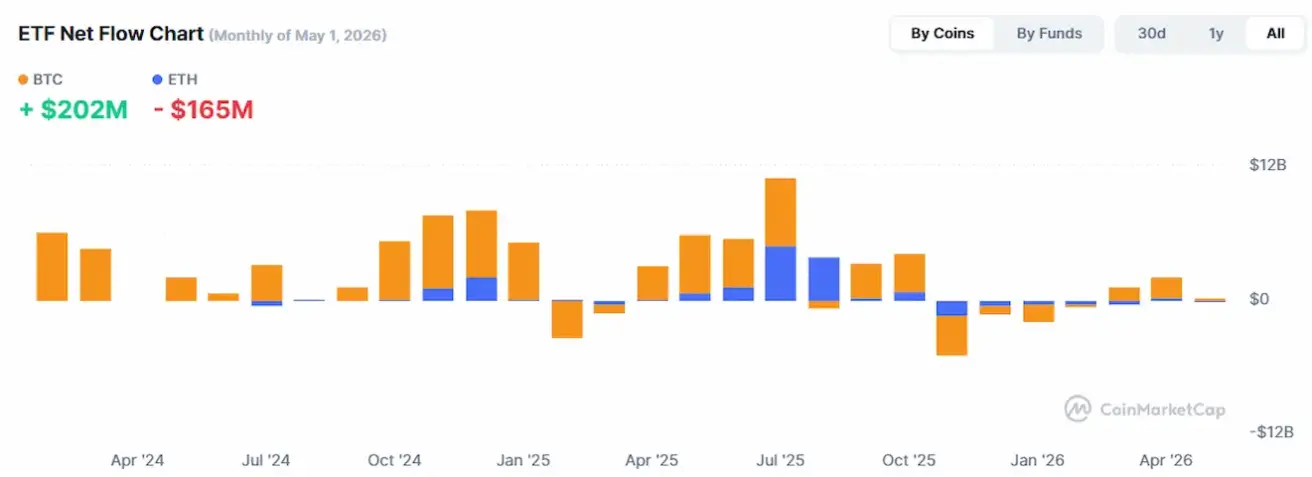
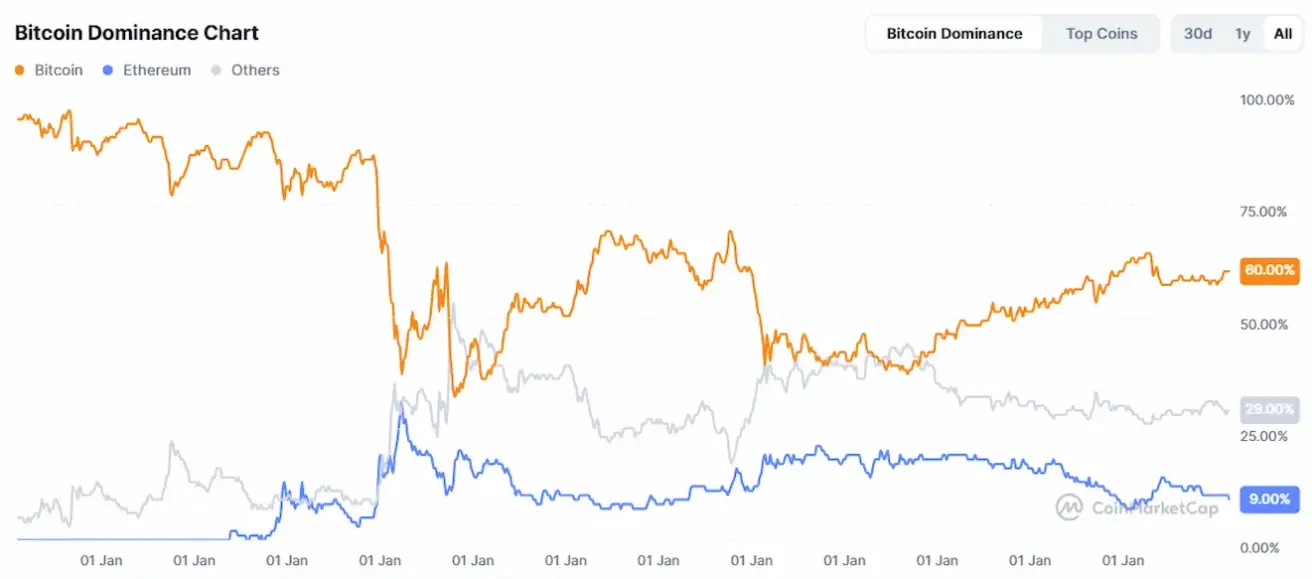
TOTAL CRYPTOCURRENCY MARKET CAPITALIZATION
Total crypto market capitalization: $2,55 trillion (vs $2,69 trillion a week earlier) (coinmarketcap.com).
Crypto asset market shares:
- Bitcoin: 60.3% (60.1%)
- Ethereum: 10.0% (10.4%)
- Others: 29.7% (29.5%).
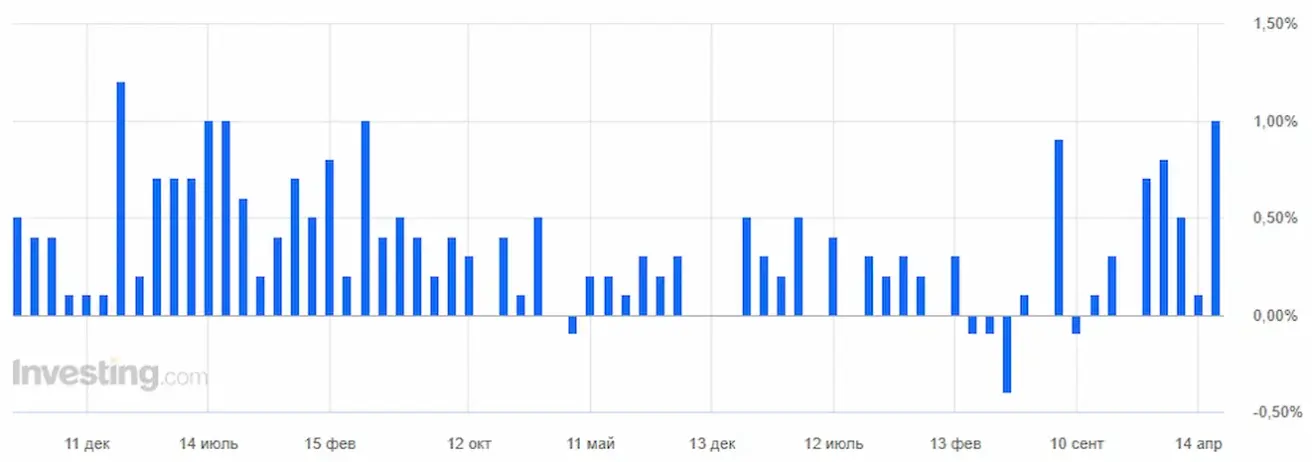
ETF Net Flows Chart: