Lietuvių
 Русский
 Қазақша
 Eesti
EestiMay 4 – May 10, 2026: Weekly economic update
Key market updates

Macroeconomic data. U.S. (key takeaways):
- The interest rate remains unchanged, while the rhetoric stays cautious;
- Monetary policy remains moderately restrictive;
- US macroeconomic data continues to support the soft-landing scenario, with inflationary risks increasing, while the labor market is cooling without showing signs of recession and, for now, does not warrant a rate cut.
Macroeconomic Statistics
INFLATION: CONSUMER PRICE INDEX (MARCH):
- Core CPI: (MoM) 0.2% (prev: 0.2%); (YoY) 2.6% (prev: 2.5%).
- CPI: (MoM) 0.9% (prev: 0.3%); (YoY) 3.3% (prev: 2.4%).
PRODUCER PRICE INDEX (MARCH):
- PPI (m/m): 0.5%, prev: 0.7%.
- Core PPI (m/m): 0.1%, prev: 0.3%:
INFLATION EXPECTATIONS (MICHIGAN) (MARCH):
- 12-month inflation expectations: 4.5% (prev: 4.7%);
- 5-year inflation expectations: 3.4% (prev: 3.5%).
GDP (U.S. Bureau of Economic Analysis, BEA) (Q1 2025, annualized, advance estimate): +2.0% (Q4 2025: +0.5%); forecast: 2.2%.
The Atlanta Fed’s GDPNow indicator (a “real-time” estimate of official GDP prior to its release): 3.7% (previous: 3.5%).
BUSINESS ACTIVITY INDEX (PMI) (APRIL, PRELIMINARY DATA):
(Above 50 indicates expansion; below 50 indicates contraction)
- Services sector: 51.0 (prev: 49.8);
- Manufacturing sector: 54.0 (prev: 52.3);
- S&P Global Composite: 51.7 (prev: 50.3).
LABOR MARKET (BLS) (APRIL)
Labor market remains resilient, with unemployment holding steady at 4.3% and job growth coming in significantly above expectations. At the same time, the slowdown in job openings points to a gradual cooling of the labor market, with no signs of a sharp economic deterioration.
Meanwhile, wage growth accelerating to 3.6% YoY continues to support consumer demand, but also reinforces the Fed’s cautious stance toward any rapid rate cuts.
- Unemployment rate: 4.3% (prev: 4.3%);
- Total number of continuing jobless claims in the U.S.: 1,766K (prev: 1,776K);
- Initial jobless claims: 200K (prev: 190K);
- Change in nonfarm payroll employment: 109K (prev: 61K);
- Change in private nonfarm payroll employment: 186K (prev: -129K);
- Average hourly earnings (y/y): 3.6% (prev: 3.4%);
- JOLTS job openings: 6.866M (prev: 6.922M).
MONETARY POLICY
On May 15, Jerome Powell’s term as Chair of the Federal Reserve is set to expire. In the US Senate on Monday, Kevin Warsh’s nomination to the Federal Reserve Board of Governors advanced after lawmakers voted 49–44 to overcome a procedural hurdle.
Following Republican Senator Thom Tillis's removal of the blockade, Warsh is now widely expected to be confirmed as Fed Chair in the final vote later this week.
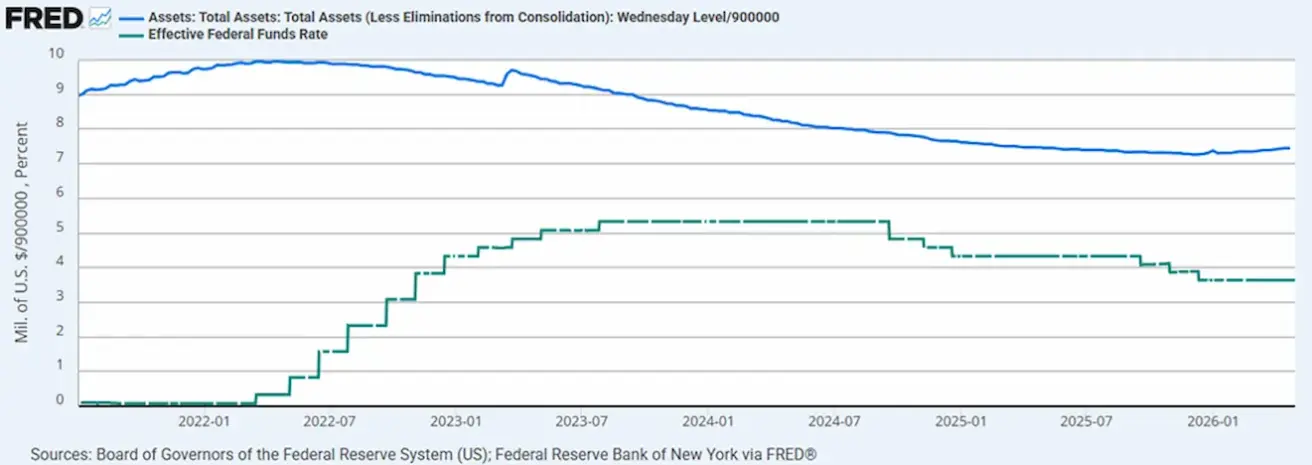
- Effective Federal Funds Rate (EFFR): 3.50%–3.75%;
- The Federal Reserve’s balance sheet stands at $6.709 trillion, up 2.66% since the halt of quantitative tightening (QT) ($6.535 trillion).
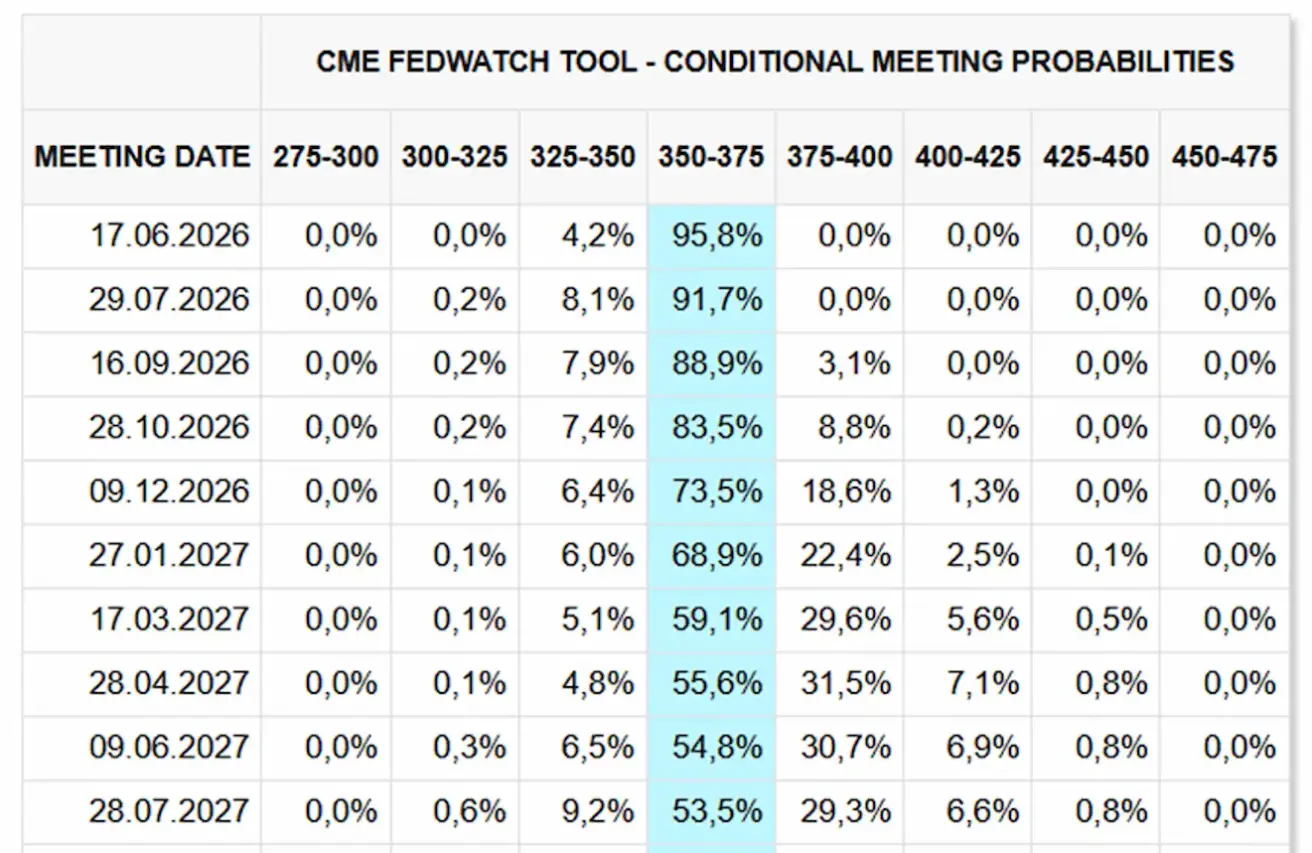
MARKET FORECAST FOR RATE (FEDWATCH)
At the next meeting (June 17), the estimated probability of the rate remaining unchanged stands at 95.78%.
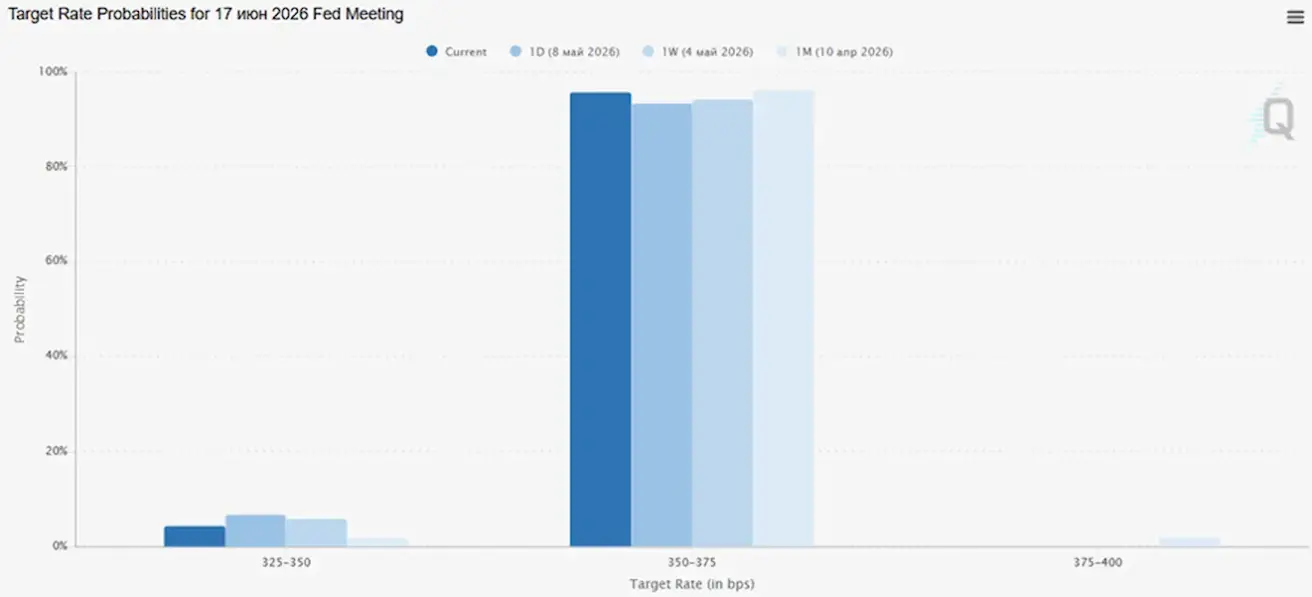
Over the next 12 months, the market is not currently pricing in rate cuts and does not anticipate any rate hikes.
Market
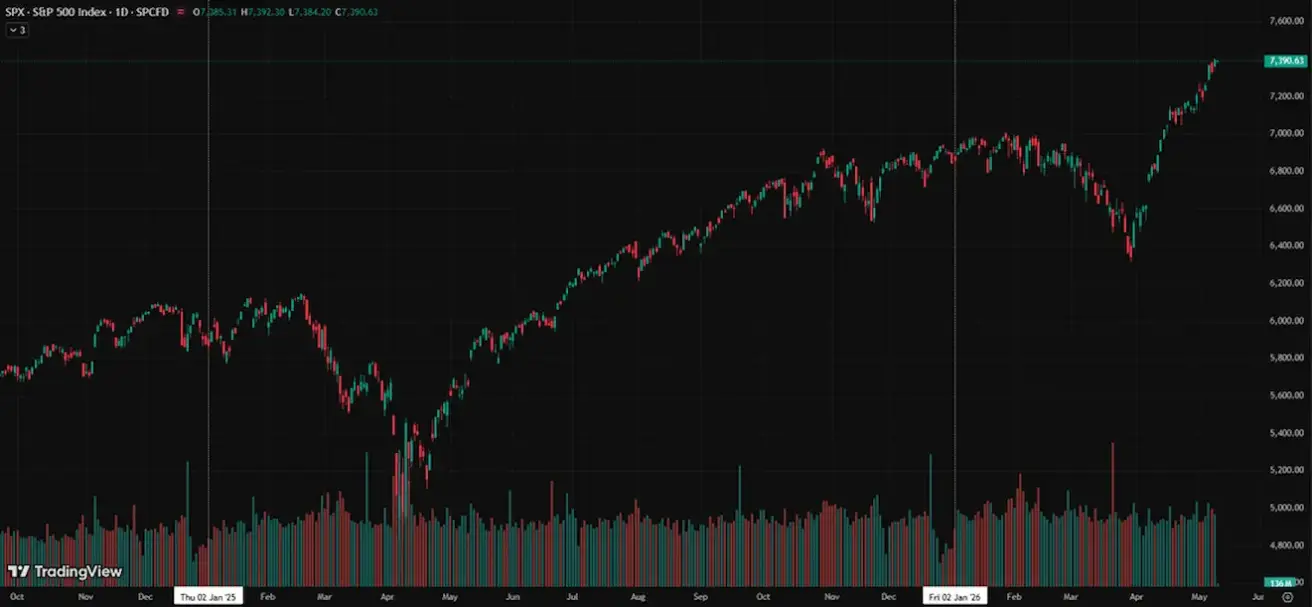
SP500
Weekly performance: +2,33% (week-end close at 7398,92); year-to-date: +8,08%.
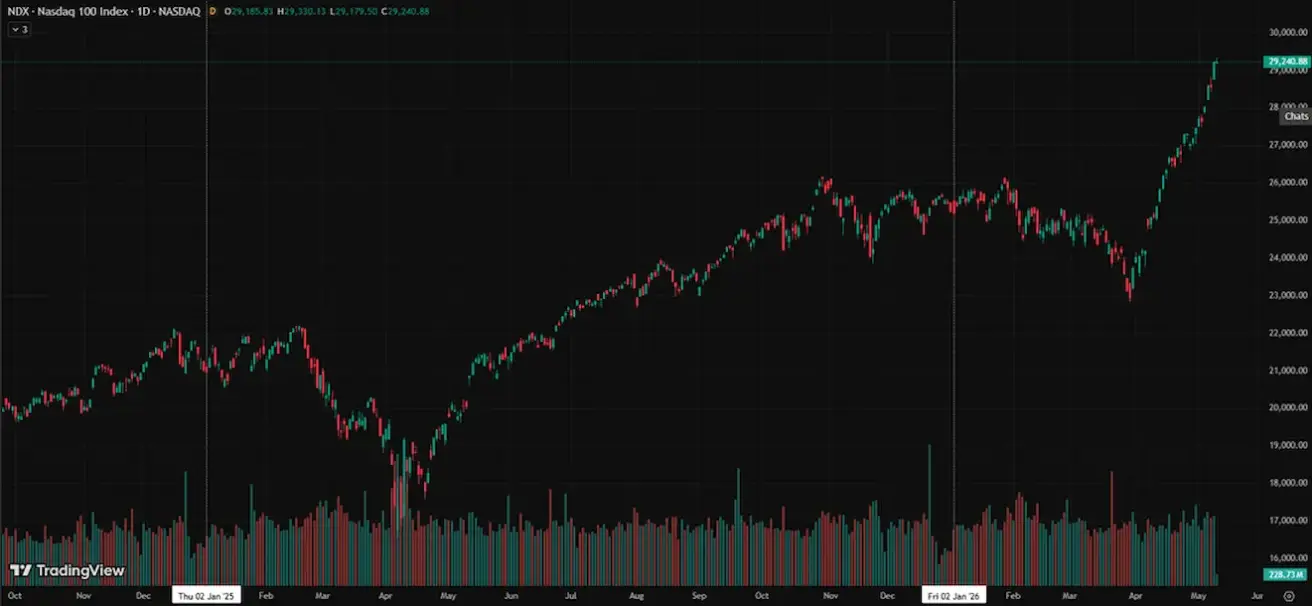
NASDAQ100
Weekly performance: +5,50% (week-end close at 29234,99); year-to-date: +15,78%.
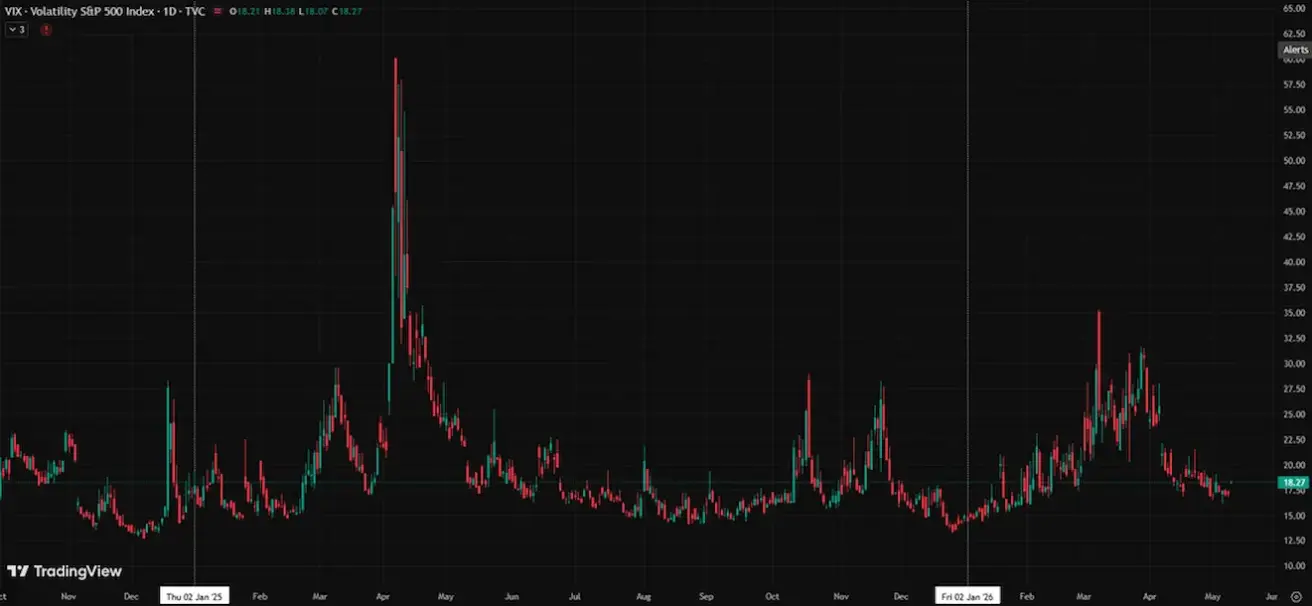
VIX
VIX (volatility index): week closing at 17,18 points.
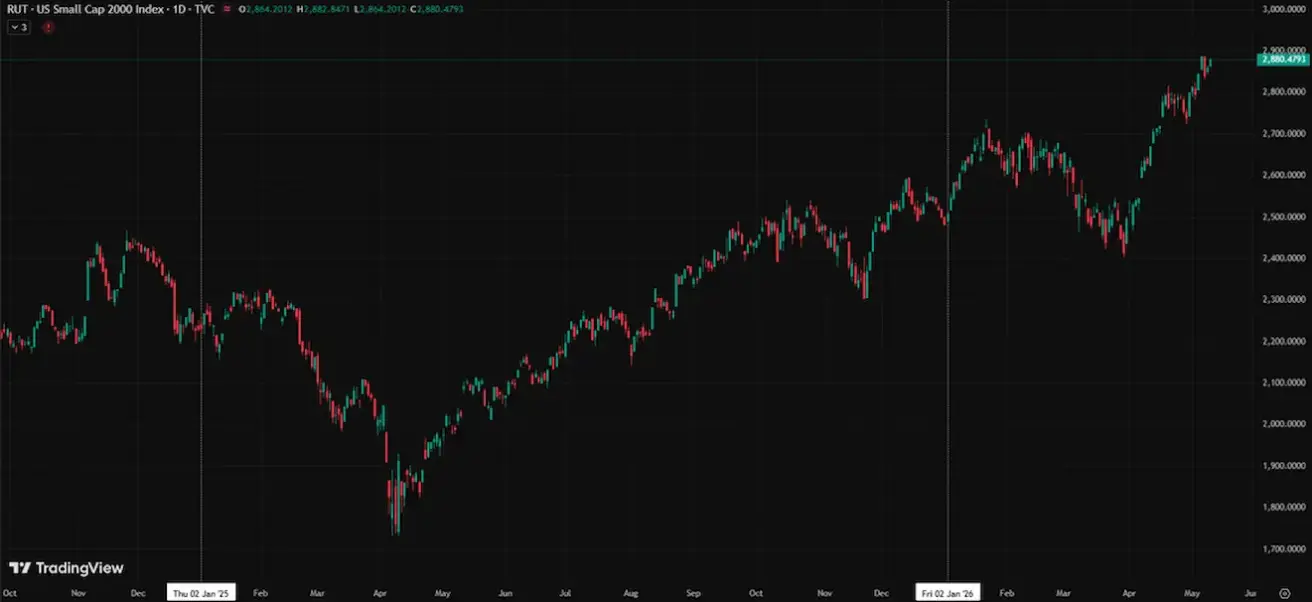
RUSSEL 2000 (RUT)
Weekly performance: +1,72% (week-end close at 2861,20); year-to-date: +15,28%.
The primary driver behind this performance has been a strong earnings season. The peak of the reporting season has already passed.
Among the companies that have already reported:
- 80% exceeded revenue expectations, above the 5-year average of 70% and the 10-year average of 67%;
- 84% beat EPS expectations, above the 5-year average of 78% and the 10-year average of 76%.
Forecast for net profit margins of S&P 500 companies (excluding the financial and utilities sectors):
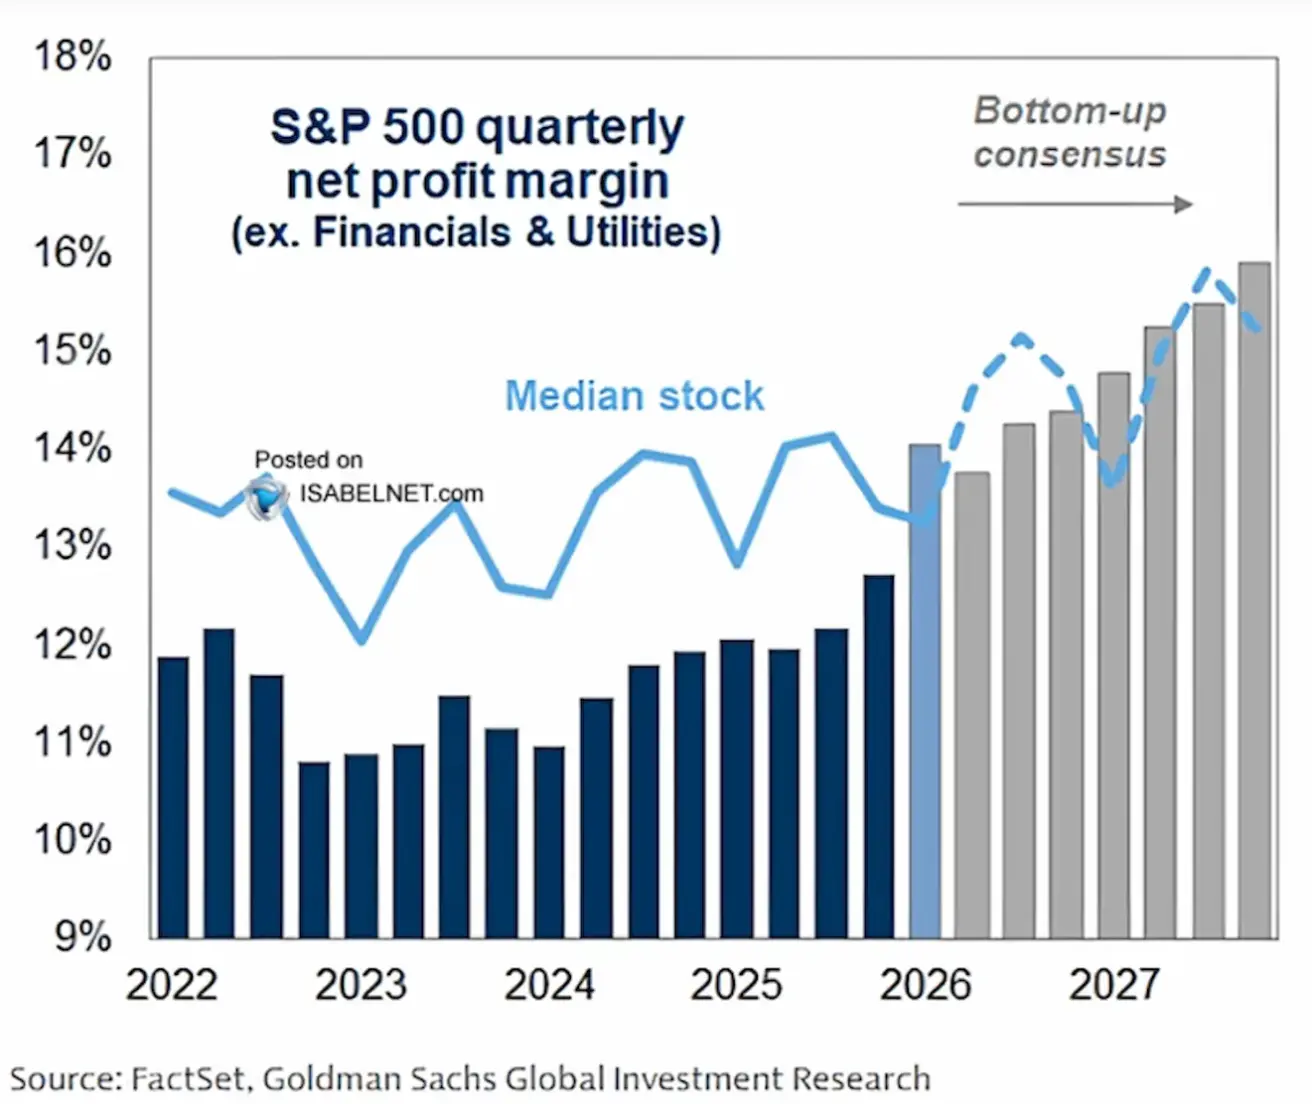
- Dark blue bars represent the actual corporate profit margins in 2022–2025;
- Grey bars represent the forecast for 2026–2027;
- The light blue line reflects the “median stock” — meaning not mega-cap tech companies, but rather the more “average” business within the index.
According to the forecast, a new cycle of profitability growth is expected. Following the margin compression in 2023 (driven by inflation, rising wages, and elevated funding costs), companies have gradually restored profitability. Consensus estimates now project net profit margins to rise to nearly 16% by 2027 — historically a very elevated level.
The forecast assumes that automation, AI, cost optimization, and technology scalability will continue to support further profit expansion.
A particularly important point is that profitability growth is expected not only among mega-cap tech companies, but across the broader market as well (as reflected by the light blue “median stock” line). Rising earnings and margin expansion remain a strong bullish factor.
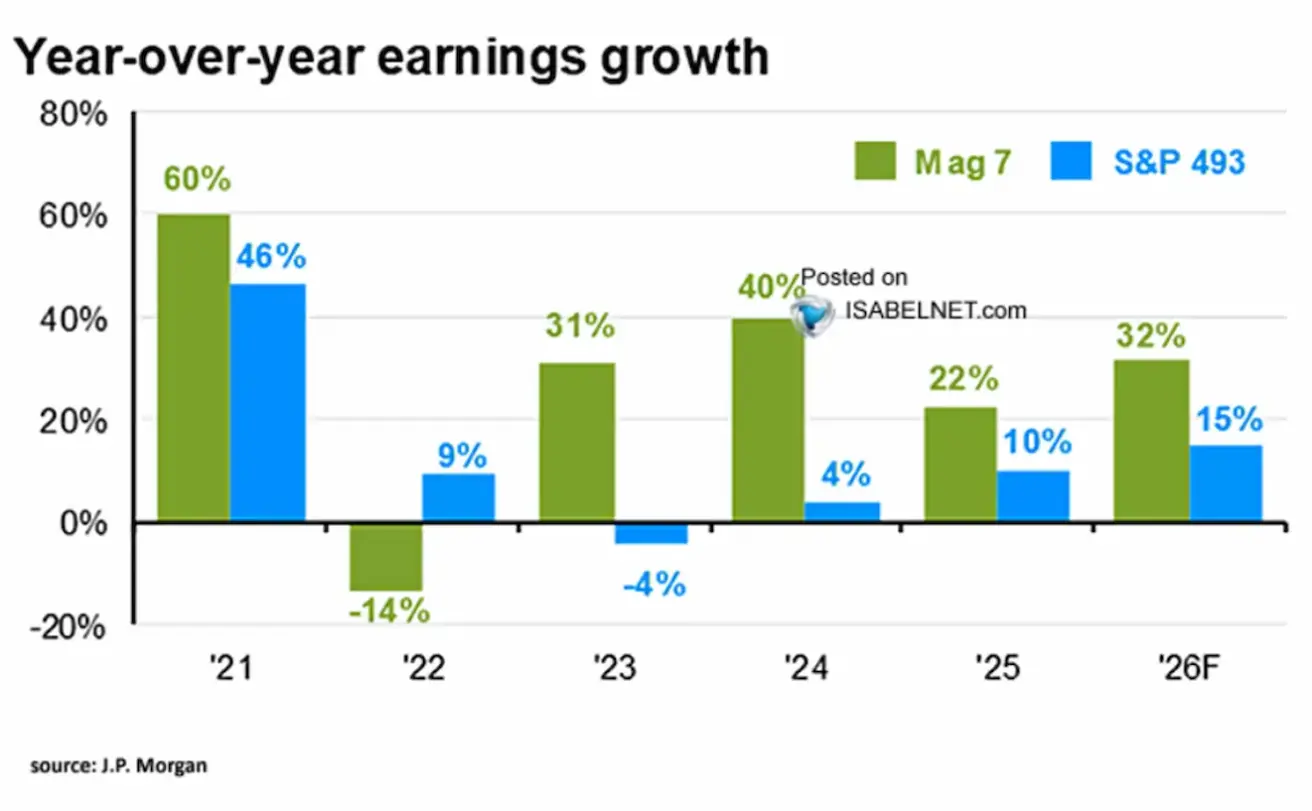
- Green bars represent the Magnificent 7 — the largest technology companies (Apple, Microsoft, Nvidia, Amazon, Alphabet, Meta, and Tesla);
- Blue bars represent the S&P 493 — the broader market excluding the Magnificent 7.
The key takeaway from the report is that earnings growth in the US remains heavily concentrated among the largest technology companies. The current bull market continues to be largely driven by AI catalysts and depends heavily on the profitability of major tech firms. However, earnings growth is expected to gradually broaden across a wider share of S&P 500 companies, reaching 15% by 2026.
Major banks’ forecasts for the S&P 500 by the end of 2026:
- Goldman Sachs reaffirmed its target of 7,600 points;
- HSBC raised its forecast to 7,650 from 7,500 points;
- Citi expects the S&P 500 to continue rising and to outperform other global equity markets;
- Yardeni increased its year-end 2026 target to 8,250 points from 7,700 and projects the S&P 500 could reach 10,000 points by 2029.
Selected earnings reports from last week:
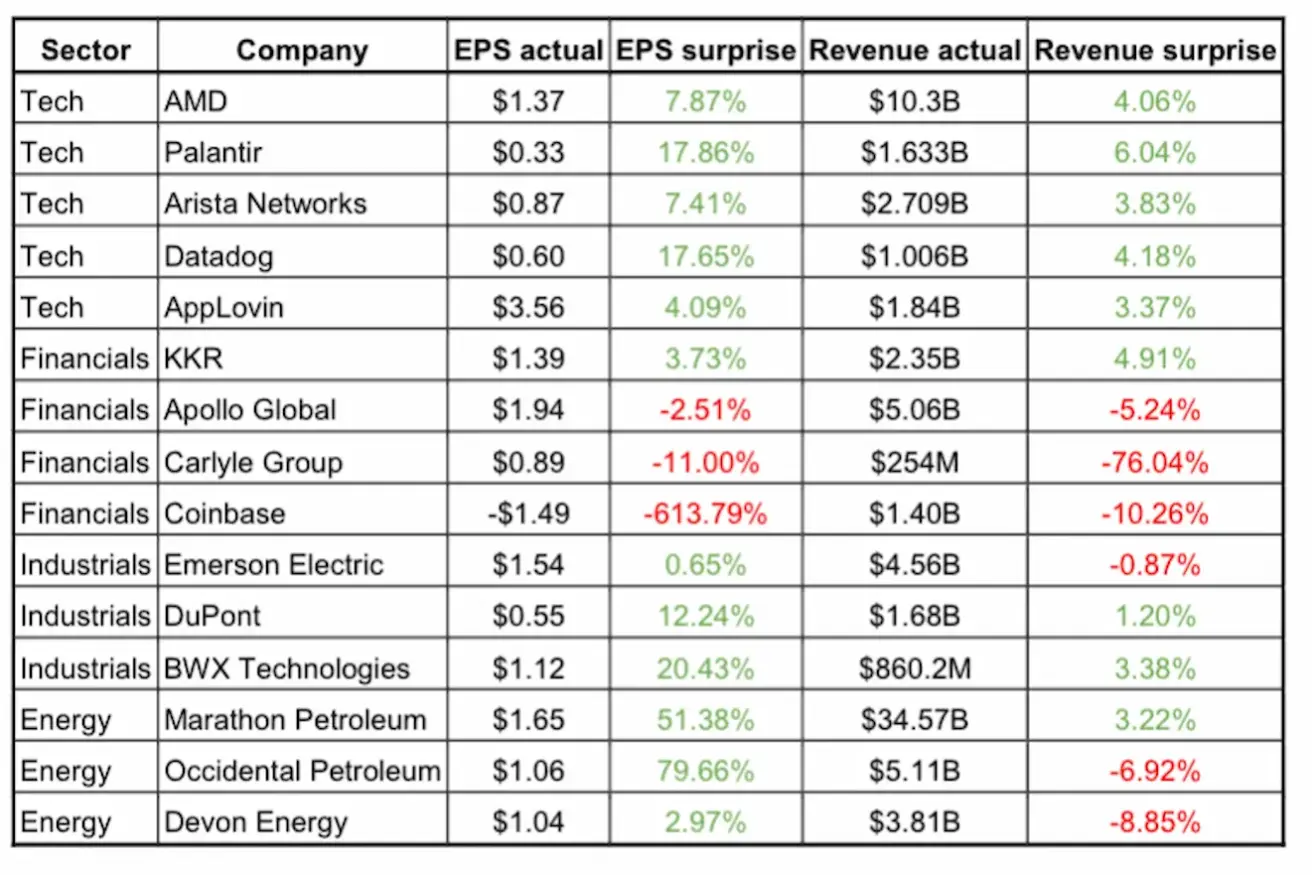
The technology sector outperformed the broader market, with most companies exceeding expectations on both EPS and revenue, particularly Datadog, Palantir, and AMD. AMD notably reported continued strong demand for its products.
The financial sector showed mixed performance: KKR remained resilient, while Apollo, Carlyle, and Coinbase demonstrated weaker results.
Industrial companies delivered generally solid results, supported by strong contributions from BWX and DuPont.
The energy sector surprised positively on earnings, particularly Occidental and Marathon, although revenue at some companies came in below expectations. Overall, the market responded more favorably to profitability than to top-line performance.
Eurozone
- Interest rates remain unchanged for now, although inflationary risks are rising;
- The monetary policy stance remains neutral, but the balance of risks has shifted toward inflation;
- Amid the escalating conflict in the Middle East, the ECB revised its GDP growth forecasts downward and raised its inflation projections for the coming years.
Interest rates
- Deposit facility rate: 2.0% (previously 2.0%);
- Marginal lending facility rate: 2.4% (previously 2.4%) — the rate at which banks can obtain overnight funding from the regulator;
- Main refinancing (policy) rate: 2.15% (previously 2.15%).
The rhetoric from ECB officials is becoming increasingly cautious:
Austrian National Bank Governor Martin Kocher stated that the conflict in the Middle East poses serious risks to the Eurozone’s economic recovery by intensifying inflationary pressures. As of May 2026, the regulator views the situation as challenging, warning that elevated energy prices could keep inflation above the ECB’s 2% target.
Bank of Greece Governor Yannis Stournaras officially stated that concerns about a recession in the Eurozone are “real and justified.” He emphasized that the regulator’s response will depend on the shock's intensity and duration. If the inflation spike proves temporary, no adjustment to monetary policy will be required. However, a persistent deviation of inflation from the 2% target would require a “decisive response.”
Olli Rehn (Governor of the Bank of Finland) and François Villeroy de Galhau (Governor of the Bank of France) also confirmed that the ECB must remain prepared to tighten policy if necessary. However, their rhetoric remains cautious for now, emphasizing a data-driven approach rather than an automatic response to current events.
Overall, the ECB continues to view the duration of the conflict as the key factor in determining the European economy.
Inflation: Consumer Price Index (CPI) (April, preliminary data):
- Core CPI (YoY): 2.2% (previous: 2.3%);
- CPI: (MoM) 1.0% (previous: 1.3%); (YoY) 3.0% (previous: 2.6%).
GDP for Q1 (preliminary):
- QoQ: 0.1% (previous: 0.2%, revised);
- YoY: 0.8% (previous: 1.2%).
Unemployment rate (March): 6.3% (previous: 6.2%).
Industrial production volume (MoM) (February): 0.4% (previous: -0.8%).
Purchasing Managers’ Index (PMI) (April): remains in expansion territory, but momentum is slowing.
- Services sector: 47.6 (previous: 50.2);
- Manufacturing sector: 52.2 (previous: 51.6);
- S&P Global Composite: 48.6 (previous: 50.7).
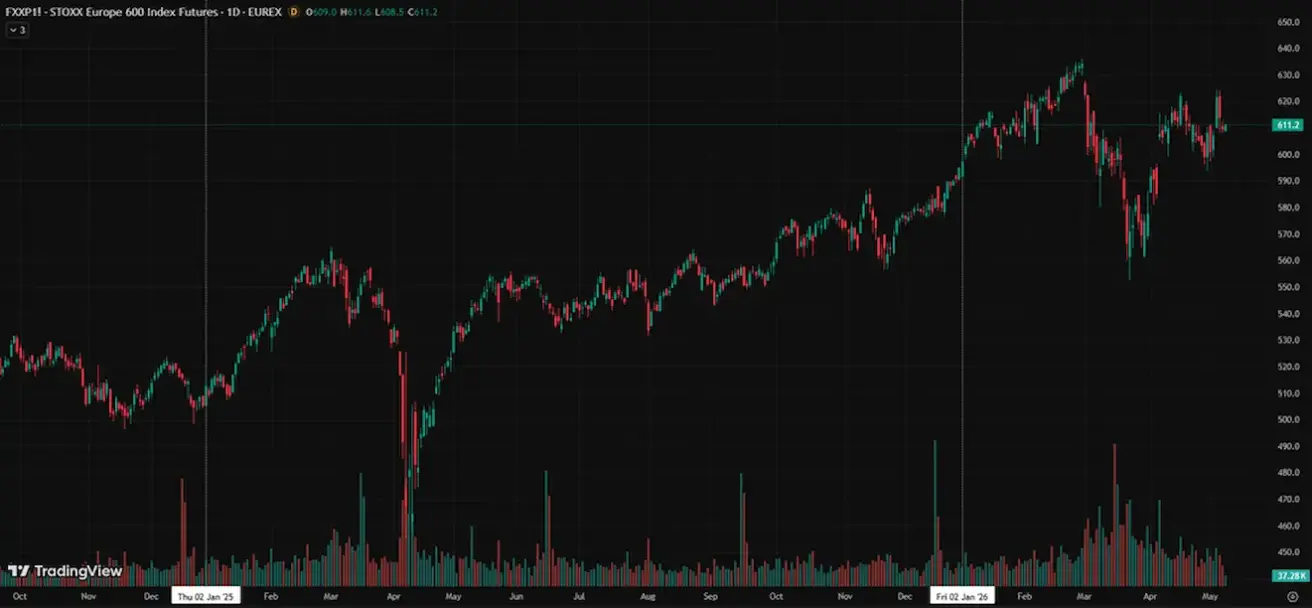
EURO STOXX 600 (FXXP1!)
Weekly performance: +0,23% (Week-end close: 609,6); Year-to-date: +2,63%.
China
The economy is stabilizing on the back of exports, while domestic demand and investment are gradually recovering. Policy stimulus remains targeted and cautious.
- Interest rates remain unchanged;
- The monetary policy stance remains accommodative;
- China reaffirmed its commitment to fiscal support for economic growth under its 2026 plan, including measures to stimulate domestic demand, optimize tax incentives and subsidies, and modernize industry.
Interest rates:
- 1Y Loan Prime Rate (medium-term lending rate): 3.00%;
- 5Y Loan Prime Rate (five-year rate influencing mortgage lending): 3.50%.
Inflation indicators (April):
- Consumer Price Index (CPI): MoM: +0.3% (previous: -0.7%); YoY: 1.2% (previous: 1.0%);
- Producer Price Index (PPI): YoY: +2.8% (previous: -0.5%).
GDP for Q1 2026:
- QoQ: 1.3% (previous: 1.2%);
- YoY: 5.0% (previous: 4.5%).
Unemployment rate (March): 5.4% (previous: 5.3%). Industrial production (March, YoY): 6.1% (previous: 6.3%). Fixed asset investment (March, YoY): 1.7% (previous: 1.8%). Retail sales (March, YoY): 0.9% (previous: 1.3%). Import volume (April, YoY): 25.3% (previous: 27.8%). Export volume (April, YoY): 14.1% (previous: 2.5%). Trade balance (April, YoY, USD): $84.80 billion (previous: $51.13 billion).
Purchasing Managers’ Index (PMI) (March):
- Manufacturing sector: 50.3 (previous: 50.4);
- Non-manufacturing sector: 49.4 (previous: 50.1);
- Composite PMI: 50.1 (previous: 50.5).
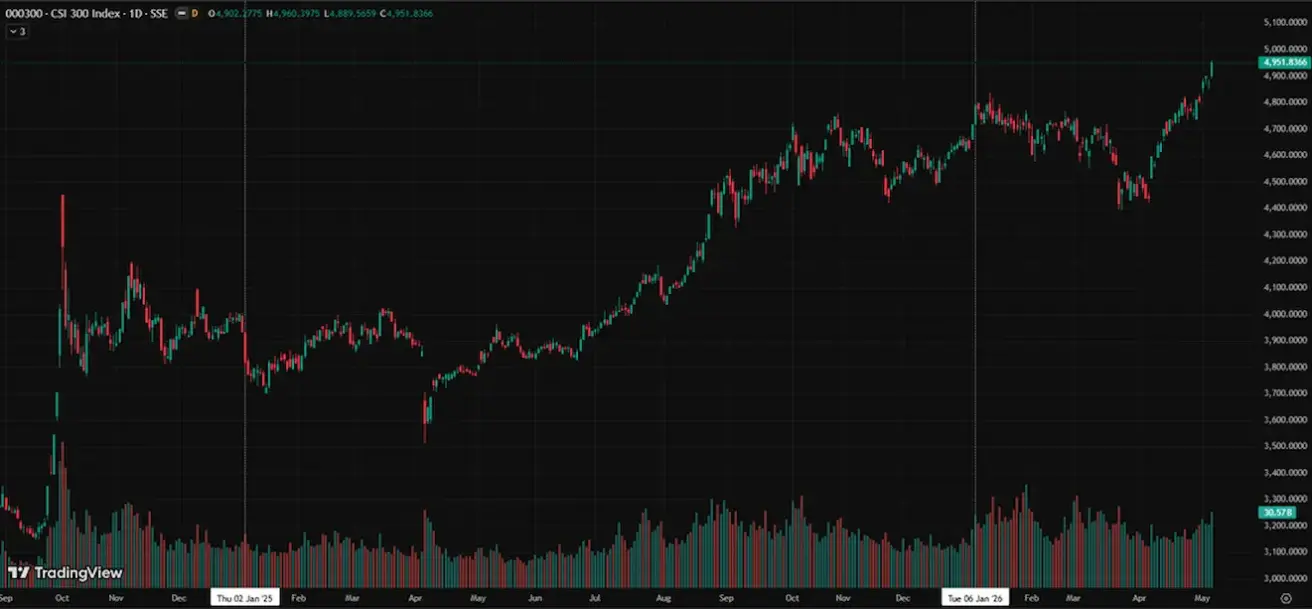
CSI 300 INDEX (000300.HK)
Weekly performance: +1,34% (week-end close at 4871,81); Year-to-date: +4,51%.
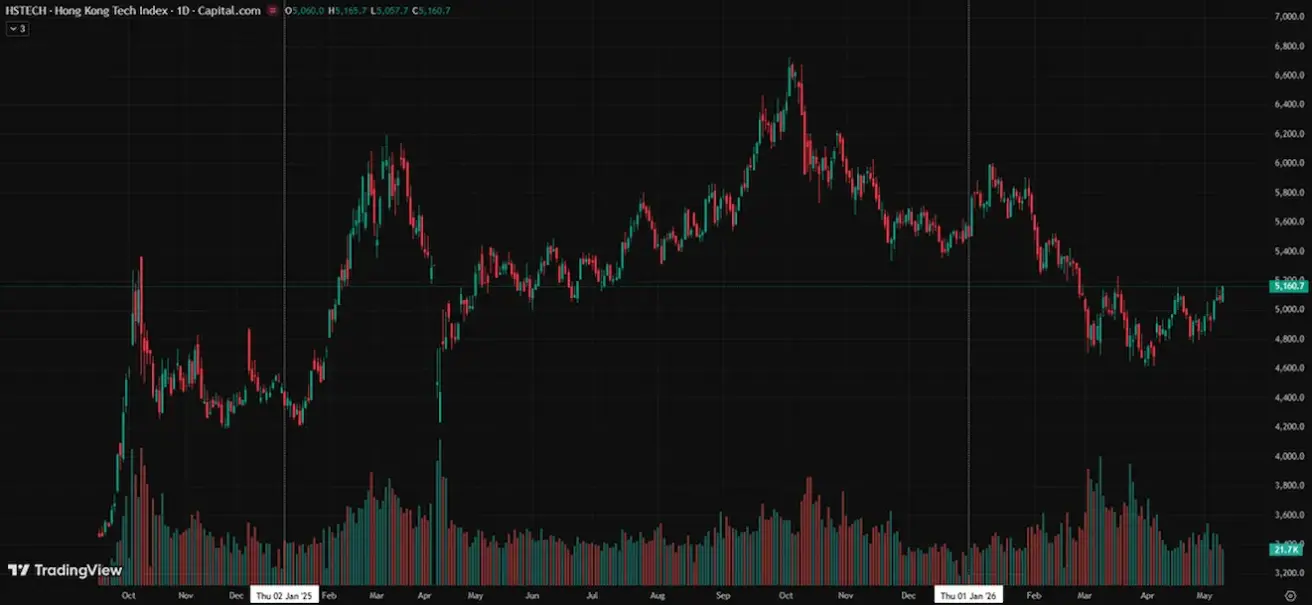
Hang Seng TECH Index (HSTECH)
Weekly performance: +2,37% (week-end close: 5072,5); year-to-date: -7,85%.
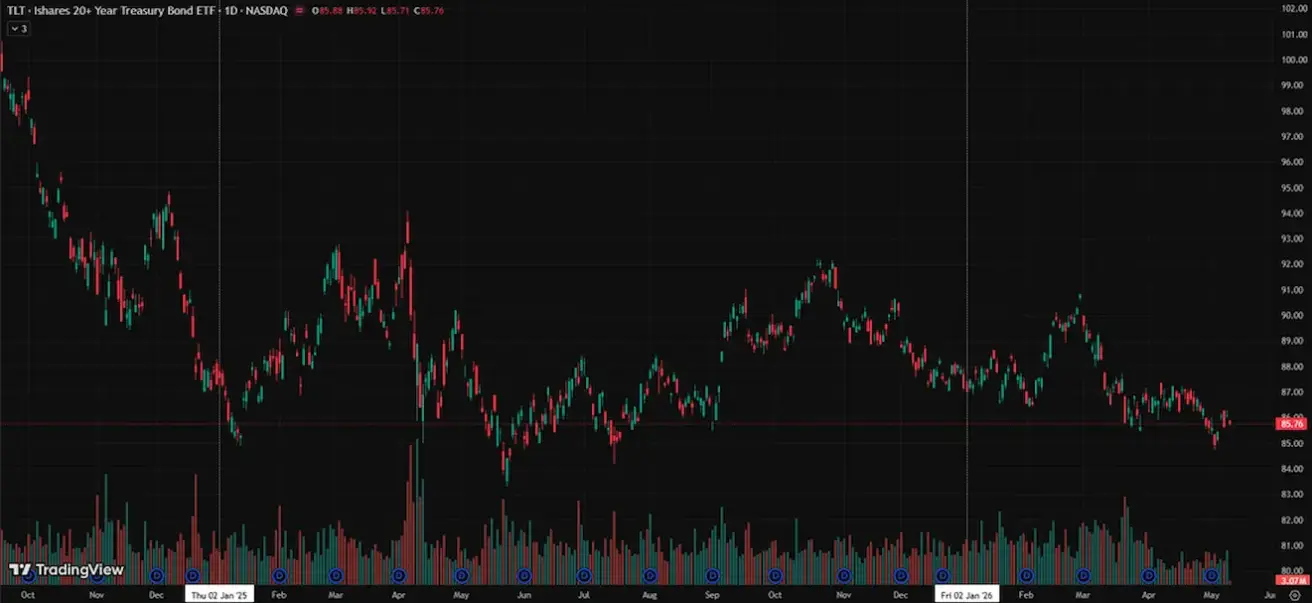
BOND MARKET
U.S. Treasuries 20+ (ETF TLT): weekly performance: +0,55% (week close: 86,08); year-to-date: -1,24%.
YIELDS AND SPREADS
Market Yield on U.S. Treasury Securities at 10-Year Constant Maturity: 4.39% (previous: 4.39%); 2-Year Treasury Yield: 3.92% (previous: 3.88%);
ICE BofA BBB US Corporate Index Effective Yield: 5.27% (previous: 5.32%).
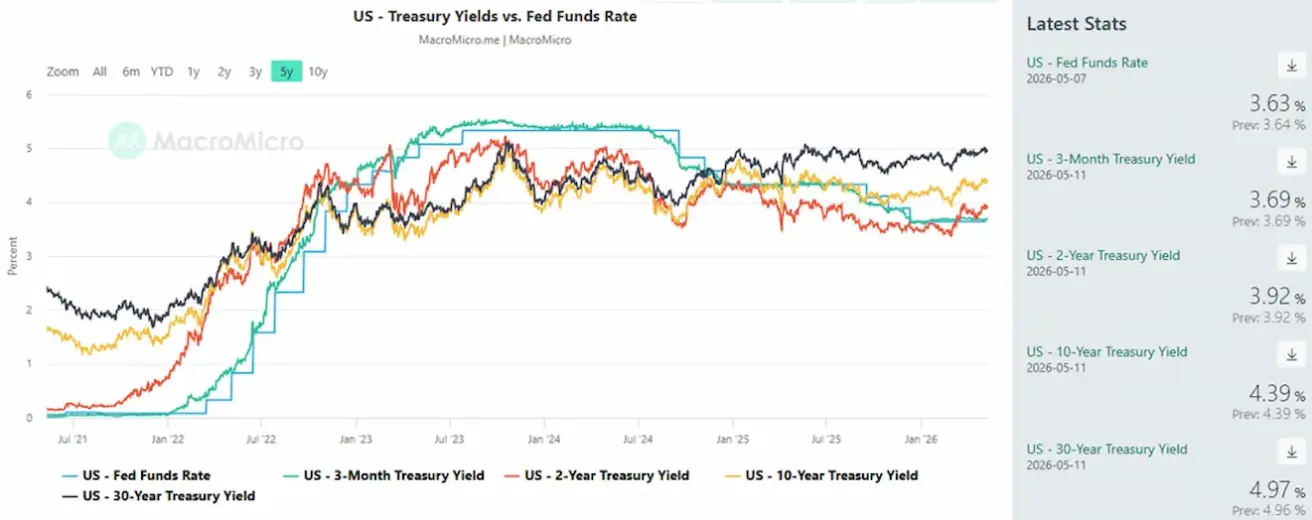
- The yield spread between 10-year and 2-year US Treasury securities stands at 47 basis points (previous: 51);
- The yield spread between 10-year and 3-month US Treasury securities stands at 70 basis points (previous: 73).
The cost of the 5-year US credit default swap (CDS) — insurance against default — stands at 35.08 bps (vs. 35.04 bps last week).
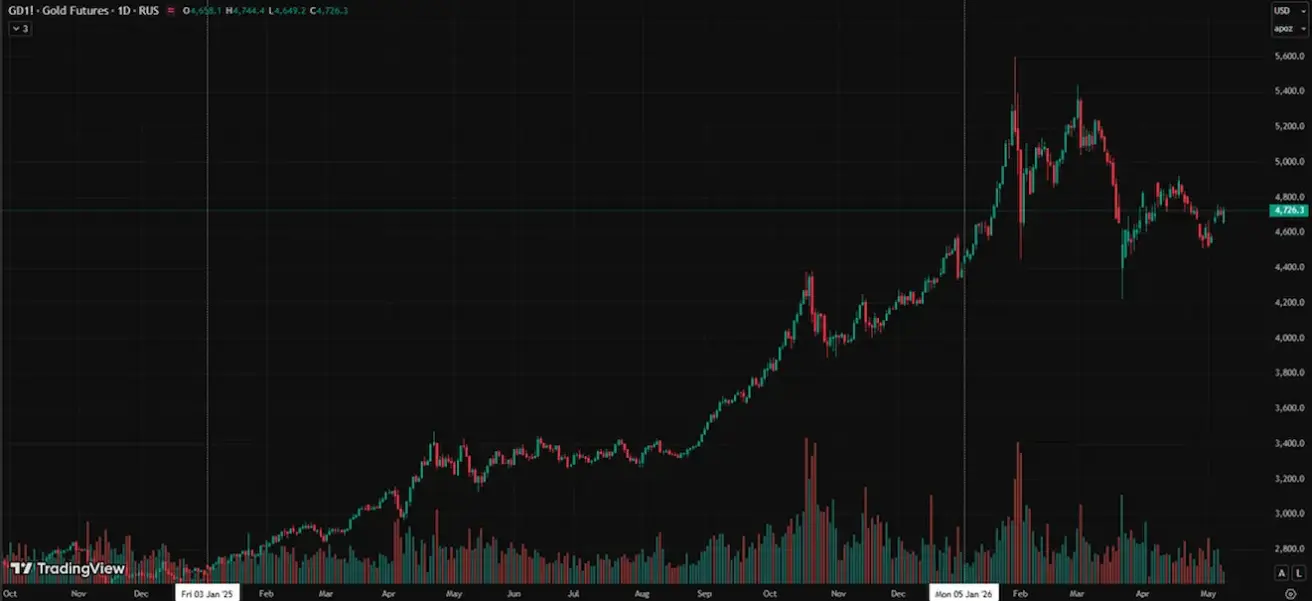
GOLD FUTURES (GC)
Weekly performance: +1,36% (week close: $4707,5 per troy ounce); Year-to-date: +8,67%.
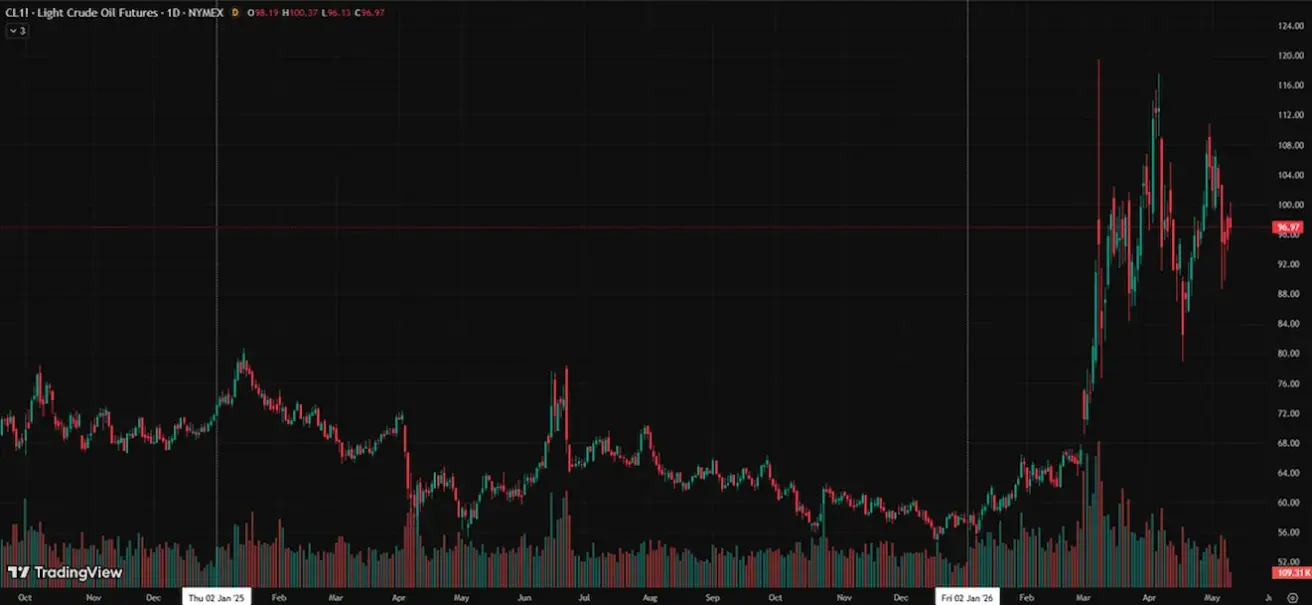
OIL FUTURES
Weekly performance: -6,40% (week-end close: $95,42 per barrel). Year-to-date performance: +66,21%.
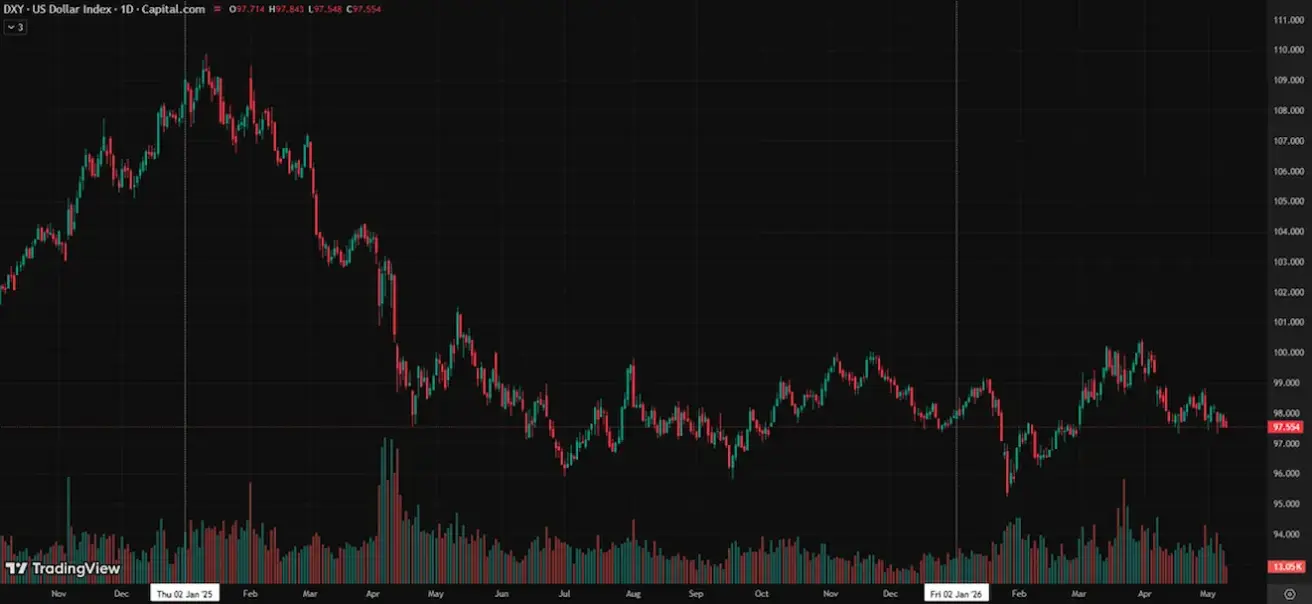
DOLLAR INDEX FUTURES (DX)
Weekly performance: -0,68% (week-end close: 97,543). Year-to-date performance: -0,46%.
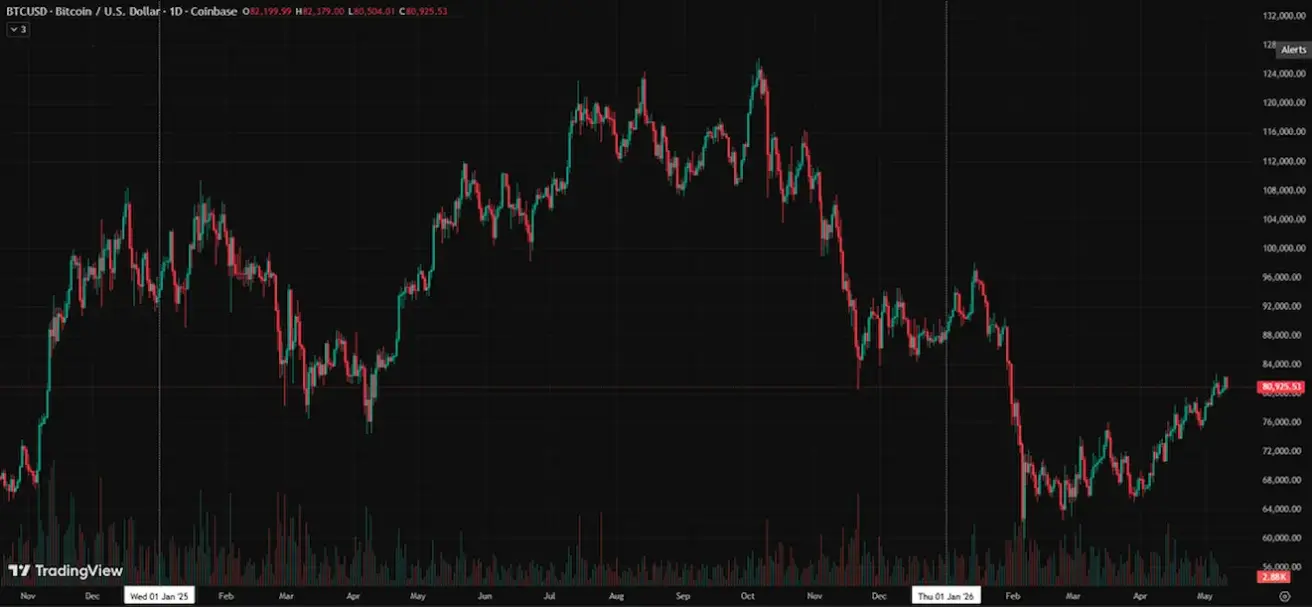
BTC FUTURES
Weekly performance: +4,63% (week-end close: $ 82199,9); year-to-date: - 6,29%.
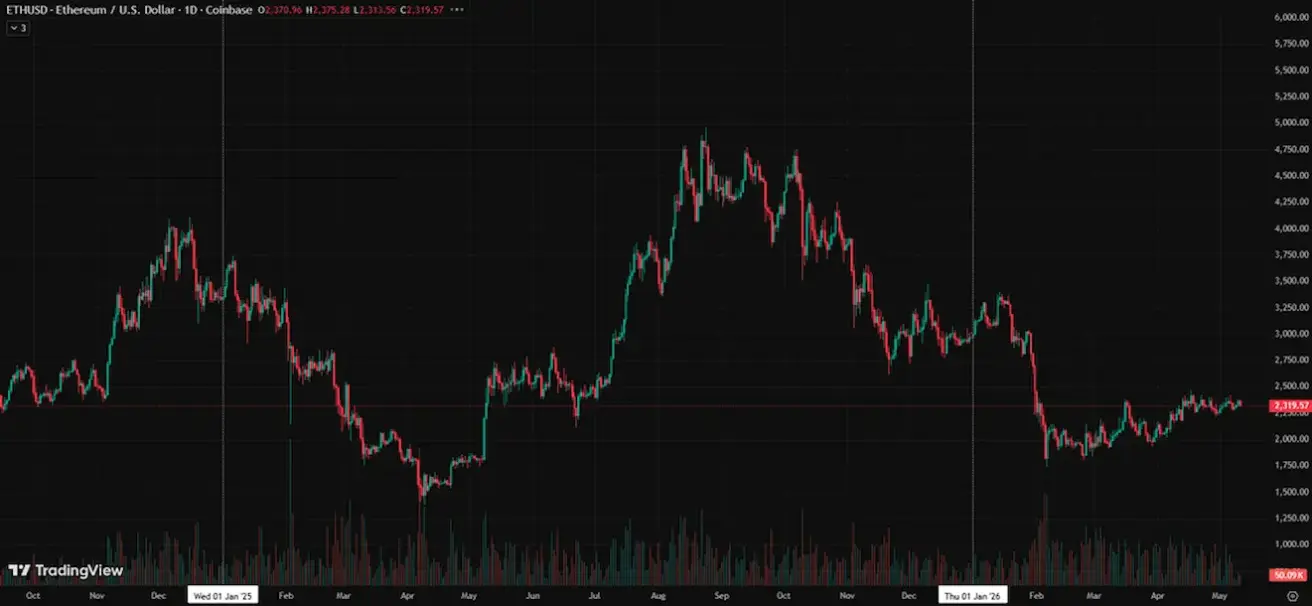
ETH FUTURES
Weekly performance: +2,10% (week-end close: $2371,12); year-to-date: -20,27%.
Corporate BTC reserves continue to expand. As of the end of Q1 2026, publicly listed companies held 1.15 million BTC (approximately 5.5% of Bitcoin’s total supply):
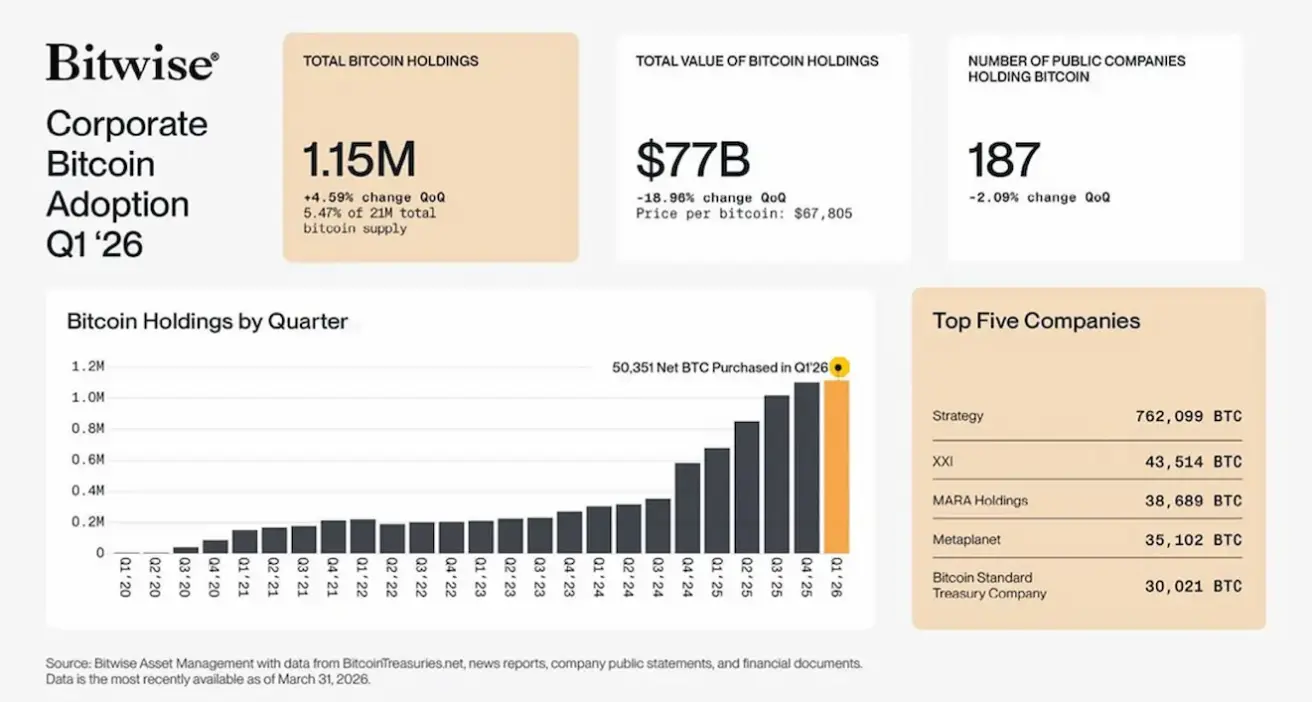
Bitcoin is becoming increasingly integrated into corporate balance sheets, while institutional demand is emerging as one of the market’s key drivers. Despite ongoing volatility, companies continue to expand their positions, reducing the available supply of BTC and reinforcing the market’s structural support.
TOTAL CRYPTOCURRENCY MARKET CAPITALIZATION
Total crypto market capitalization: $2,69 trillion (vs $2,65 trillion a week earlier) (coinmarketcap.com).
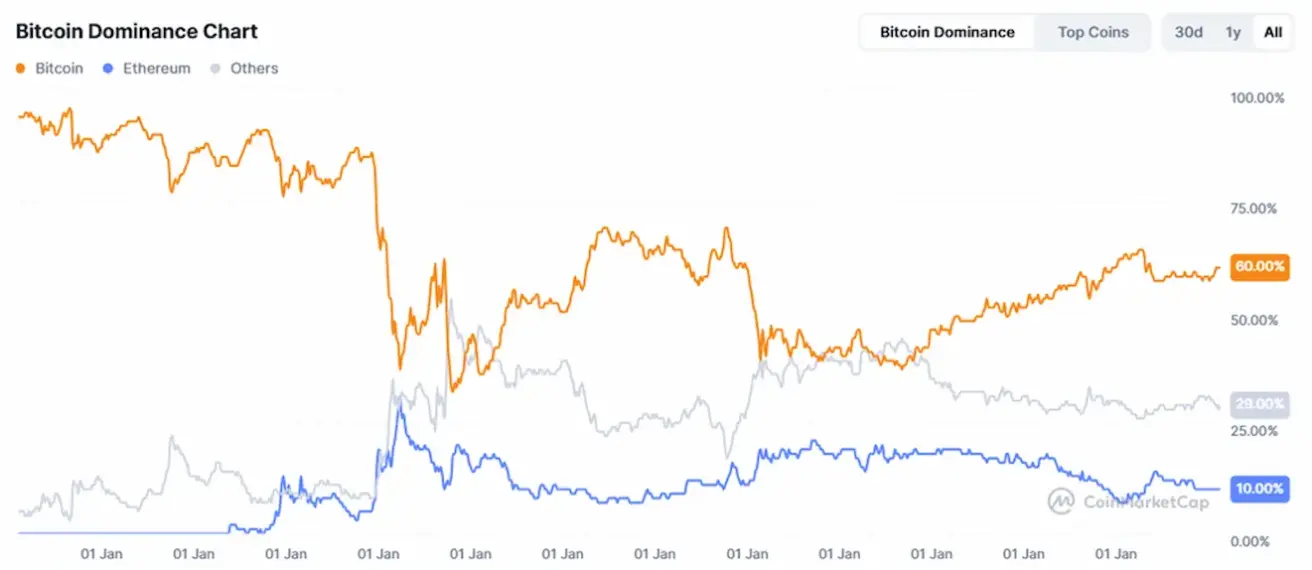
Crypto asset market shares:
- Bitcoin: 60.1% (60.4%)
- Ethereum: 10.4% (10.8%)
- Others: 29.5% (28.8%).
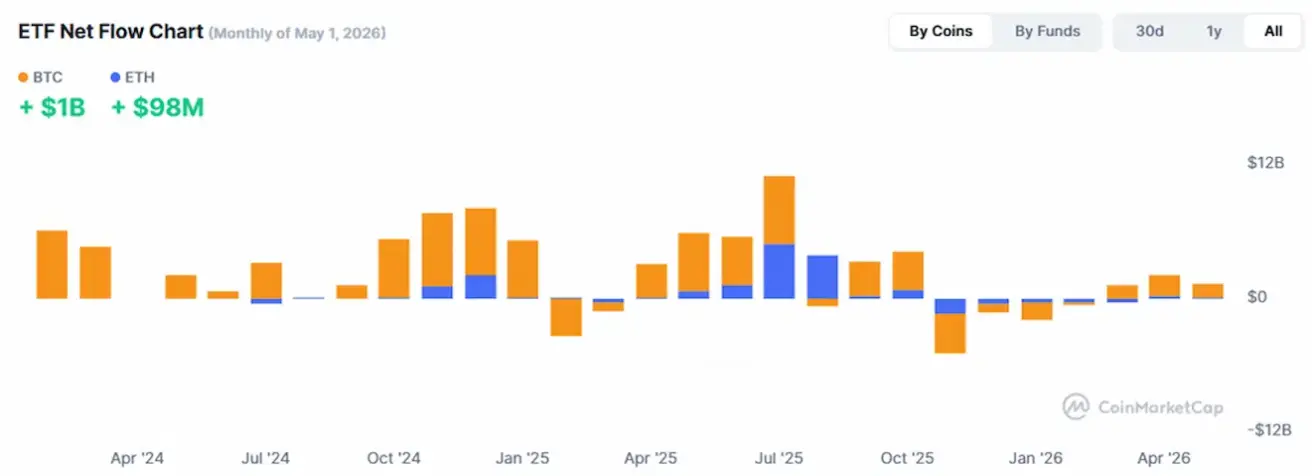
ETF Net Flows Chart: