Lietuvių
 Русский
 Қазақша
 Eesti
EestiApril 20 – 26, 2026: Weekly economic update
Key market updates

United States (key takeaways):
- The policy rate remains unchanged, with a cautious tone in guidance;
- The monetary policy stance remains moderately restrictive;
- U.S. macroeconomic data continue to support a soft-landing scenario: inflationary risks are edging higher, while the labor market is cooling without signs of recession and, at this stage, does not warrant a rate cut.
Macroeconomic Statistics
INFLATION: CONSUMER PRICE INDEX (MARCH):
- Core CPI: (MoM) 0.2% (prev: 0.2%); (YoY) 2.6% (prev: 2.5%).
- CPI: (MoM) 0.9% (prev: 0.3%); (YoY) 3.3% (prev: 2.4%).
PRODUCER PRICE INDEX (FEBRUARY):
- PPI (m/m): 0.5%, prev: 0.7%.
- Core PPI (m/m): 0.1%, prev: 0.3%:
INFLATION EXPECTATIONS (MICHIGAN) (MARCH):
- 12-month inflation expectations: 4.7% (prev: 3.8%);
- 5-year inflation expectations: 3.5% (prev: 3.2%).
GDP (U.S. Bureau of Economic Analysis, BEA) (Q4 2025, annualized, third estimate): +0.5% (second estimate: 0.7%; Q3 2025: +4.4%).
The GDPNow indicator (a “real-time” estimate ahead of the official release) by the Federal Reserve Bank of Atlanta stands at 1.2% (previous: 1.3%).
BUSINESS ACTIVITY INDEX (PMI)(APRIL, PRELIMINARY DATA):
(Above 50 indicates expansion; below 50 indicates contraction)
- Services sector: 51.3 (prev: 49.8);
- Manufacturing sector: 54.0 (prev: 52.3);
- S&P Global Composite: 52.0 (prev: 50.3).
LABOR MARKET (BLS) (MARCH)
- Unemployment rate: 4.3% (prev: 4.4%);
- Total number of continuing jobless claims in the U.S.: 1,818K (prev: 1,794K);
- Initial jobless claims: 207K (prev: 219K);
- Change in nonfarm payroll employment: 178K (prev: -133K);
- Change in private nonfarm payroll employment: 186K (prev: -129K);
- Average hourly earnings (y/y): 3.5% (prev: 3.8%);
- JOLTS job openings: 6.542M (prev: 6.928M).
MONETARY POLICY
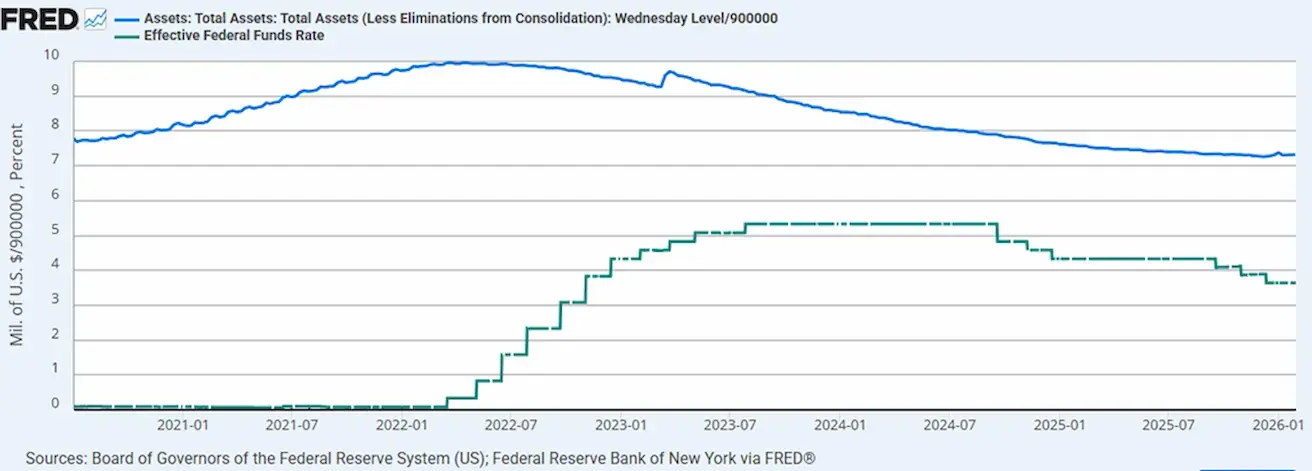
- Effective Federal Funds Rate (EFFR): 3.50%–3.75%;
- The Federal Reserve’s balance sheet stands at $6.707 trillion, up 2.63% since the halt of quantitative tightening (QT) ($6.535 trillion).
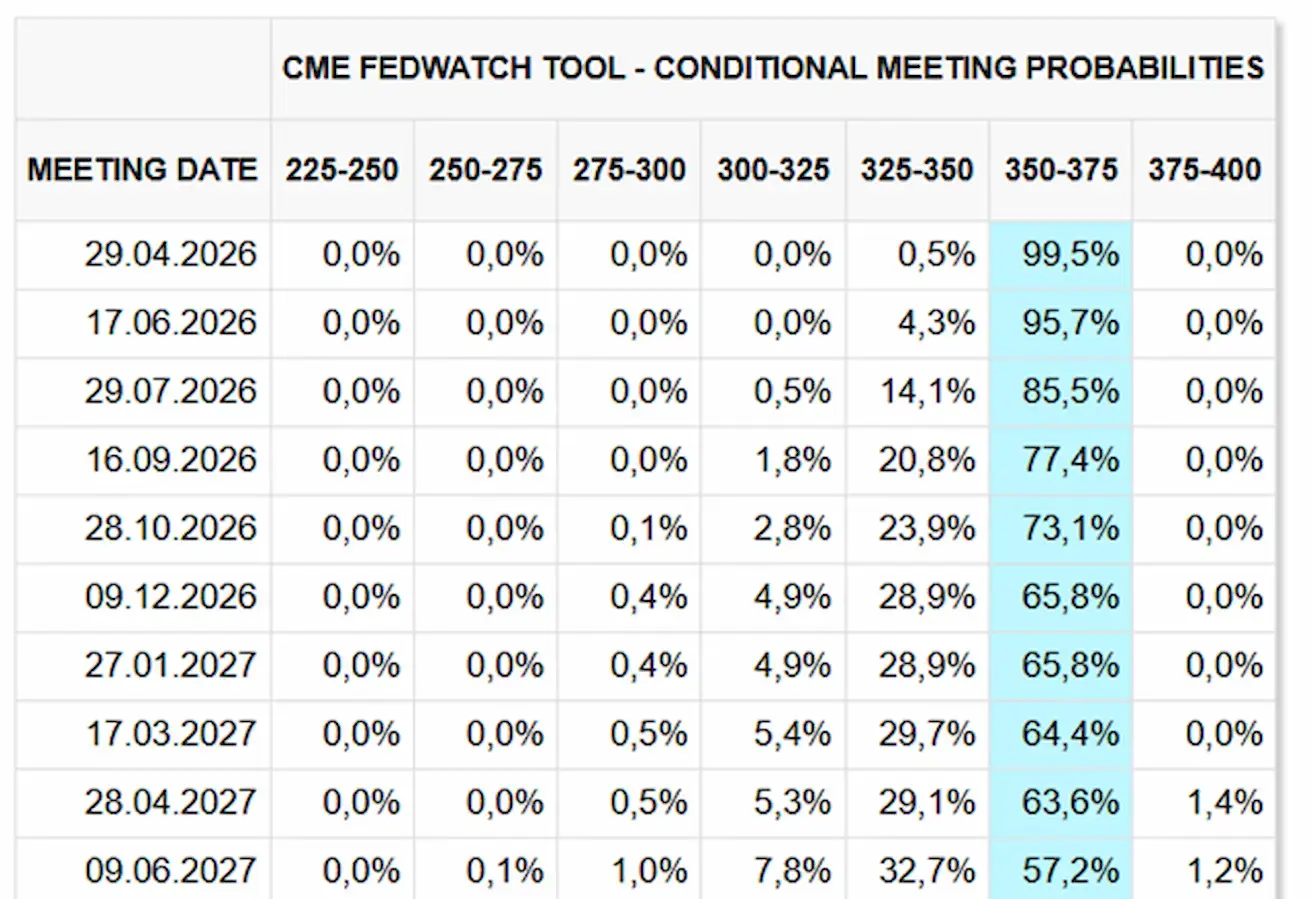
MARKET FORECAST FOR RATE (FEDWATCH)
For the upcoming meeting (April 29), the estimated probability of the rate remaining unchanged stands at 99.50%.
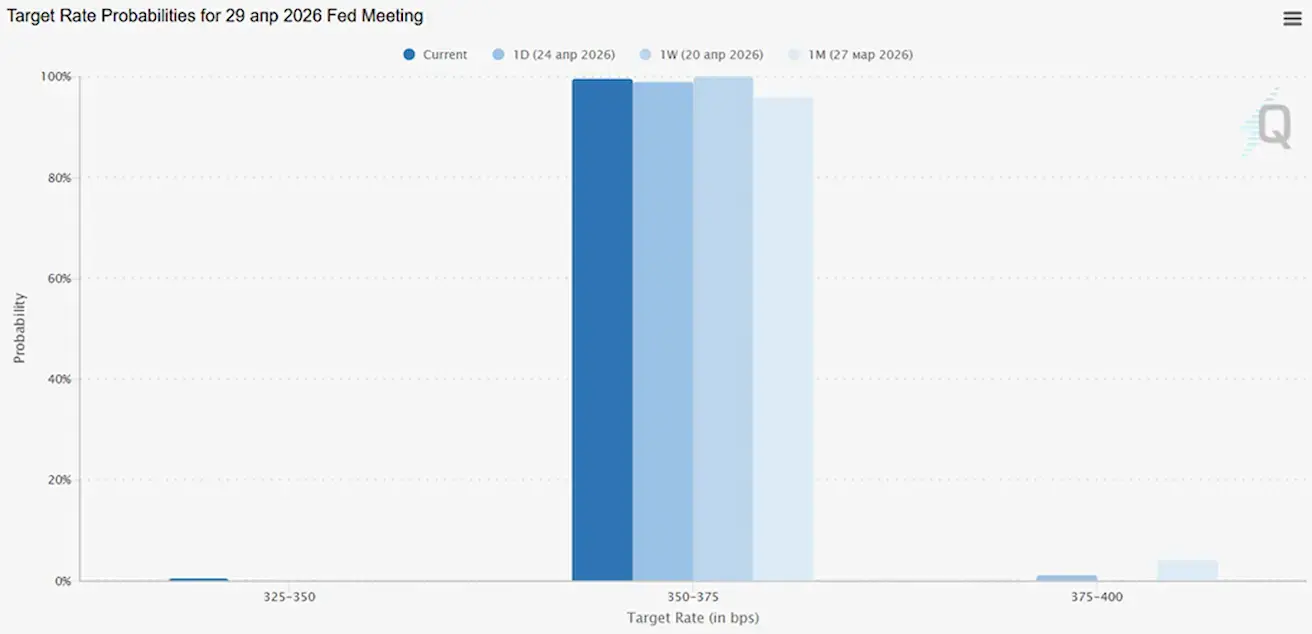
Over the next 12 months, the market is not pricing in any rate cuts and does not anticipate rate hikes.
Market
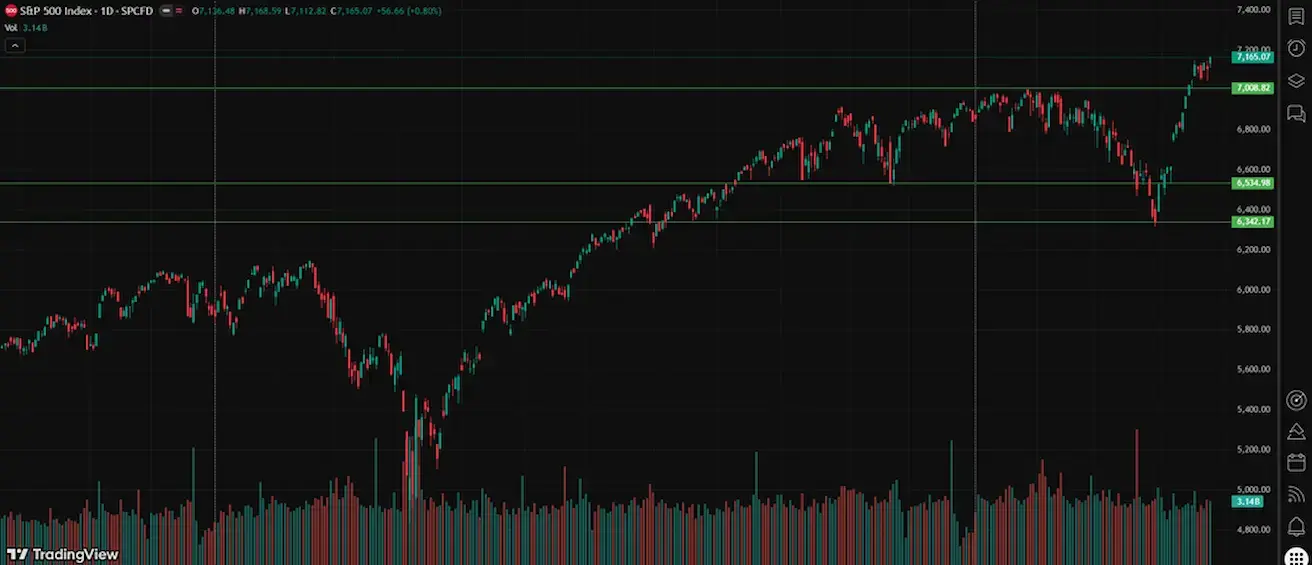
SP500
Weekly performance: +0.55% (week-end close at 7165,07); year-to-date: +4,67%.
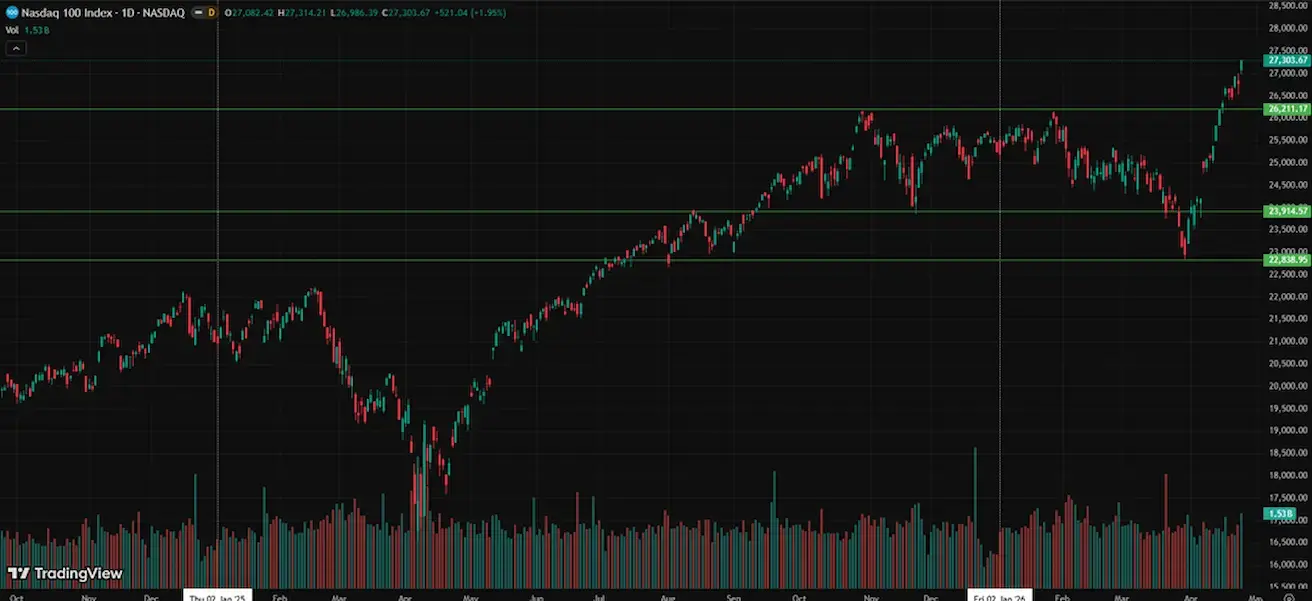
NASDAQ100
Weekly performance: +2,37% (week-end close at 27303,67); year-to-date: +8,13%.
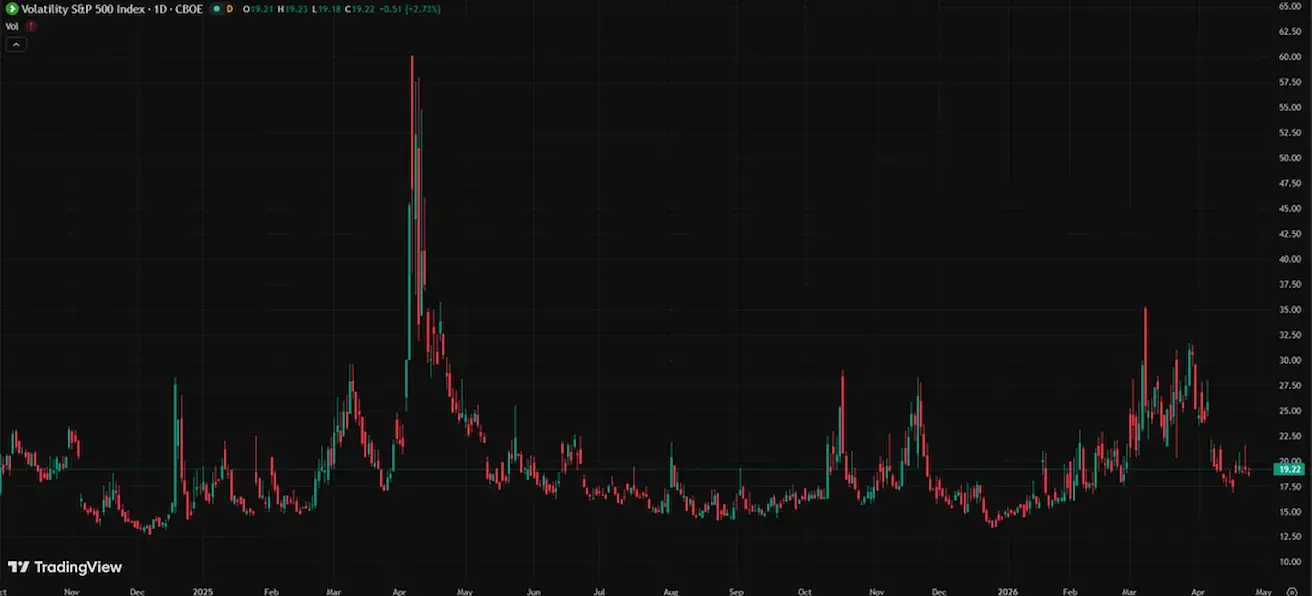
VIX
VIX (volatility index): week closing at 18.71 points.
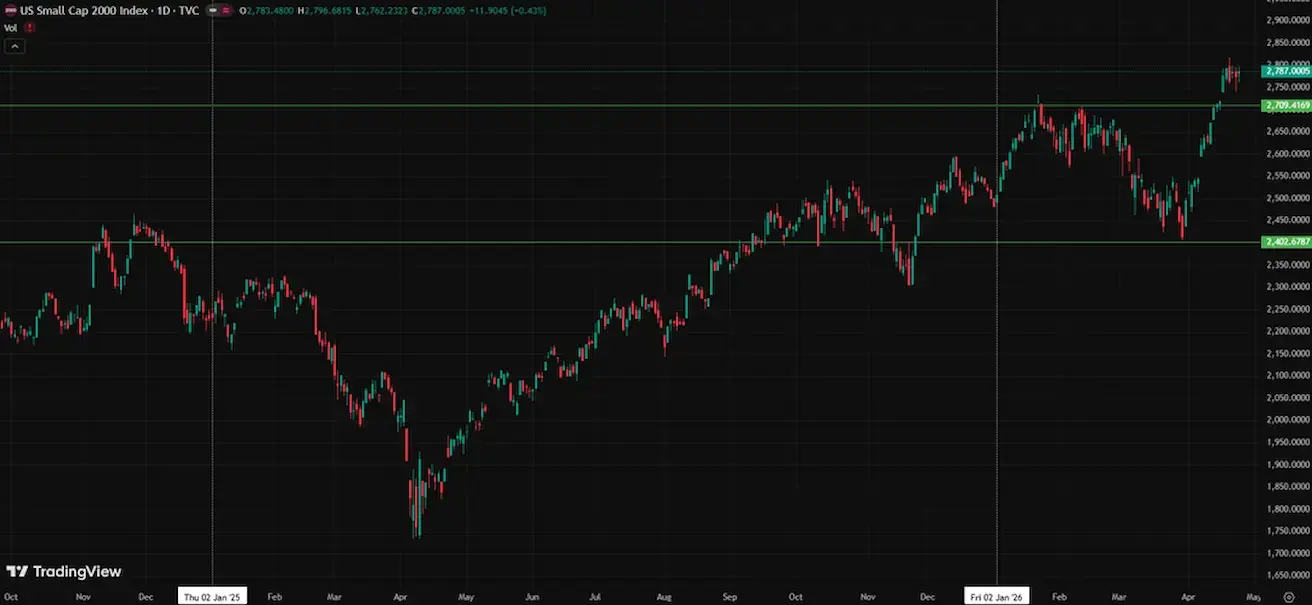
RUSSEL 2000 (RUT)
Weekly performance: +0,36% (week-end close at 2787,00); year-to-date: +12,29%.
U.S. Equity Market Assessment:
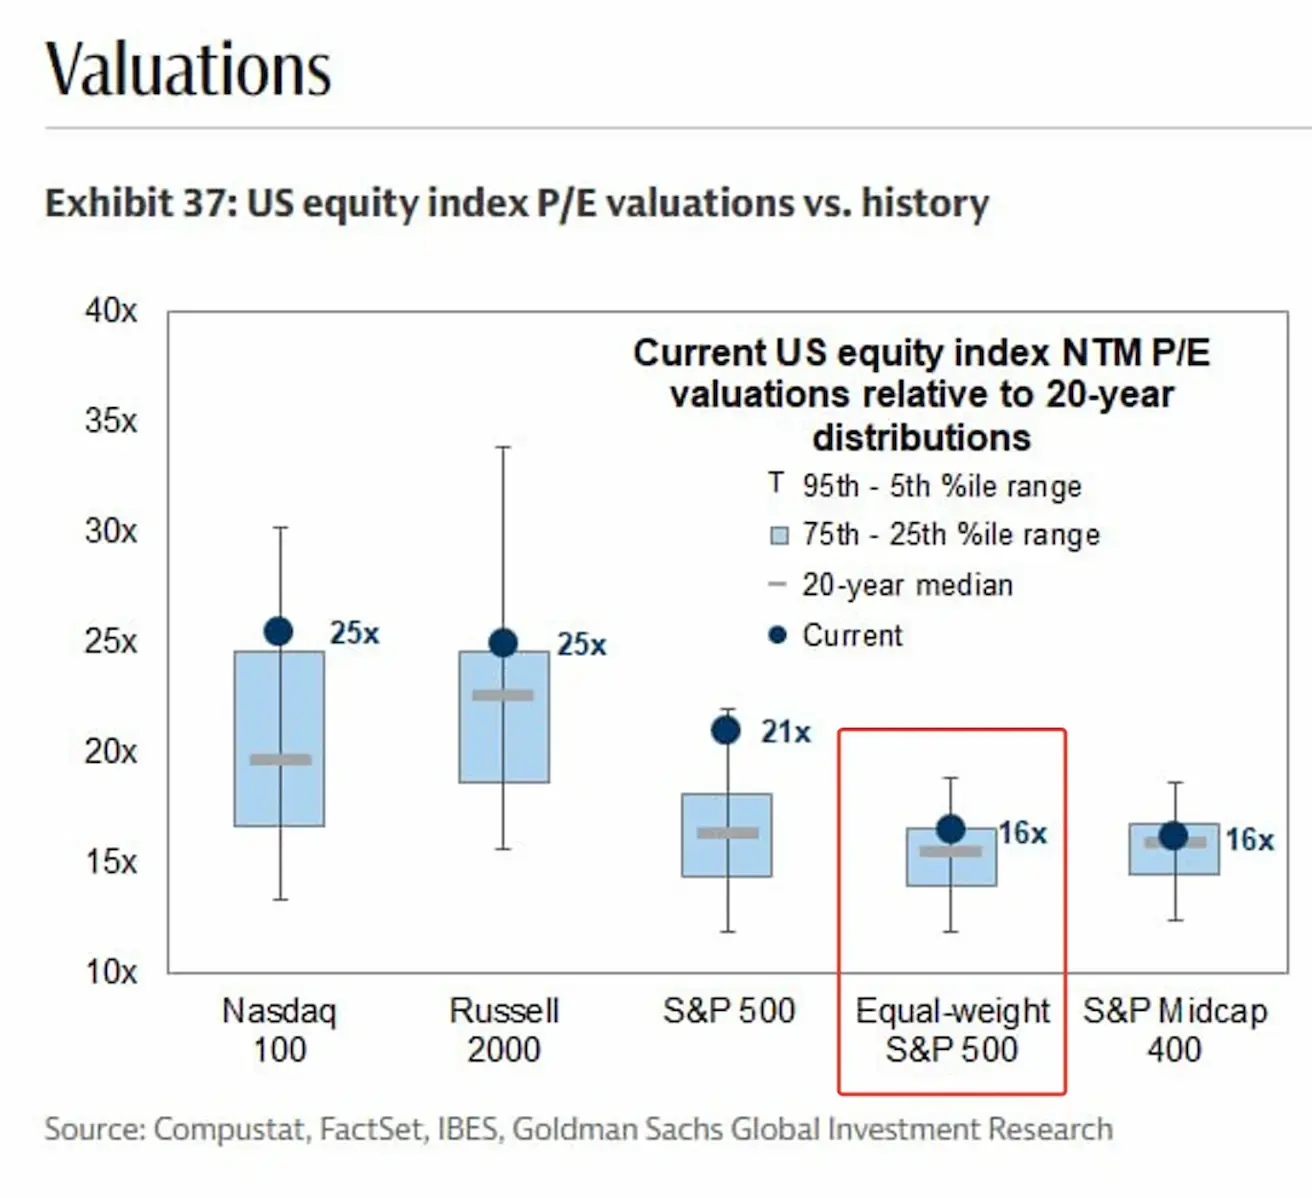
- Light blue rectangles represent historical 20-year ranges;
- The grey line within each range indicates the median;
- The dot marks the current level.
Nasdaq 100 — at 25x, above its median (20x) and closer to the upper bound of the range. The elevated valuation reflects a premium for anticipated growth in the technology sector, particularly driven by AI.
S&P 500 — trading at 21x, above its median of 16–17x, likewise supported by high valuations of technology companies, which currently account for a significant index weight.
A more indicative measure is the Equal-weight S&P 500 — at 16x, it is broadly in line with its median. This is a critical point: the broader market is NOT overheated.
Mid-cap equities also remain fairly valued relative to their historical range.
At the start of the earnings season (49 companies from the S&P 500):
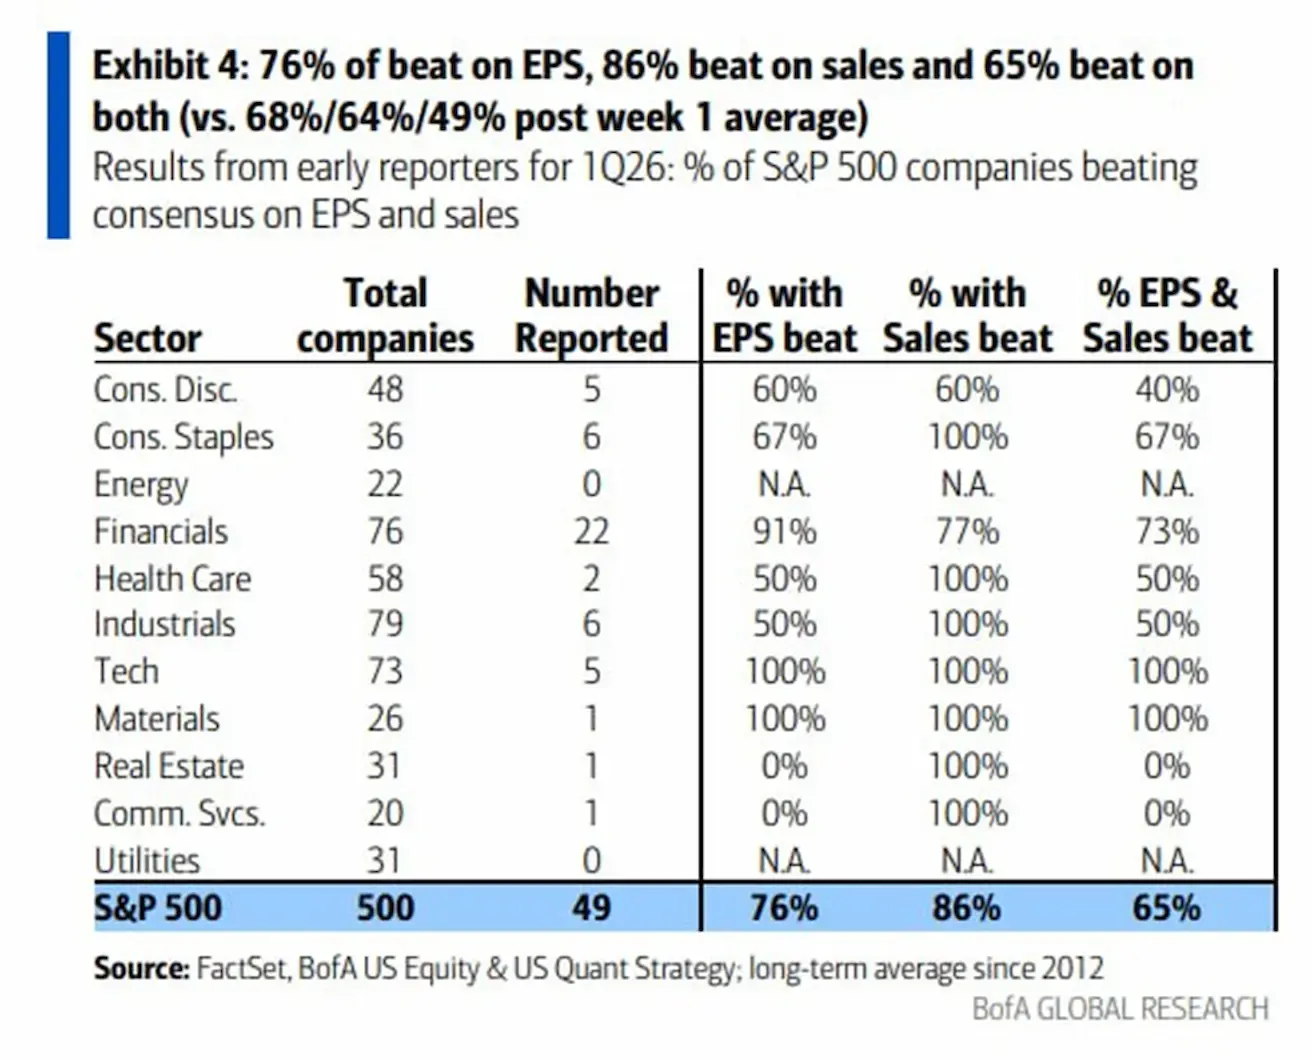
- 76% reported EPS beats;
- 86% exceeded revenue expectations;
- 65% beat on both metrics.
Key takeaway: the earnings season has started stronger than the historical norm. Importantly, revenue outperformance is particularly pronounced. Robust demand (with 86% of companies beating on sales) indicates that the economy remains resilient: demand is intact and turnover is holding up.
Eurozone
- The policy rate remains unchanged for now, but inflation risks are rising;
- The monetary policy stance is neutral, though the balance of risks is tilted toward inflation;
- Amid the escalation of the conflict in the Middle East, the ECB has revised its GDP forecasts downward and increased its inflation projections for the coming years.
Interest Rates:
- Deposit facility rate: 2.0% (prev. 2.0%);
- Marginal lending facility rate: 2.4% (prev. 2.4%) (the rate at which banks can obtain overnight liquidity from the regulator);
- Short-term (policy) rate: 2.15% (prev. 2.15%).
Inflation: Consumer Price Index (CPI) (March, preliminary data):
- Core CPI (YoY): 2.3% (prev. 2.4%);
- CPI (MoM): 1.3% (prev. 0.6%); CPI (YoY): 2.6% (prev. 1.9%).
GDP for Q4 (final): QoQ: 0.3% (prev. 0.3%); YoY: 1.3% (prev. 1.4%).
Unemployment rate (February): 6.2% (prev. 6.1%).
Industrial production (MoM) (February): 0.4% (prev. -0.8%).
Purchasing Managers’ Index (PMI) (April): remains in expansion territory, but momentum is slowing:
- Services: 47.4 (prev. 50.2);
- Manufacturing: 52.2 (prev. 51.6);
- S&P Global Composite: 48.6 (prev. 50.7).
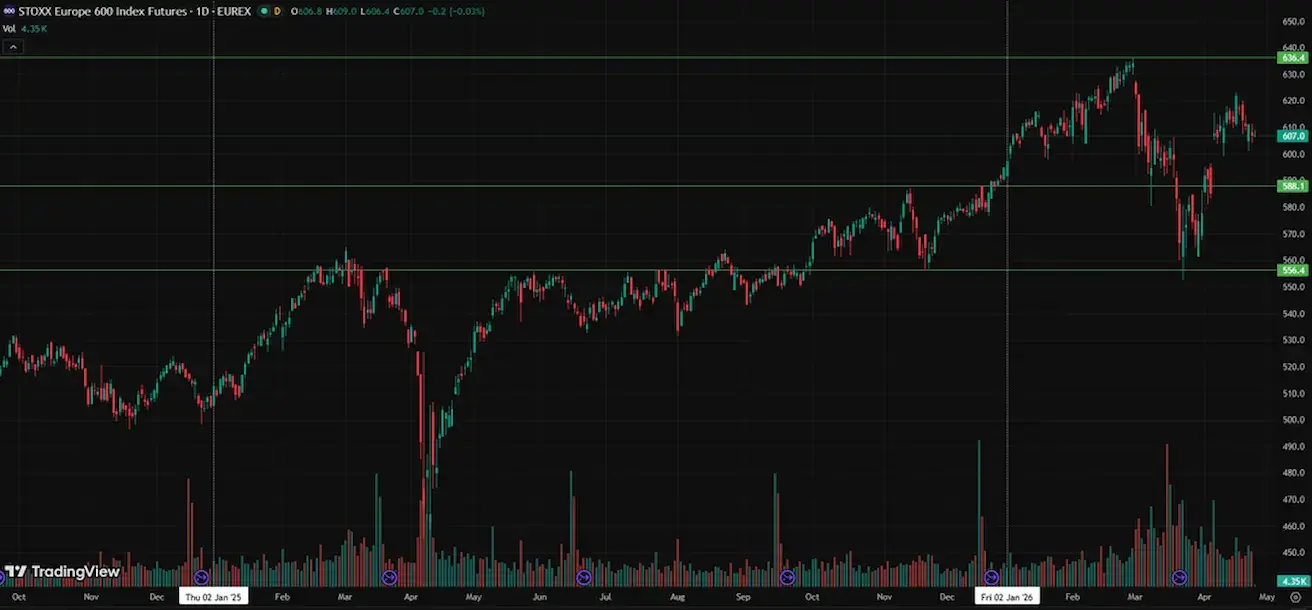
EURO STOXX 600 (FXXP1!)
Weekly performance: -2,36% (Week-end close: 607,2); Year-to-date: +2,22%.
China
The economy is stabilising on the back of exports, while domestic demand and investment are gradually recovering; policy stimulus remains targeted and measured.
- Policy rates remain unchanged;
- The monetary policy stance is accommodative;
- China has confirmed the continuation of fiscal support for economic growth under its 2026 plan (stimulating domestic demand, optimising tax incentives and subsidies, and advancing industrial modernisation).
Interest Rates:
- 1Y Loan Prime Rate (medium-term lending): 3.00%;
- 5Y Rate (benchmark five-year rate influencing mortgages): 3.50%.
Inflation indicators (March):
- Consumer Price Index (CPI): MoM: -0.7% (prev. 1.0%); YoY: 1.0% (prev. 1.3%);
- Producer Price Index (PPI) (YoY): -0.5% (prev. -0.9%).
China’s GDP expanded by 5.0% YoY, exceeding expectations of 4.8% and up from 4.5% in the previous quarter:
GDP for Q1 2026: QoQ: 1.3% (prev. 1.2%); YoY: 5.0% (prev. 4.5%).
Unemployment rate (March): 5.4% (prev. 5.3%).
Industrial production (March, YoY): 6.1% (prev. 6.3%).
Fixed asset investment (March, YoY): 1.7% (prev. 1.8%).
Retail sales (March, YoY): 0.9% (prev. 1.3%).
Imports (March, YoY): 27.8% (prev. 19.8%); Exports (March, YoY): 2.5% (prev. 21.8%).
Trade balance (USD) (March): $51.13bn (prev. $213.62bn).
Purchasing Managers’ Indices (PMI) (March):
- Manufacturing: 50.1 (prev. 49.5);
- Non-manufacturing: 50.4 (prev. 49.0);
- Composite: 50.5 (prev. 49.5).
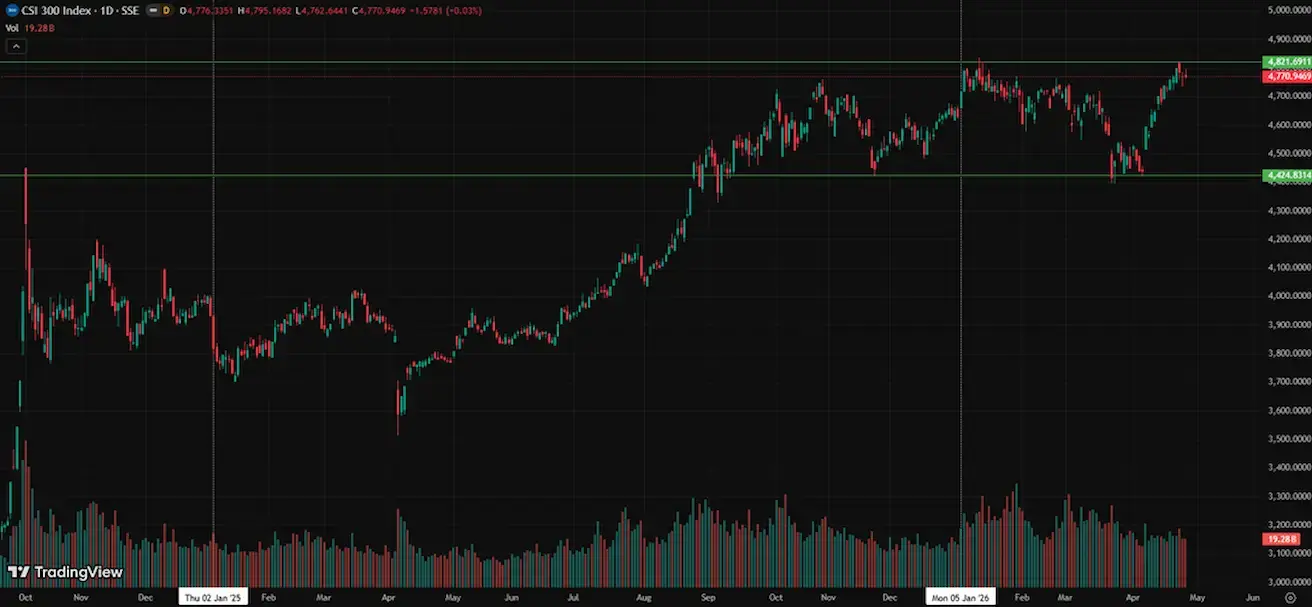
CSI 300 INDEX (000300.HK)
Weekly performance: +0,89% (week-end close at 4770,94); Year-to-date: +2,35%.
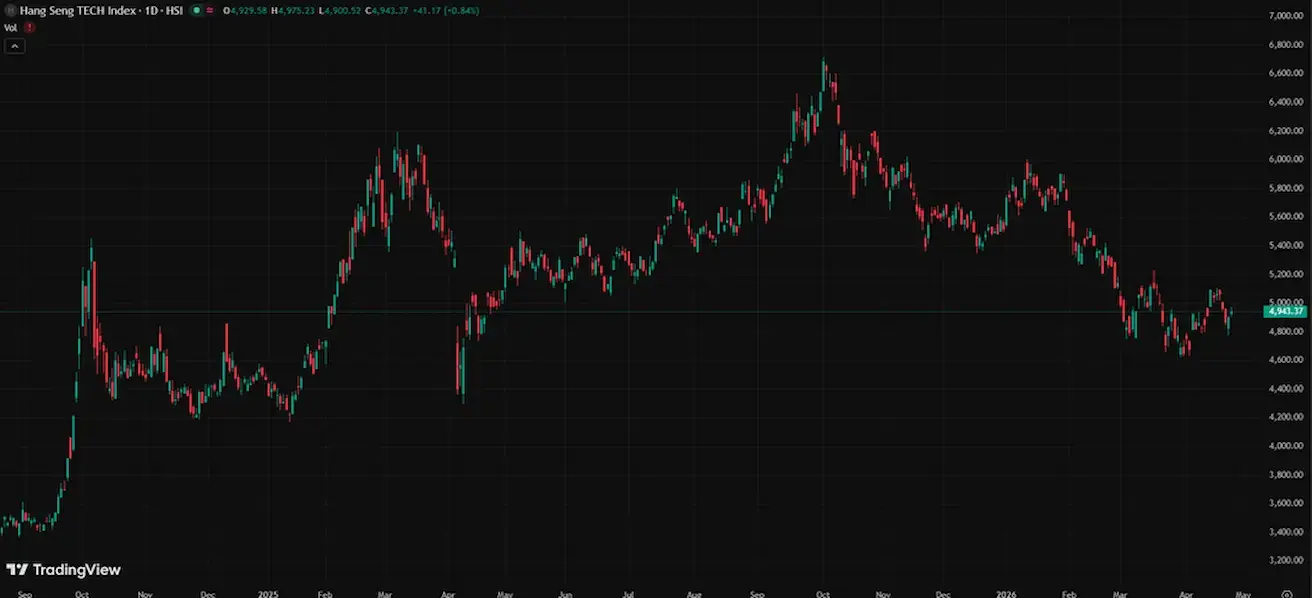
Hang Seng TECH Index (HSTECH)
Weekly performance: -2,79% (week-end close: -4902,2); year-to-date: -10,94%.
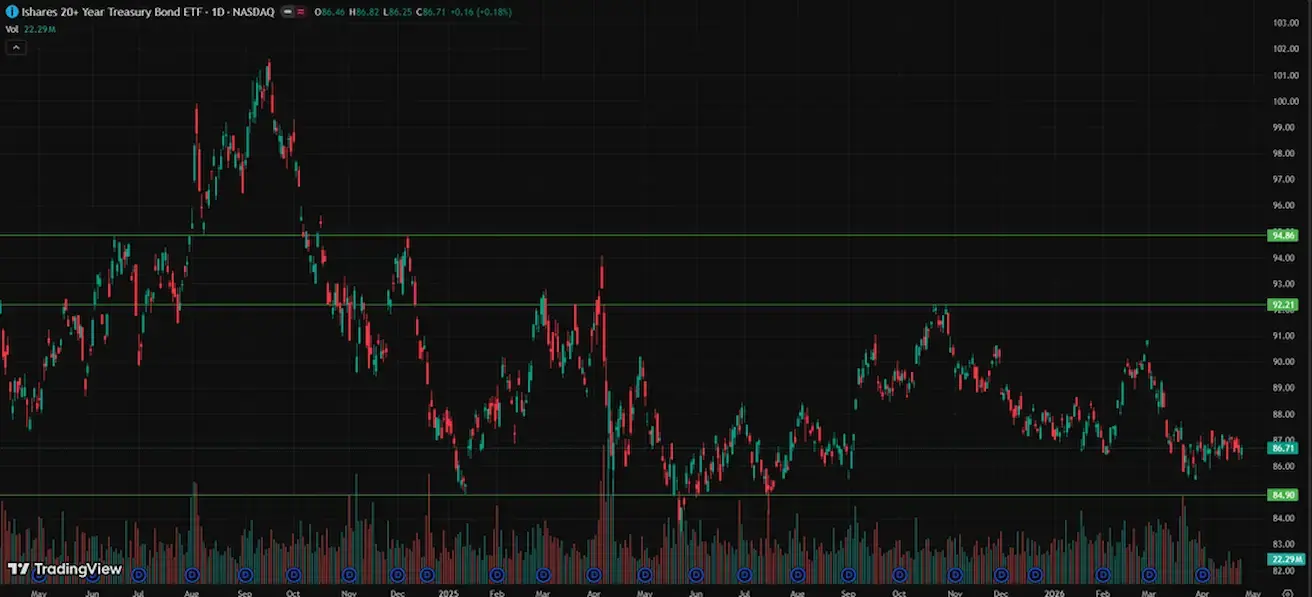
BOND MARKET
U.S. Treasuries 20+ (ETF TLT): weekly performance: -0,41% (week close: 86,71); year-to-date: -0,52%.
YIELDS AND SPREADS
Market Yield on U.S. Treasury Securities at 10-Year Constant Maturity: 4.32% (prev. 4.27%);
Yield on 2-year Treasuries: 3.78% (prev. 3.73%);
ICE BofA BBB US Corporate Index Effective Yield: 5.22% (prev. 5.21%).
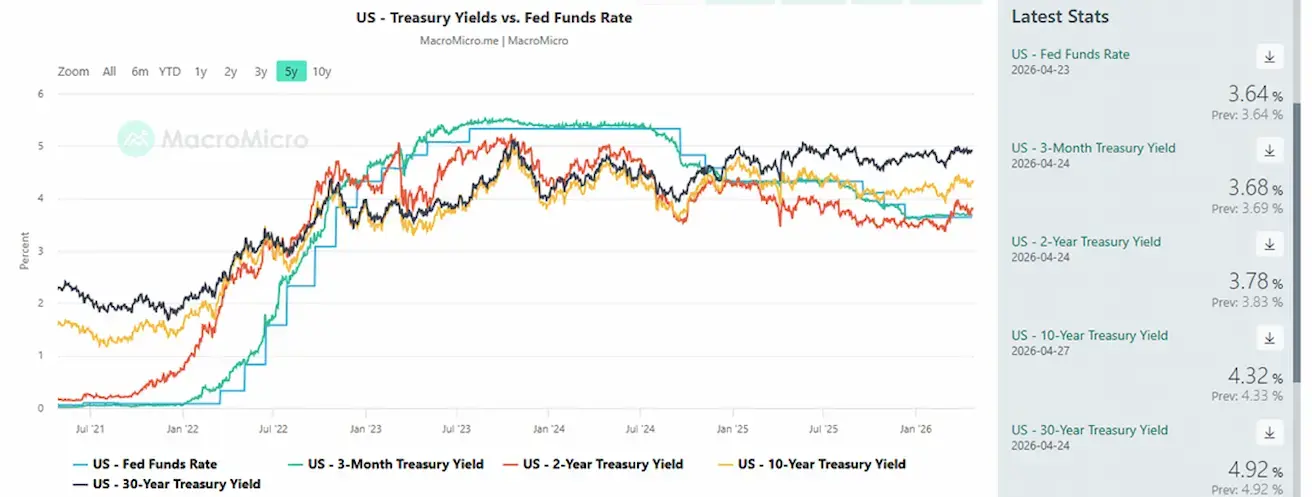
- The yield spread between 10-year and 2-year U.S. Treasuries stands at 54 basis points (prev. 54);
- The yield spread between 10-year and 3-month U.S. Treasuries stands at 64 basis points (prev. 65).
The cost of 5-year U.S. Credit Default Swaps (CDS) (default insurance): 34.63 bps (vs. 35.07 bps last week).
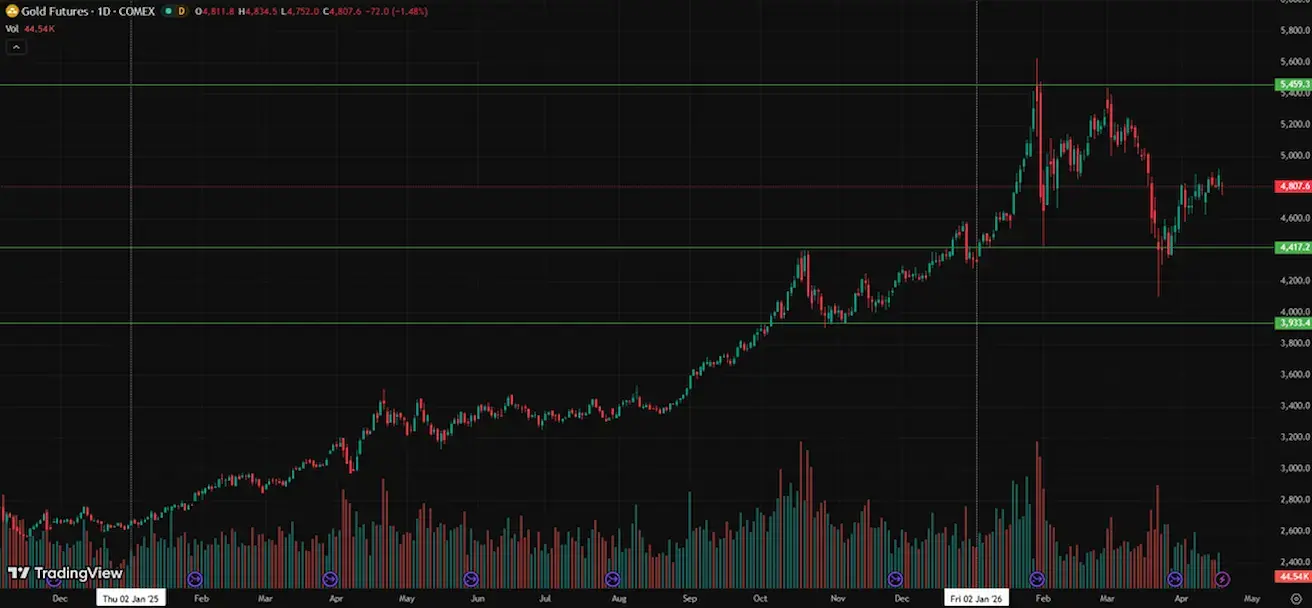
GOLD FUTURES (GC)
Weekly performance: -2,84% (week close: $4740,90 per troy ounce); Year-to-date: +9,44%.
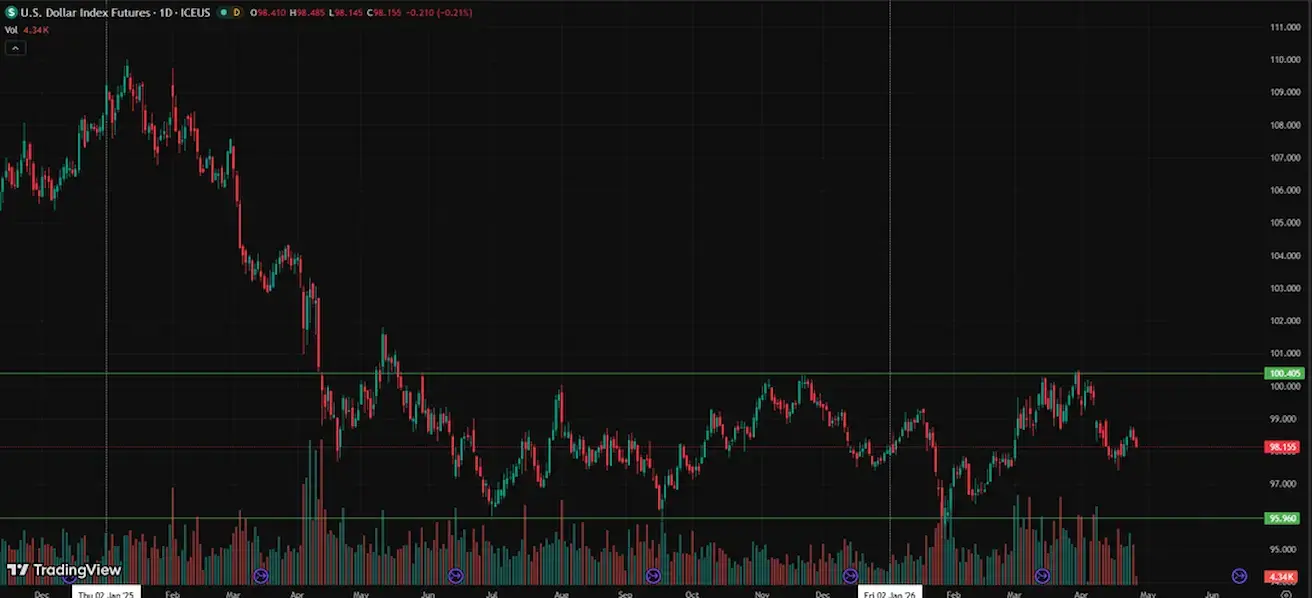
DOLLAR INDEX FUTURES (DX)
Weekly performance: +0,44% (week-end close: 98,3645). Year-to-date performance: +0,38%.
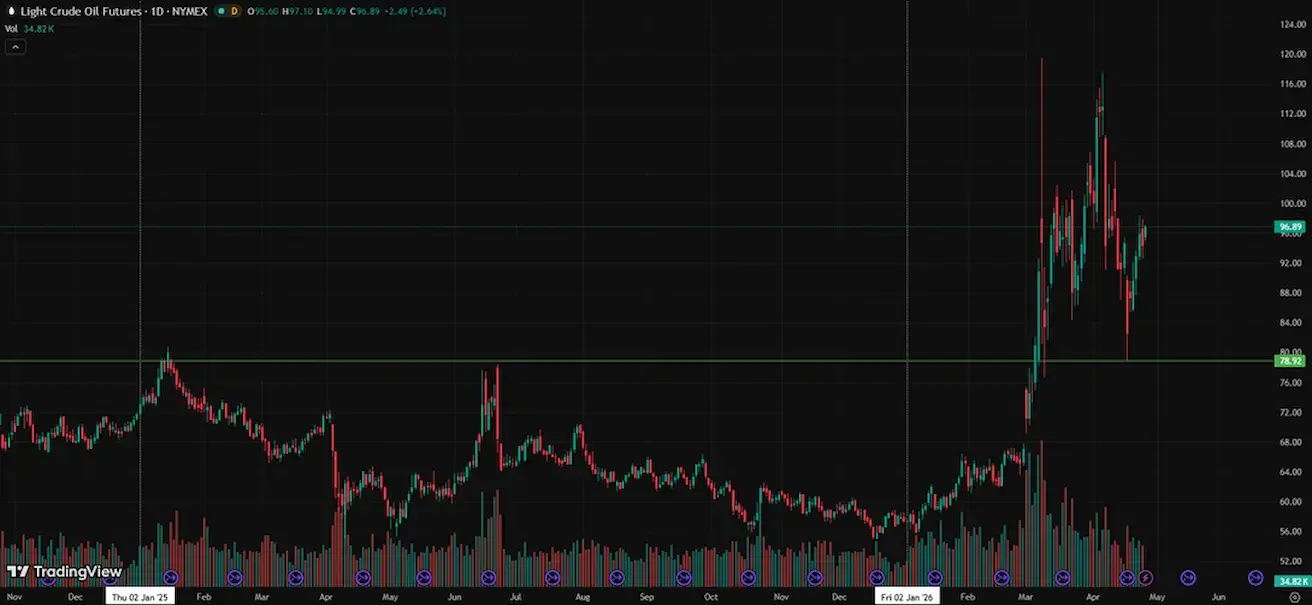
OIL FUTURES
Weekly performance: +14,30% (week-end close: $94,40 per barrel). Year-to-date performance: +64,43%.
- IEA members have begun drawing on strategic reserves;
- OPEC+ will increase production by 206,000 barrels per day in May.
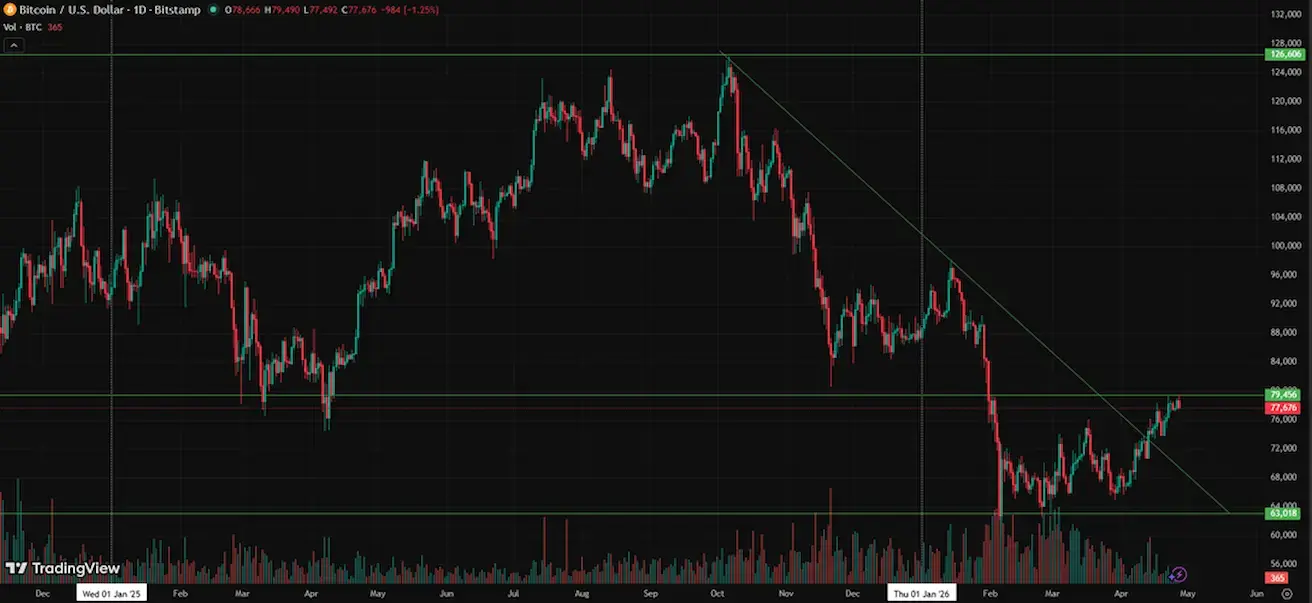
BTC FUTURES
Weekly performance +6,55 (week-end close: $7866); year-to-date: -10,33%.
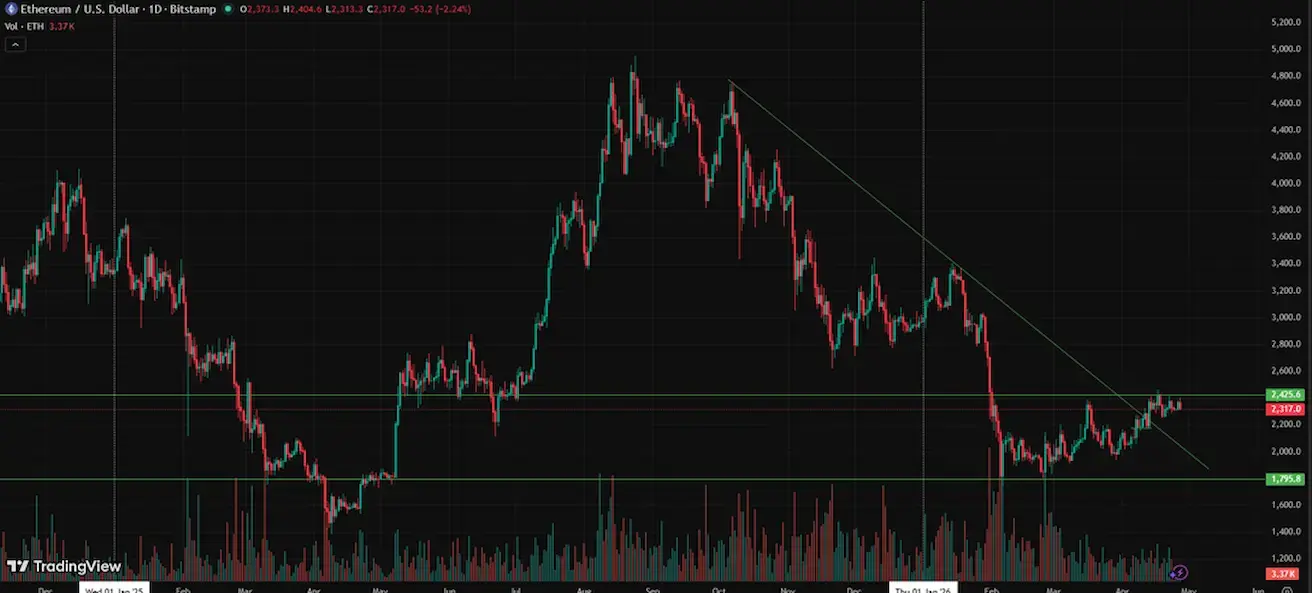
ETH FUTURES
Weekly performance +4,71% (week-end close: $2370,2); year-to-date: -20,30%.
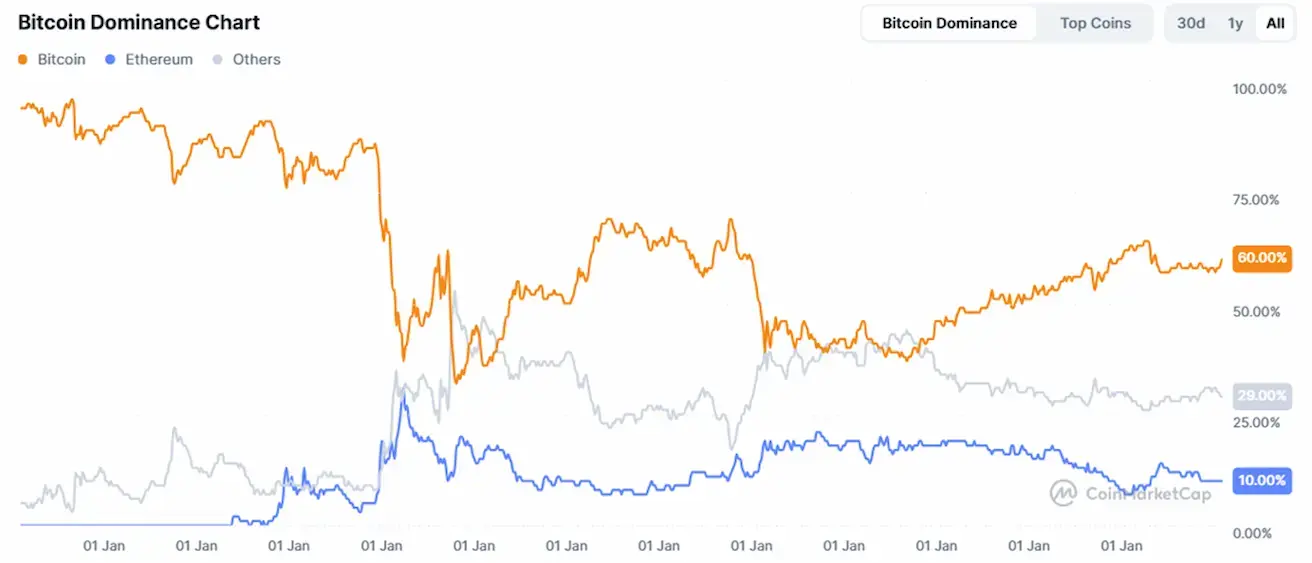
TOTAL CRYPTOCURRENCY MARKET CAPITALIZATION
Total crypto market capitalization: $2,59 trillion (vs $2,53 trillion a week earlier) (coinmarketcap.com).
Crypto asset market shares:
- Bitcoin: 60.0% (59.4%)
- Ethereum: 10.8% (11.0%)
- Others: 29.2% (29.6%).
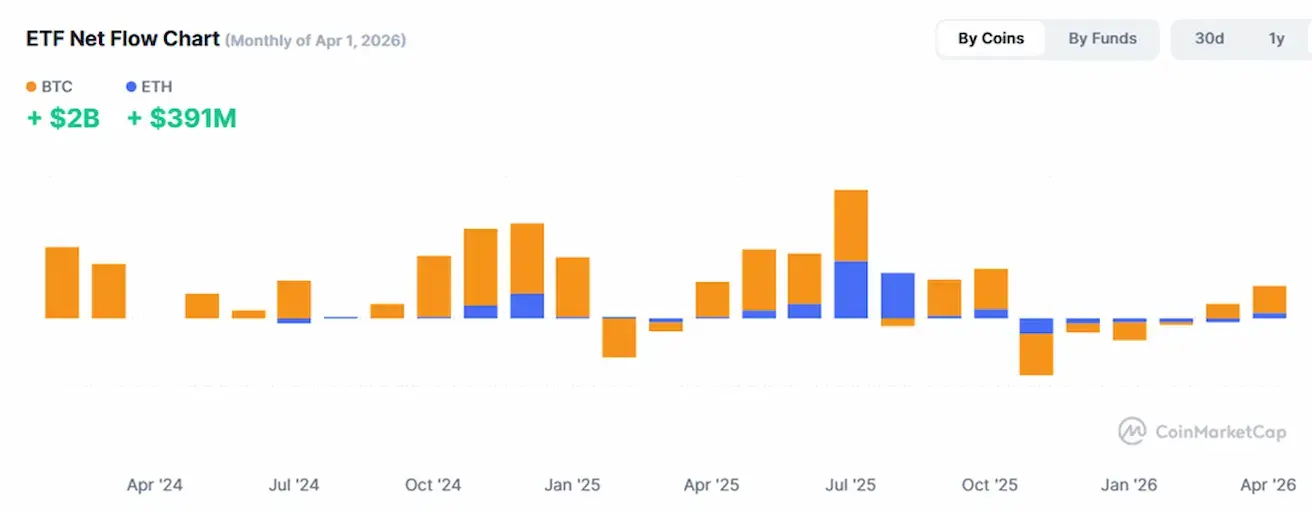
ETF Net Flows Chart: