 Lietuvių
 Русский
 Қазақша
 Eesti
EestiMay 12 - 16, 2025: Weekly economic update
Key market updates

MACROECONOMIC STATISTICS
INFLATION
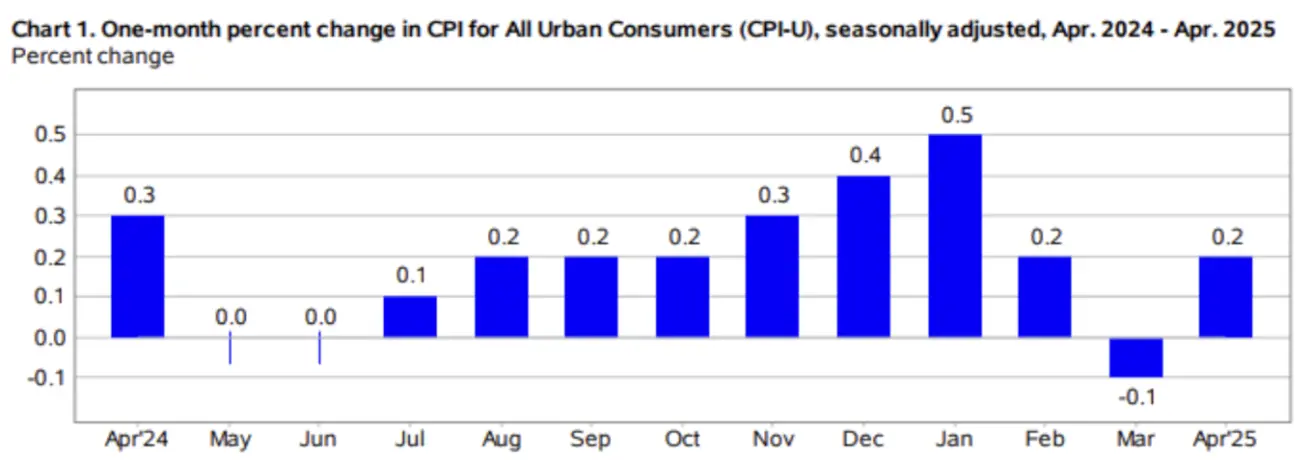
- Core Consumer Price Index (m/m) (Apr): 0.2 % (prev 0.1 %)
- Consumer Price Index (m/m) (Apr): 0.2 % (prev –0.1 %)
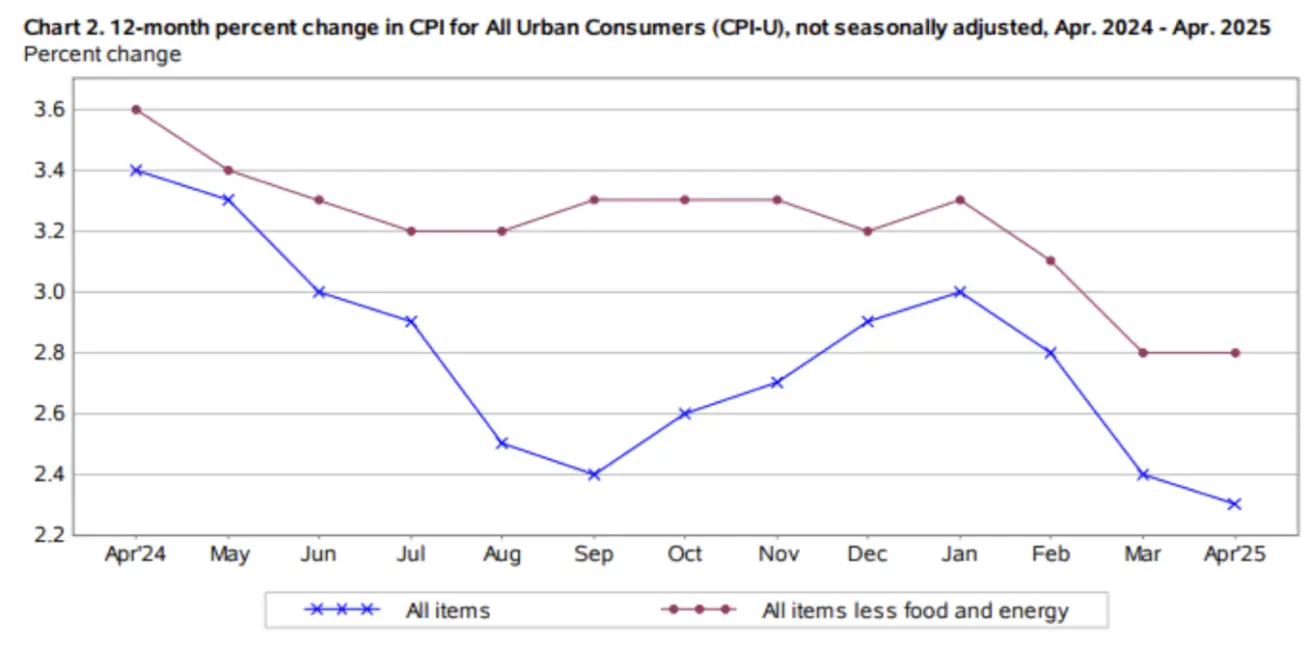
- Core Consumer Price Index (y/y) (Apr): 2.8 % (prev 2.8 %)
- Consumer Price Index (y/y) (Apr): 2.3 % (prev 2.4 %)
INFLATION EXPECTATIONS (MICHIGAN)
- 12-month expected inflation (May): 7.3 % (prev 6.5 %)
- 5-year expected inflation (Apr): 4.6 % (prev 4.4 %)
GDP (U.S. Bureau of Economic Analysis, BEA)
- 1Q 2025, annualised (advance estimate): –0.3 %
- 4Q 2024: 2.4 % revised
Atlanta Fed GDPNow, 2Q: 2.5 % (vs 2.3 %)
(The GDPNow forecasting model offers a "real-time" approximation of official GDP growth before its release, using methodology similar to that of the BEA.)
Business Activity Index (PMI)
(Above 50 indicates expansion; below 50 indicates contraction)
- Services Sector (April): 50.8 (prev: 54.4)
- Manufacturing Sector (April): 50.7 (prev: 49.8)
- S&P Global Composite PMI (April): 50.6 (prev: 53.5)
LABOR MARKET:
- Unemployment rate (Apr): 4.2 % (prev 4.2 %)
- Non-farm payrolls change (Apr): 177 k (prev 185 k rev.)
- Average hourly earnings (Apr, y/y): 3.8 % (prev 3.8 %)
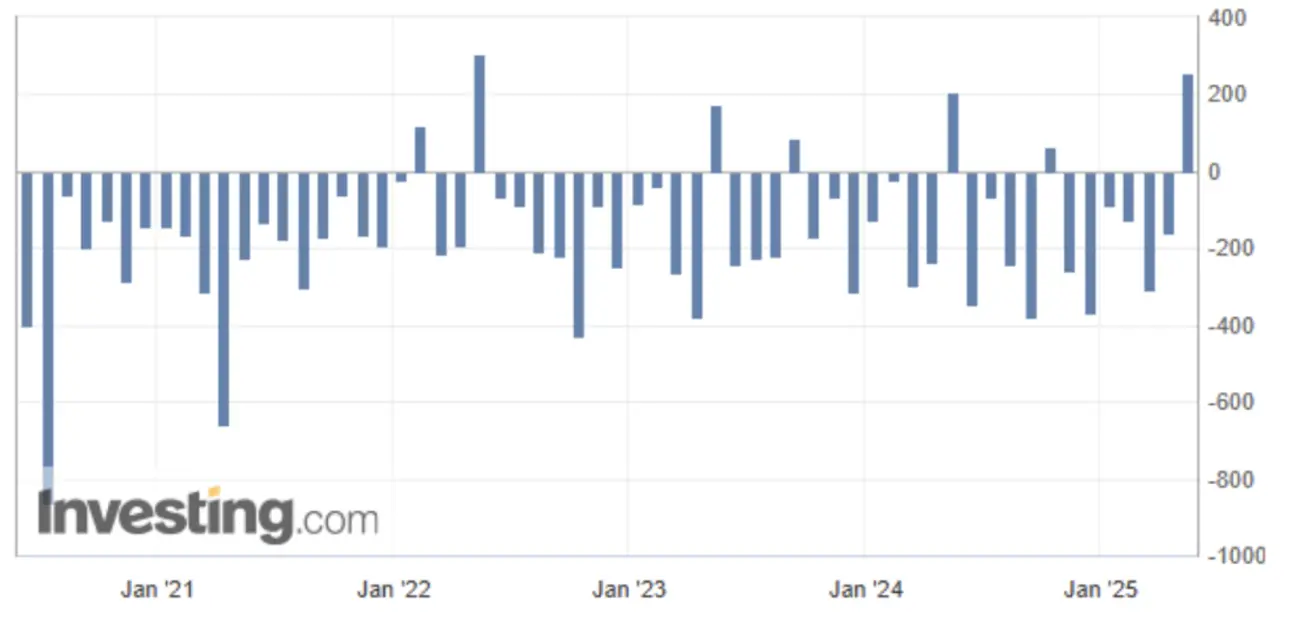
U.S. Federal Budget (Apr)
+$248 billion:
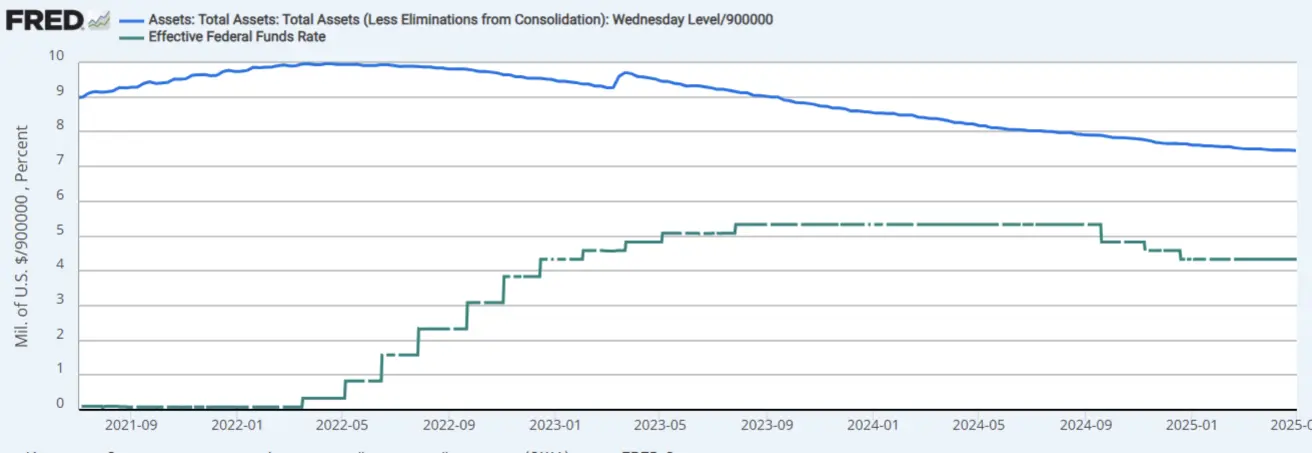
MONETARY POLICY
- Federal funds rate (EFFR): 4.25 – 4.50 % (dotted line)
- Fed balance sheet (blue): ↑ USD 10 bn to USD 6.713 tn (vs USD 6.710 tn the prior week) – a modest second-weekly increase.
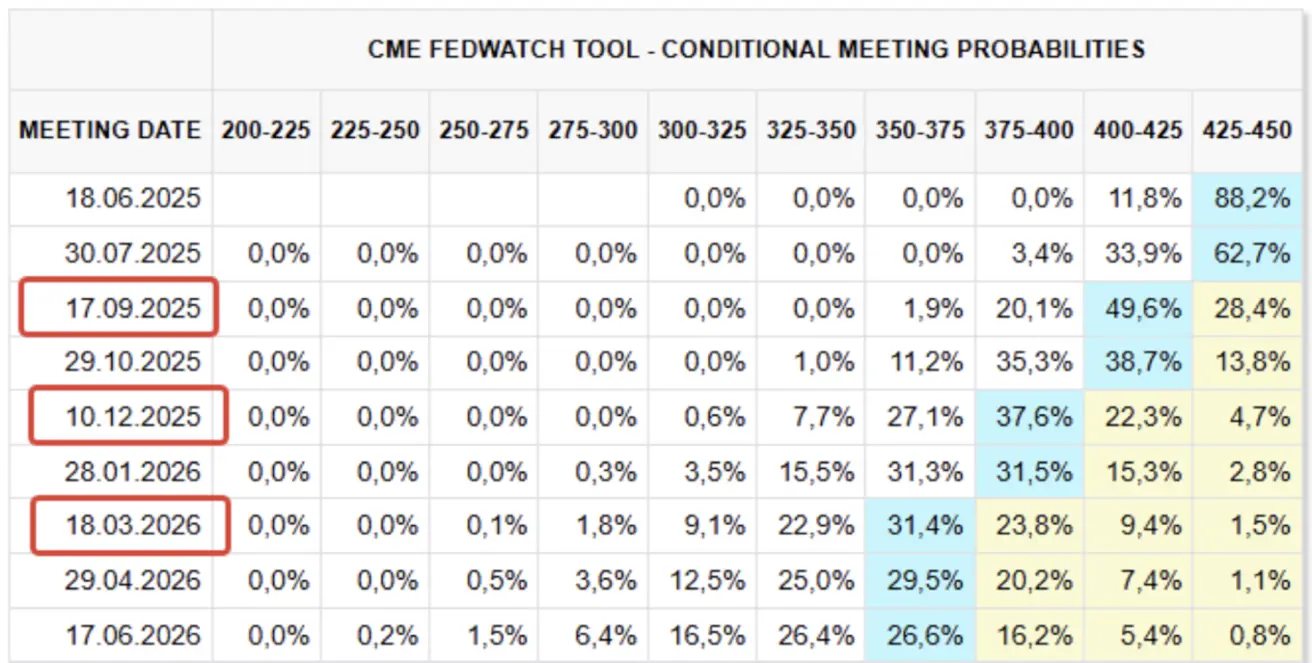
MARKET FORECAST FOR RATE
Today:
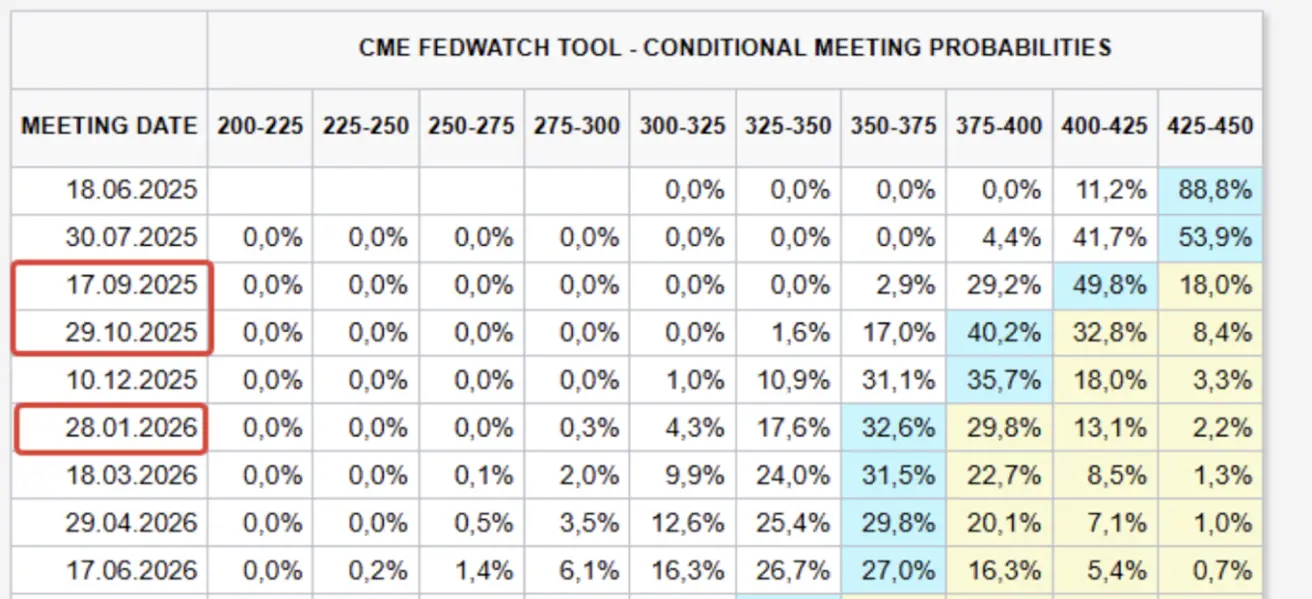
А week earlier:
Commentary
- April CPI undershot expectations: headline up 0.2 % m/m (consensus 0.3 %). Headline CPI: 2.3 % y/y (cons. 2.4 %); Core CPI: 2.8 % y/y, unchanged. It was the slowest 12-month rise in the all-items index since Feb 2021.
- Housing prices rose 0.3 % m/m, contributing over half of the total increase. Despite lower oil prices, the energy index rose 0.7 % on dearer gasoline and electricity.
- Food index fell 0.1 %.
- Monthly gainers: household furnishings & operations, medical care, motor vehicles, insurance, education, personal care.
- Atlanta Fed GDPNow continues to signal 2.4 % growth (vs –2.5 %). Inflation expectations remain elevated.
- Federal budget: April returned to surplus (USD +248 bn) as spending fell and tax receipts peaked. Revenues +9.5 % y/y; outlays +4.4 % y/y.
FY 2025 deficit to date: USD 1.048 tn, close to a record.
China
New loans (Apr): CNY 280 bn (cons. CNY 710 bn; prev CNY 3.64 tn). Even allowing for seasonality, lending volumes have been declining since early 2024, suggesting weak demand and lacklustre activity. Authorities are therefore broadening stimulus to hit the 5 % GDP target, including:
- Additional bank liquidity
- Lower first-mortgage rates
- Up to CNY 800 bn in liquidity via state programmes to stabilise equities
- Tariff-relief measures, etc.
Trade negotiations provide the main easing narrative.
Last Week’s Market Triggers
- Tariffs: China cut import duties to 10 % from 125 %; the U.S. cut to 30 % from 145 % for 90 days. China’s Ministry of Commerce has also paused export-control measures on 28 U.S. firms for 90 days (from 14 May).
- Saudi Summit: Former President Trump secured USD 600 bn in investment pledges. Saudi Arabia will buy USD 142 bn of U.S. defence, aviation, maritime-security and IT goods and services.
- Sanctions: The U.S. imposed sanctions on countries shipping Iranian oil to China, aiming to curb Tehran’s revenues amid nuclear talks.
- Canada (PM Mark Carney): After imposing 25 % tariffs on CAD 60 bn of U.S. goods in retaliation, Ottawa granted six-month relief for manufacturing, healthcare, security and auto sectors. Oxford Economics estimates the effective tariff rate is now “close to zero”.
- U.S.–Qatar deals: > USD 243.5 bn (target USD 1.2 tn) including Boeing aircraft (USD 96 bn) and Raytheon drone contracts (USD 1 bn for counter-UAV systems, USD 2 bn for MQ-9B drones).
- Fed balance sheet: unchanged for a second week.
- FedWatch: Market still prices three 25 bp cuts over 12 months to 3.50 – 3.75 %, first in August. Next FOMC meeting: 18 June – consensus: no change (4.25 – 4.50 %).
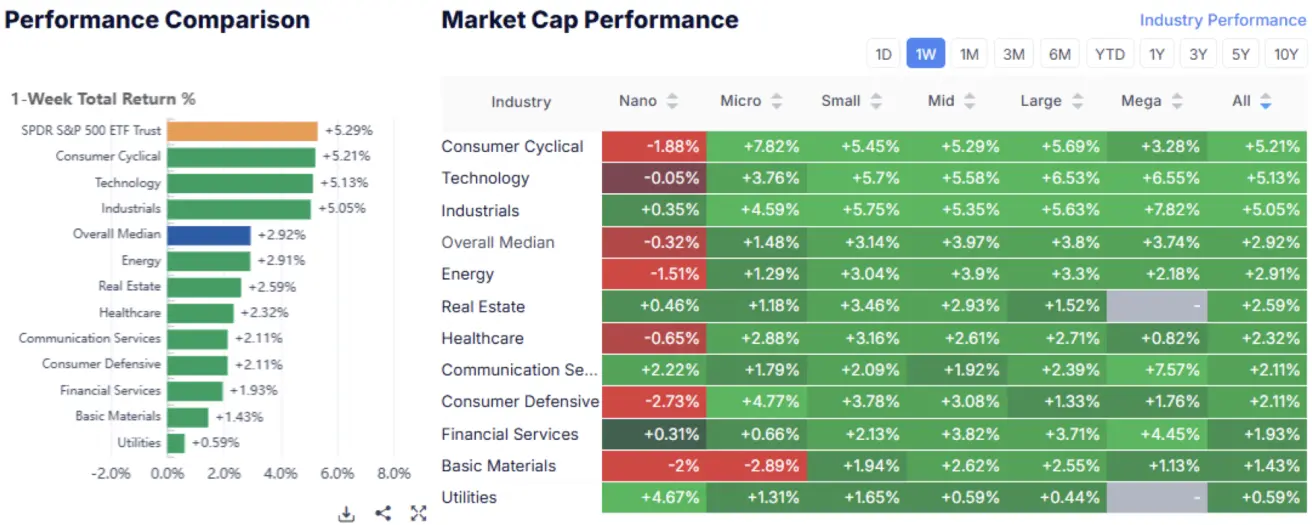
Equity Markets
Risk-on sentiment dominated. Median rise: +2.92 %. Leaders: consumer cyclical, tech, industrials.
YTD: median index -3.83 %:
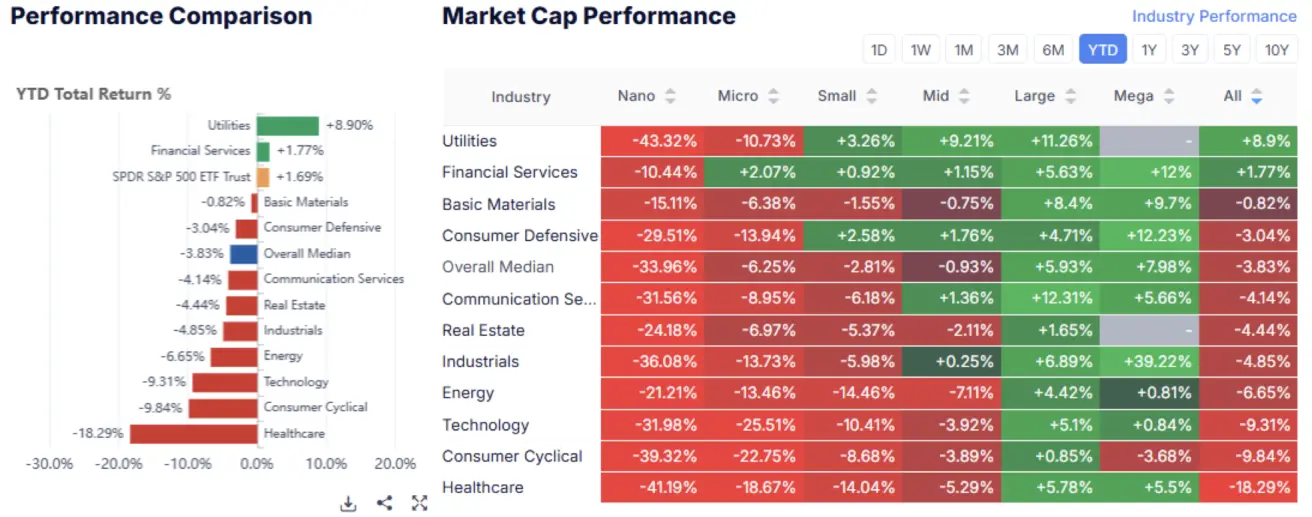
MARKET
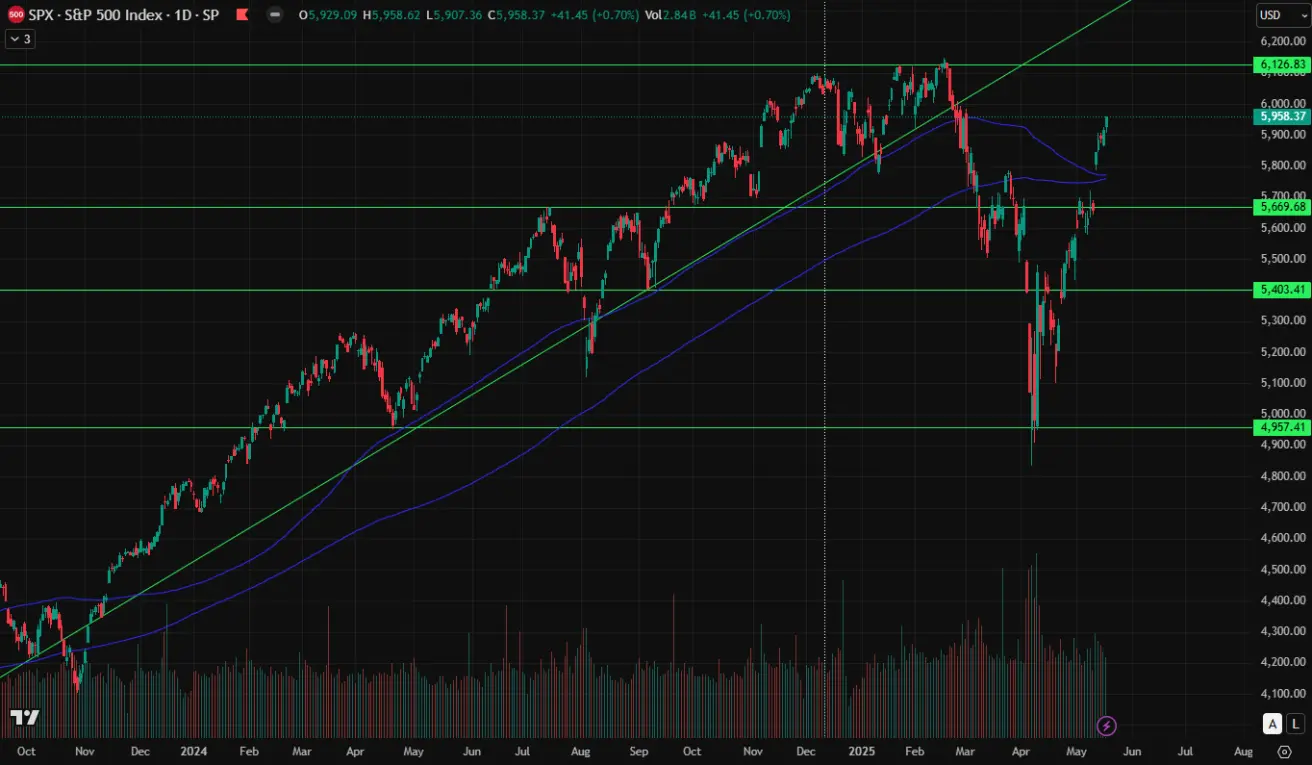
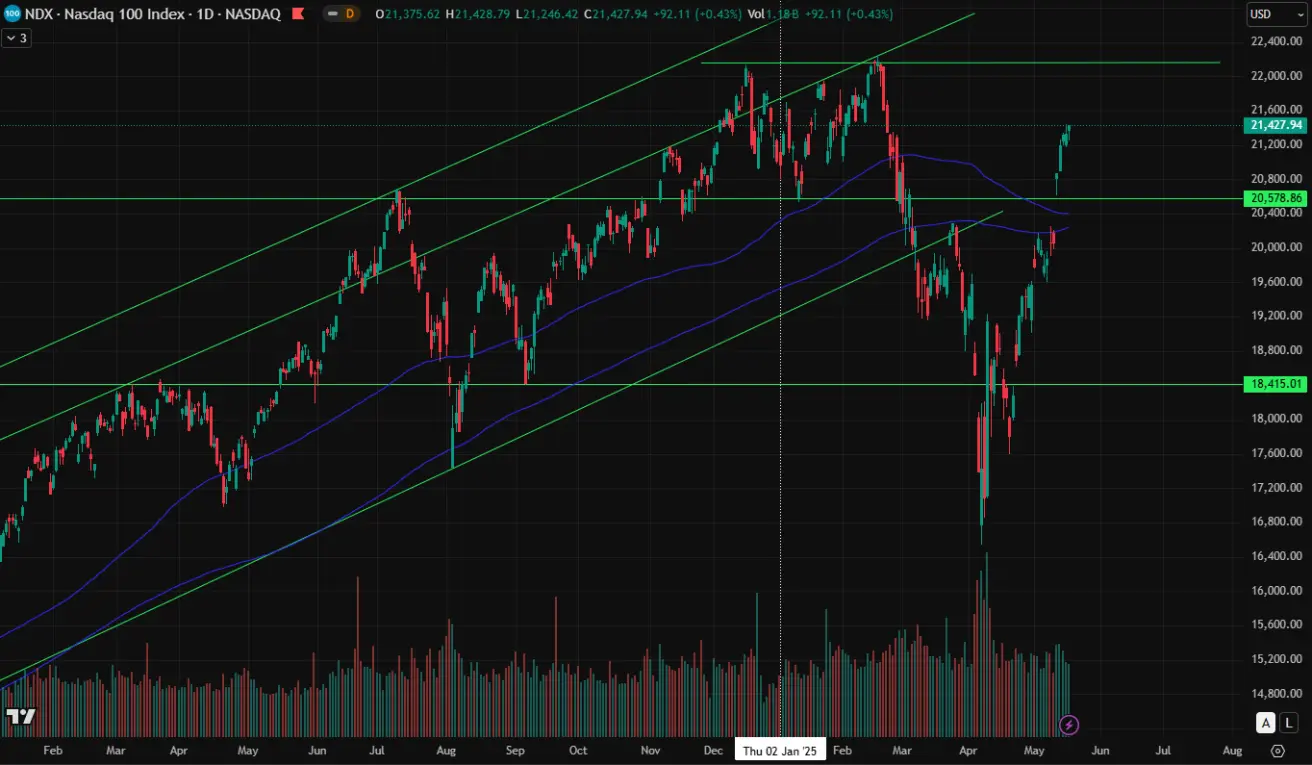
U.S. indices gapped higher, clearing 100- and 200-day MAs and rallying all week
SP500
+5.27 % w/w (close 5 958.37). YTD: +0.93 %
NASDAQ100
+6.81 % w/w (close 21 427.94). YTD: +1.46 %
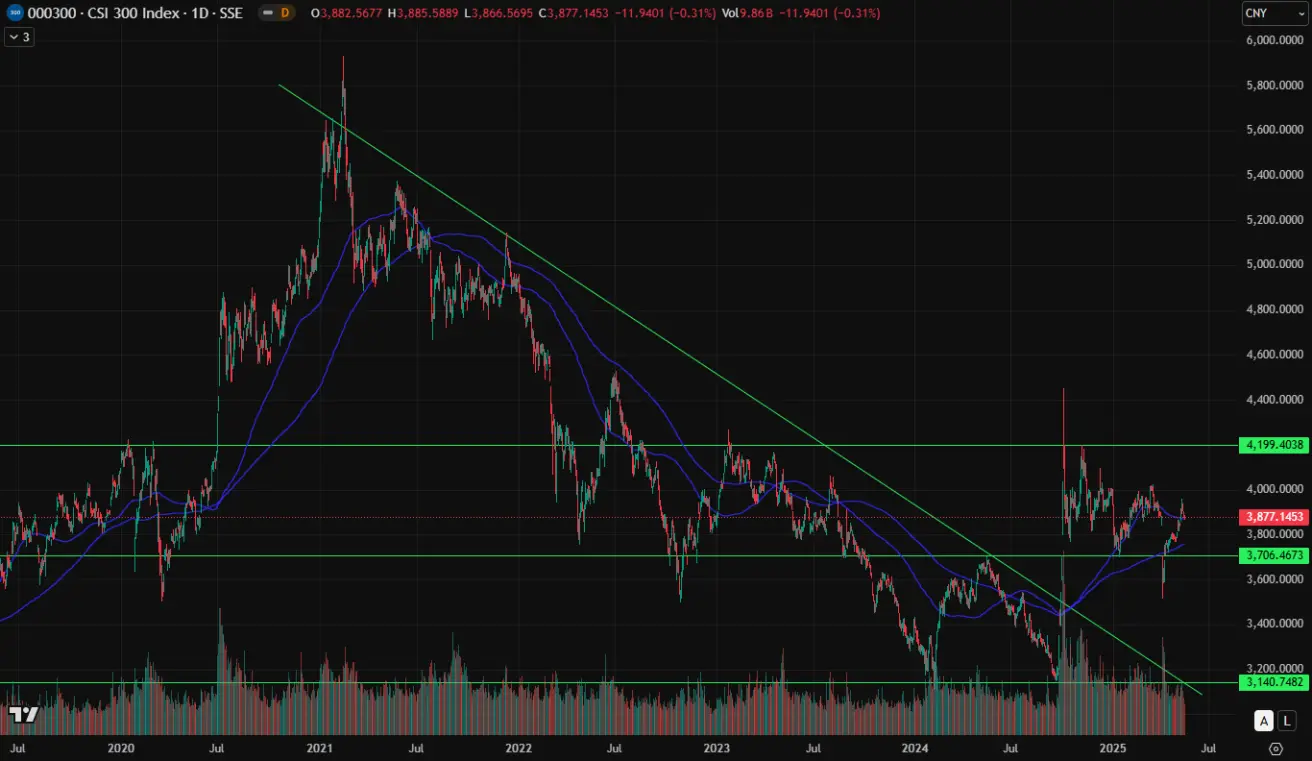
CSI 300
+1.12 % w/w (close 3 889). YTD: –1.07 %
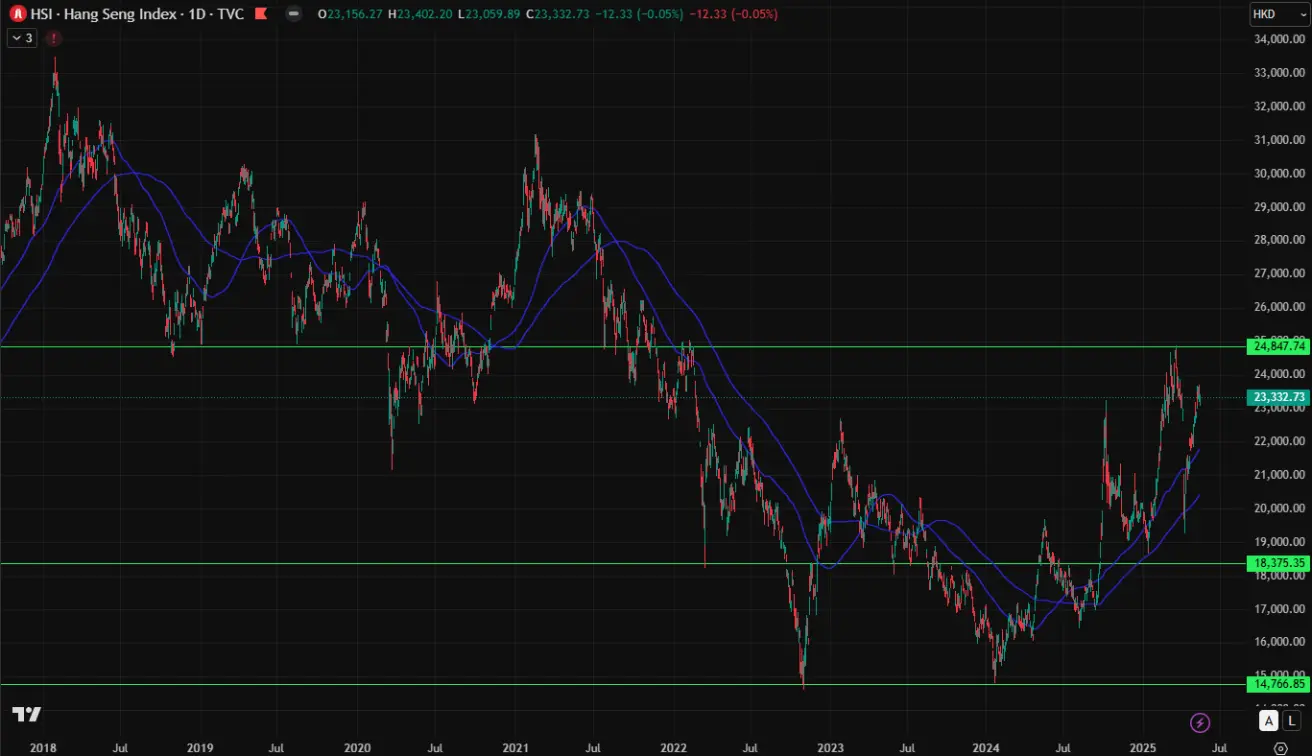
Hang Seng
+6.81 % w/w (close 21 427.94). YTD: +1.46 %
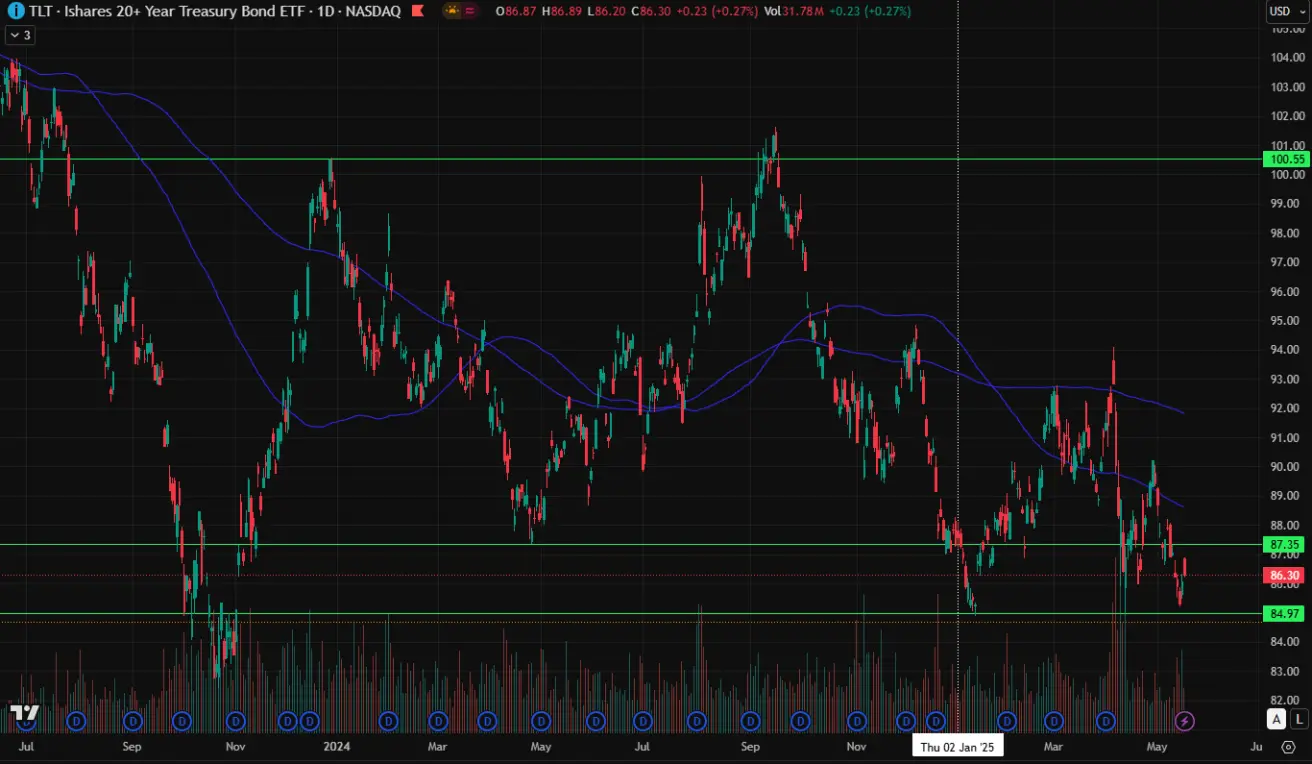
BOND MARKET
Rising yields in the Treasury segment alongside a neutral trend in the corporate debt market.
U.S. Treasuries 20 yr+ ETF (TLT): –0.86 % w/w (close USD 86.30). YTD: –1.71 %
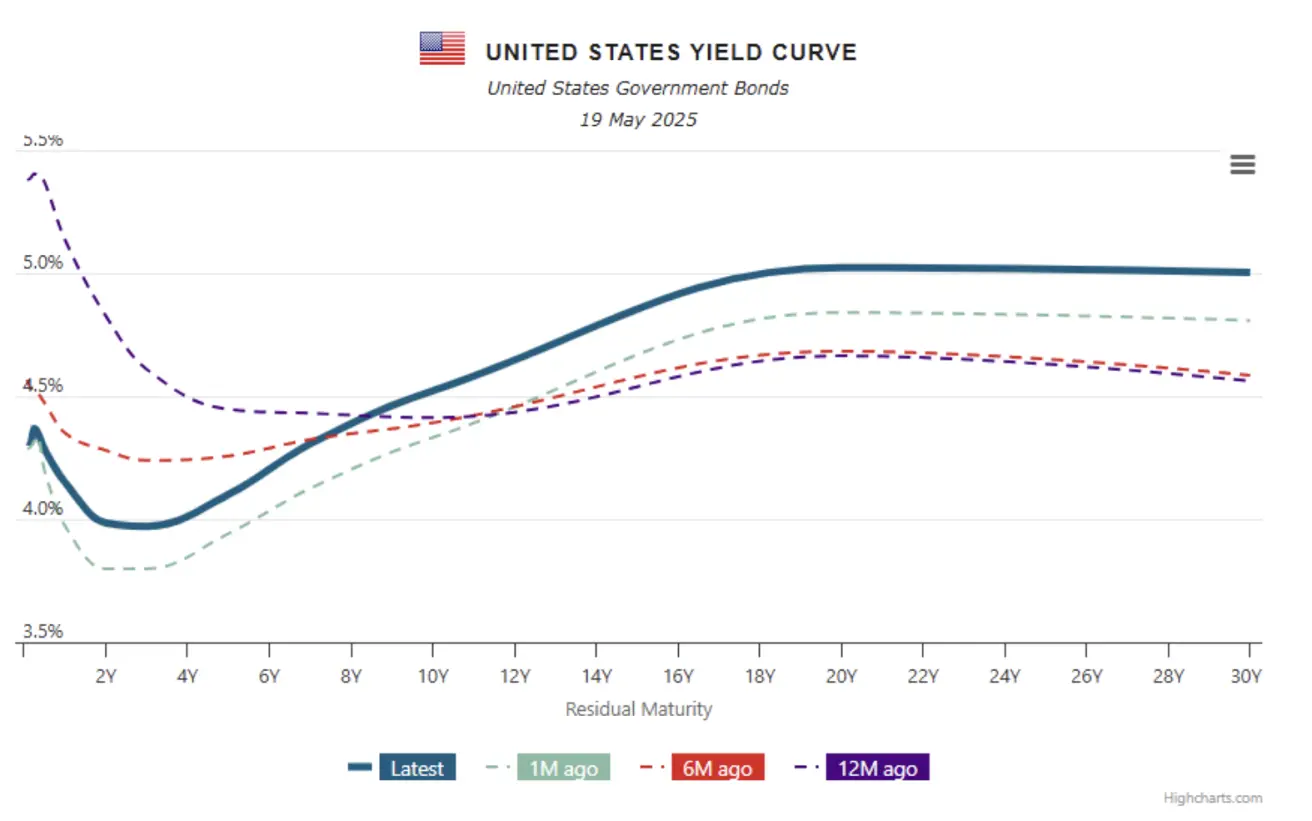
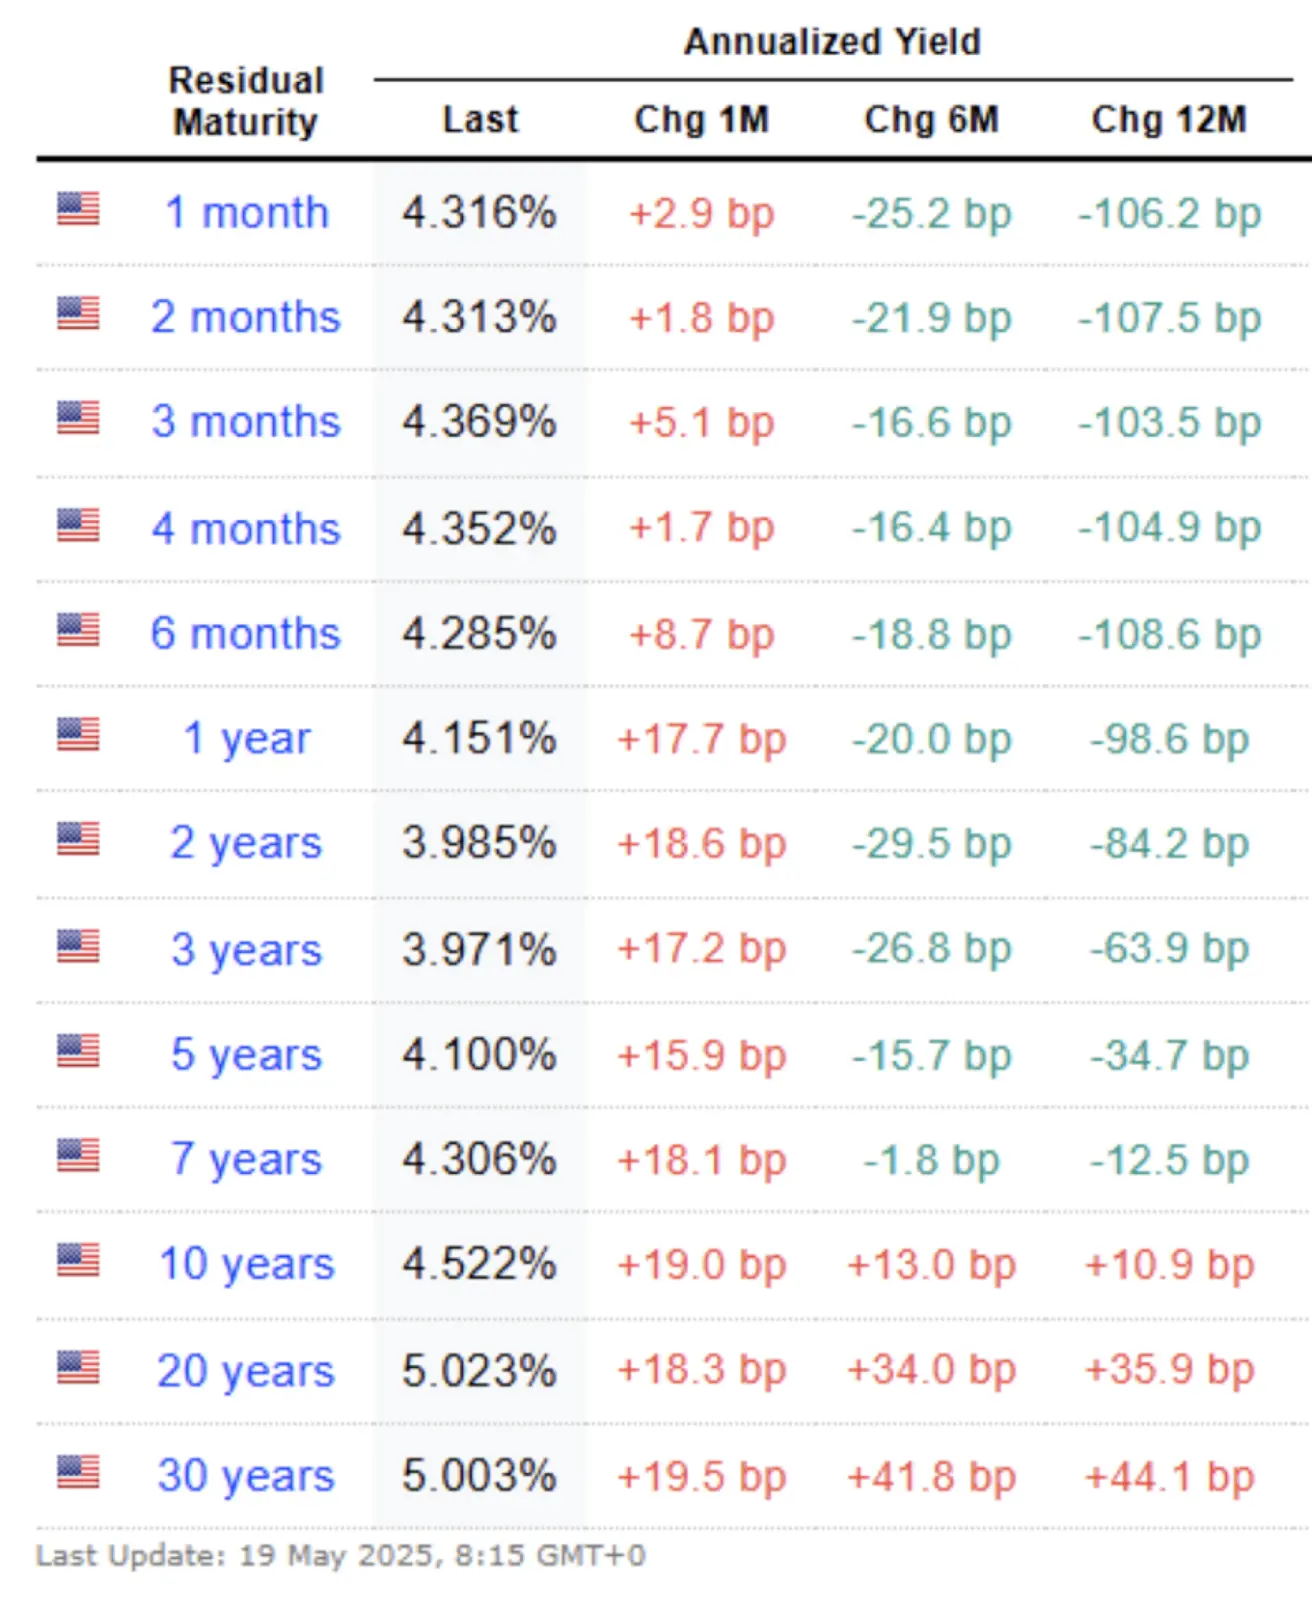
YIELDS AND SPREADS 2025/05/16 vs 2025/05/12
- 10-yr Treasury yield: 4.522 % (prev 4.409 %)
- ICE BofA BBB yield: 5.53 % (prev 5.58 %)
- The yield spread between 10-year and 2-year U.S. Treasuries stands at 53.7 bp versus 49.1 bp (the difference in returns between long- and short-term government debt).
- The yield spread between 10-year and 3-month U.S. Treasuries is 0.15 bp (down from 0.47 bp).
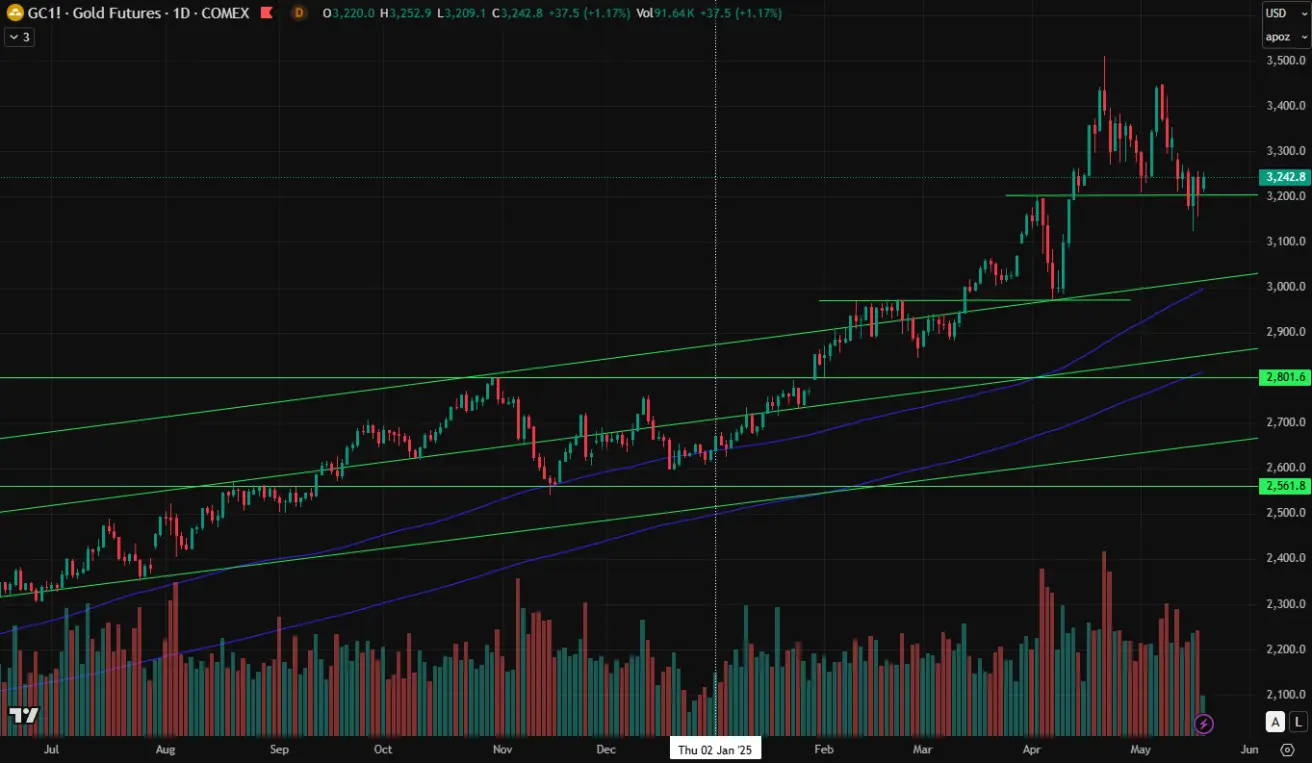
GOLD FUTURES (GC)
–3.72 % w/w, close USD 3 205.3/oz. YTD: +1.37 %
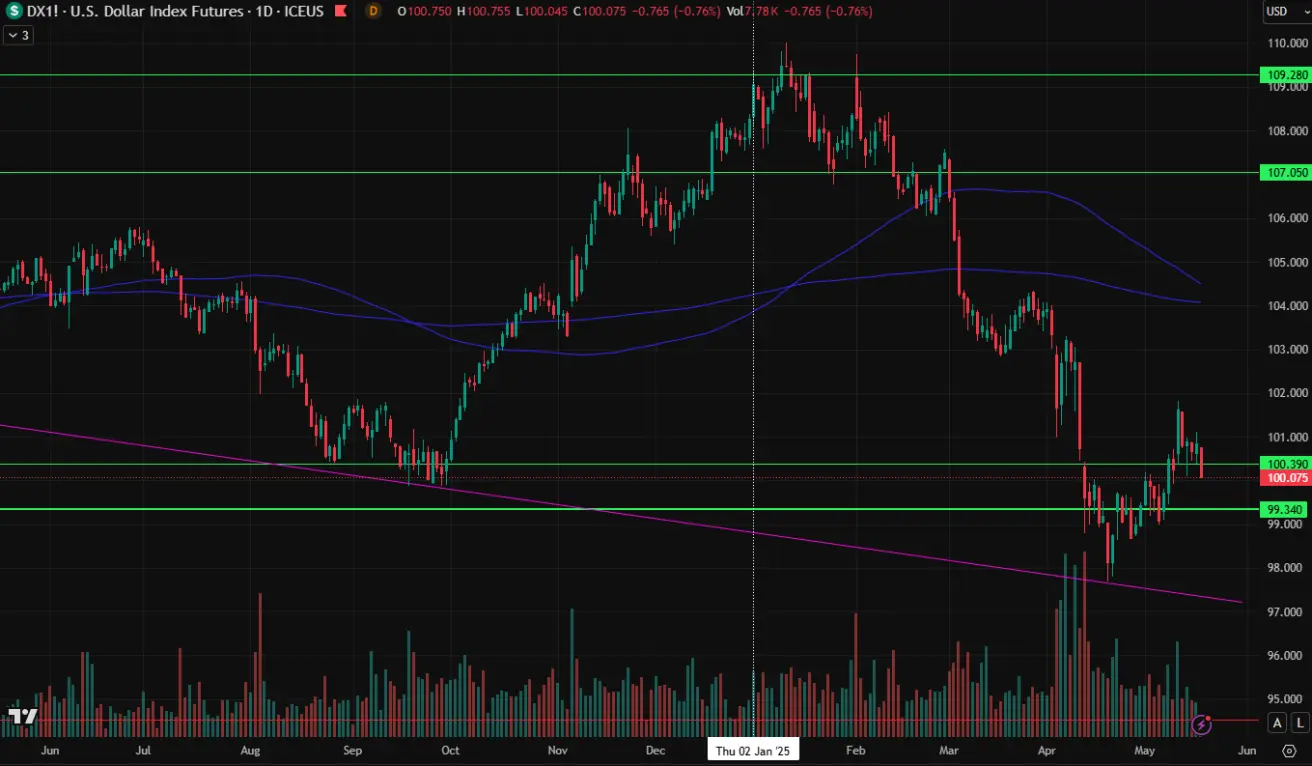
DOLLAR INDEX FUTURES (DX)
+0.58 % w/w, close 100.840. YTD: –6.91 %
OIL FUTURES
+1.42 % w/w, close USD 61.93/bbl. YTD: –13.81 %
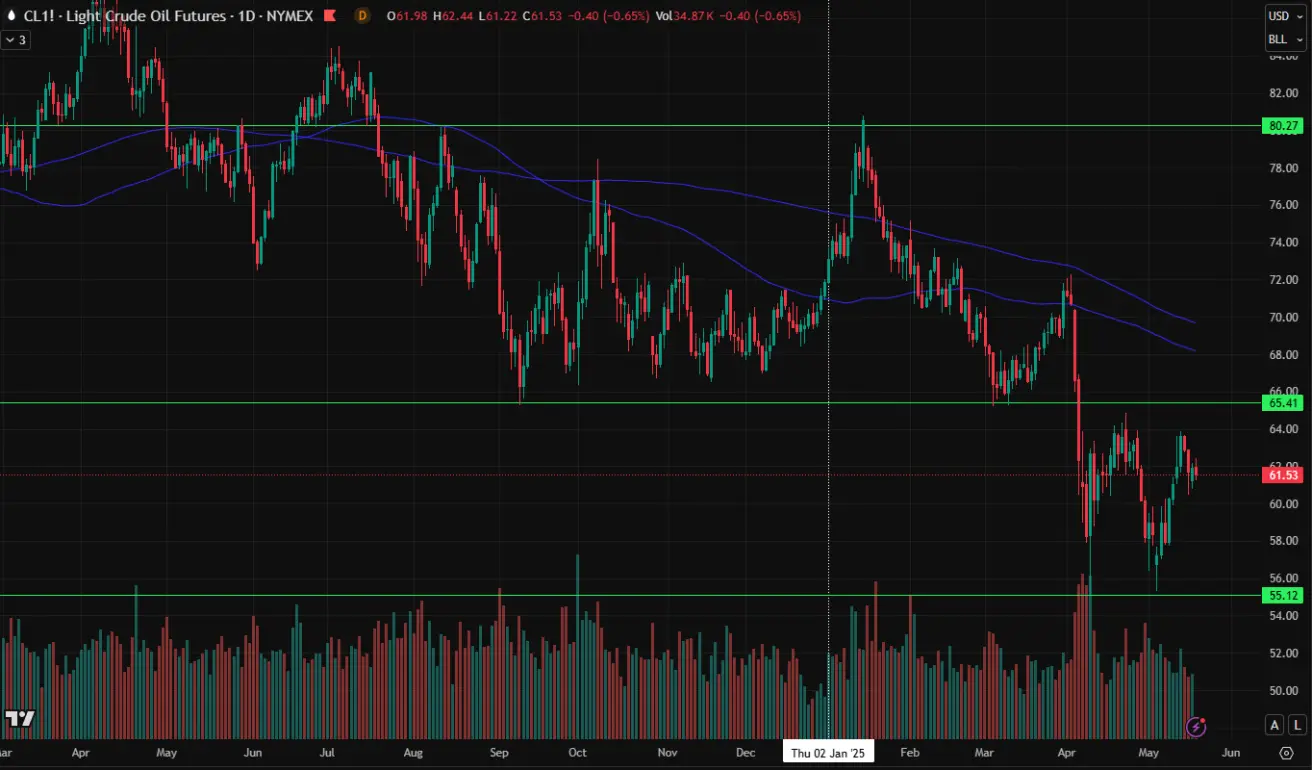 IEA Oil Market Report – May 2025:
Global oil-demand growth is expected to slow from +0.99 mb/d in 1Q25 to +0.65 mb/d by year-end amid economic headwinds and record EV sales. Average growth: +0.74 mb/d in 2025 and +0.76 mb/d in 2026, despite sharper OECD declines (–0.12 mb/d and –0.24 mb/d).
IEA Oil Market Report – May 2025:
Global oil-demand growth is expected to slow from +0.99 mb/d in 1Q25 to +0.65 mb/d by year-end amid economic headwinds and record EV sales. Average growth: +0.74 mb/d in 2025 and +0.76 mb/d in 2026, despite sharper OECD declines (–0.12 mb/d and –0.24 mb/d).
Global supply rises 1.6 mb/d in 2025 to 104.6 mb/d and another 0.97 mb/d in 2026. Non-OPEC+ adds 1.3 mb/d in 2025 and 0.82 mb/d in 2026, even as U.S. LTO slows. OPEC+ plans an extra 0.31 mb/d in 2025 and 0.15 mb/d in 2026.
Benchmark crude fell ~USD 10/bbl in Apr–May on higher tariffs and a bigger-than-expected OPEC+ output hike. Bearish sentiment eased after U.S.–UK and 90-day U.S.–China trade deals (8 May, 12 May).
OPEC MOMR – May 2025: World growth trimmed to 2.9 % (2025), unchanged at 3.1 % (2026).
GDP forecasts: U.S. 1.7 % (2025) | 2.1 % (2026); China 4.6 % | 4.5 %; India 6.3 % | 6.5 %.
Oil-demand growth unchanged at +1.3 mb/d (2025).
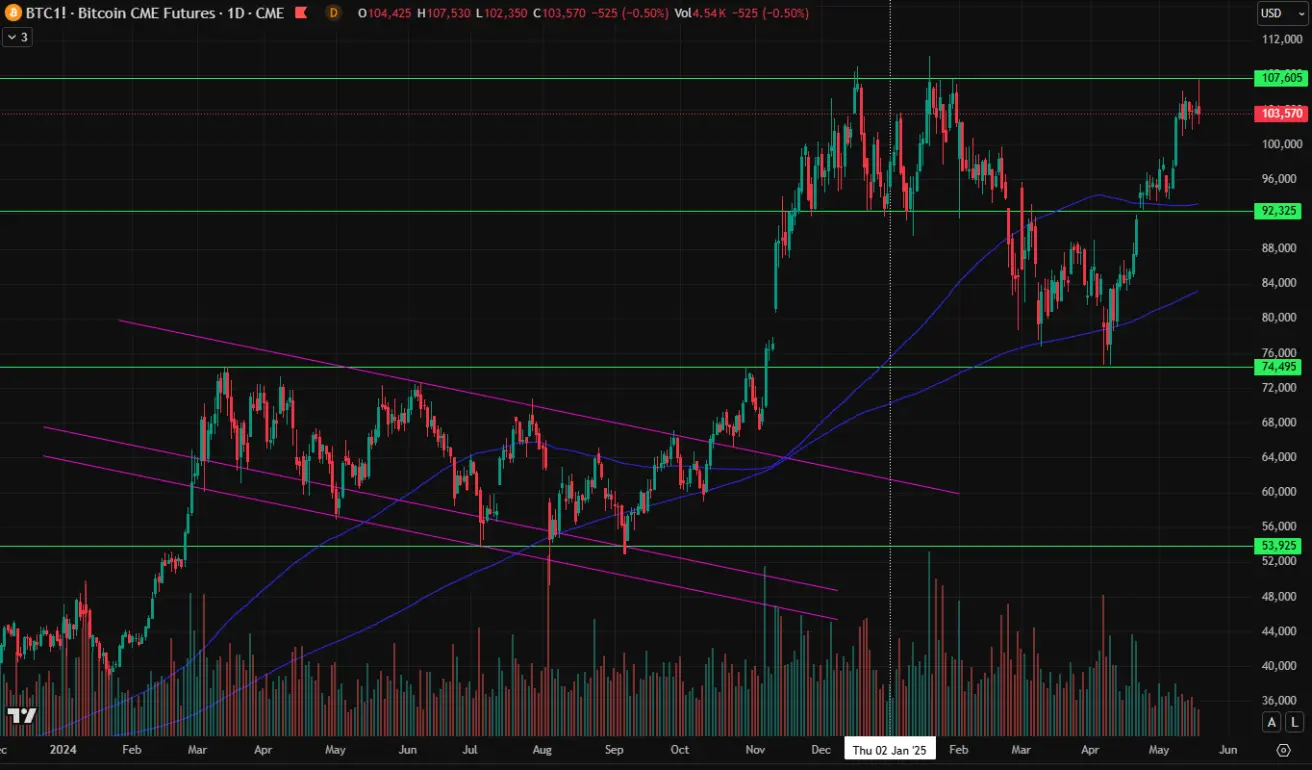
BTC FUTURES
+0.58 % w/w, close USD 104 095. YTD: +9.26 %
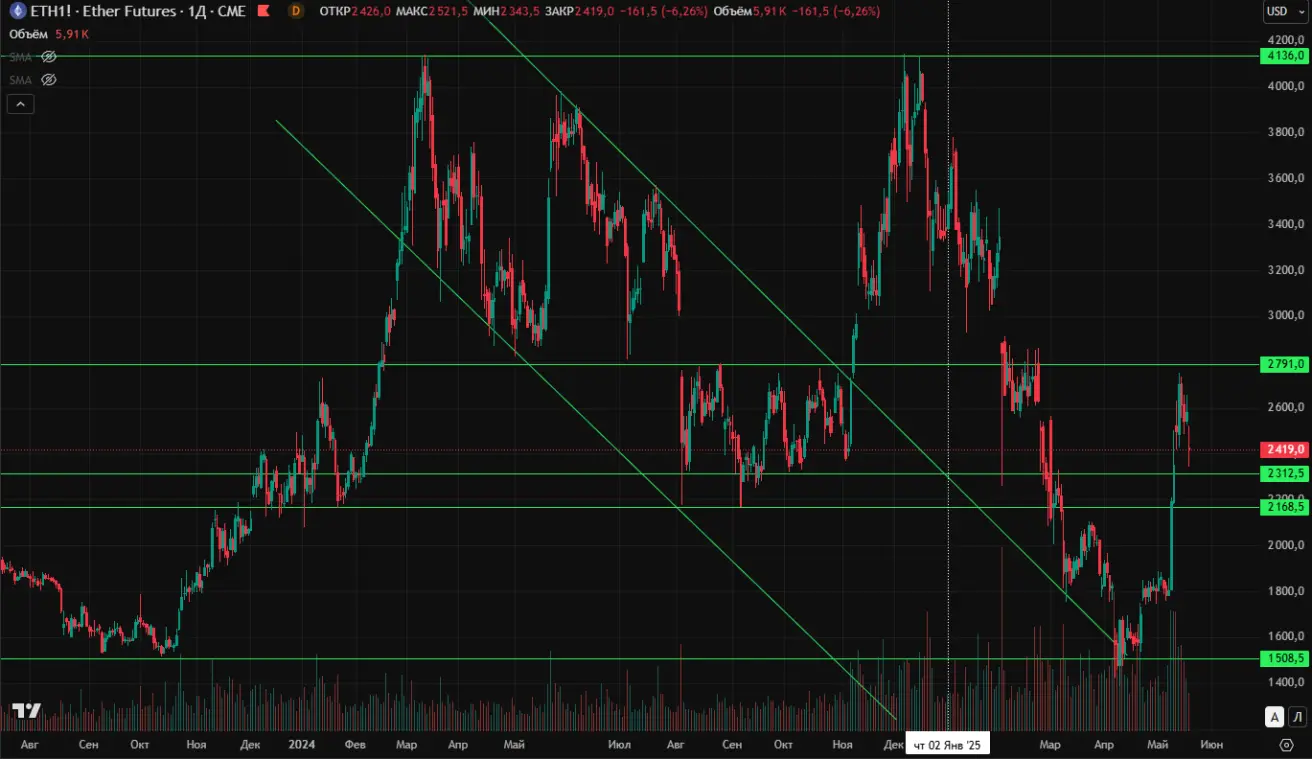
ETH FUTURES
+9.81 % w/w, close USD 2 580.5. YTD: –23.74 %
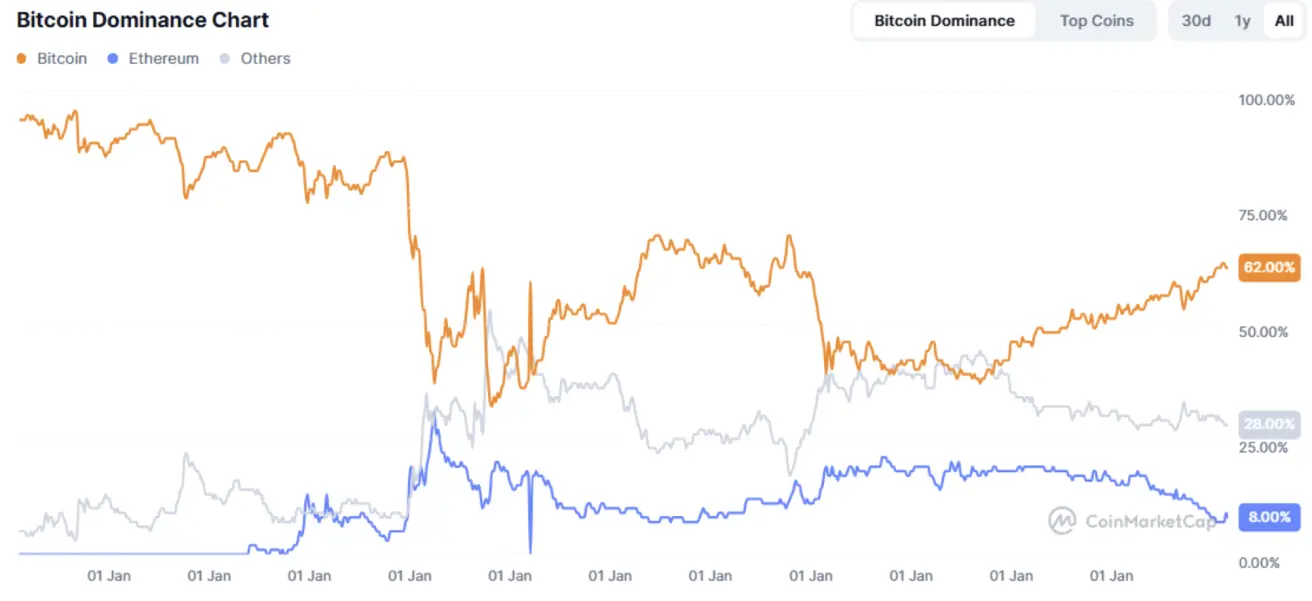
- Crypto-market cap: USD 3.25 tn (prev 3.35 tn)
- Share: BTC 62.9 %, ETH 9.0 %, others 28.1 %
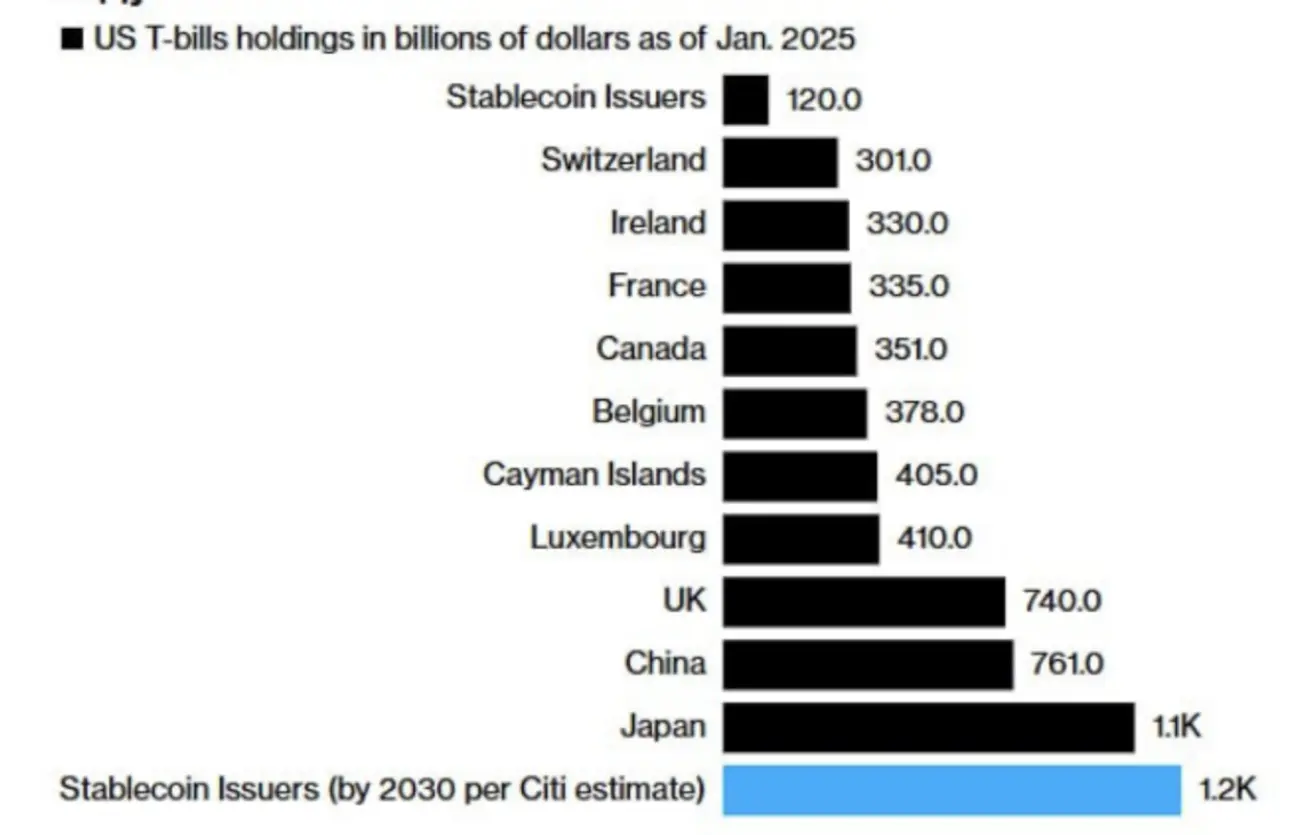
Stablecoin issuers are projected to become the largest holders of U.S. Treasury bills by 2030, ahead of Japan and China:
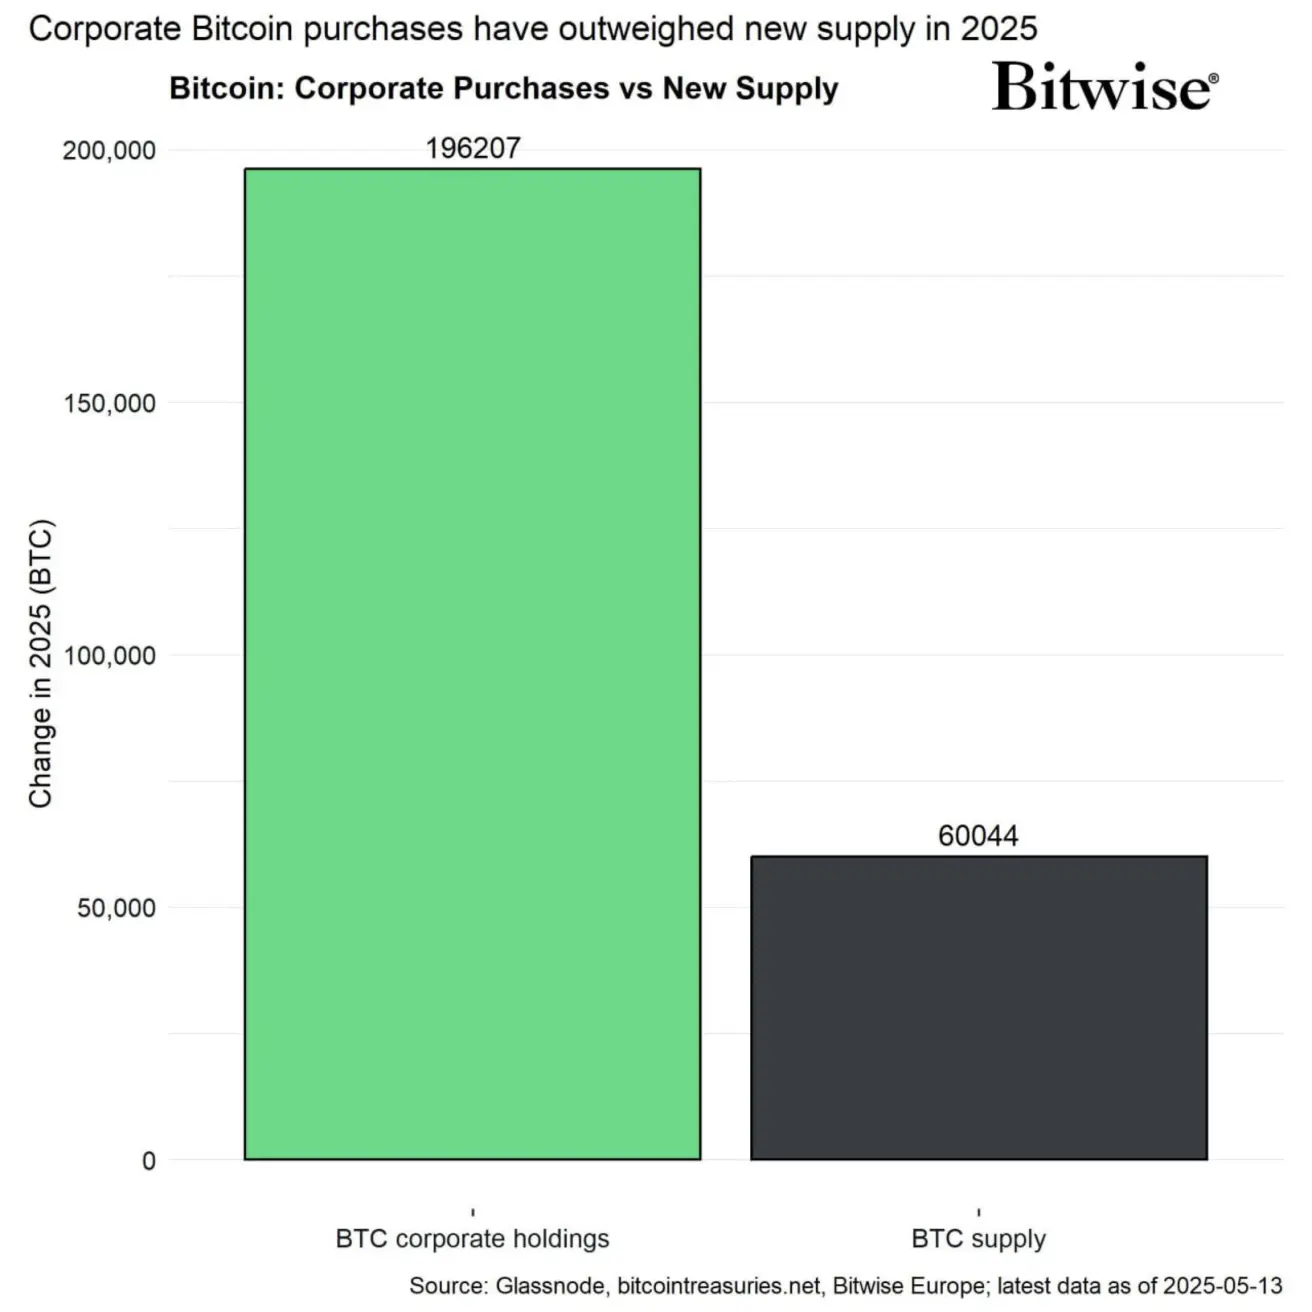
Institutional demand remains firm: according to Bitwise, corporates bought 3.3 × the newly mined Bitcoin supply in 2025.
- JPMorgan’s Bitcoin-ETF holdings: USD 1.7 bn (Form 13F).
- BlackRock filed to permit in-kind redemptions for its Ethereum Trust, enabling direct ETH redemptions.