 Lietuvių
 Русский
 Қазақша
 Eesti
EestiMay 19 - 23, 2025: Weekly economic update
Key market updates

MACROECONOMIC STATISTICS
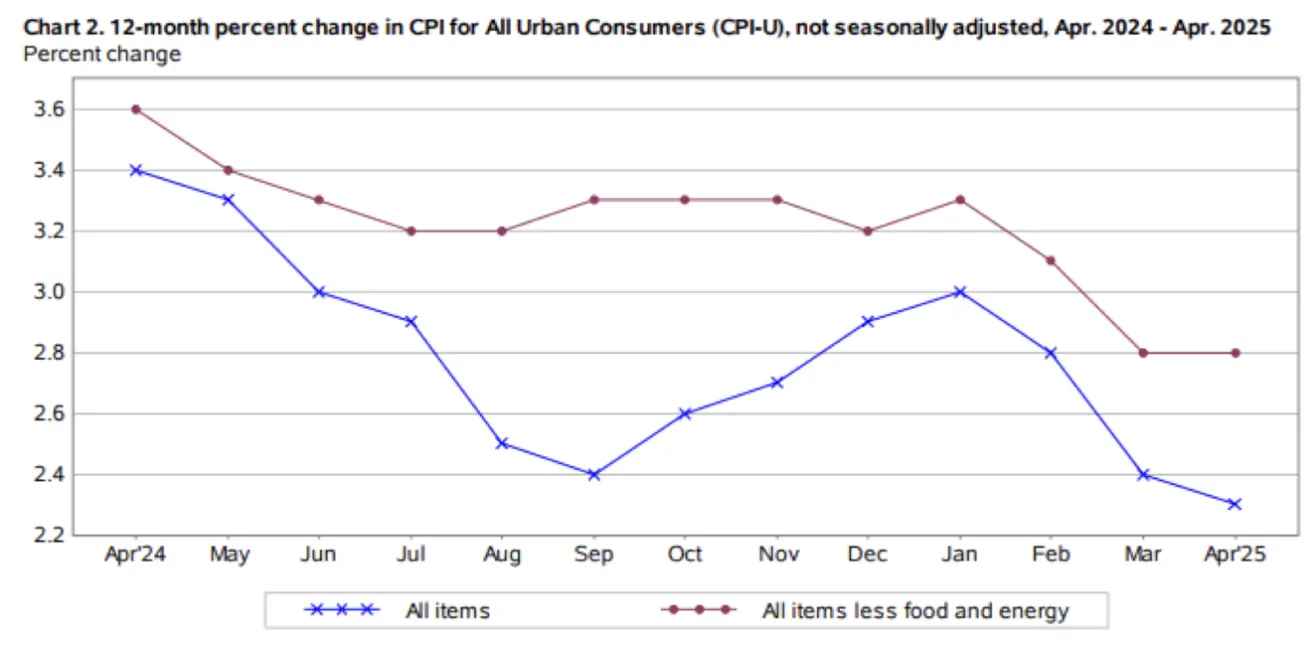
INFLATION
- Core Consumer Price Index (m/m) (Apr): 0.2 % (prev 0.1 %)
- Consumer Price Index (m/m) (Apr): 0.2 % (prev –0.1 %)
- Core Consumer Price Index (y/y) (Apr): 2.8 % (prev 2.8 %)
- Consumer Price Index (y/y) (Apr): 2.3 % (prev 2.4 %)
INFLATION EXPECTATIONS (MICHIGAN)
- 12-month expected inflation (May): 7.3 % (prev 6.5 %)
- 5-year expected inflation (Apr): 4.6 % (prev 4.4 %)
GDP (U.S. Bureau of Economic Analysis, BEA)
- US GDP (BEA, Q1 2025, preliminary): -0.3% (Q4 2024 revised: +2.4%)
- Atlanta Fed’s GDPNow (Q2 estimate): +2.5% (vs. previous: 2.3%)
(The GDPNow forecasting model offers a "real-time" approximation of official GDP growth before its release, using methodology similar to that of the BEA.)
Business Activity Index (PMI)
(Above 50 indicates expansion; below 50 indicates contraction)
- Services (Apr): 52.3 (previous: 50.8)
- Manufacturing (May): 52.3 (previous: 50.7)
- Composite (May): 52.1 (previous: 50.6)
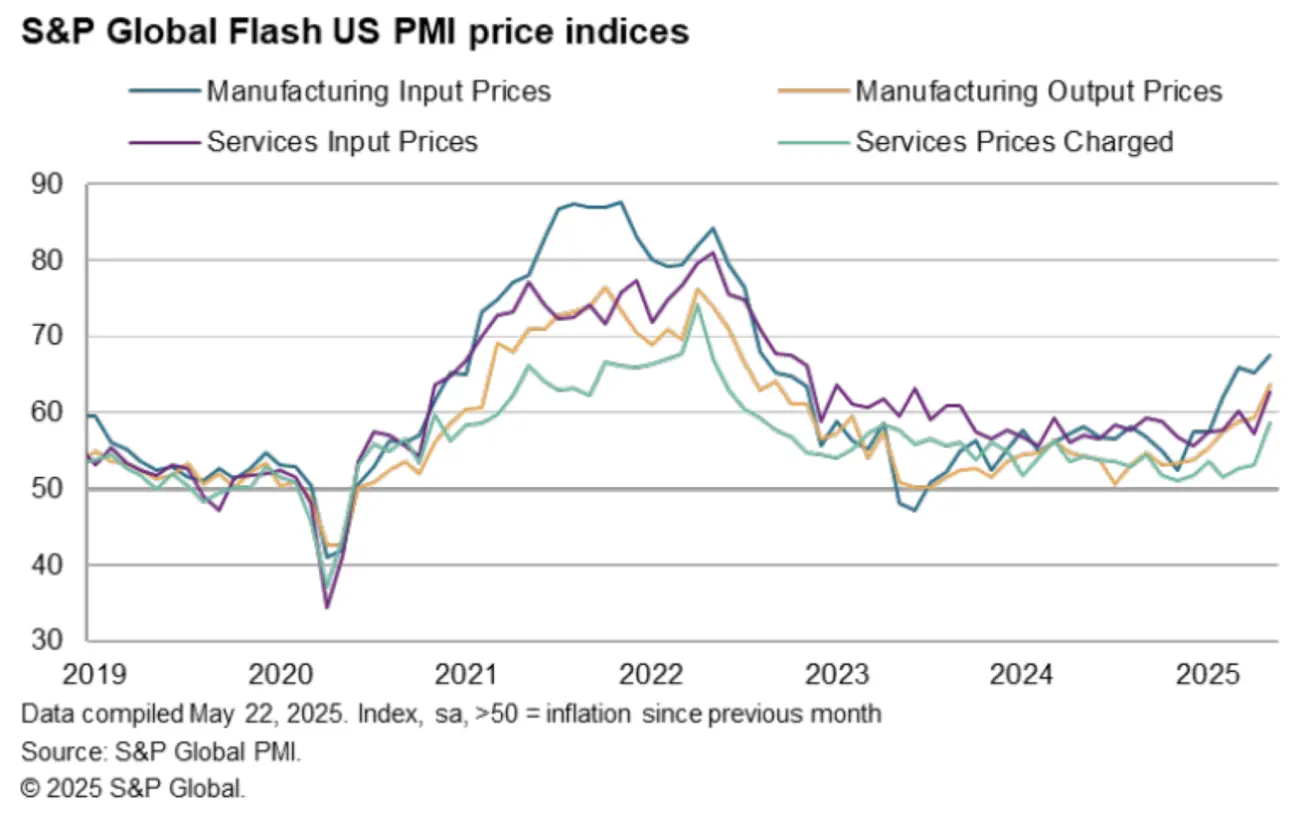
Price components from the S&P Global Flash US PMI® report:
LABOR MARKET:
- Unemployment Rate (Apr): 4.2% (unchanged)
- Non-farm Payrolls (Apr): +177K (previous revised: 185K)
- Average Hourly Earnings (YoY, Apr): +3.8% (unchanged)
MONETARY POLICY
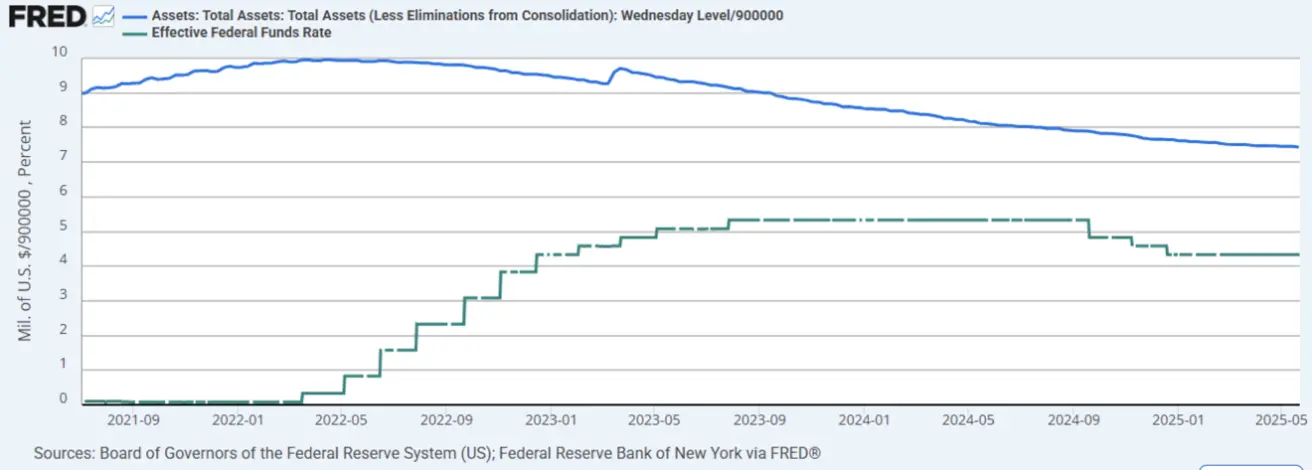
- Federal Funds Rate (EFFR): 4.25–4.50%
- Fed Balance Sheet: Reduced by $25 billion to $6.688 trillion (previous: $6.713 trillion)
MARKET FORECAST FOR RATE
Today:
А week earlier:
Commentary According to the S&P Global business activity release for May, data showed economic expansion in both the services sector (52.3) and manufacturing (52.3). Average prices for goods and services surged in May at a pace not seen since August 2022, when pandemic-induced supply shortages triggered broad-based price inflation. The sharpest increase was observed in producer output prices, which registered the strongest monthly gain since September 2022. Service sector fees rose at the fastest pace since April 2023. The latest rise in output prices was largely driven by tariffs, which either directly inflated the cost of imported inputs or compelled suppliers to pass on tariff-induced cost increases. Input costs in manufacturing rose at their fastest rate since August 2022, while cost pressures in services accelerated at the fastest pace since June 2023.
This pricing trend contrasts with the CPI index, which has been declining for five consecutive months since the beginning of the year. While the CPI reflects final consumer prices, the PMI price index captures pricing pressures within the production chain — and has shown consistent growth over the same five-month period, particularly in producers’ input costs and the services sector.
This divergence suggests that we are likely to see upward movement in final output prices, as most economic agents are expected to pass on inflationary pressures to end consumers. Accordingly, it would be reasonable to anticipate higher readings in upcoming consumer inflation (CPI) releases.
In the Eurozone, the latest PMI data pointed to a slowdown in economic activity across all sectors: services fell to 48.9, manufacturing to 48.4, and the composite index dropped to 49.5. Core consumer inflation (CPI) in the EU accelerated slightly to 2.7% (from 2.4%), while headline CPI remained unchanged at 2.2%. While these levels are not yet critical, the underlying trend is negative — indicating slowing activity amid rising inflation.
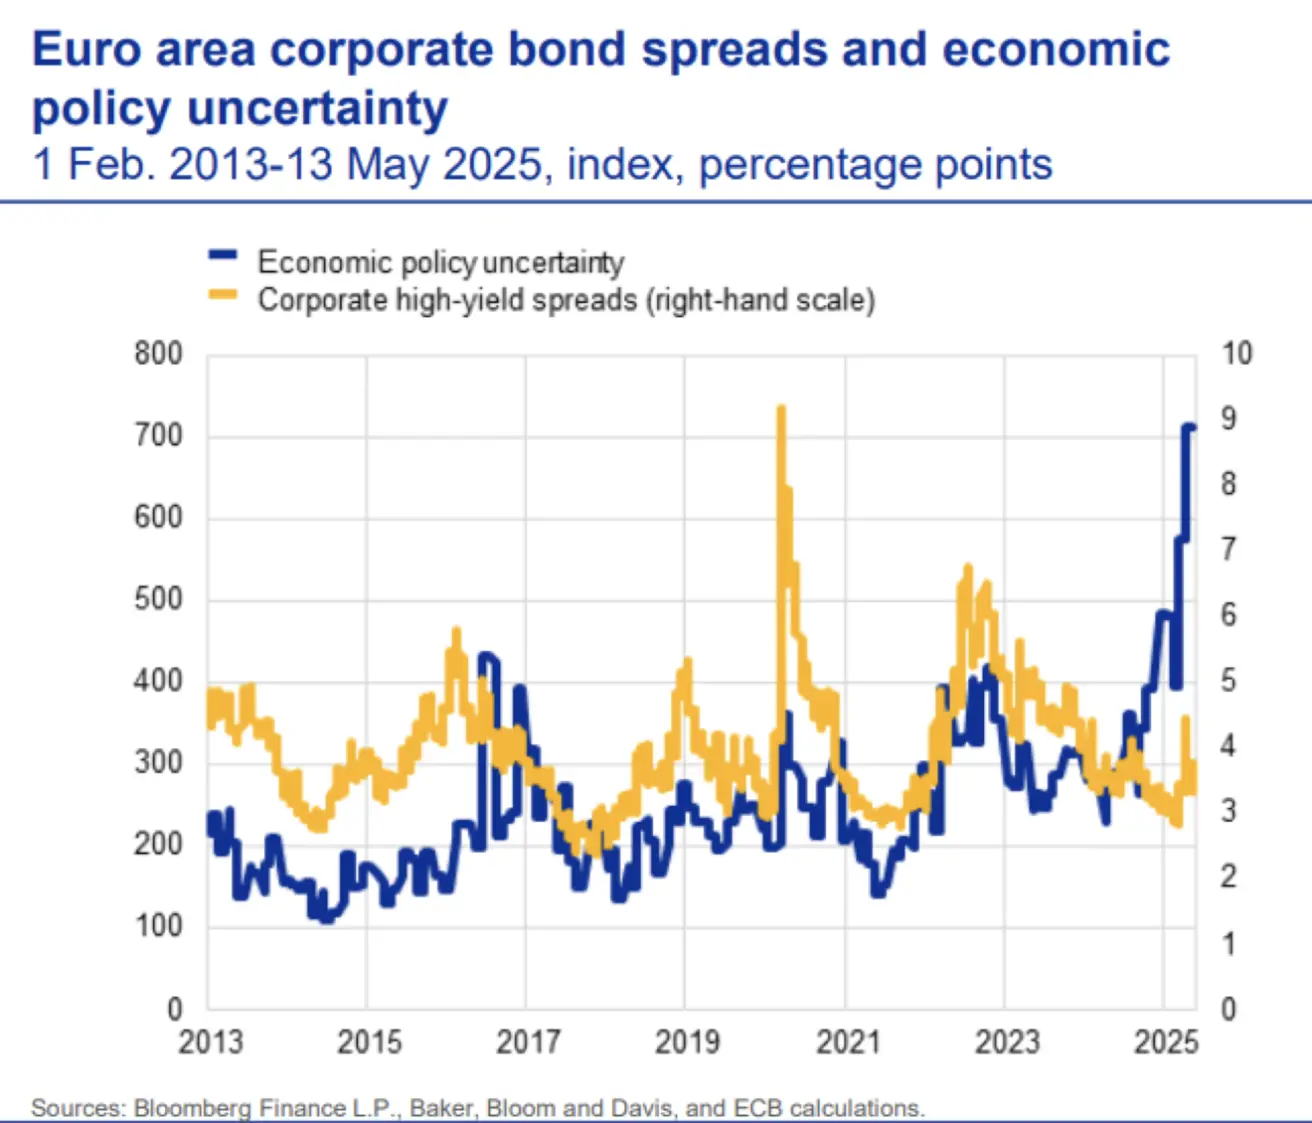
The ECB’s May 2025 Financial Stability Review noted that corporate bond spreads have widened somewhat this year. Spread widening typically signals growing economic risk, although they remain in the lower range of historical norms. Policy uncertainty — represented by the blue line — remains elevated. While tariff negotiations between the EU and the U.S. have shown no meaningful progress, former President Trump has walked back on threats to impose 50% tariffs on EU imports starting June 1, after the bloc requested more time to negotiate “a favorable deal”:
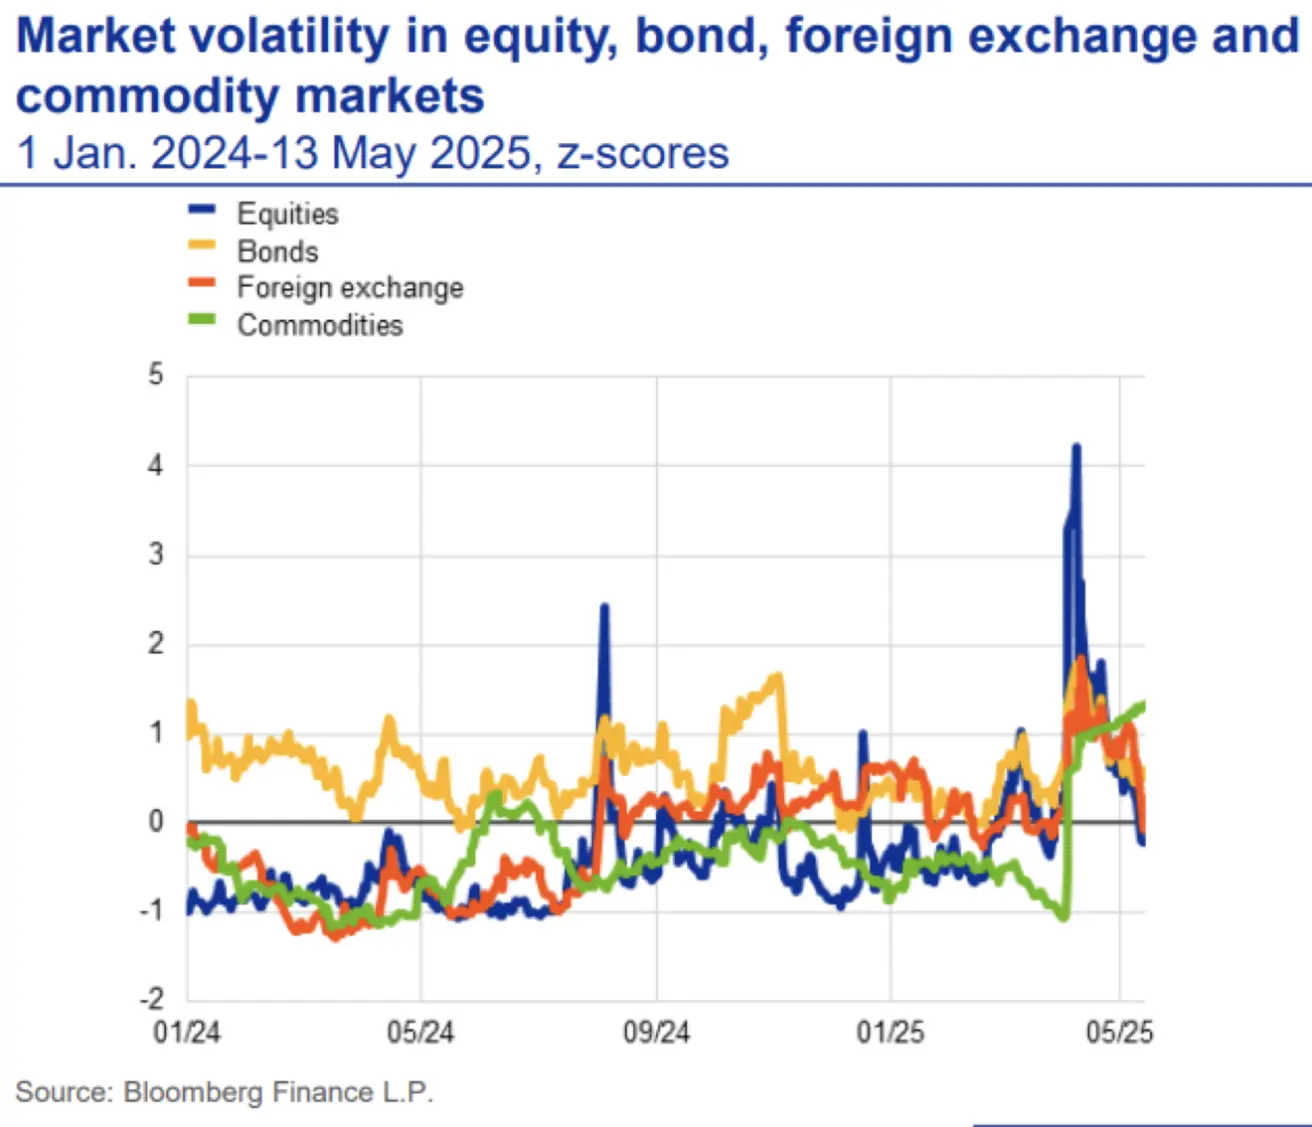
Volatility across equities, bonds, and forex markets has returned to historical averages following April’s spike. However, commodity market volatility remains elevated, reflecting ongoing tariff-related risks:
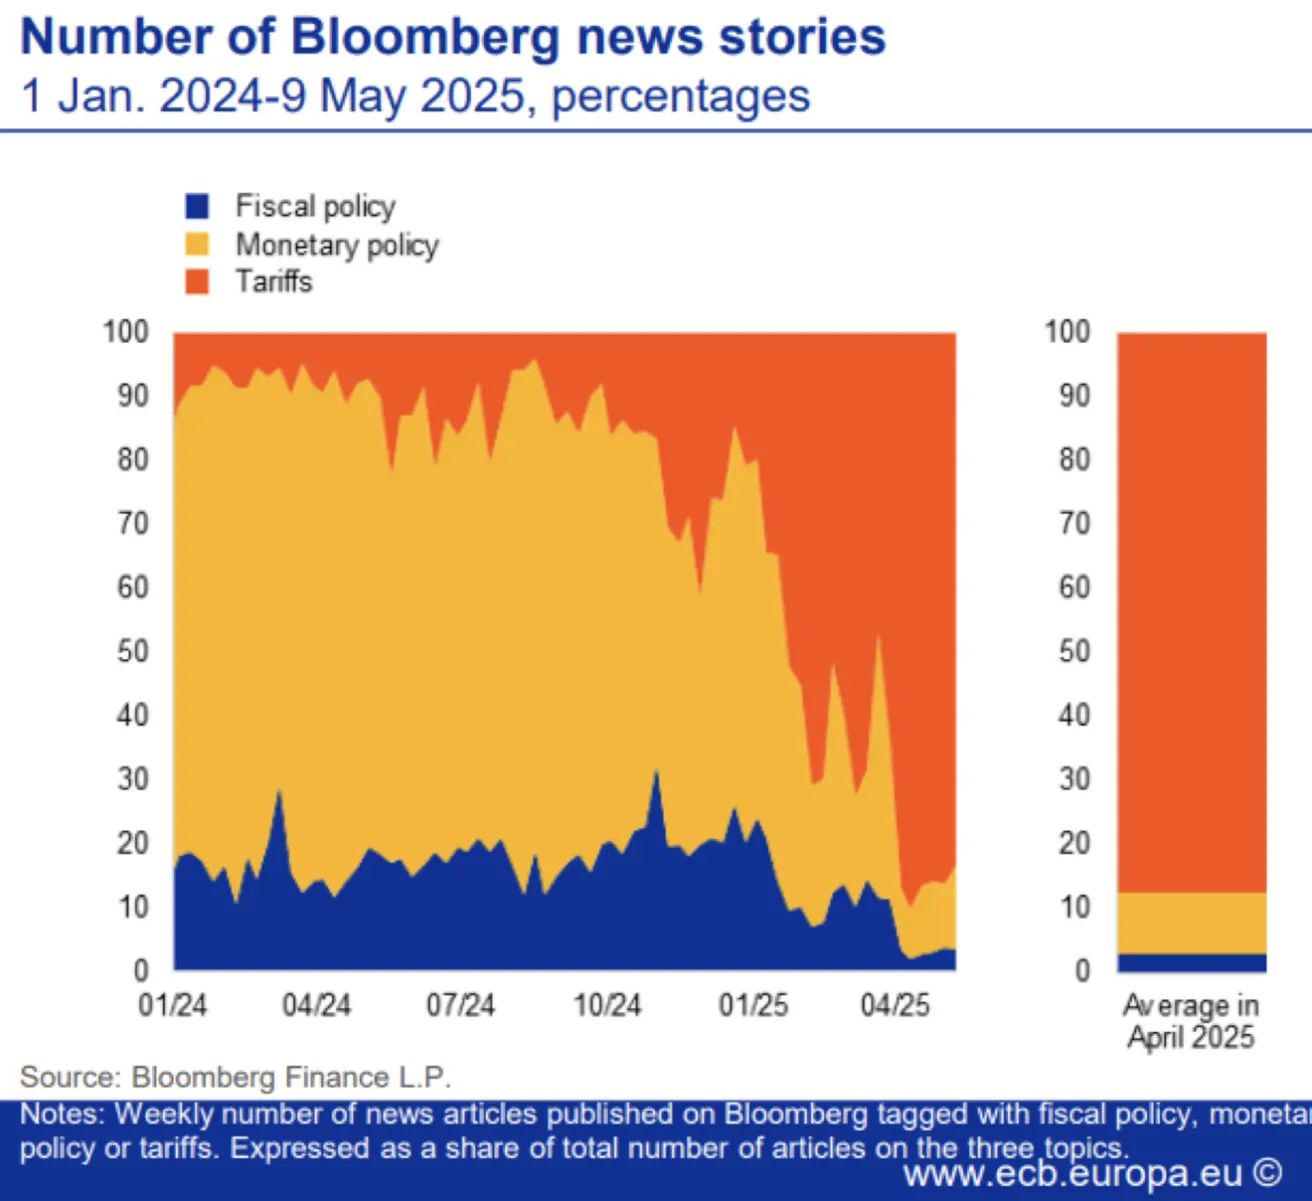
A Bloomberg-based quantitative measure of tariff uncertainty in the EU — derived from media reporting — shows that nearly all market focus remains on tariffs, with only 10% of coverage concerning monetary policy and virtually none addressing fiscal policy (illustrated by the orange zone):
China’s unemployment rate dropped by 0.1% in April to 5.1%, marking a post-COVID low:
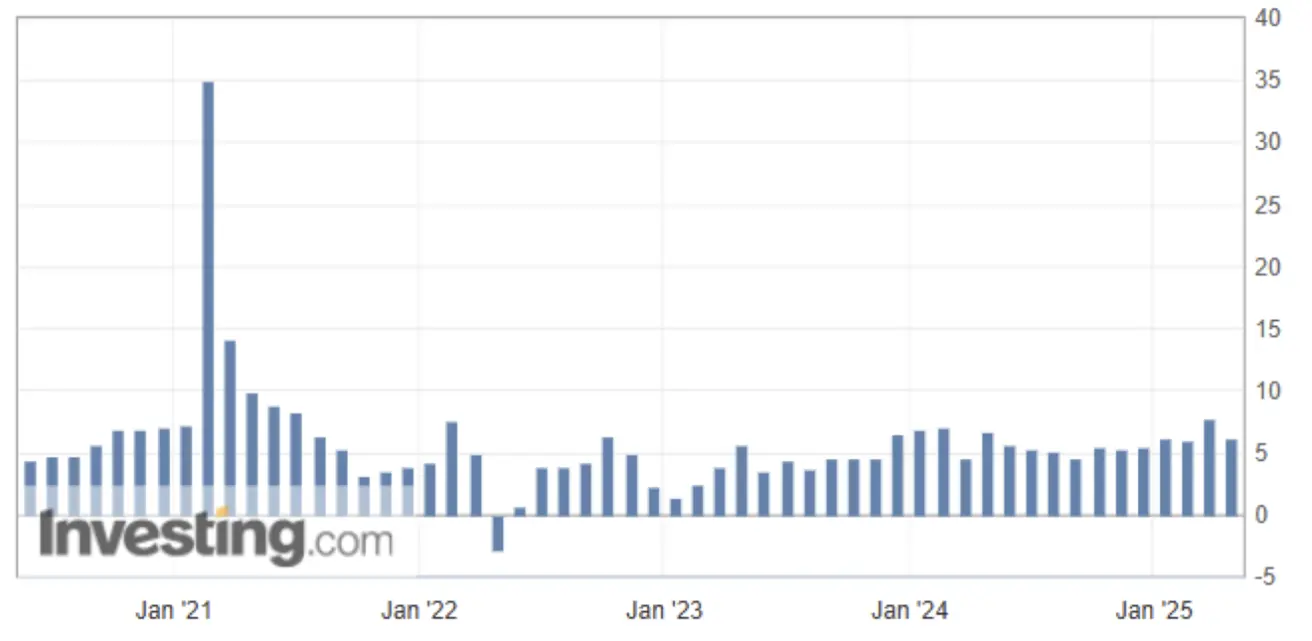
Meanwhile, industrial production growth slowed to 6.1% year-over-year (down from 7.7%). This level is broadly consistent with the 2024 average and remains above 2020–2023 figures:
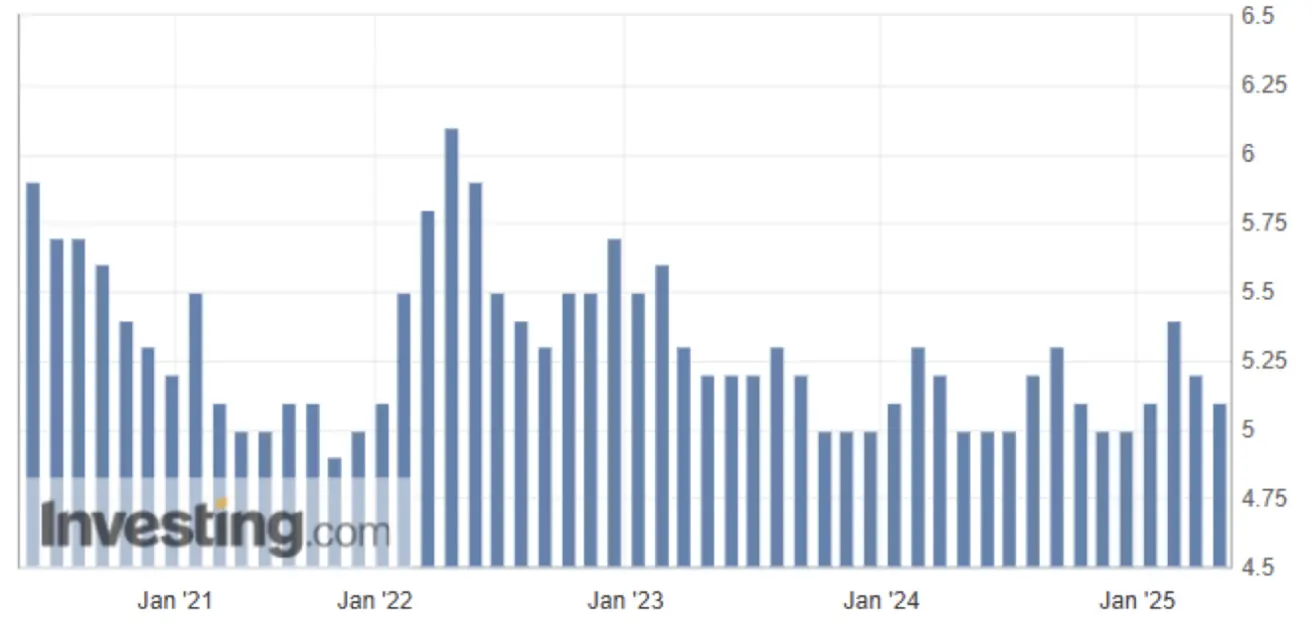
The People’s Bank of China lowered both the 1-year and 5-year benchmark lending rates:
- 1-year: reduced to 3.50% (from 3.60%)
- 5-year: reduced to 3.00% (from 3.10%)
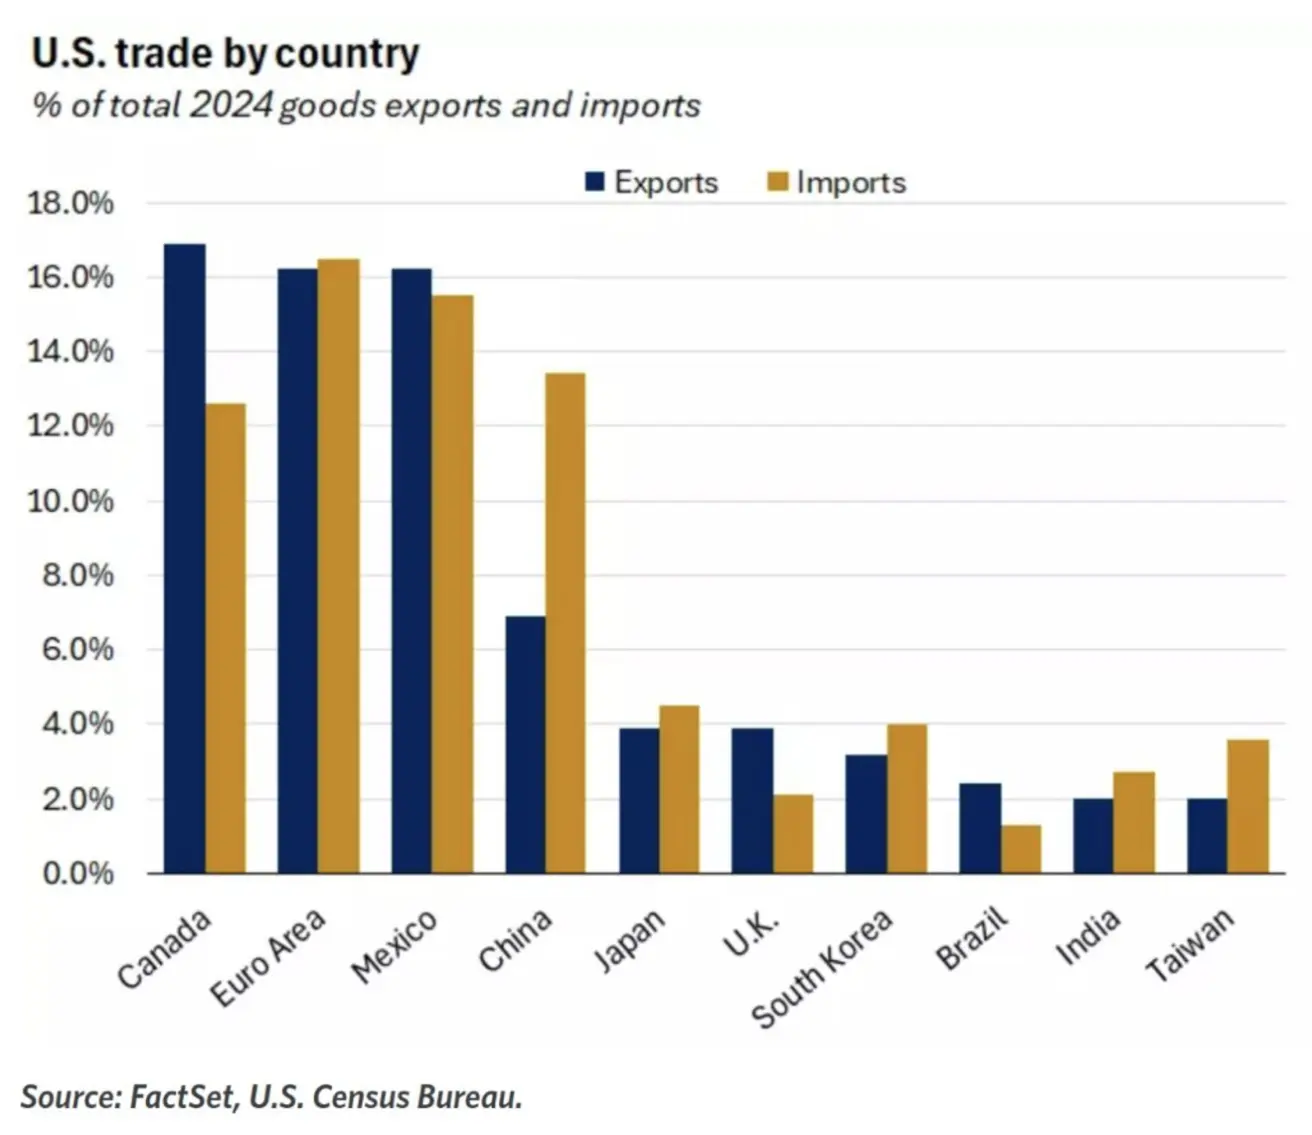
Trade volumes remain a key imbalance, most notably with China:
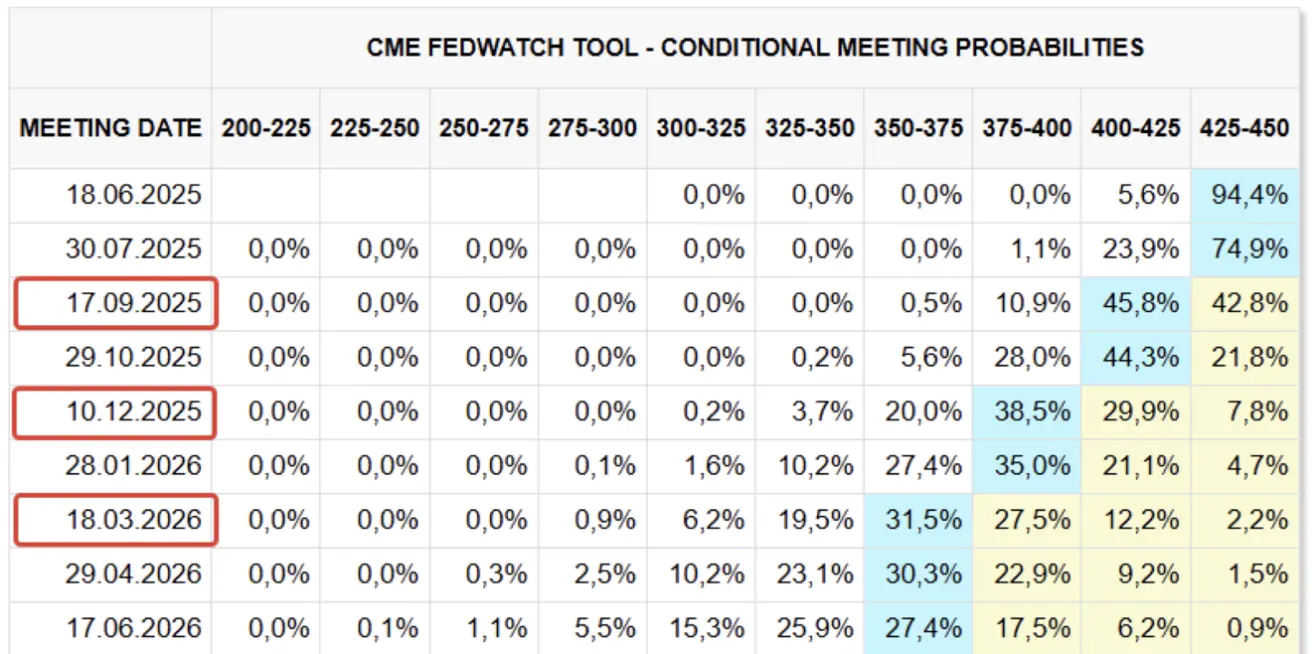
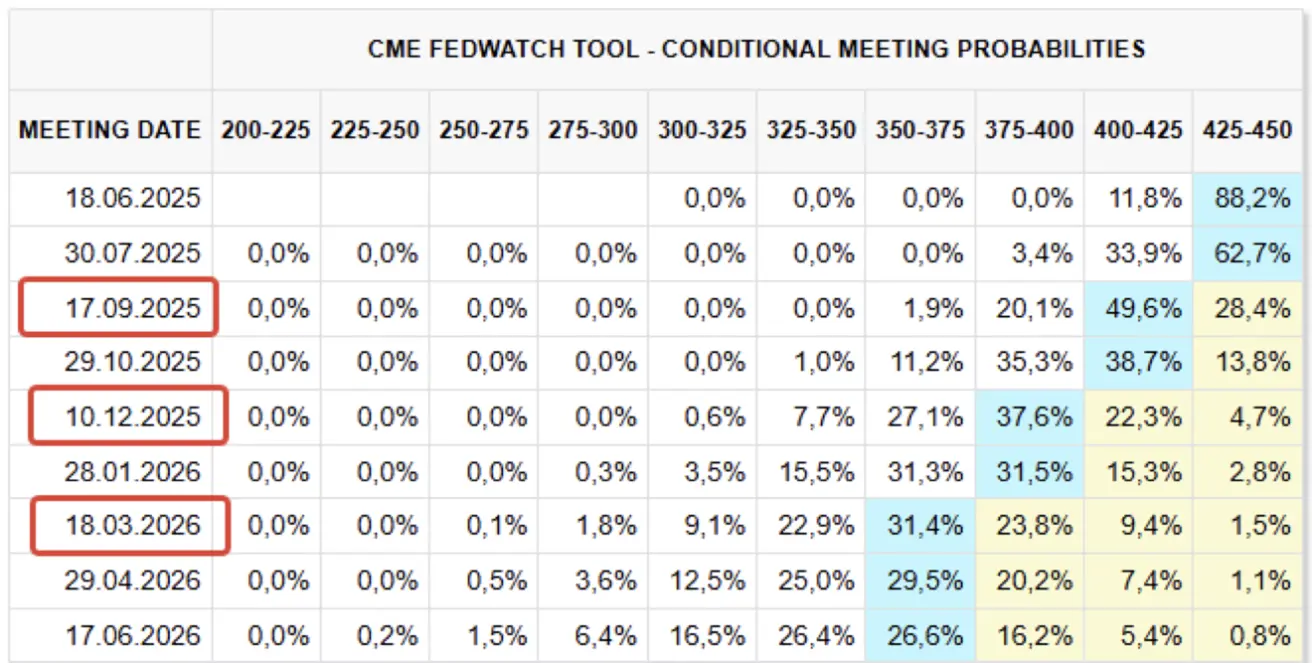
FedWatch rate expectations for the next 12 months remain unchanged: markets are pricing in three 25 bps cuts, bringing the target range to 3.50–3.75%. The first move is expected in August this year.
The next FOMC meeting is scheduled for June 18, with markets currently assigning a 94% probability to rates remaining in the 4.25–4.50% range.
Equity Market
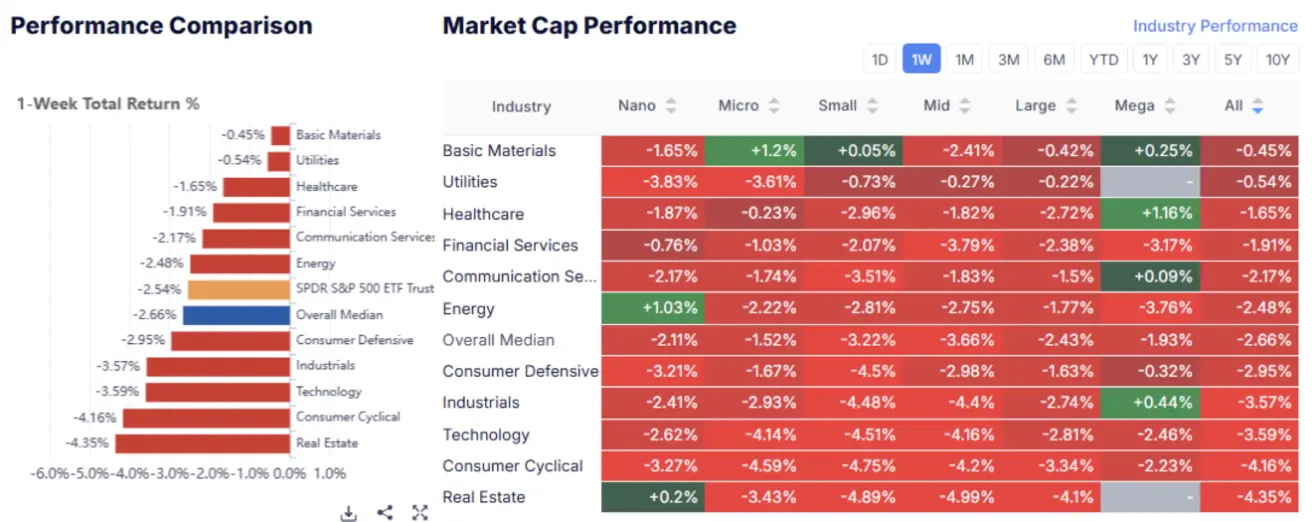
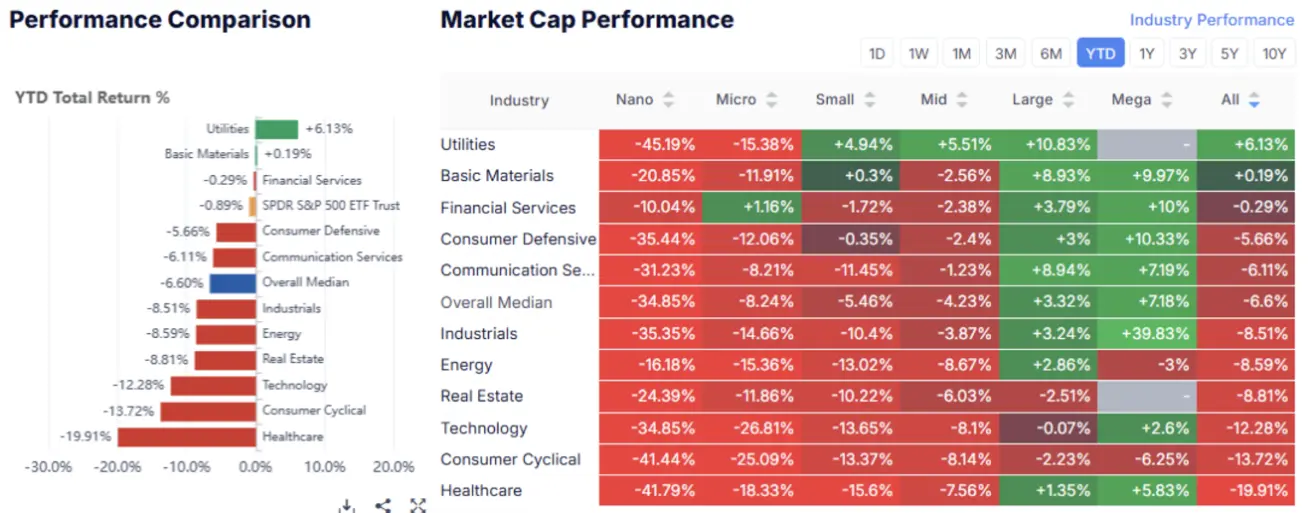
The market ended the week in negative territory across all sectors and capitalizations.
Median weekly decline: -2.66%:
YTD performance: -6.6% median decline; only utilities sector remains in positive territory:
MARKET
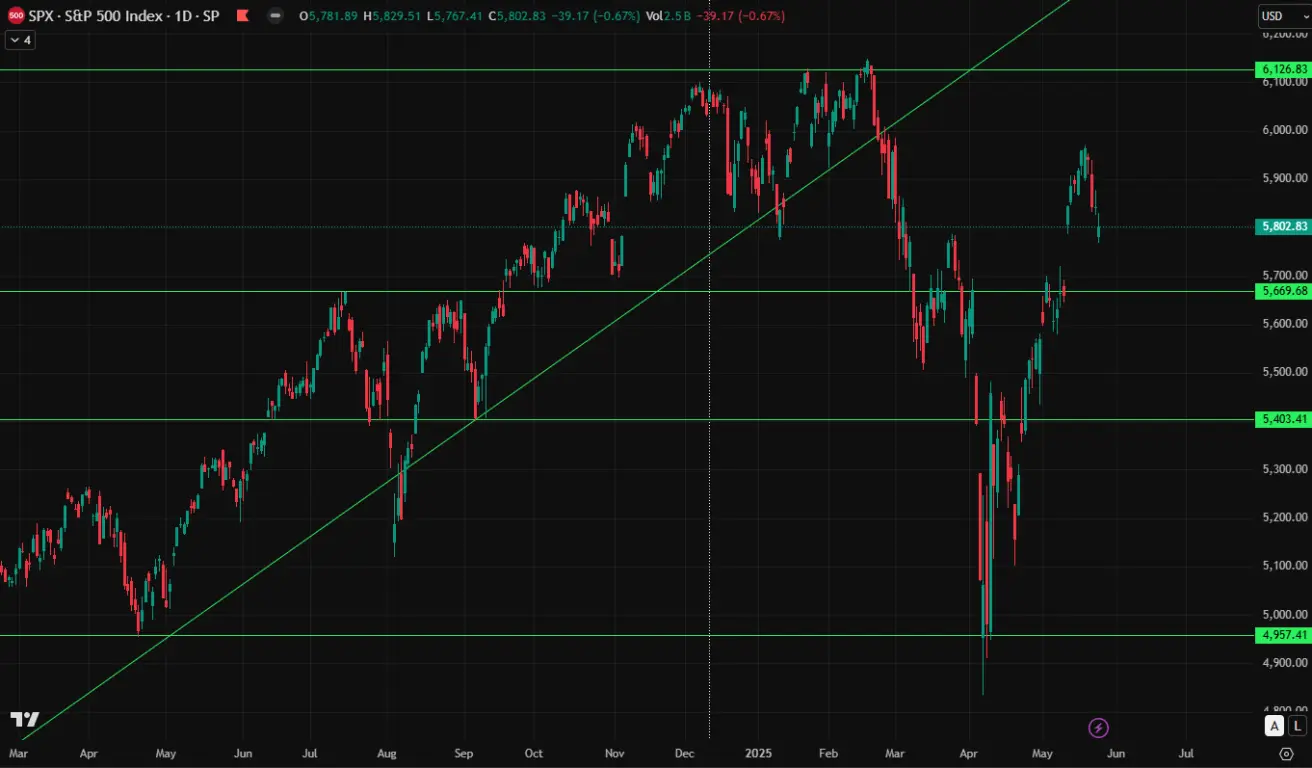
Stock indices experienced a slight pullback following a V-shaped recovery. The increase in volatility, as measured by the VIX index, was moderate, rising to 22.
SP500
-2.61% | Week Close: 5802.83 | YTD: -1.70%
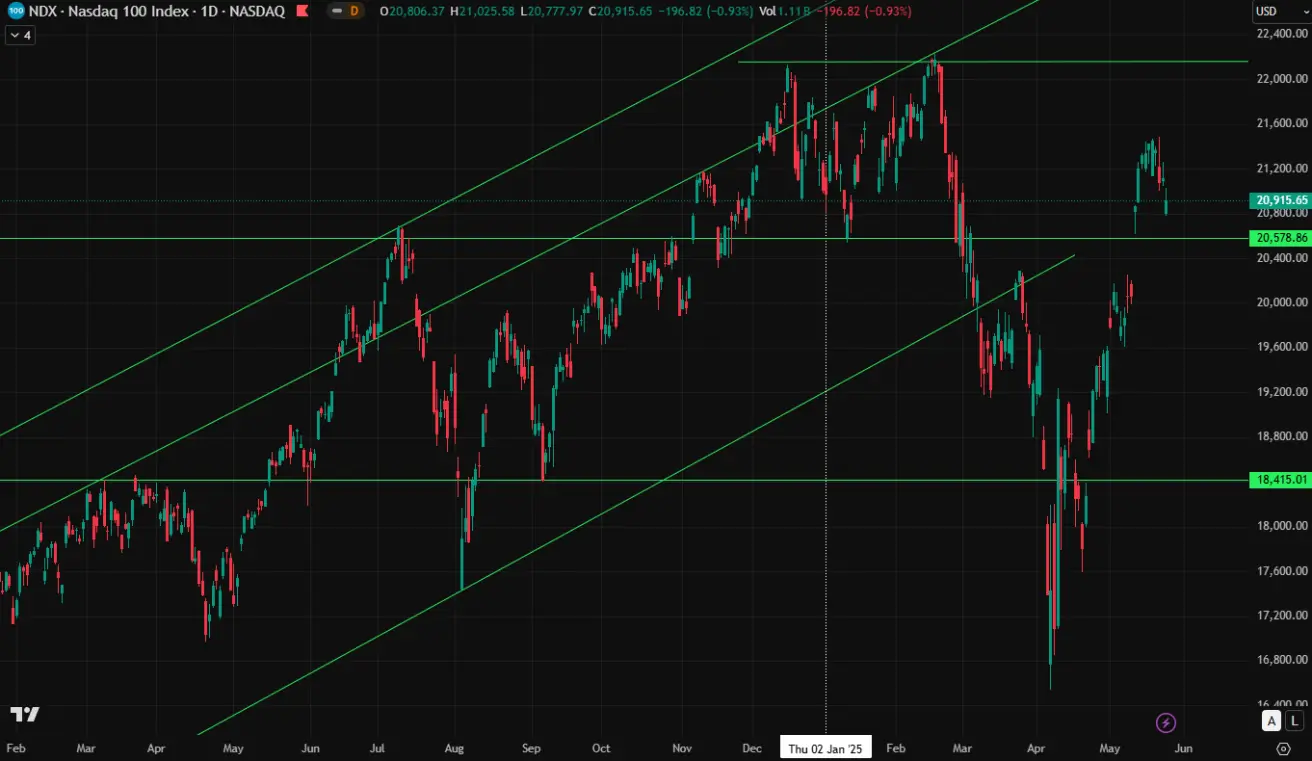
NASDAQ100
-2.39% | Week Close: 20915.65 | YTD: -0.97%
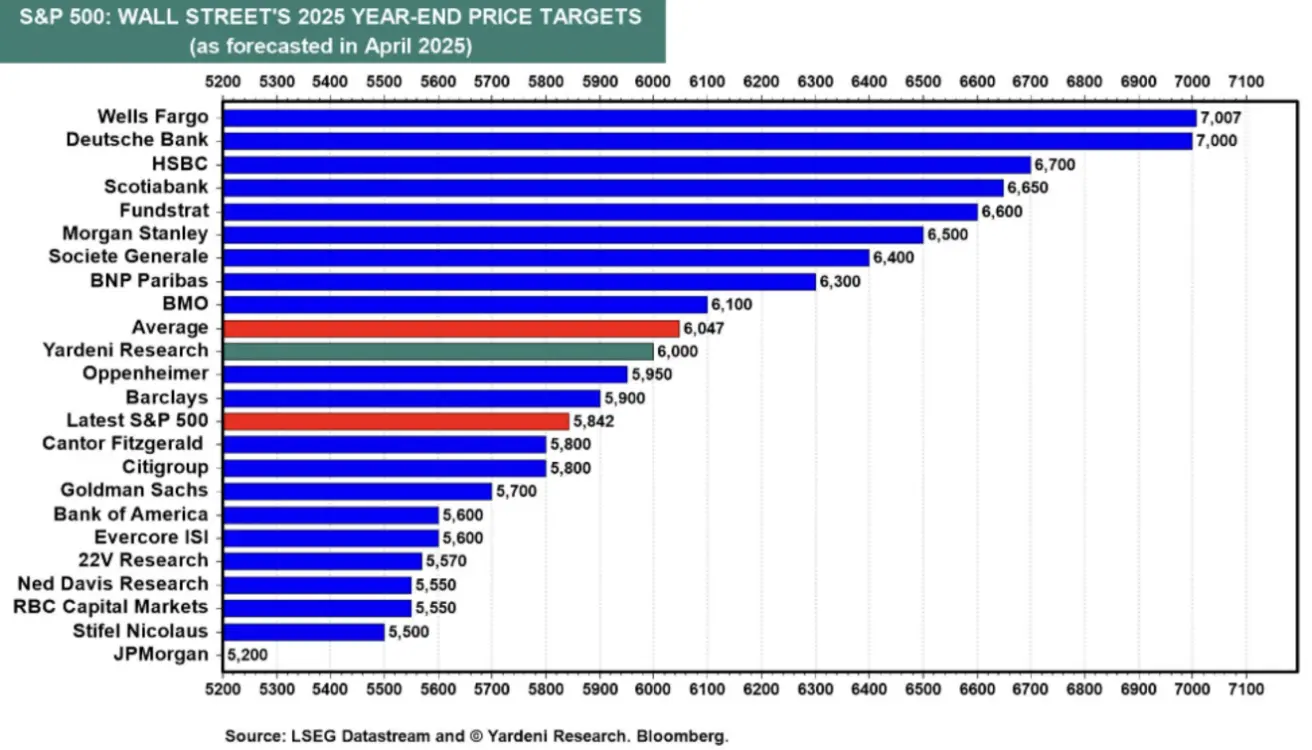
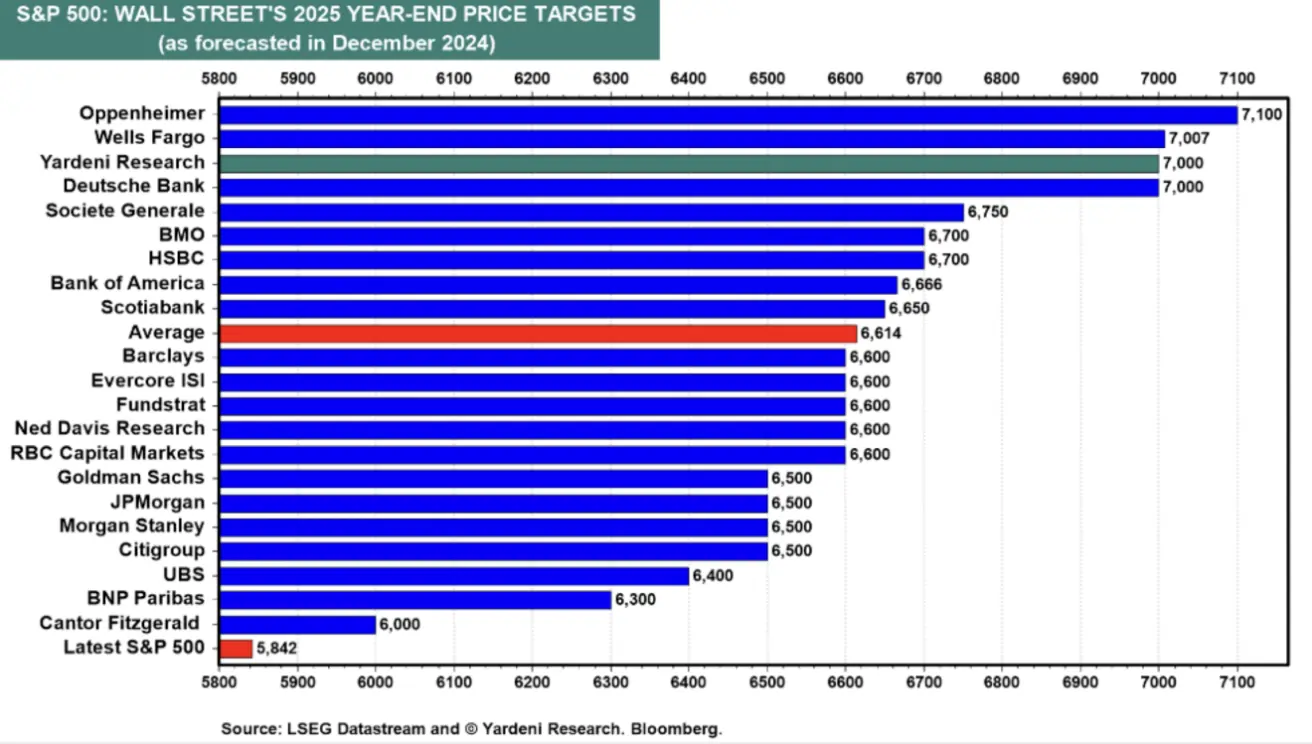
April forecasts (post-tariff) from Yardeni Research for the S&P 500 index year-end target, compared to the December projections.
Optimists such as Wells Fargo and Deutsche Bank have maintained their forecasts. Yardeni has revised his target down from 7,000 to 6,000. The average across the surveyed forecasts has declined from 6,600 to 6,000. Among the projections now below the current index level, the range lies between 5,500 and 5,800. The most bearish outlook comes from JP Morgan, forecasting 5,200.
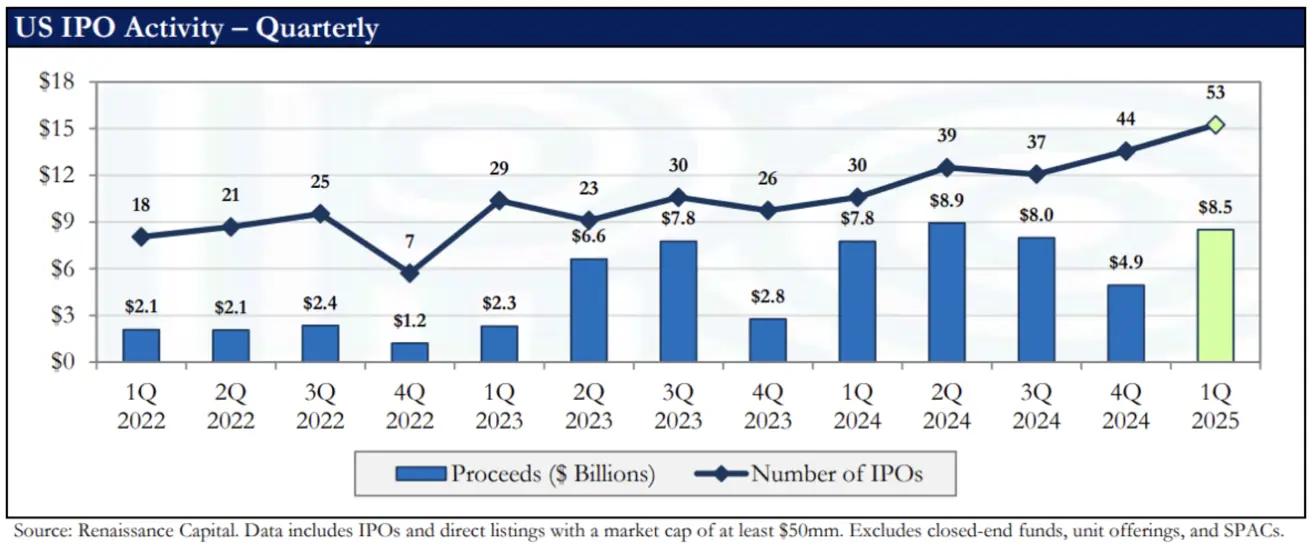
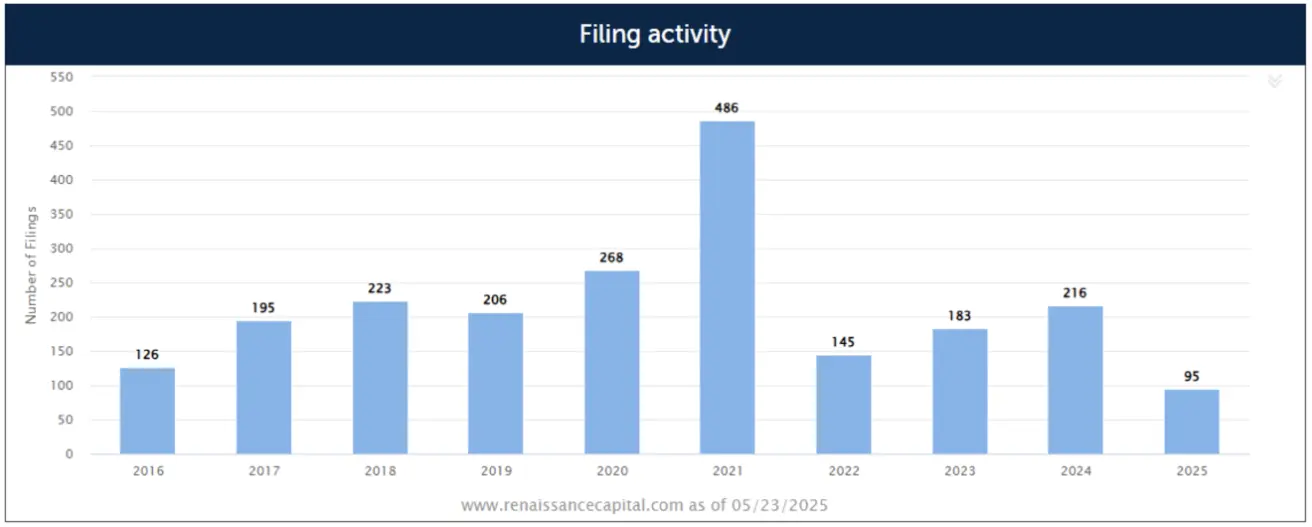
The IPO market overall remains in reasonably good shape despite the Risk-Off sentiment observed in March and April.
1Q 2025 Quarterly Review — Key Takeaways:
- A total of 53 IPOs raised over $8 billion, even though heightened volatility dampened deal flow in March.
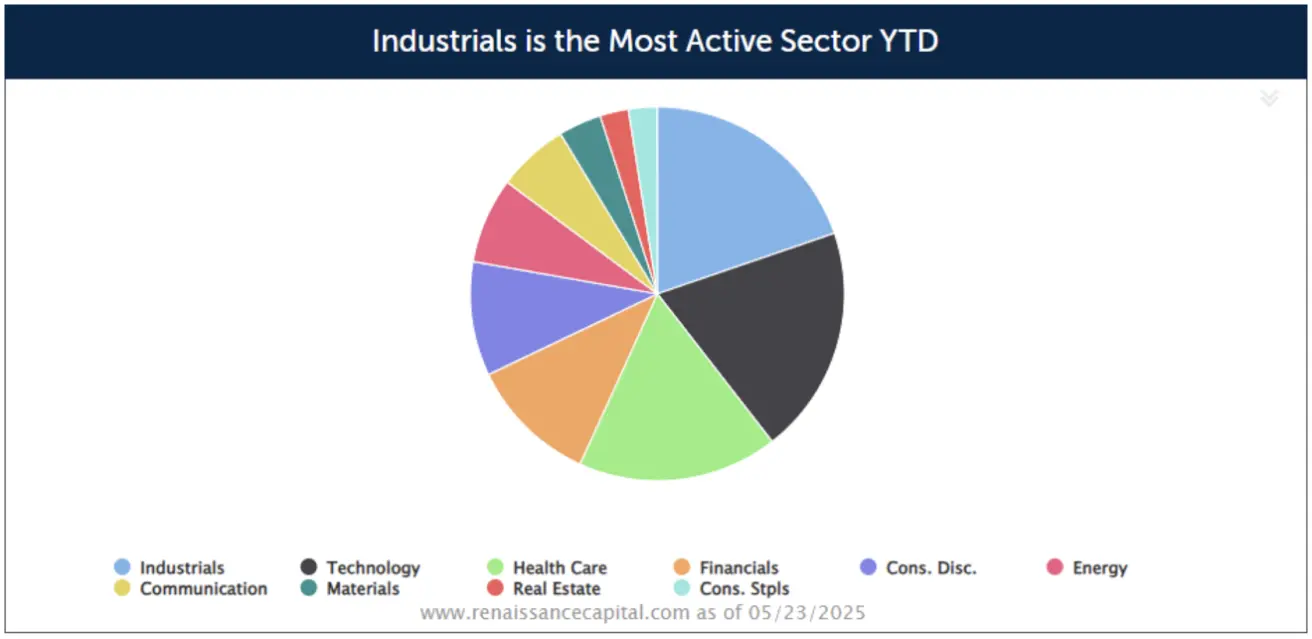
- Healthcare leads in IPO activity, while the technology sector remains the primary driver of proceeds:
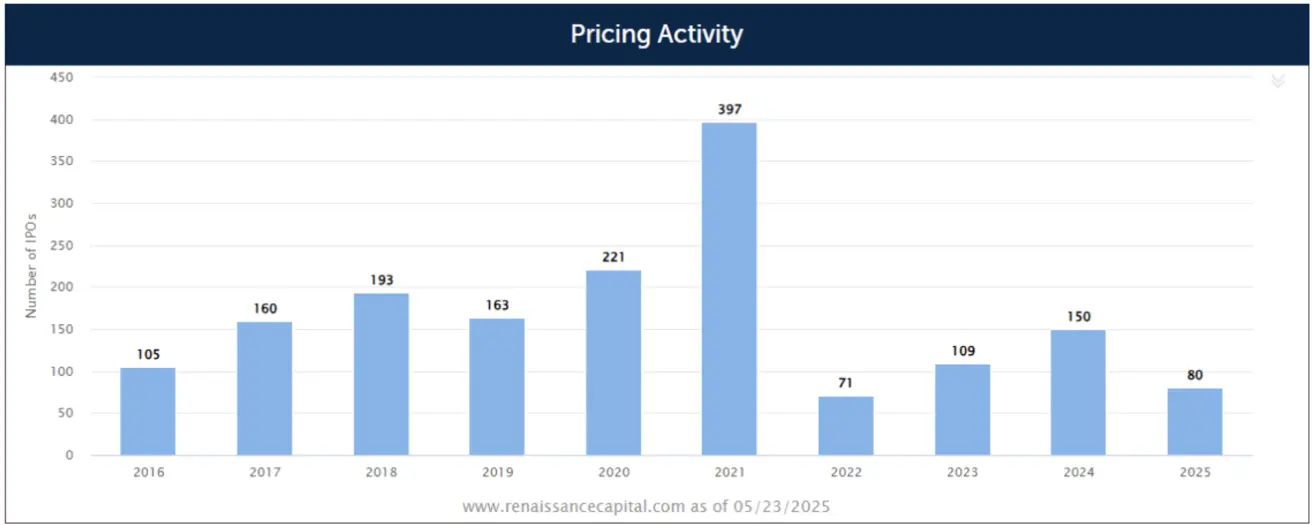
 There have been 80 IPOs priced this year, a +37.9% change from the same date last year.
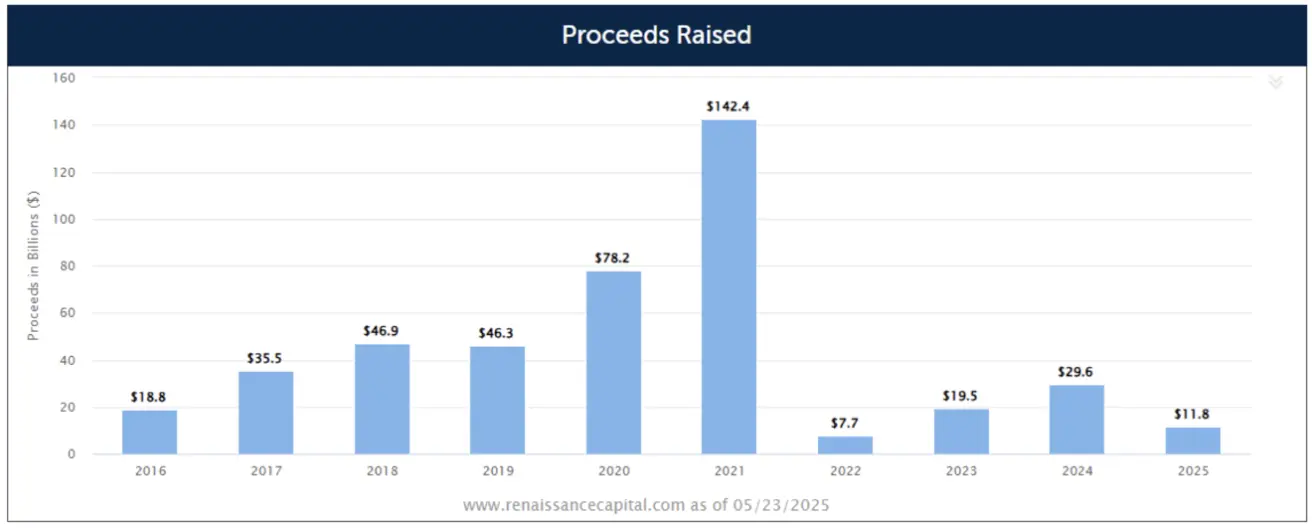
 Total proceeds raised were $11.8 bil this year, a -16.5% change from the same date last year.
 There have been 95 IPOs filed this year, a +21.8% change from the same date last year.
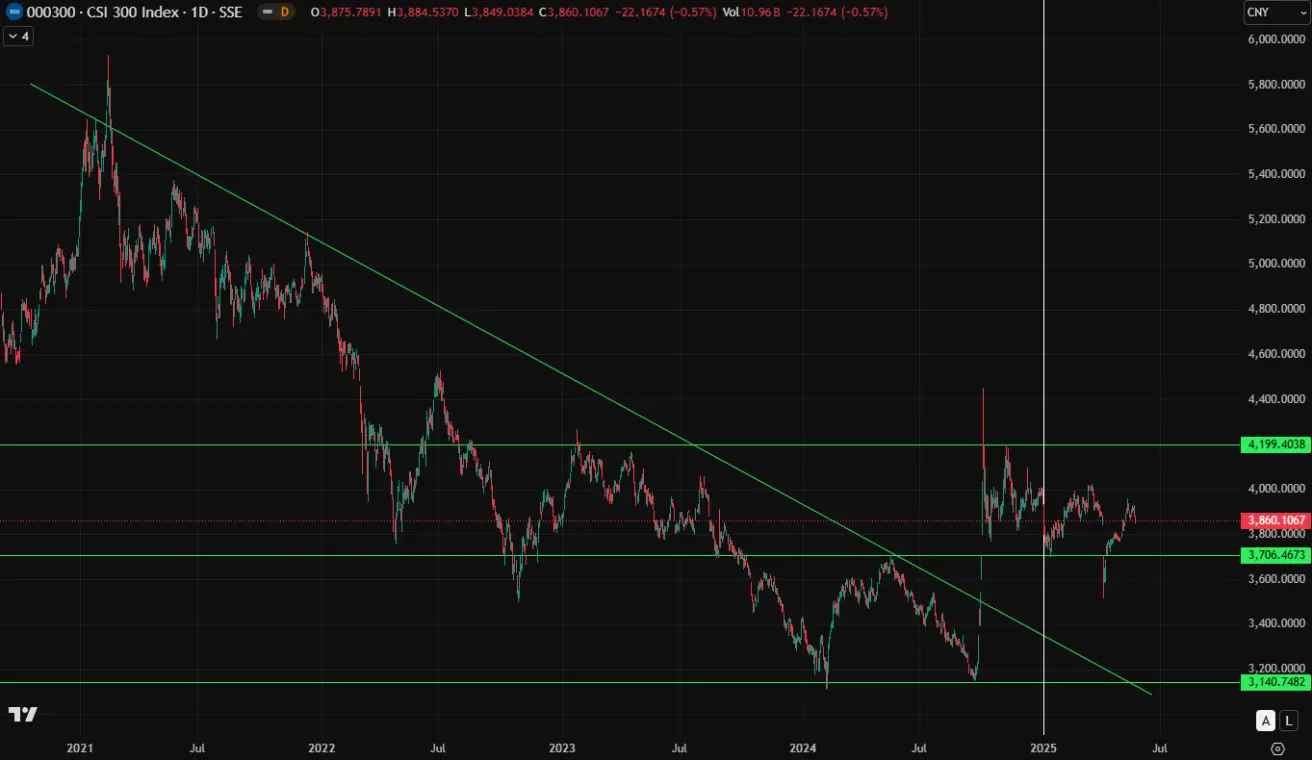
CSI 300
-0.75% | Week Close: 3860 | YTD: -1.81%
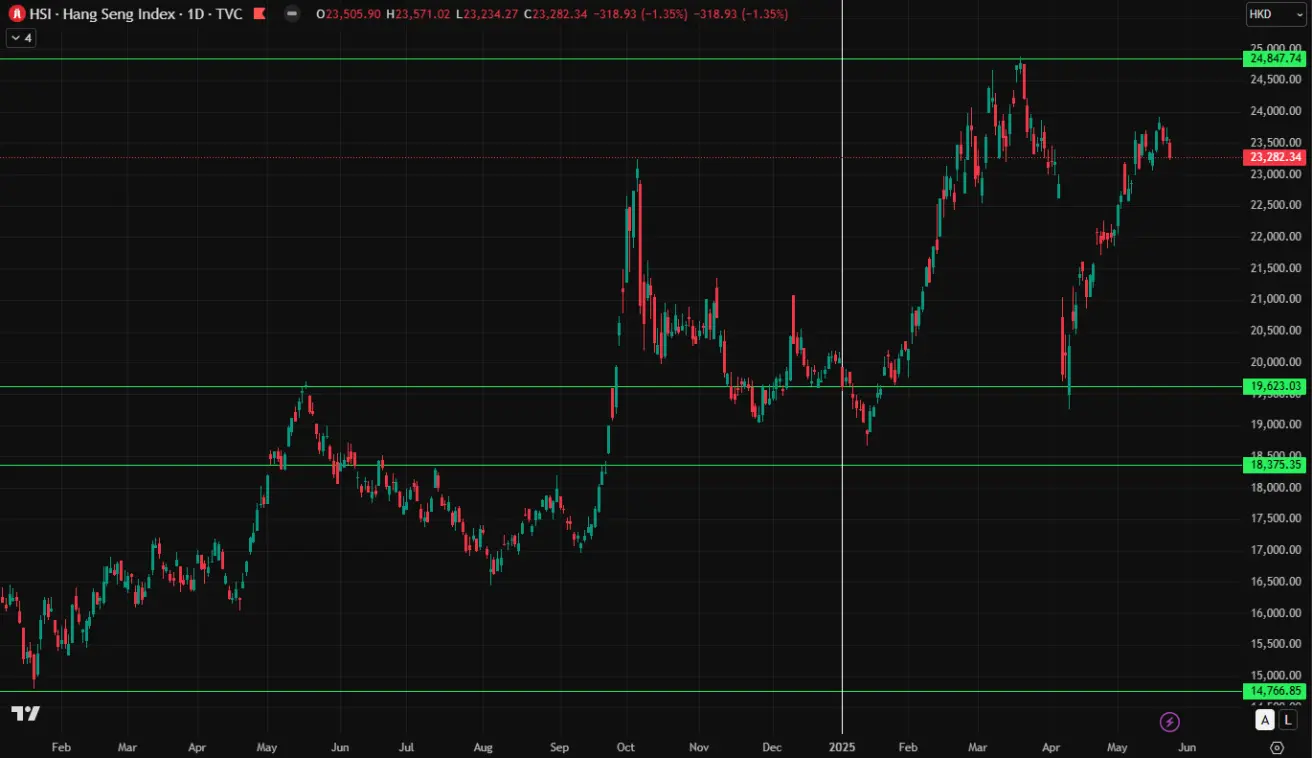
Hang Seng
+0.16% | Week Close: 23282.34 | YTD: +16.81%
BOND MARKET
The fixed income market saw a rise in yields across both Treasury and corporate bond segments.
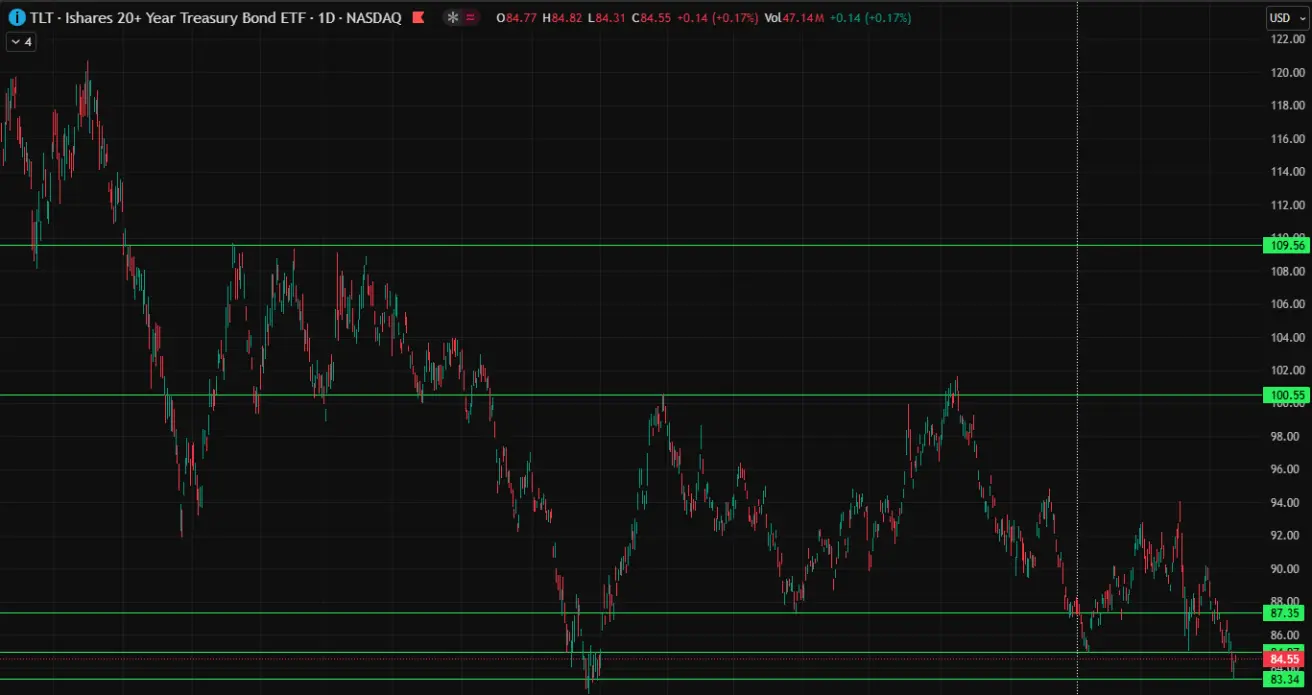
The 20+ Year Treasury Bond ETF (TLT) declined by 2.03% over the week, closing at $84.55.
Year-to-date performance stands at -3.70%. Following a credit rating downgrade, the ETF price fell to a historically significant support level, but a rebound was observed by the end of the week.
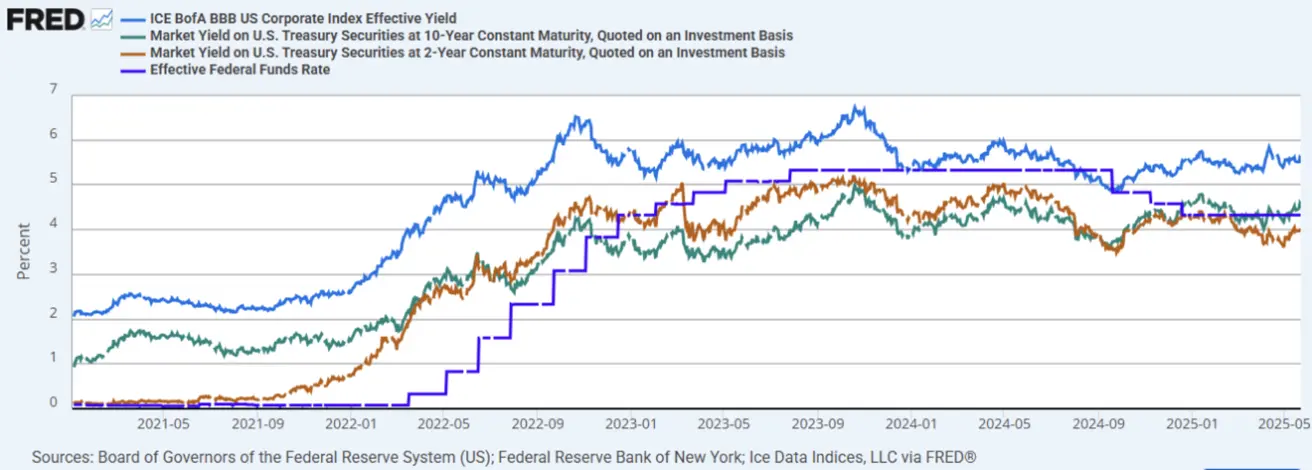
YIELDS AND SPREADS 2025/05/26 vs 2025/05/19
- Market Yield on U.S. Treasury Securities at 10-Year Constant Maturity: 4,555% (vs 4,522%);
- ICE BofA BBB US Corporate Index Effective Yield: 5,57% (vs 5,53%).
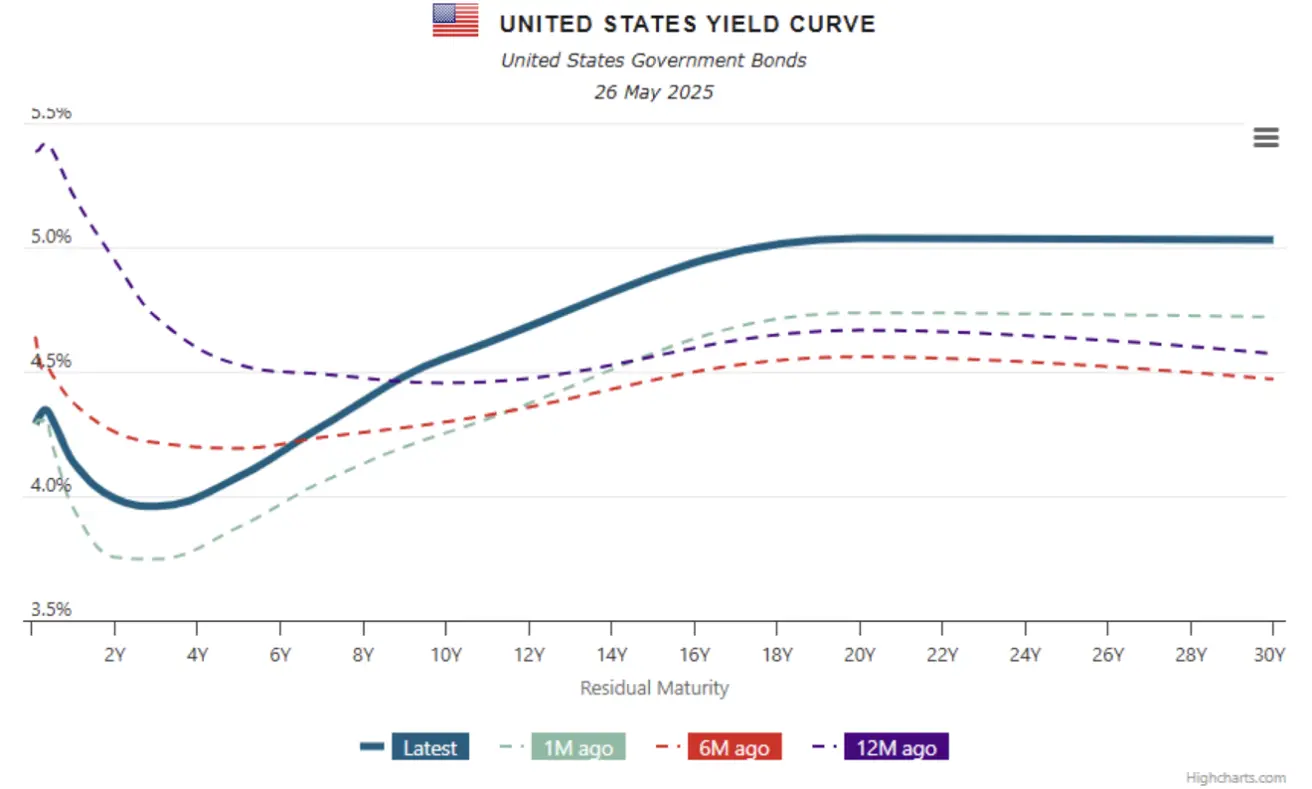
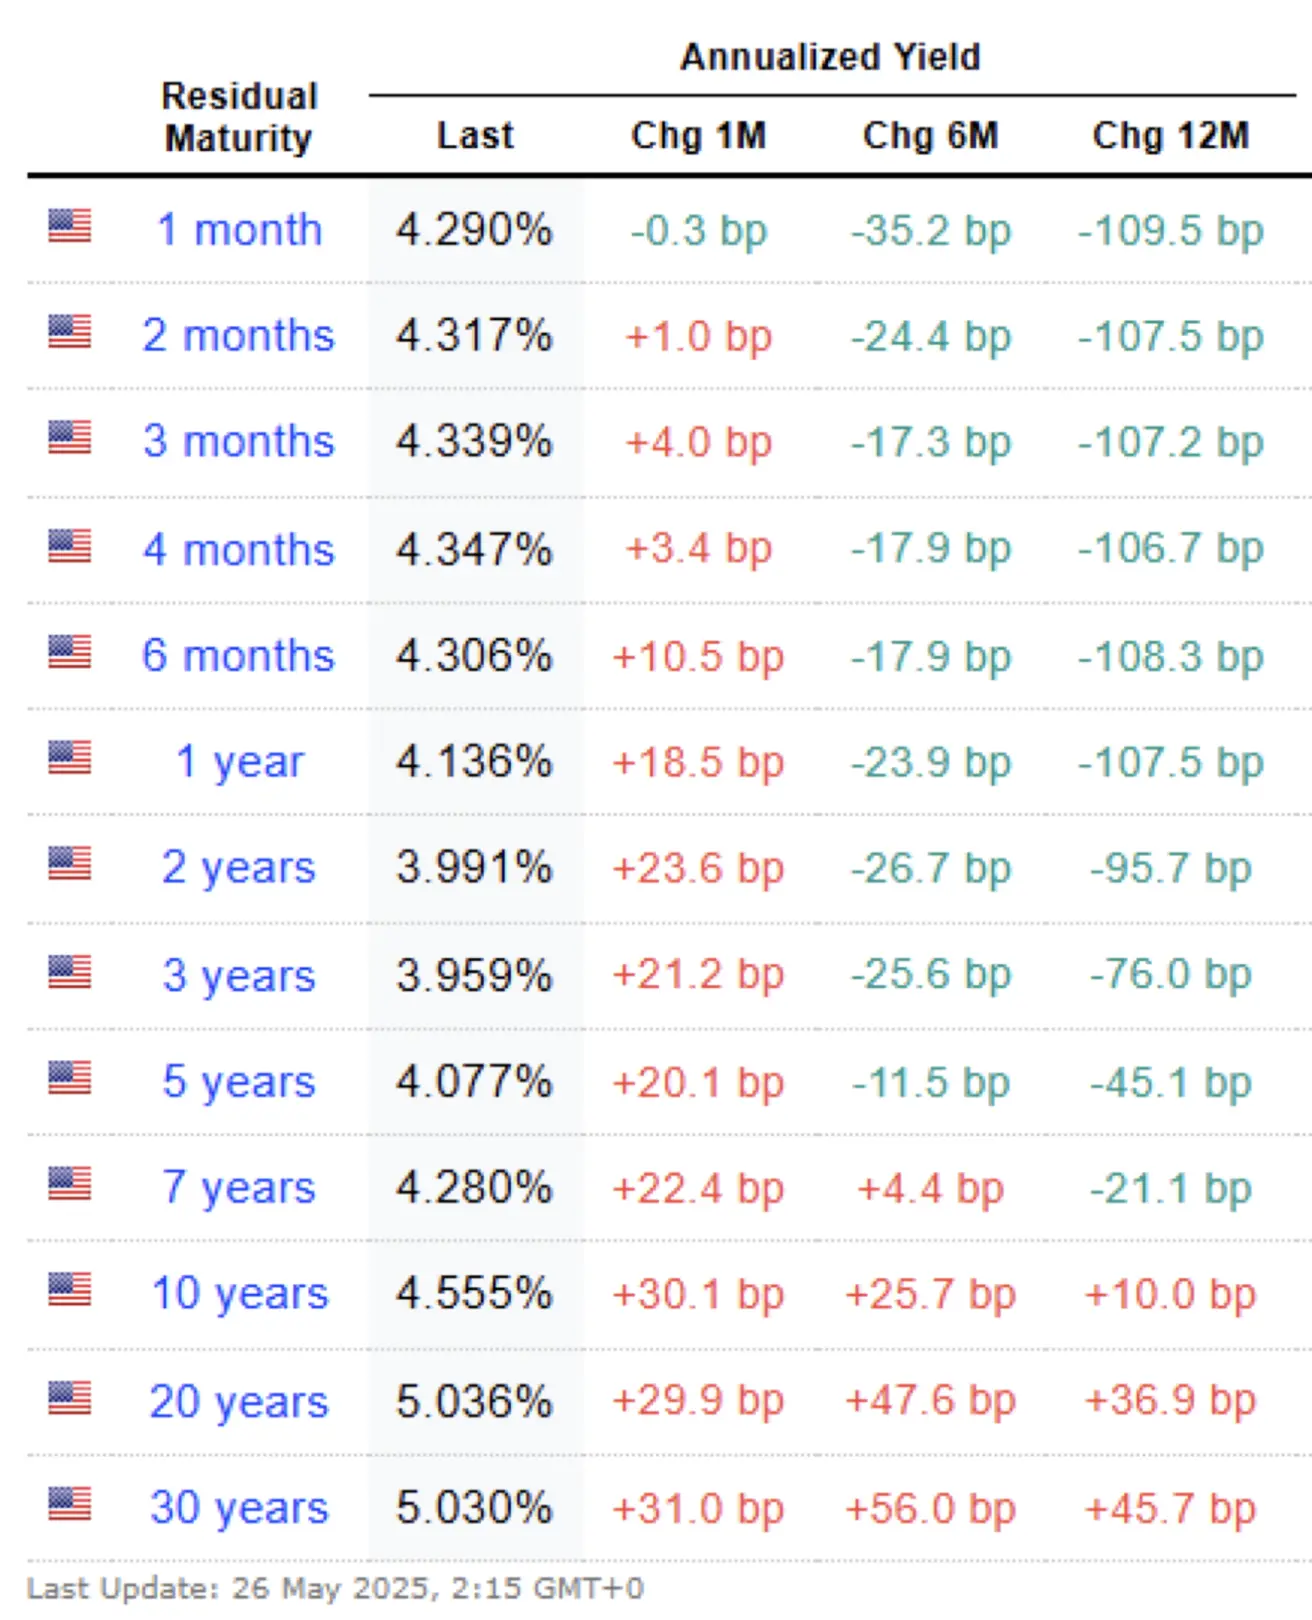
- The yield spread between 10-year and 2-year U.S. Treasury securities stands at 56.4 basis points versus 53.7 basis points previously, reflecting the difference in returns between long-term and short-term government debt.
- The yield spread between 10-year and 3-month U.S. Treasuries is 21.6 basis points, up from 0.15 basis points.
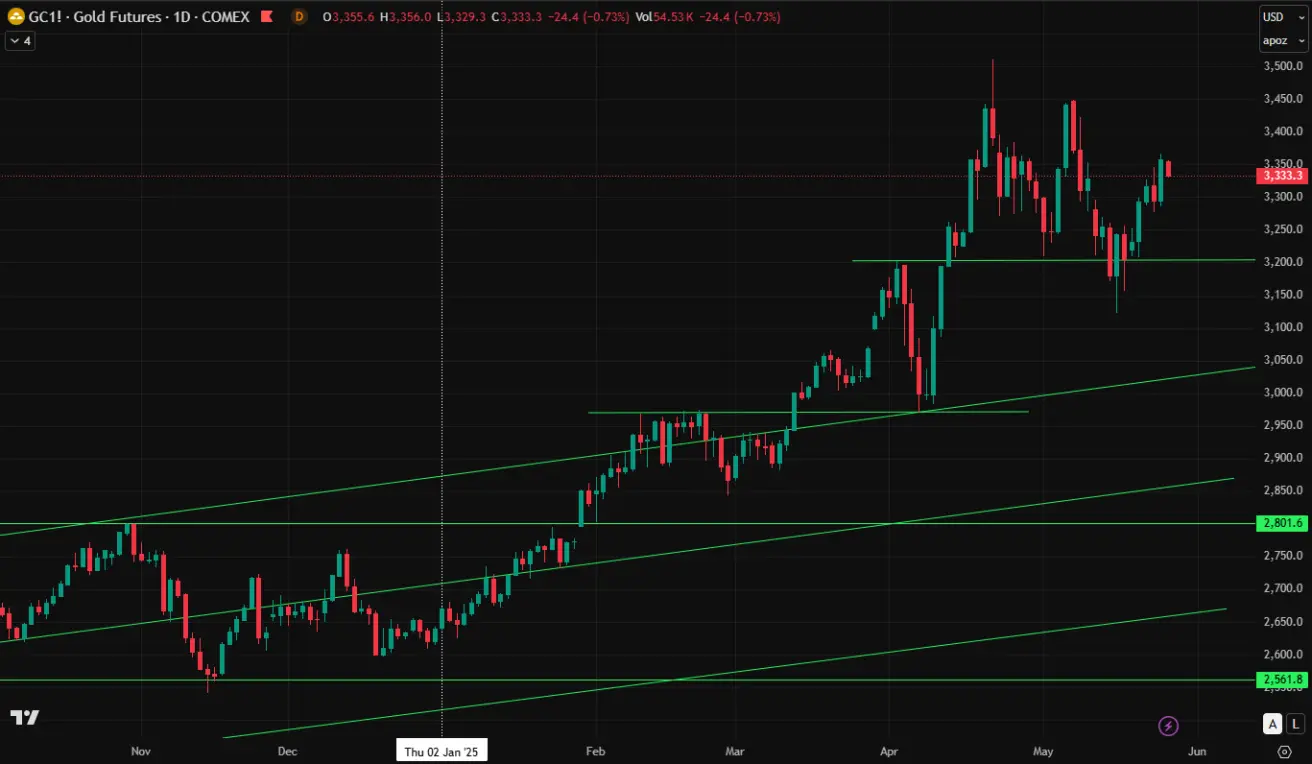
GOLD FUTURES (GC)
+4.75% | Week Close: $3357.7/oz | YTD: +27.14%
DOLLAR INDEX FUTURES (DX)
-1.82% | Week Close: 99.000 | YTD: -8.61%
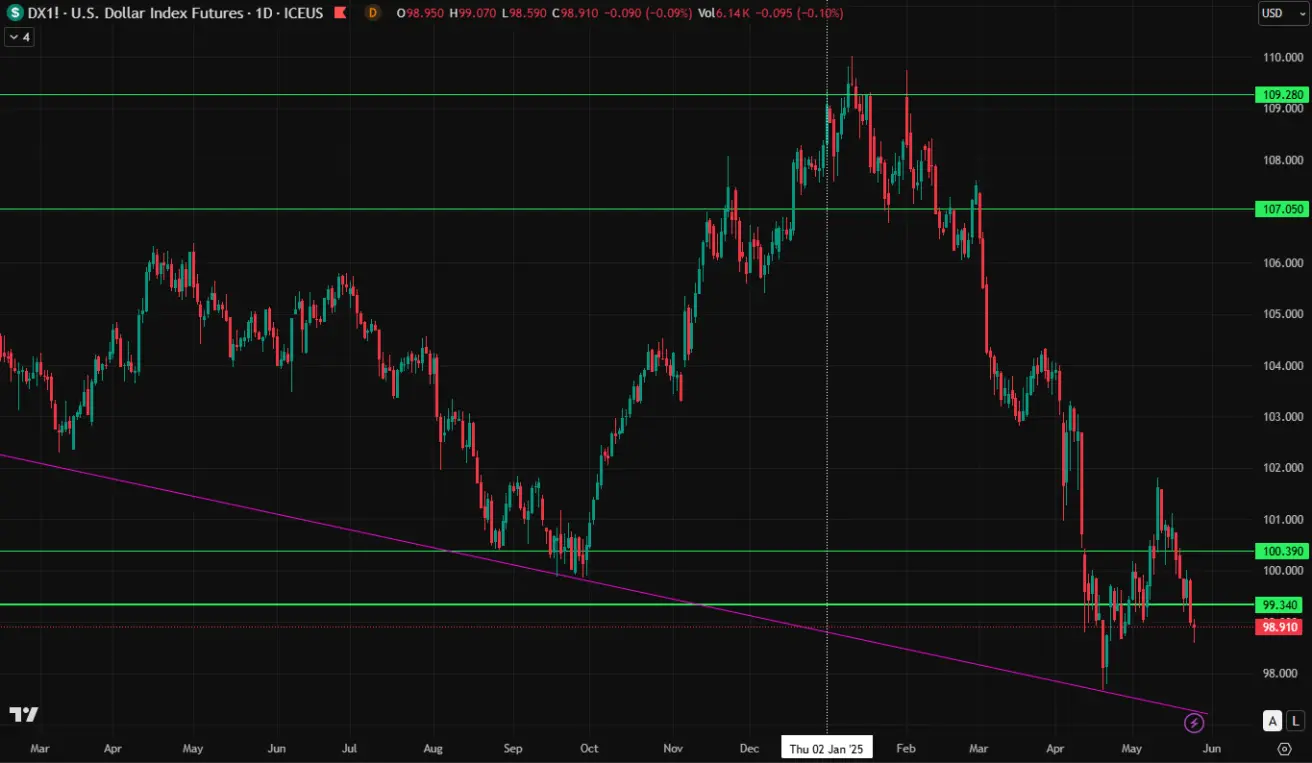 USD weakness is driven by policy shifts and fiscal expansion under the Trump administration, dampening investor appetite.
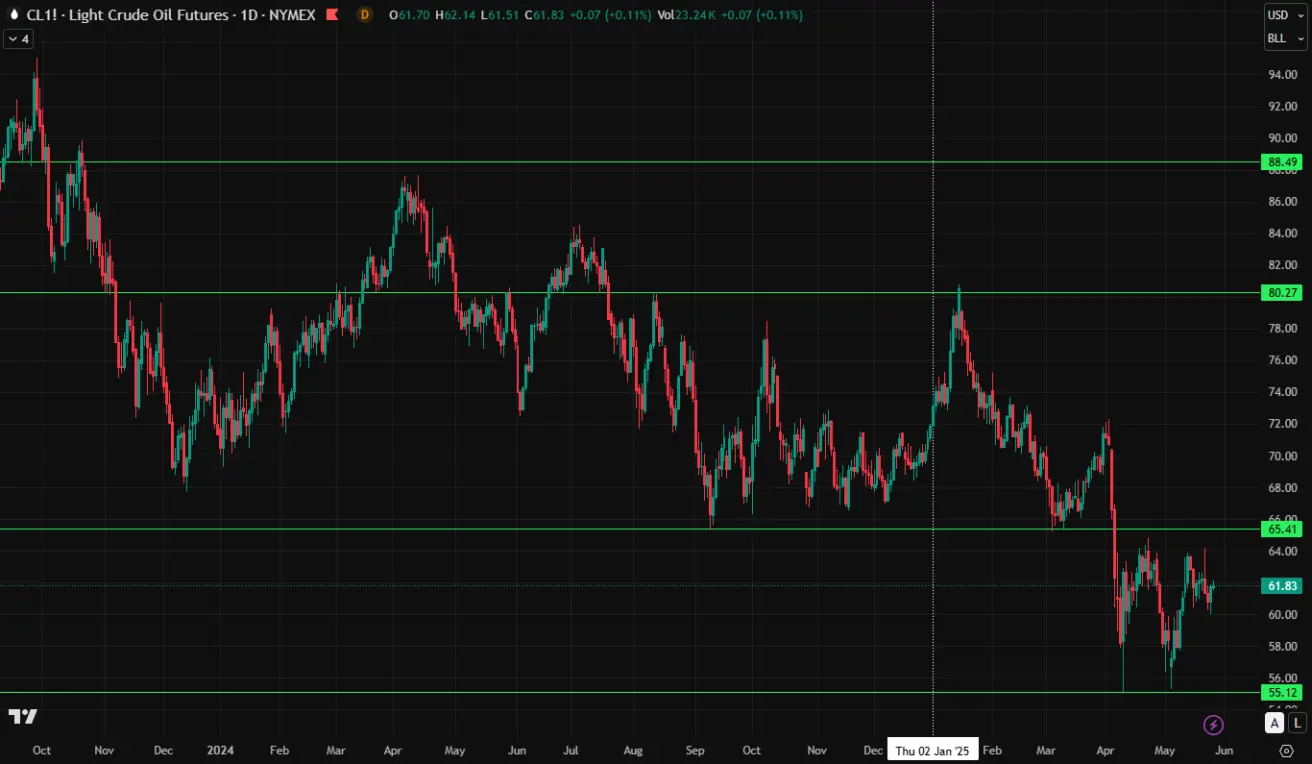
OIL FUTURES
-0.27% | Week Close: $61.76/barrel | YTD: -14.04%
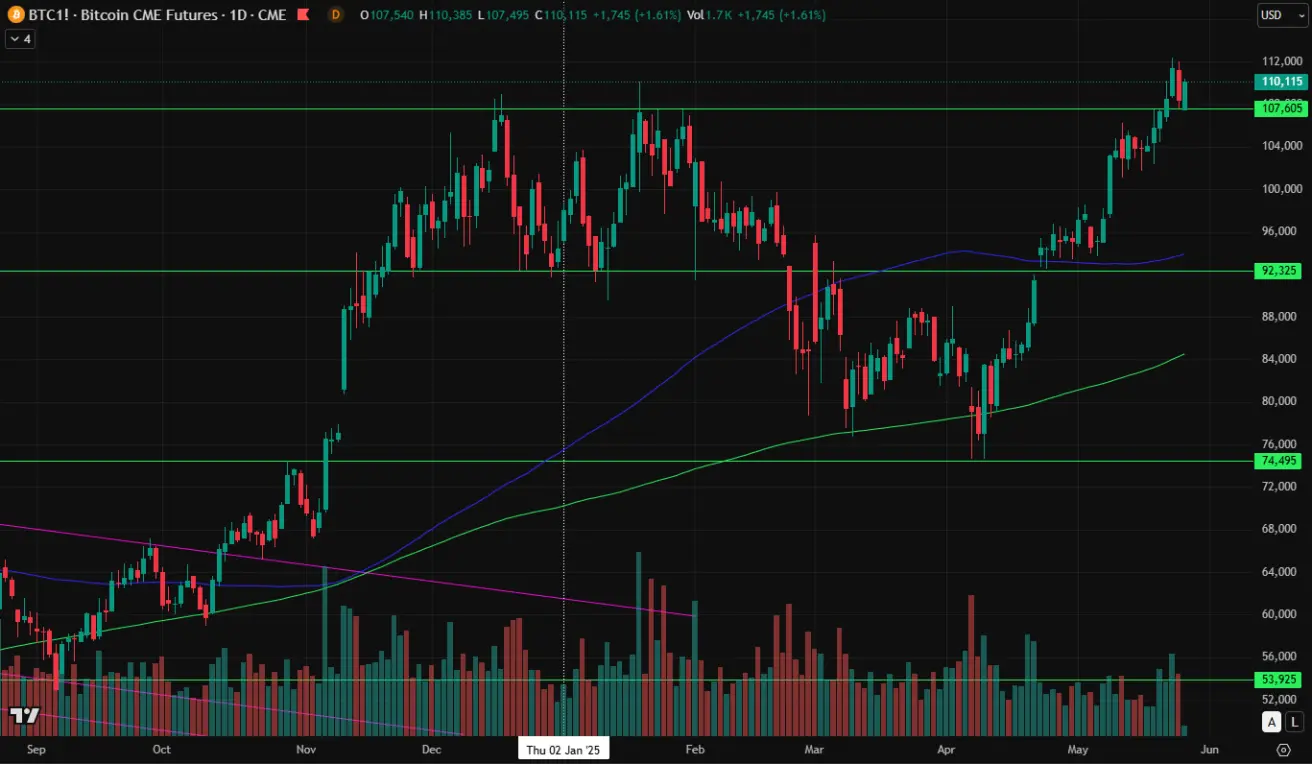
BTC FUTURES
+4.11% | Week Close: $108,370 | YTD: +13.75%
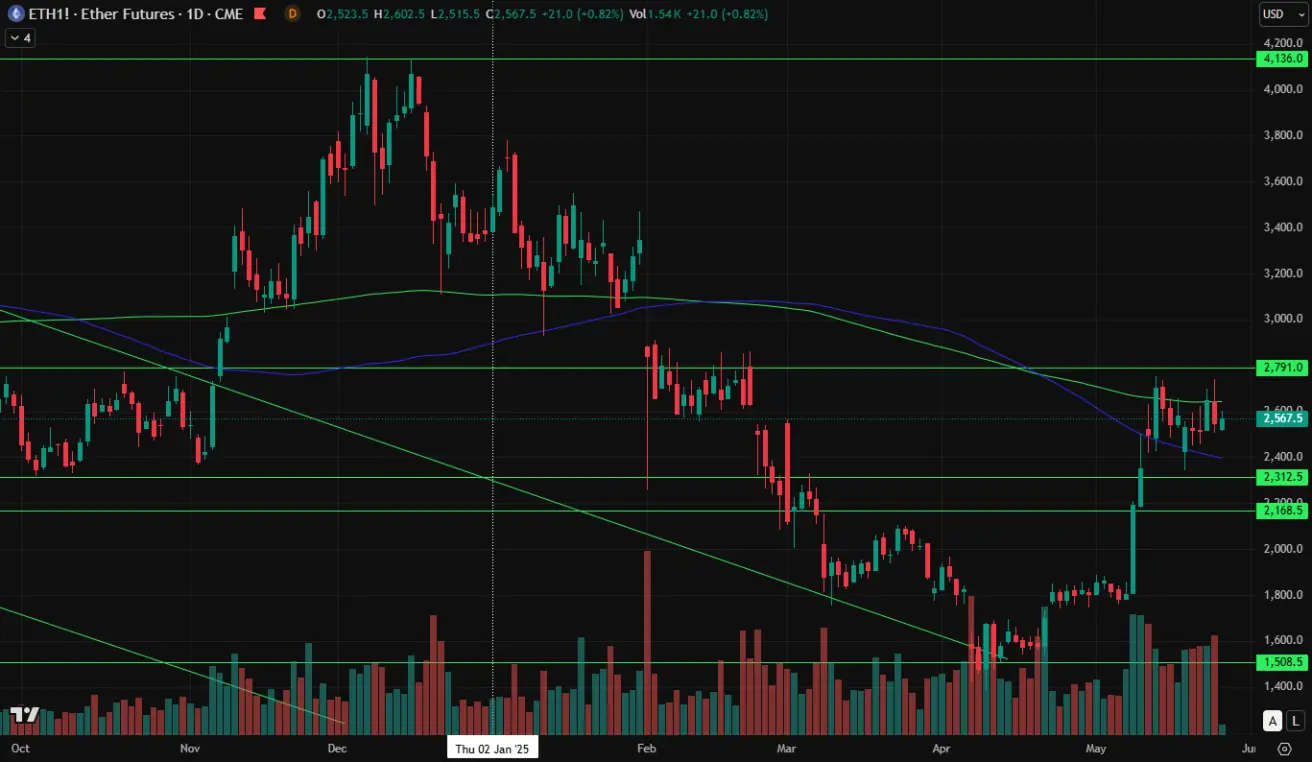
ETH FUTURES
-1.32% | Week Close: $2546.5 | YTD: -24.75%
- Crypto Market Capitalization: $3.25 trillion
- Bitcoin Dominance: 62.9% | Ethereum: 9.0% | Altcoins: 28.1%
- Institutional demand for digital assets remains steady despite market divergence.