 Lietuvių
 Русский
 Қазақша
 Eesti
EestiMay 26 - 30, 2025: Weekly economic update
Key market updates

MACROECONOMIC STATISTICS
INFLATION
- Core Consumer Price Index (CPI) (m/m) (Apr): 0.2% (prev: 0.1%);
- Consumer Price Index (CPI) (m/m) (Apr): 0.2% (prev: -0.1%);
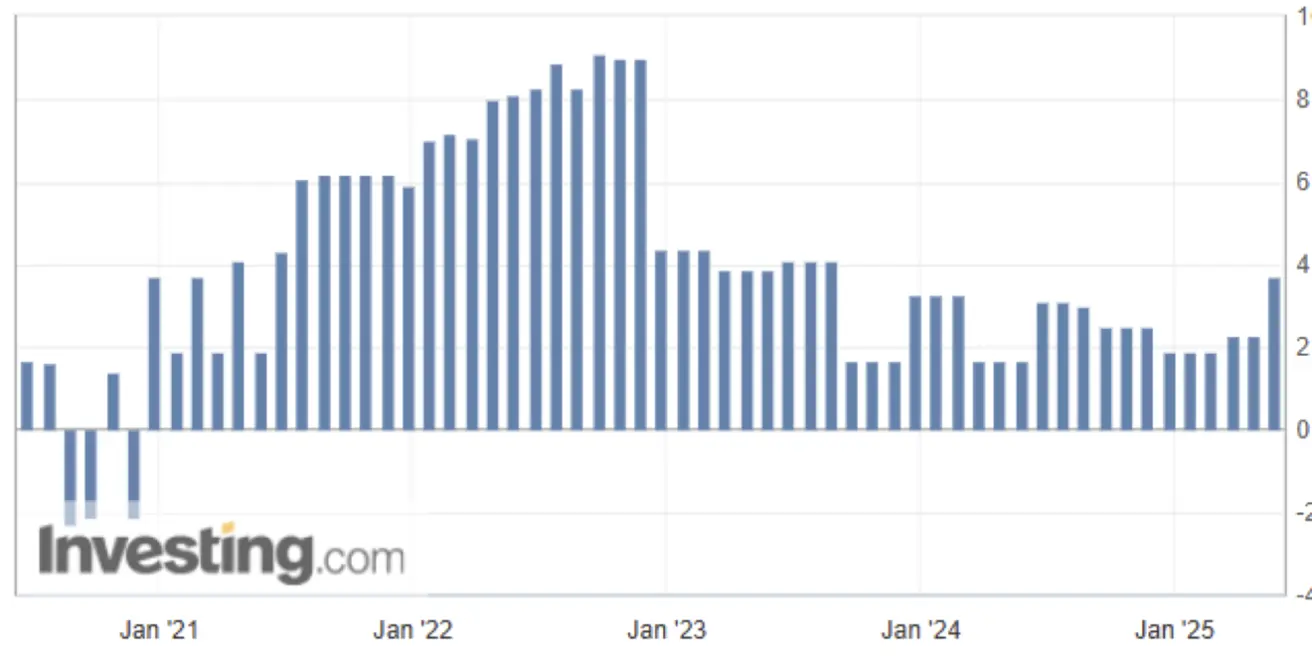
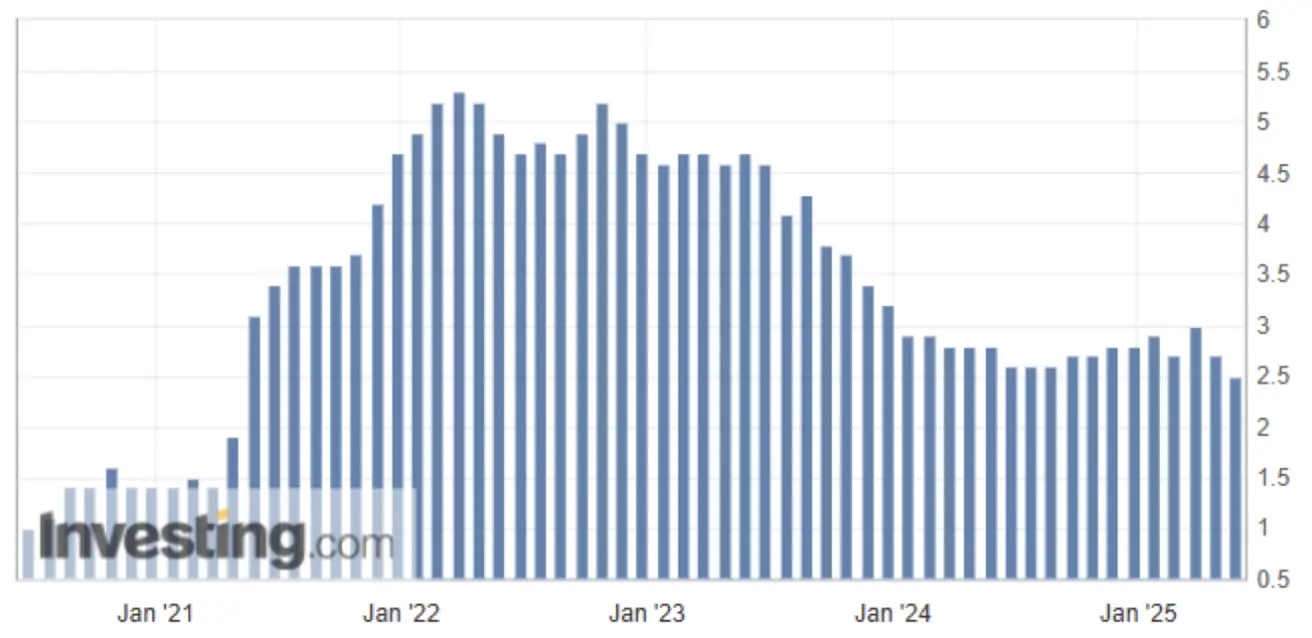
- Core Consumer Price Index (CPI) (y/y) (Apr): 2.8% (prev: 2.8%);
- Consumer Price Index (CPI) (y/y) (Apr): 2.3% (prev: 2.4%)
INFLATION EXPECTATIONS (MICHIGAN)
-
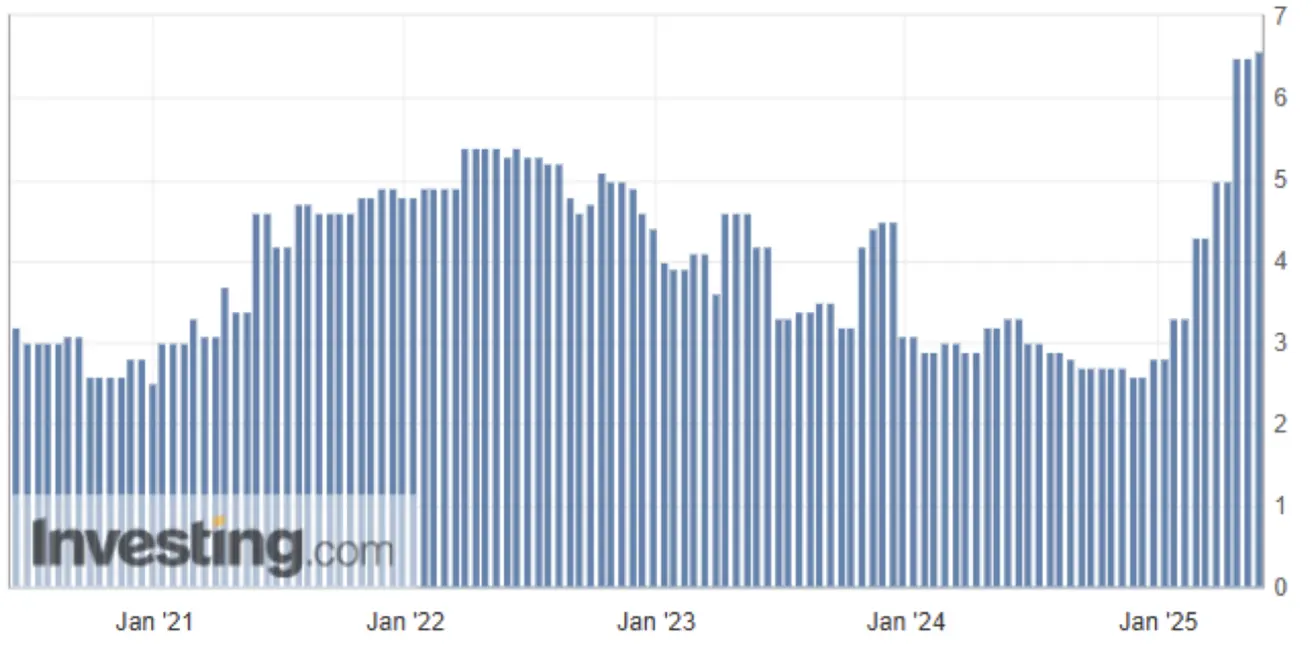
12-month expected inflation (May): 6.6% (prev: 6.5%);
-
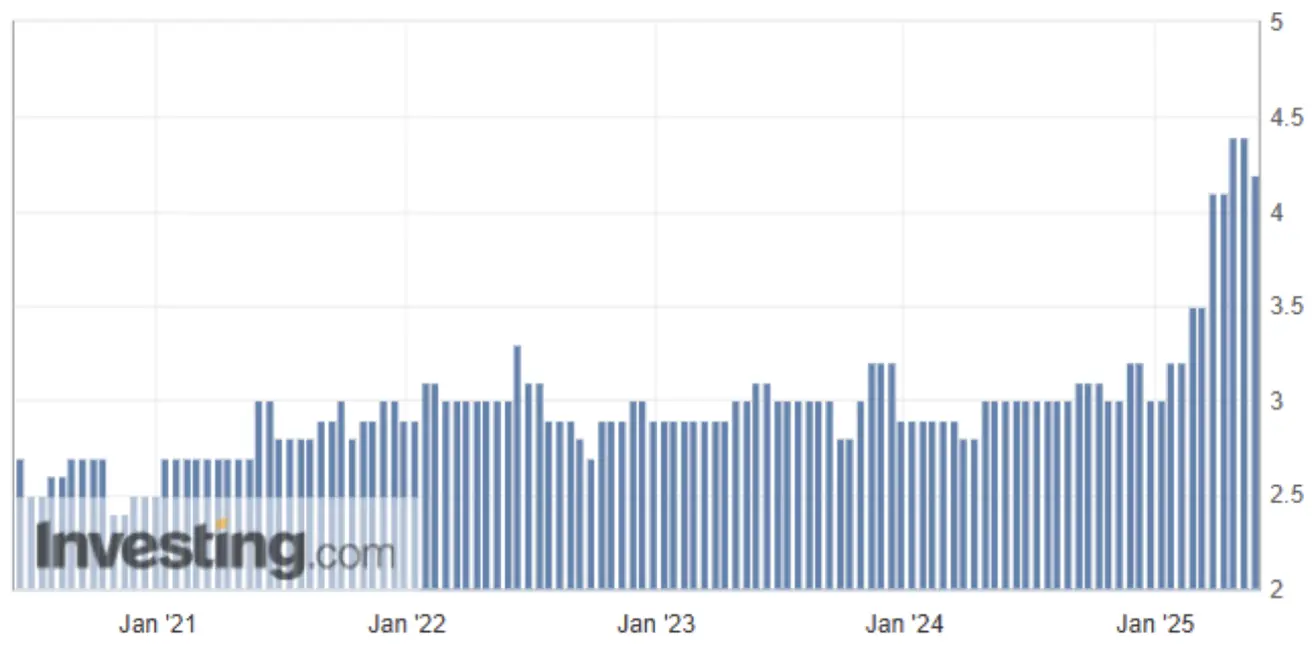
5-year expected inflation (Apr): 4.2% (prev: 4.4%)
GDP (U.S. Bureau of Economic Analysis, BEA)
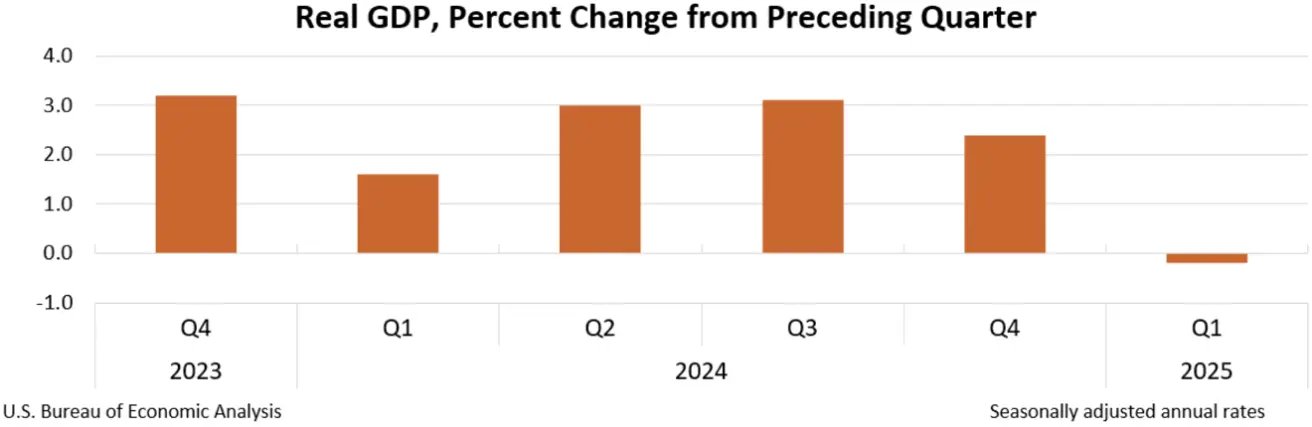
-0.2% (4Q24: 2.4%):
US GDP Deflator (q/q): 3.78% (vs 2.3%):
 The GDP price index measures the annual price change of goods and services included in GDP.
Core US Personal Consumption Expenditures (PCE) Price Index (May, m/m): 0.1% (vs 0.1%);
Core US PCE Price Index (May, y/y): 2.5% (vs 2.7%):
This indicator reflects the average price growth across total personal consumption in the US.
Atlanta Fed GDPNow Forecast (Q2): 3.8% (vs 2.3%):
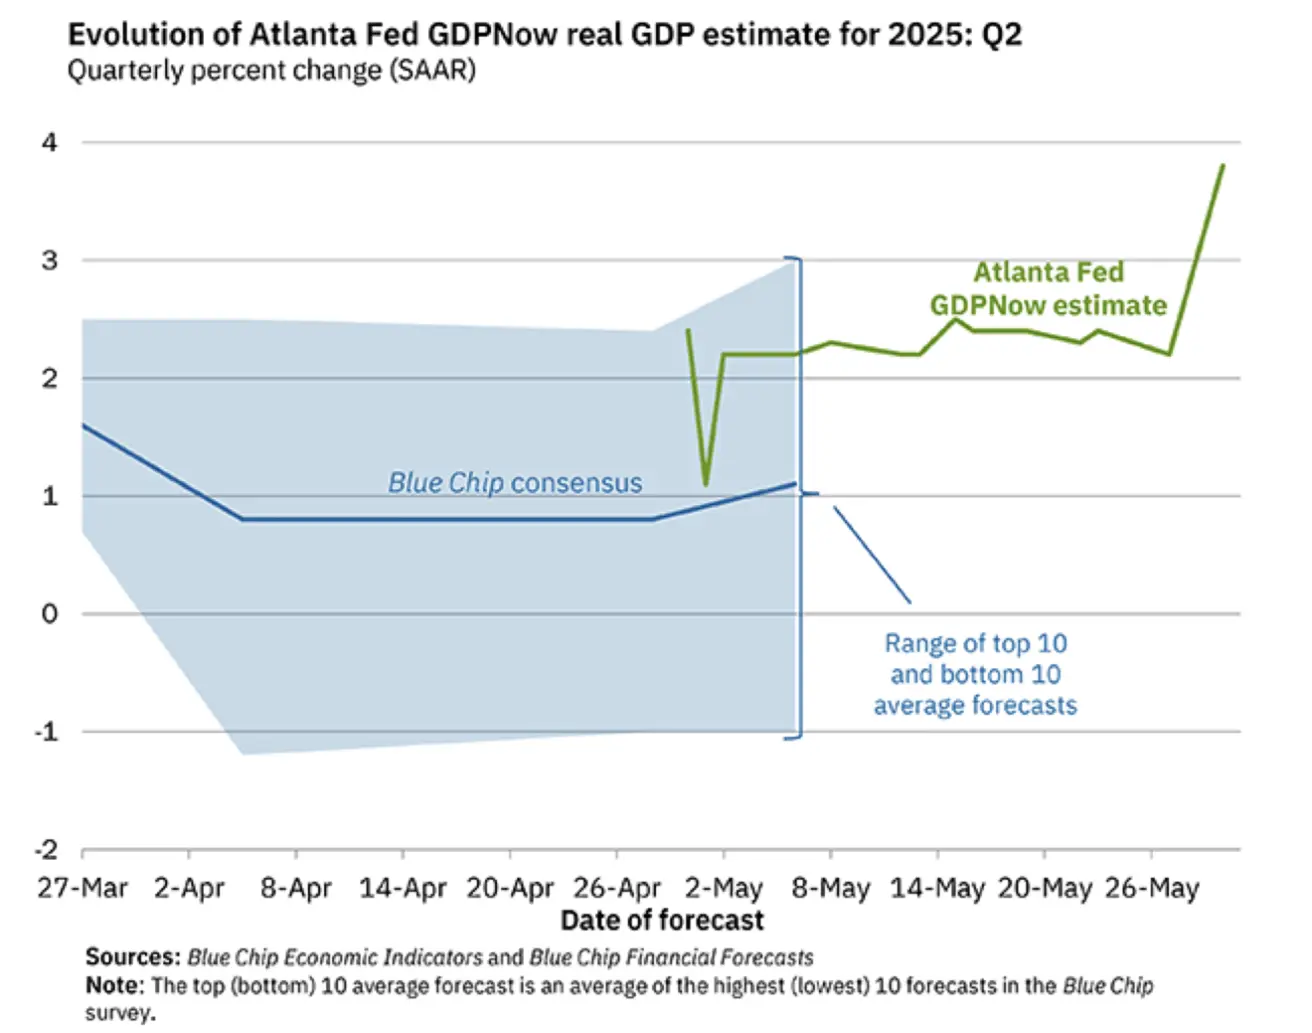
The GDPNow forecasting model provides a “real-time” projection of official GDP estimates before their release, using a methodology similar to that of the BEA.
Business Activity Index (PMI)
(Above 50 indicates expansion; below 50 indicates contraction)
- Services sector (May): 52.3 (prev: 50.8);
- Manufacturing sector (May): 52.3 (prev: 50.7);
- S&P Global Composite (May): 52.1 (prev: 50.6).
LABOR MARKET
- Unemployment rate (Apr): 4.2% (prev: 4.2%);
- Non-farm payroll change (Apr): 177K (prev: 185K revised);
- Average hourly earnings (Apr, y/y): 3.8% (prev: 3.8%).
MONETARY POLICY
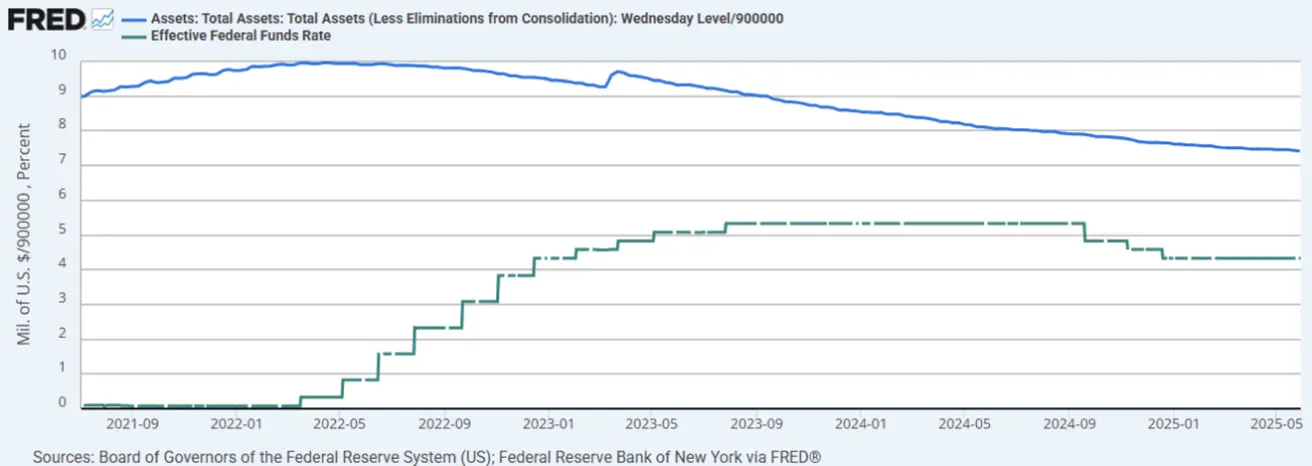
- Federal Funds Target Rate (EFFR): 4.25% - 4.50% (range);
- Federal Reserve balance sheet: $6.673 trillion (vs previous week: $6.688 trillion)
MARKET FORECAST FOR RATE
Today:
A week earlier:
Commentary
According to the second estimate, US real GDP decreased at an annualized rate of 0.2% in Q1 2025 (January through March), an improvement from the preliminary estimate of a 0.3% decline.
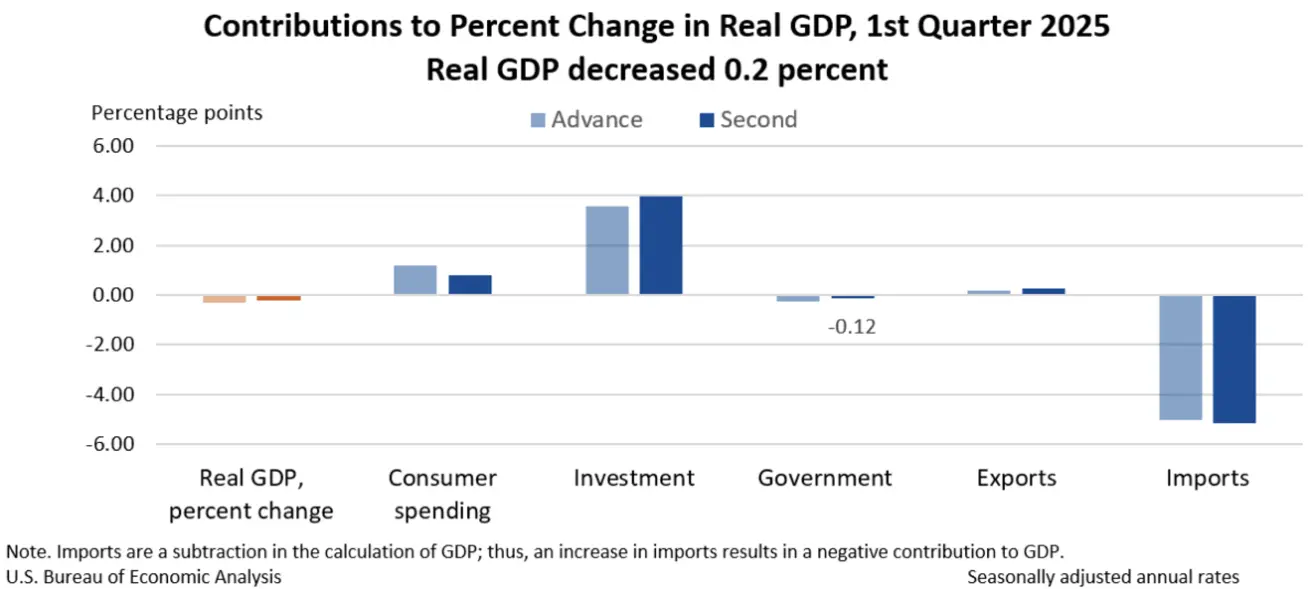
The decline in real GDP was primarily driven by an increase in imports (which are subtracted from GDP) and lower government spending. These effects were partially offset by increases in investment, consumer spending, and exports.
At the same time, the Atlanta Fed’s GDPNow model currently projects significant economic growth in Q2, with the forecast rising to 3.8% from 2.3% the prior week—providing a positive signal for markets.
Inflation data presents a mixed picture.
On one hand, short-term (12-month) and long-term (5-year) inflation expectations remain elevated at 6.6% and 4.2%, respectively. The GDP deflator also reflects higher inflation (q/q): 3.78% (vs 2.3%).
On the other hand, PCE price indexes show a steady decline on an annual basis. The headline PCE price index increased by 2.1%, and the core PCE index (excluding food and energy) rose by 2.5%.
The Federal Reserve currently places greater emphasis on the PCE index, which may support a more dovish stance in monetary policy communication. However, the Fed is maintaining a pause due to uncertainties related to ongoing trade conflicts.
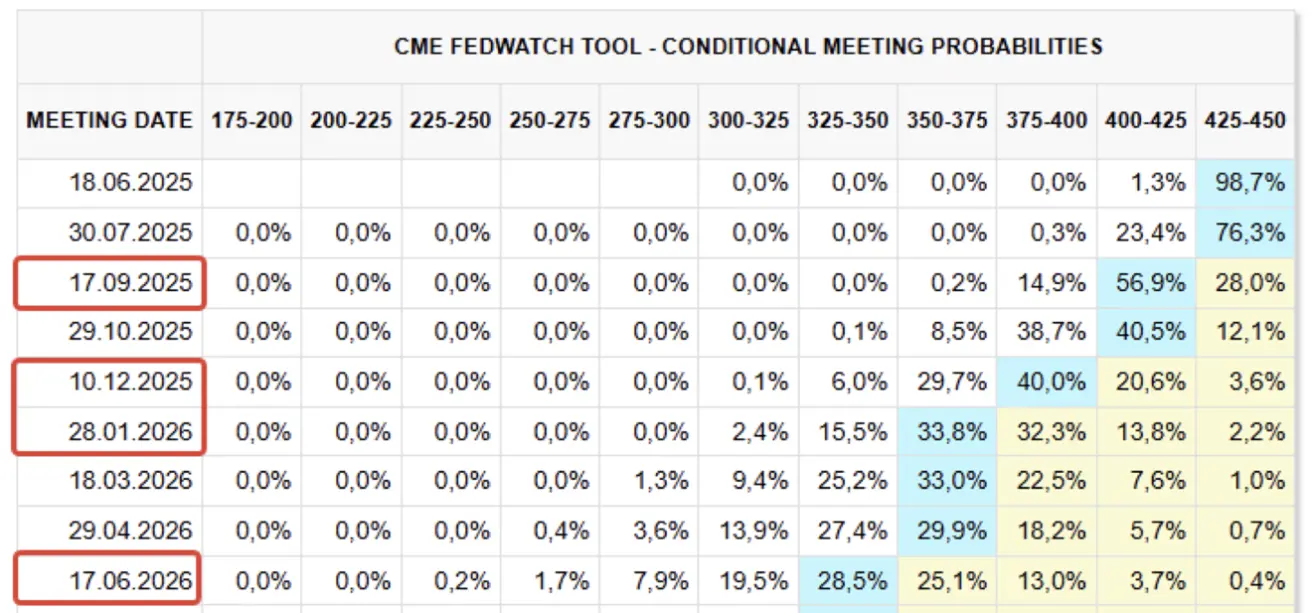
Market expectations per FedWatch have slightly improved over the next 12 months: four rate cuts of 0.25%, targeting a range of 3.25%-3.50%. The first cut is anticipated in August this year.
The next FOMC meeting will be held on June 18, where markets expect the Fed to maintain the current rate range of 4.25%-4.50%. The probability of a hold stands at nearly 99%.
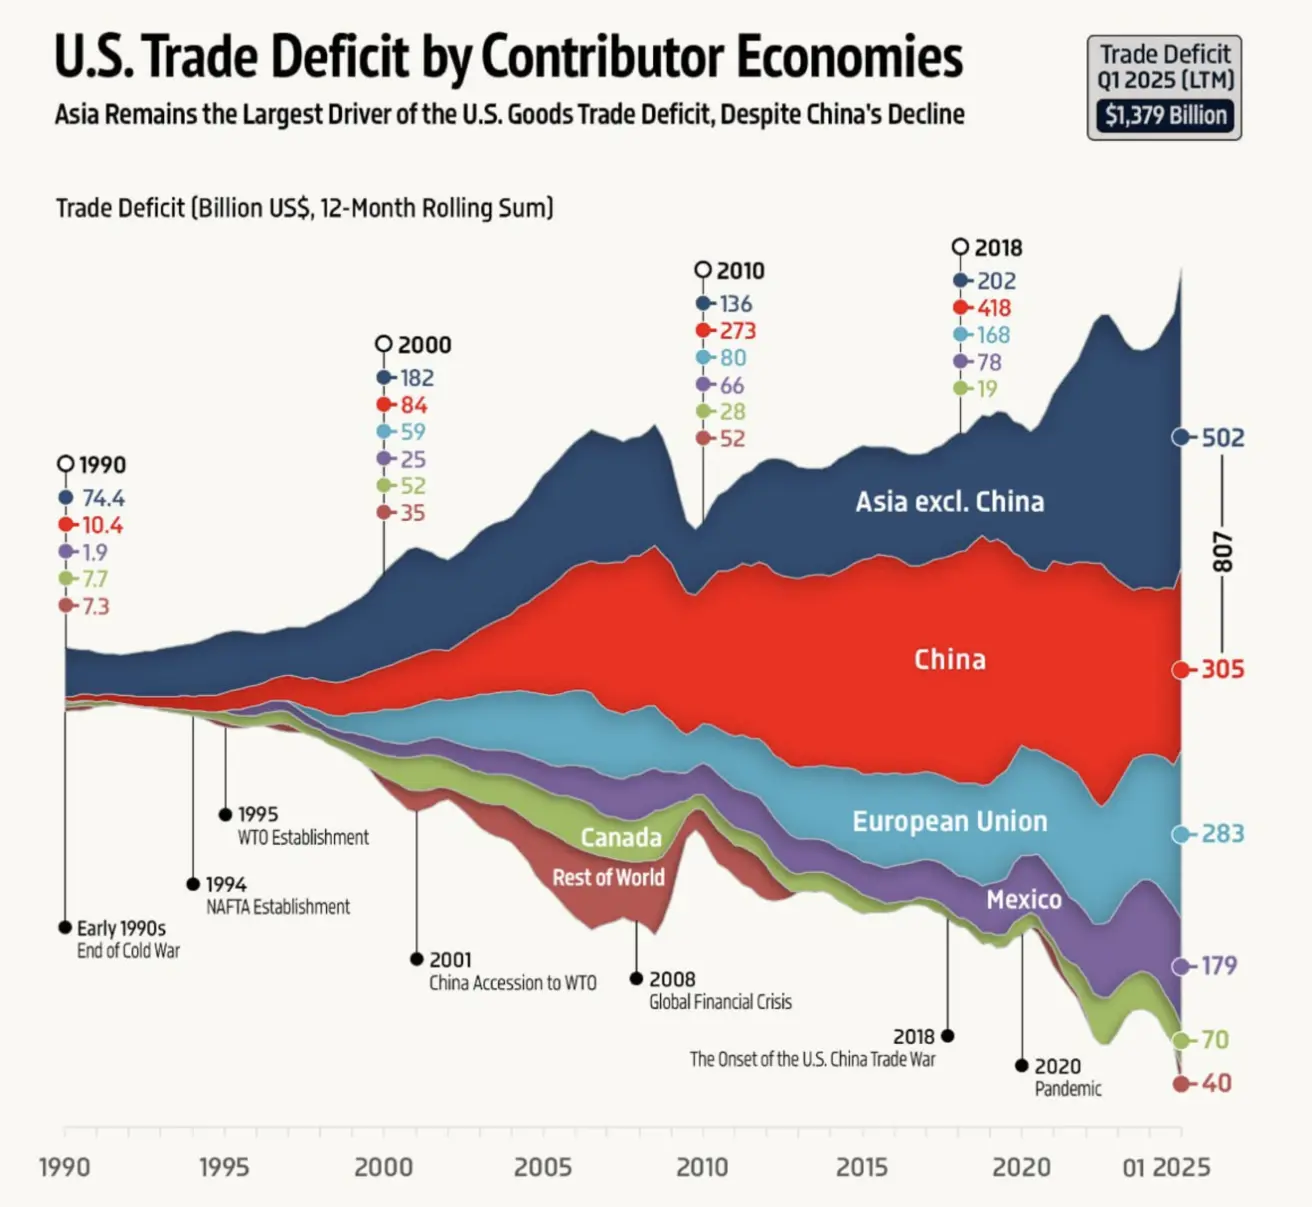
Trade Wars — Uncertainty Persists
Last Wednesday, the majority of former President Trump’s global tariffs were declared unlawful and blocked by a US trade court. However, the Federal Court of Appeals subsequently delayed the lower court's decision.
Tariffs on steel and aluminum will increase from 25% to 50% starting Wednesday, June 4.
US Treasury Secretary Scott Bessent stated that “negotiations between the US and China have stalled.” China accused the US of breaching trade agreements and promised retaliatory measures. Geopolitical tensions are also rising, with Washington accusing Beijing of threatening Taiwan.
US Trade Deficit with Donor Countries (1990–Q1 2025):
Equity Market
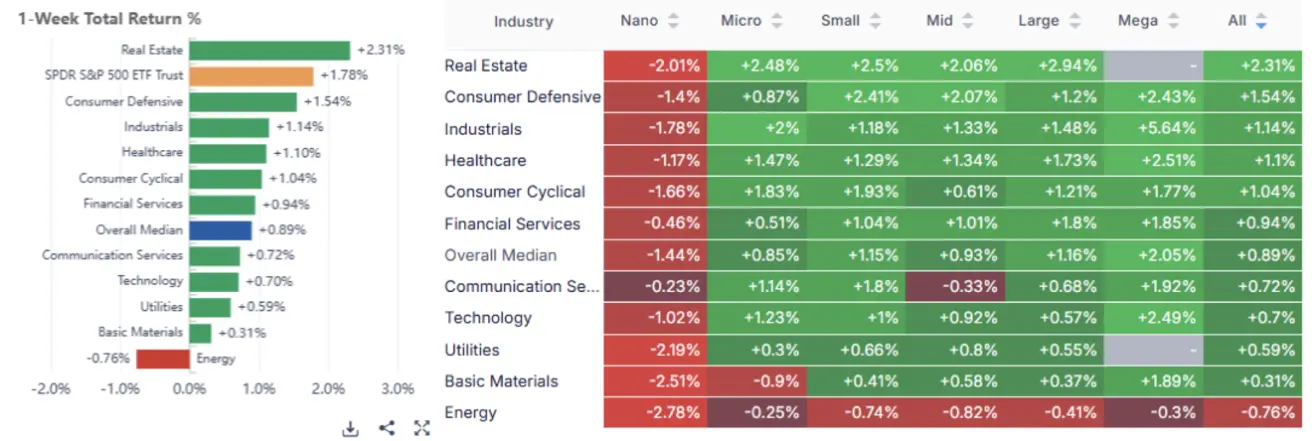
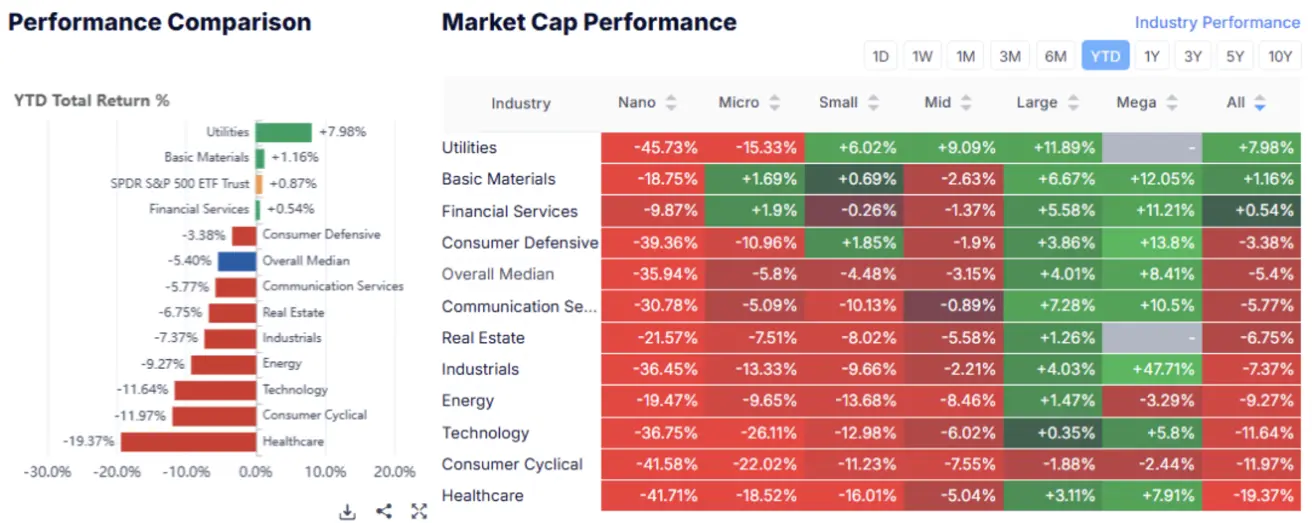
Last week, the market closed in positive territory. Median gains: +0.89%. Only the energy sector posted a negative return:
YTD performance: -5.4%:
MARKET
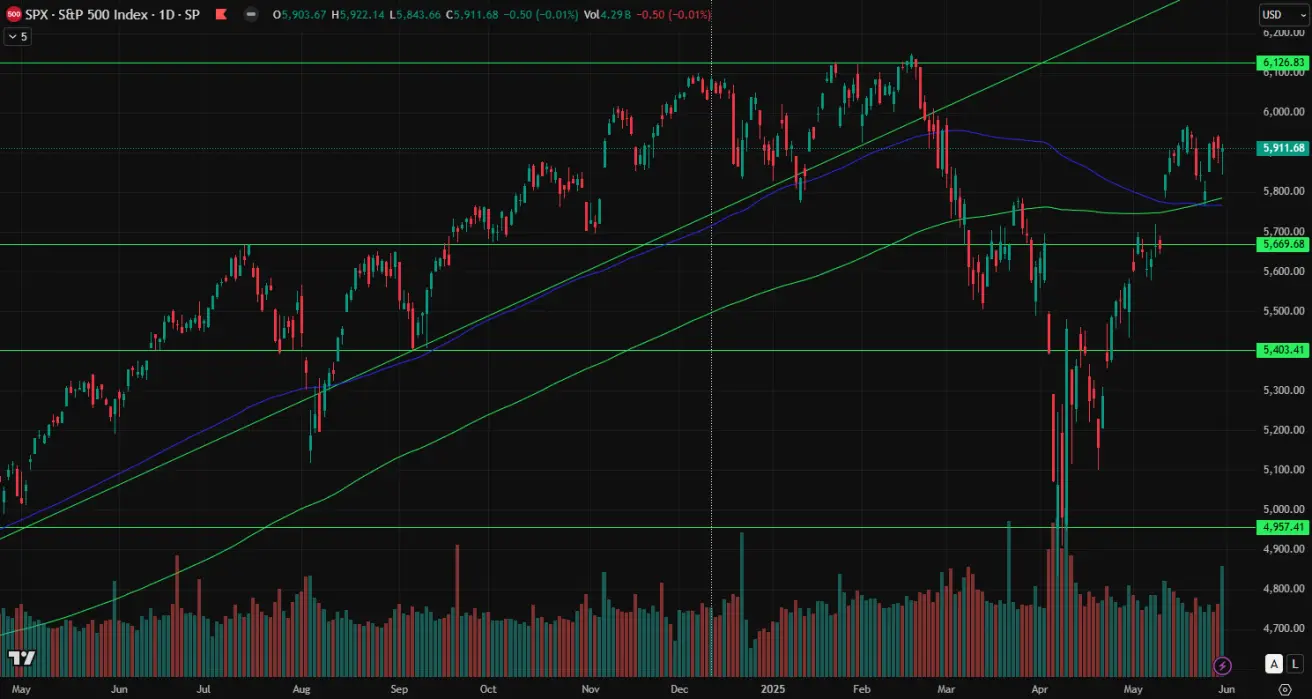
Stock indices experienced a slight pullback following a V-shaped recovery. The increase in volatility, as measured by the VIX index, was moderate, rising to 22.
SP500 Weekly gain +1.88% (closing 5903.26). YTD +0.14%.
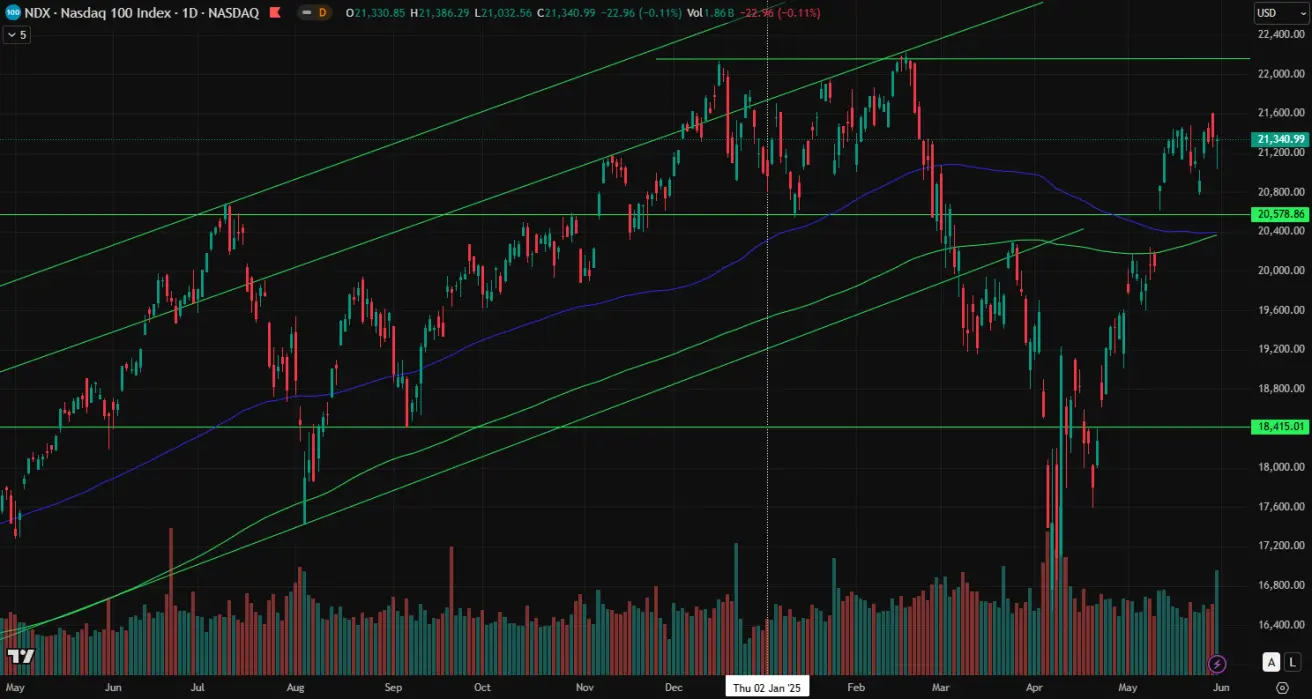
NASDAQ100 Weekly gain +2.03% (closing 21340.99). YTD +1.05%.
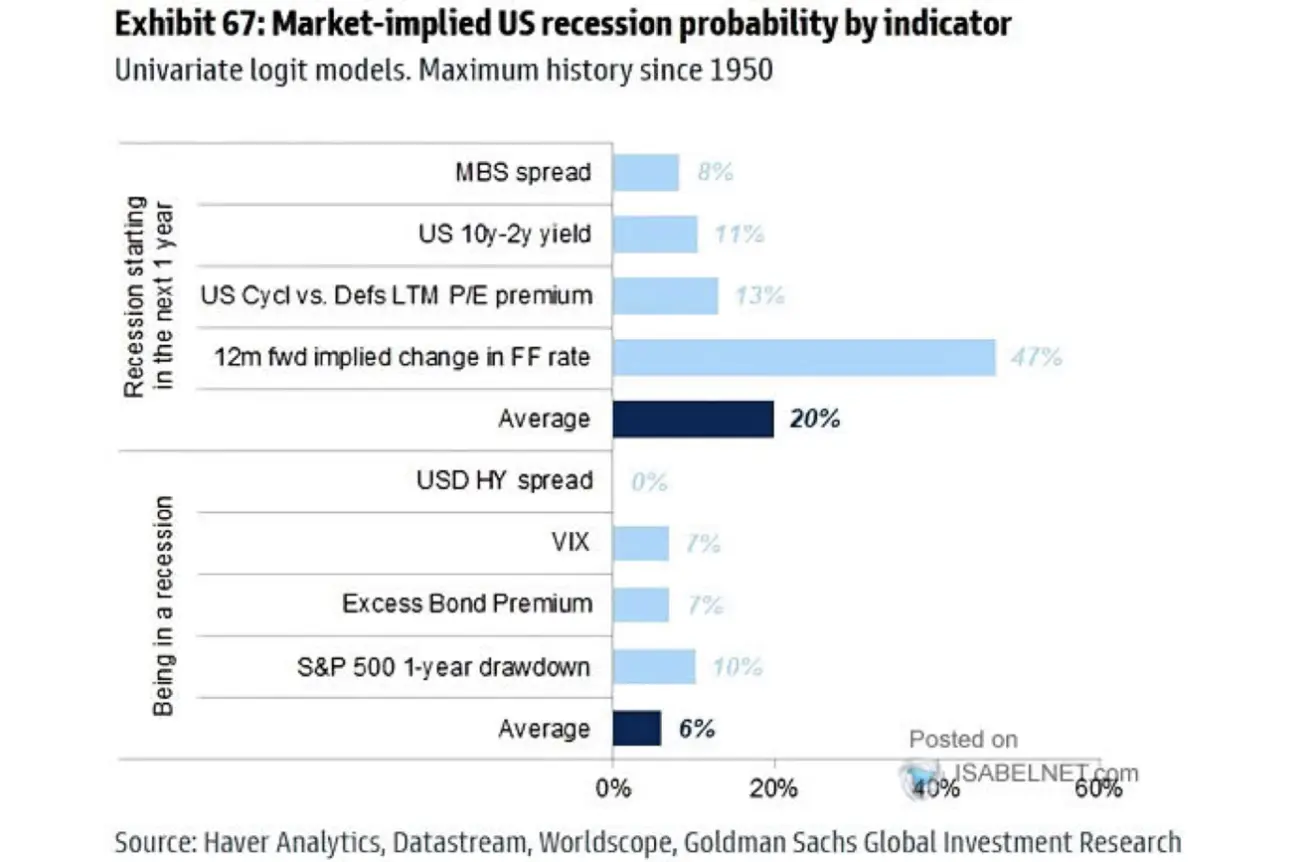
Current 12-month recession probability (average of 4 agencies): 20% (down from previous estimate). Probability of Fed rate change: 47%.
In a recession scenario, S&P 500 downside potential is estimated at -10%:
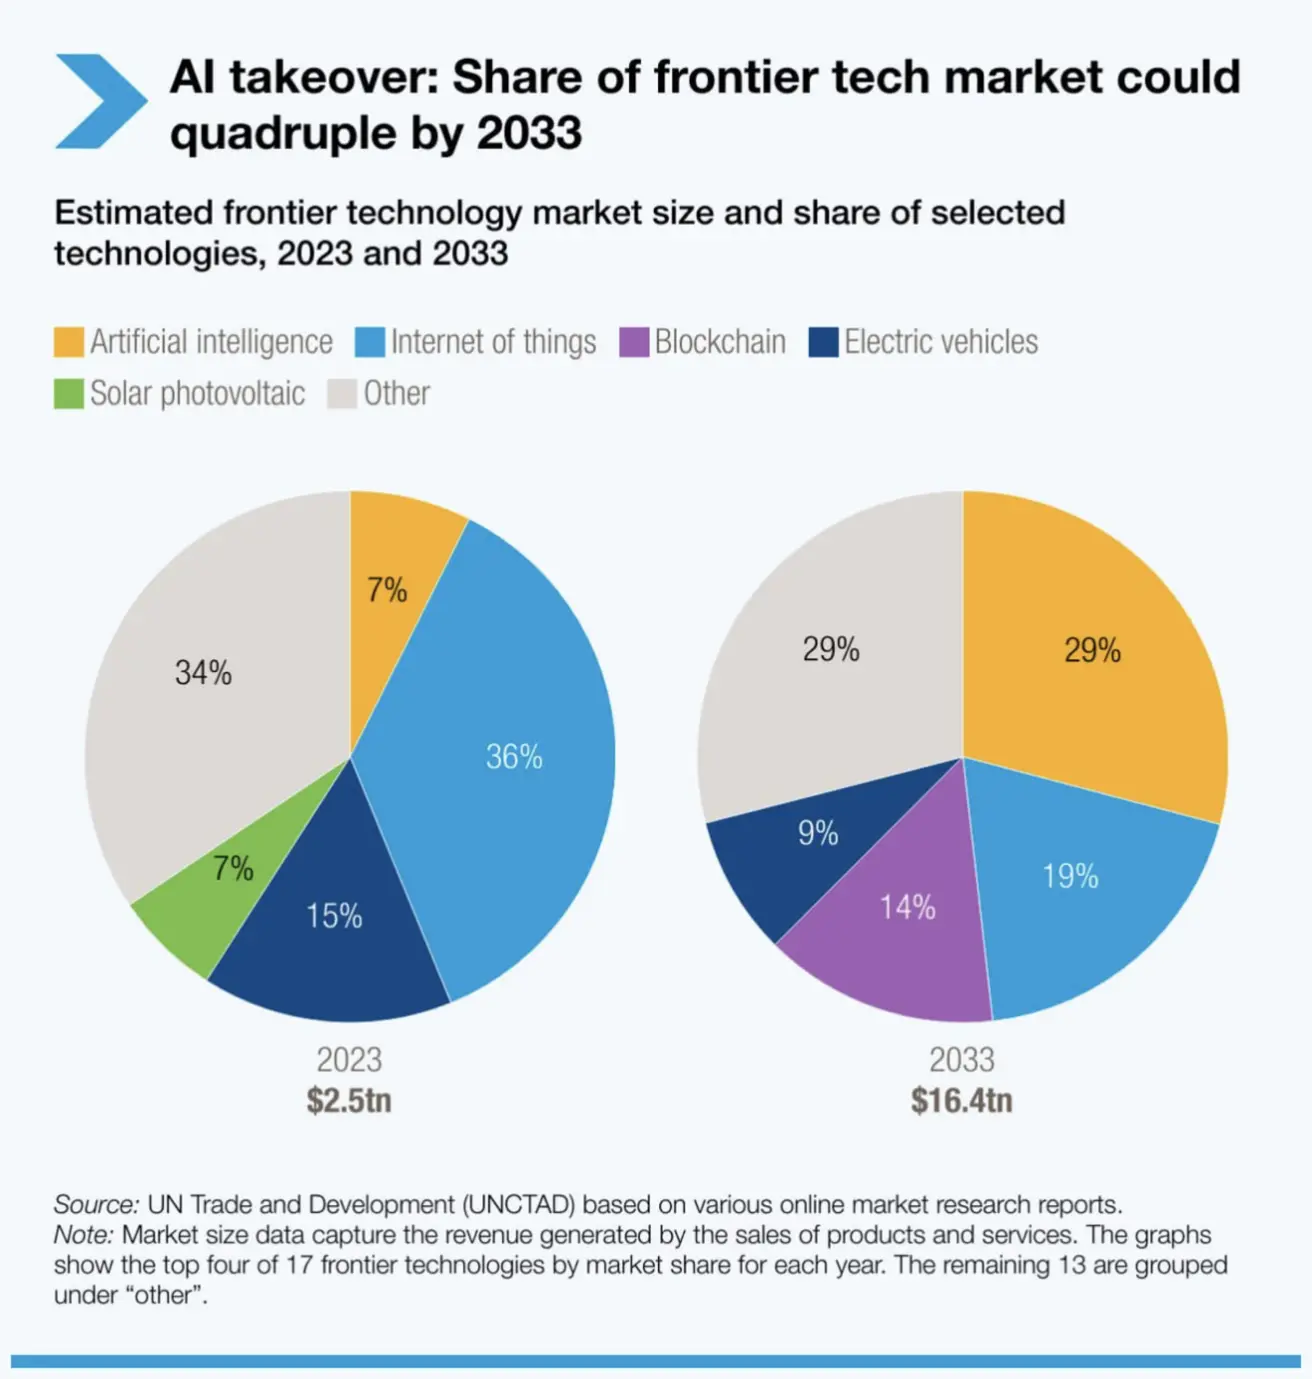
The United Nations Conference on Trade and Development (UNCTAD) projects that AI will become the leading tech sector by 2033, surpassing other industries in market value and investment growth (AI sector growth projected at 29%, blockchain share at 14%):
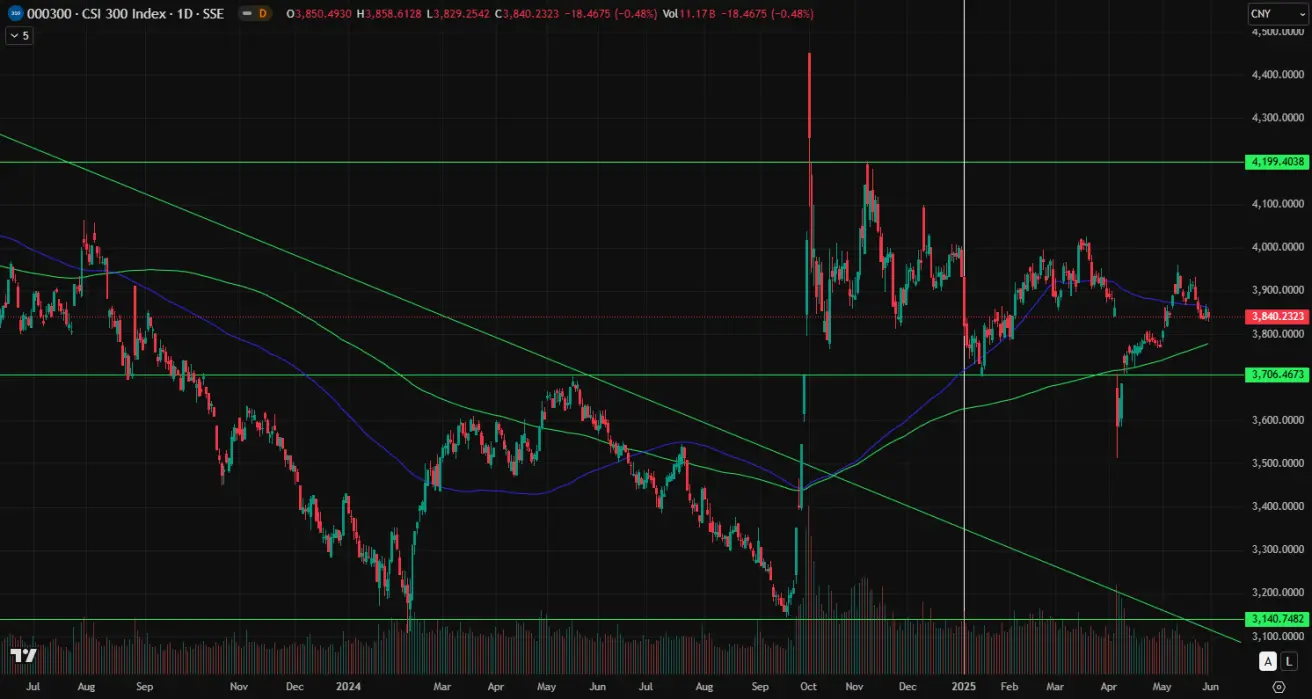
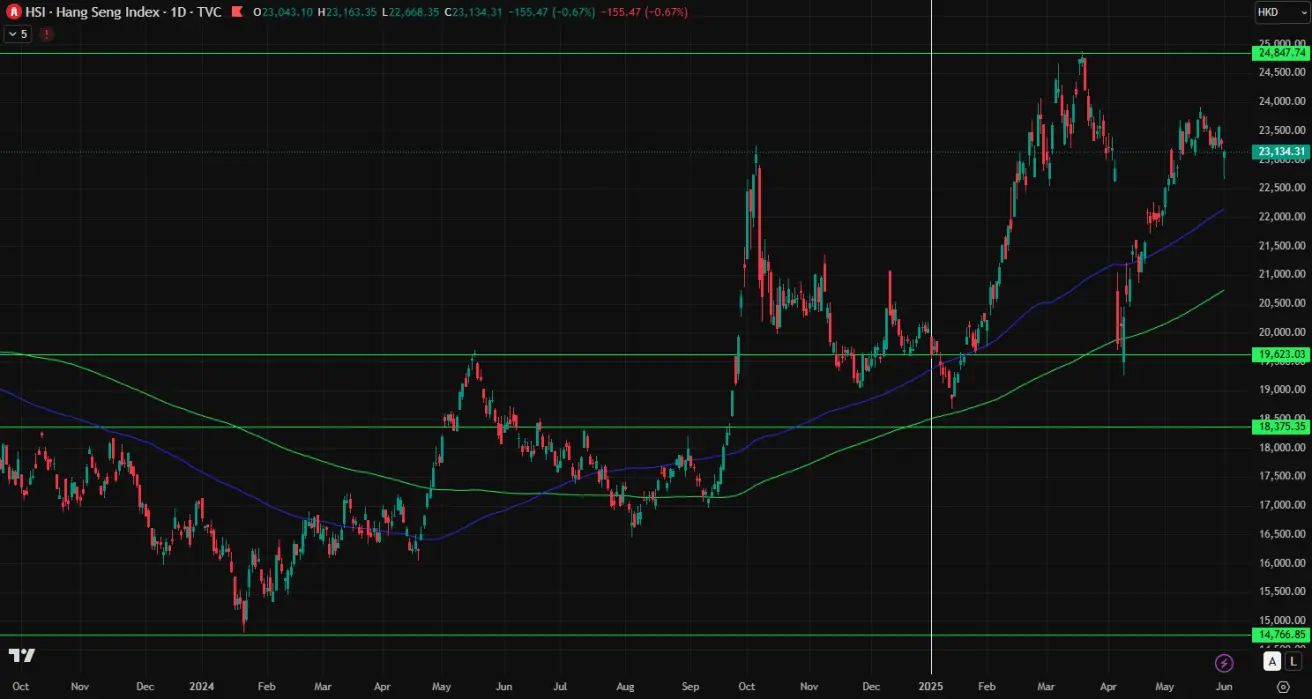
Major Chinese indices declined amid a lack of progress in trade talks. The People's Bank of China continues its accommodative stance, injecting $53 billion of liquidity into the market via reverse repo operations on May 26.
CSI 300
Weekly change -0.52% (closing 3840). YTD -2.31%.
Hang Seng
Weekly change -0.64% (closing 23134.31). YTD +16.07%.
BOND MARKET
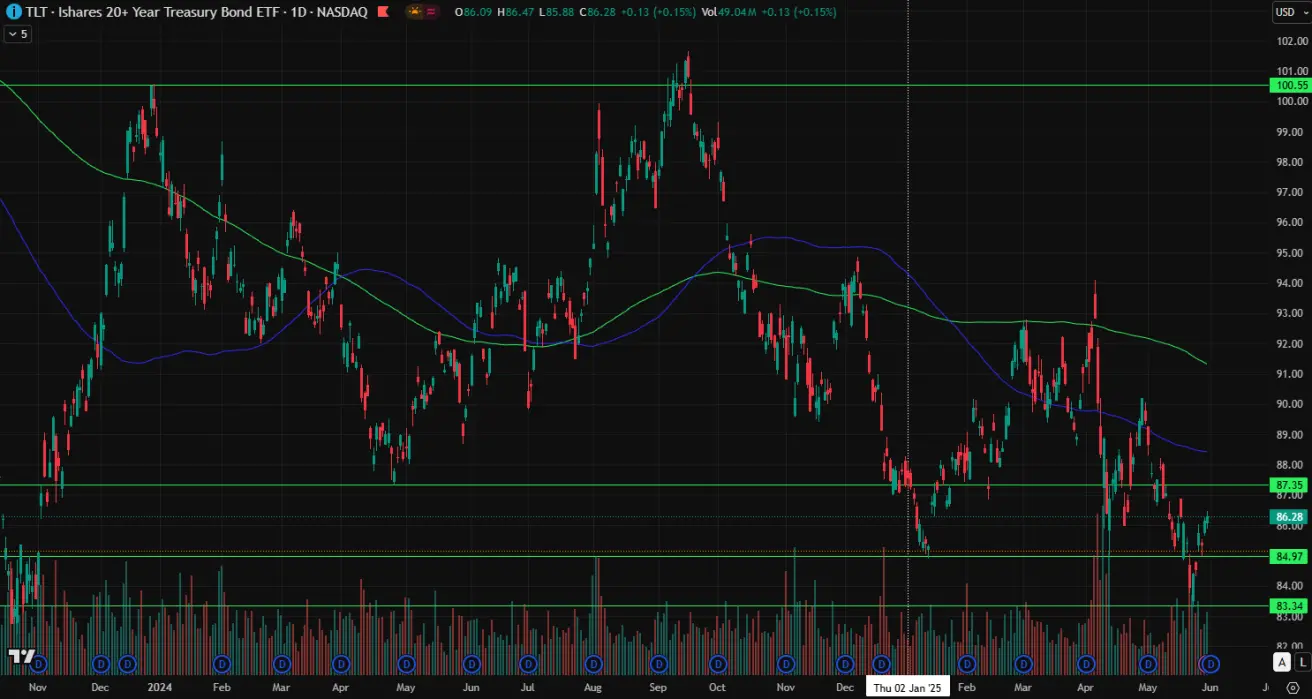
Yields fell in both Treasury and corporate bond markets last week.
20+ Year US Treasury Bonds (ETF TLT): +2.05% (closing $86.28). YTD: -1.73%. However, the fund opened this week down 1.32%:
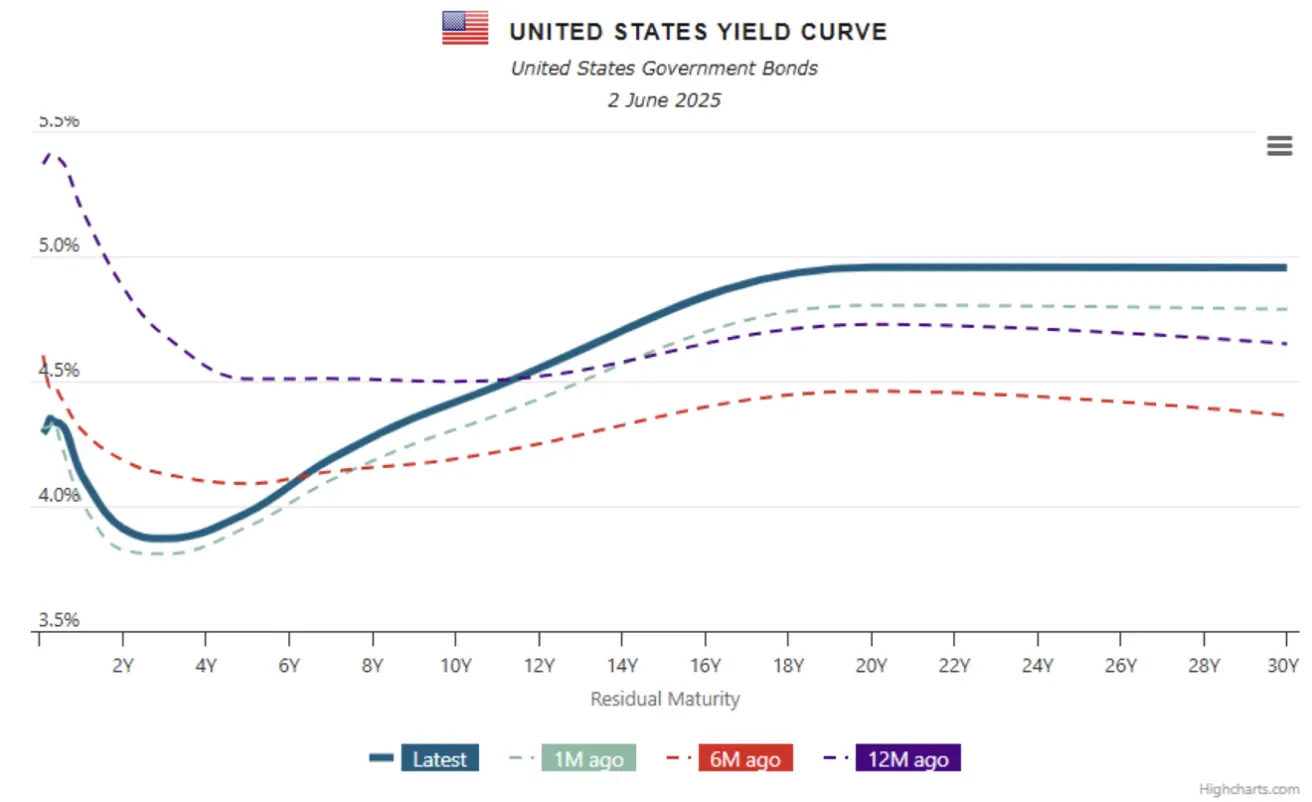
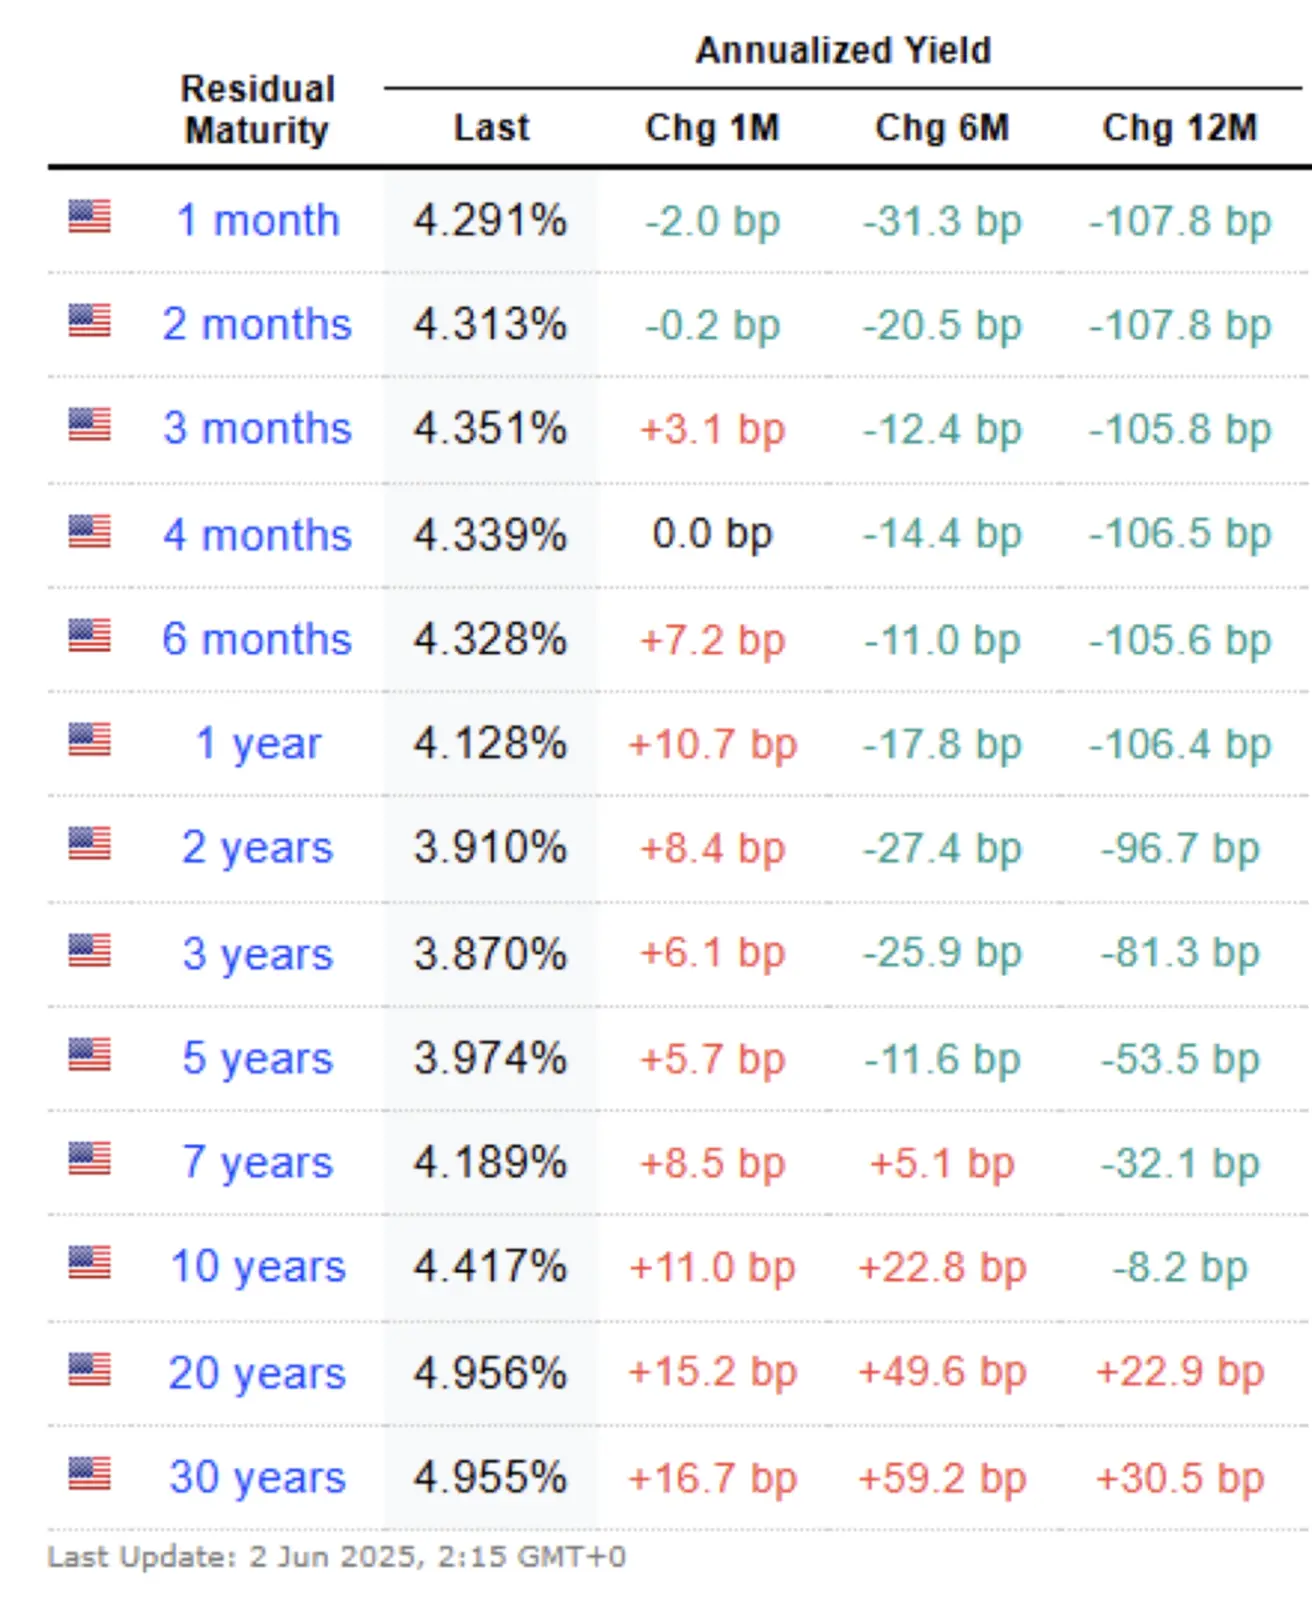
YIELDS AND SPREADS 2025/06/02 vs 2025/05/26
- US 10-Year Treasury Yield: 4.417% (vs 4.555%);
- ICE BofA BBB US Corporate Index Yield: 5.46% (vs 5.57%).
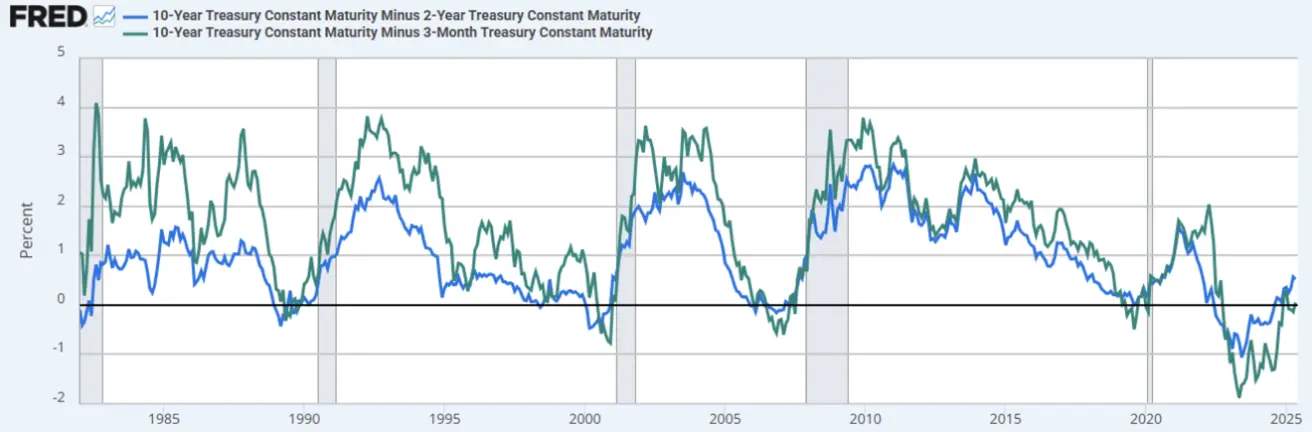
- 10Y-2Y Treasury spread: 50.7 bps (vs 56.4 bps).
- 10Y-3M Treasury spread: 6.7 bps (vs 21.6 bps).
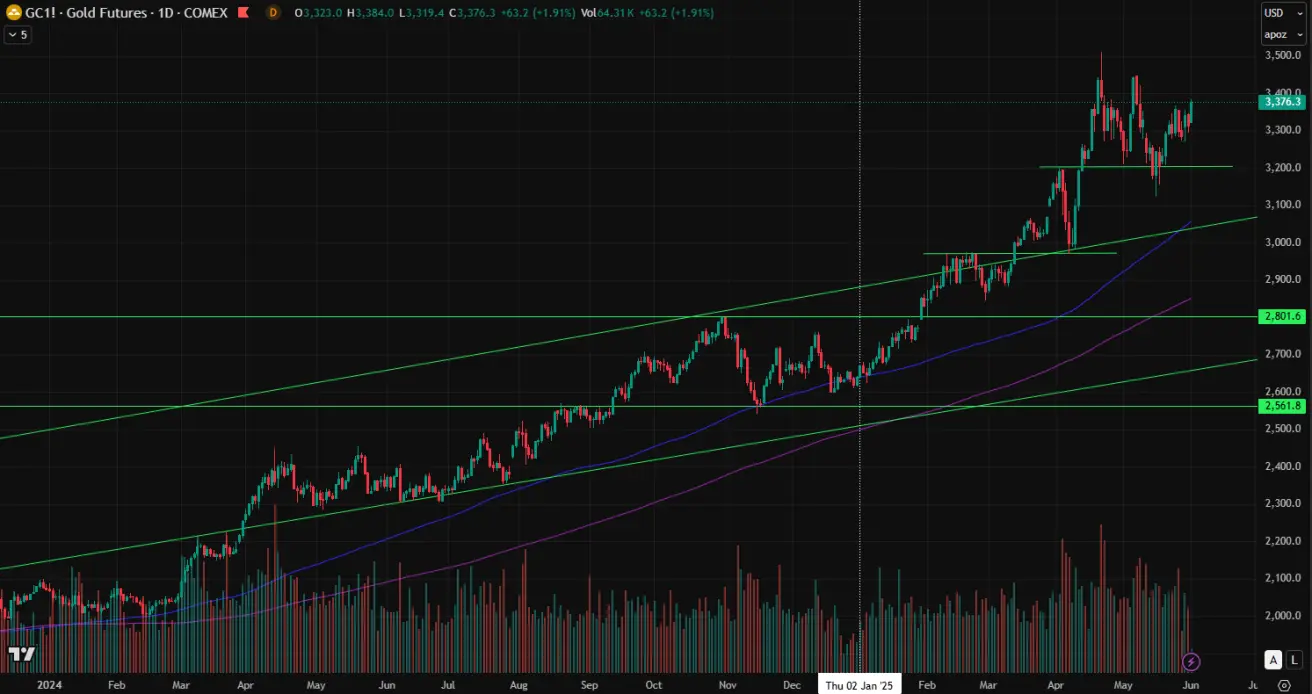
GOLD FUTURES (GC)
Weekly change -1.33%, closing $3313.1/oz. YTD: +25.45%. Gold opened this week with nearly +2% gains:
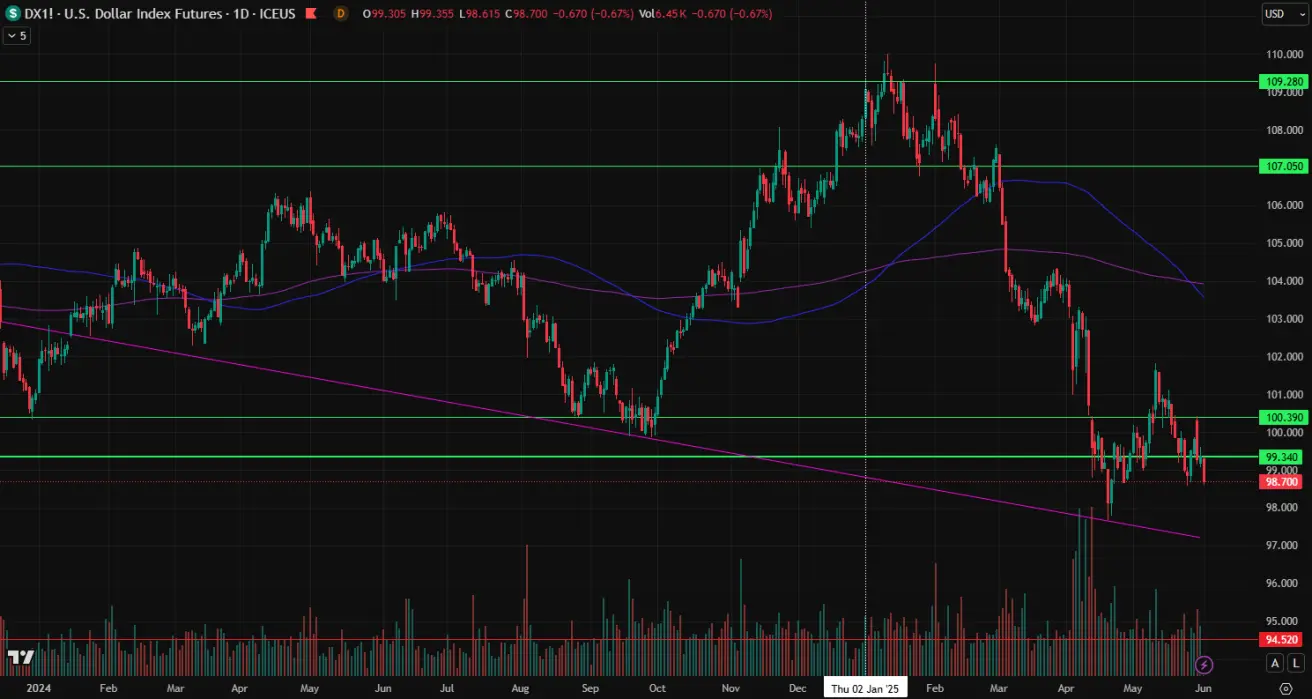
DOLLAR INDEX FUTURES (DX)
Weekly gain +0.37%, closing 99.37. YTD: -8.27%. Dollar opened this week down 0.63%.
OIL FUTURES
Weekly change +1.57%, closing $60.79/bbl. YTD: -15.39%.
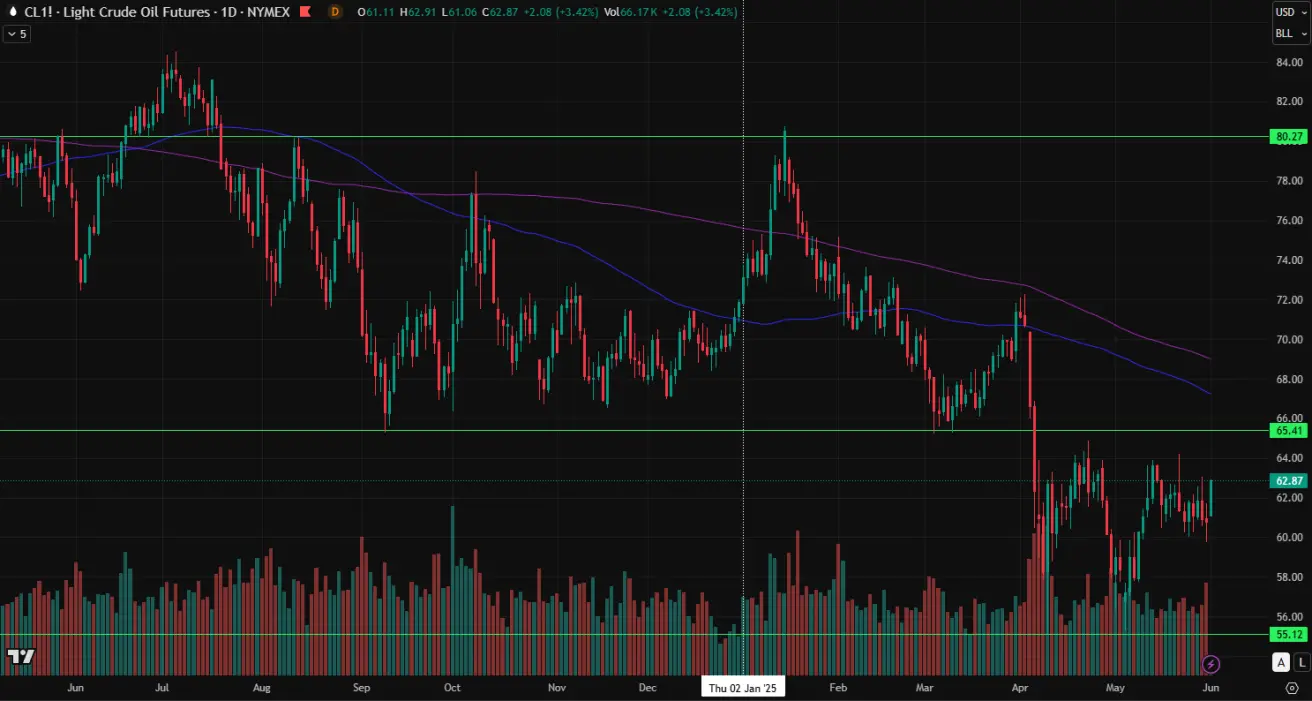
OPEC+ held a virtual meeting on May 31, 2025, and agreed to increase oil production by 411,000 barrels per day in July—equivalent to three months of incremental increases. This phased approach may be paused or reversed based on market conditions. The group also reaffirmed its commitment to offset any excess production since January 2024. OPEC+ will meet monthly to review market conditions, compliance, and compensation. The next meeting is scheduled for July 6, 2025.
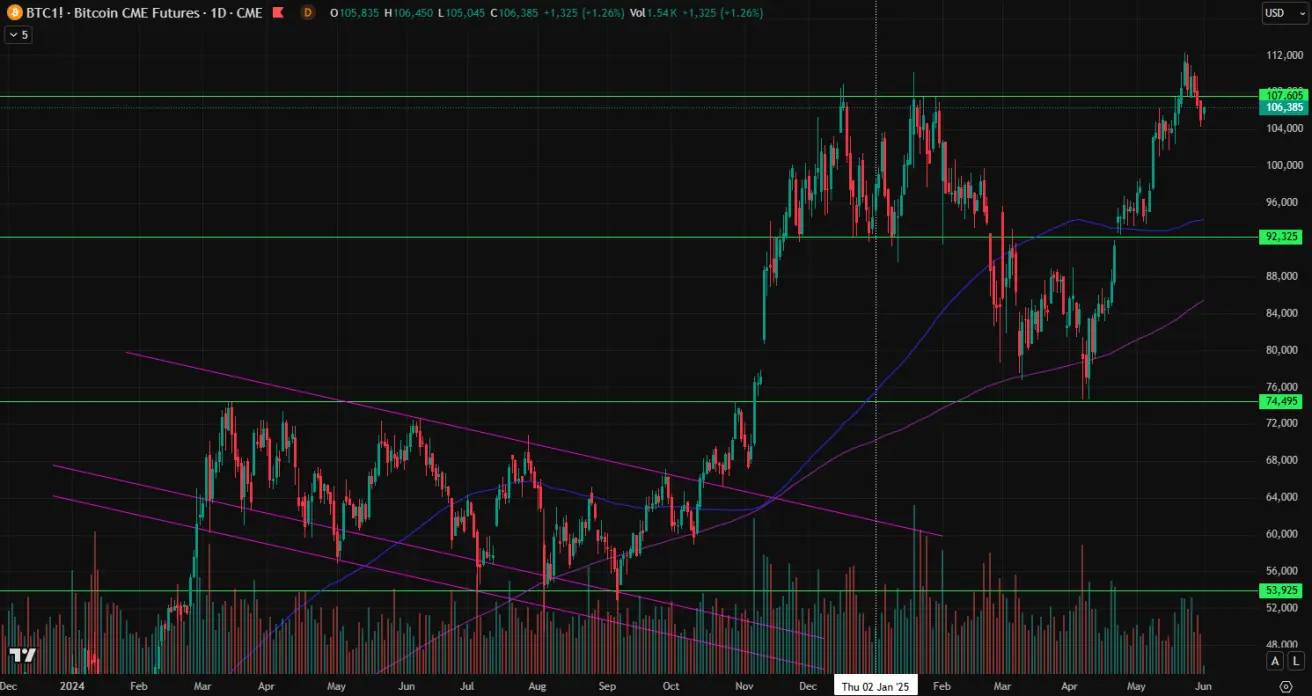
BTC FUTURES
Weekly change -3.05%, closing $105,060. YTD: +10.28%:
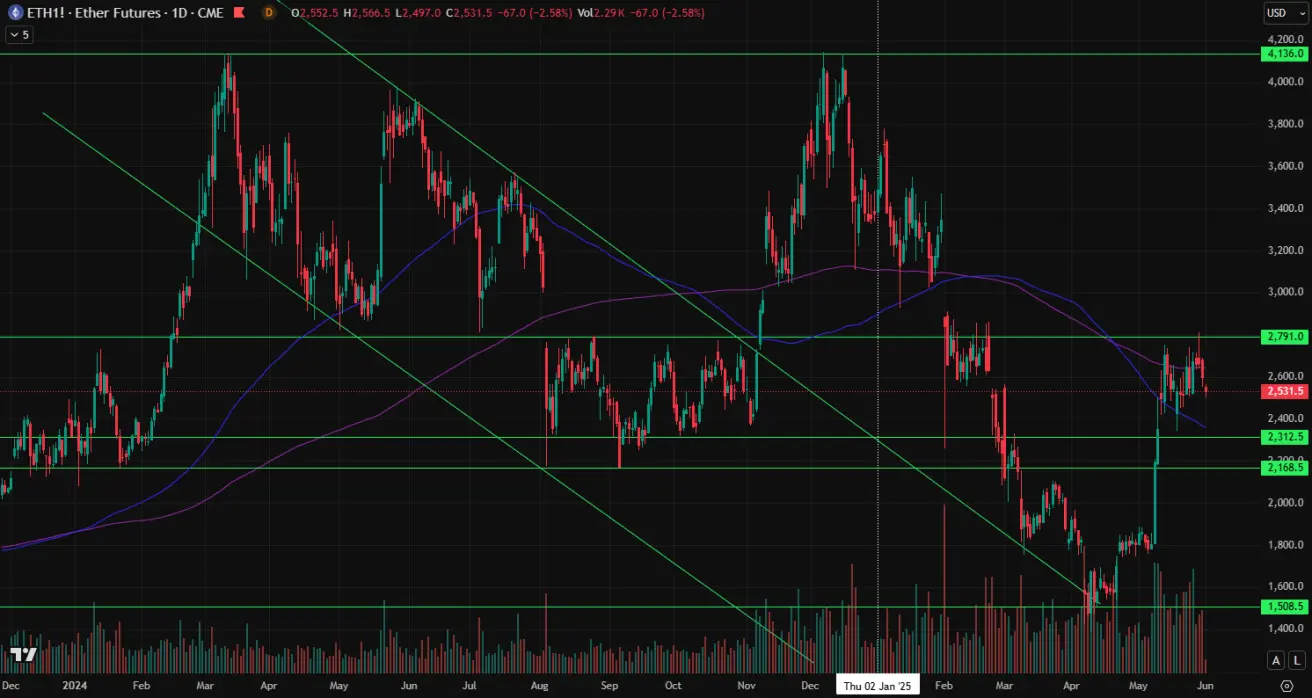
ETH FUTURES
Weekly change +2.04%, closing $2598.5. YTD: -23.21%:
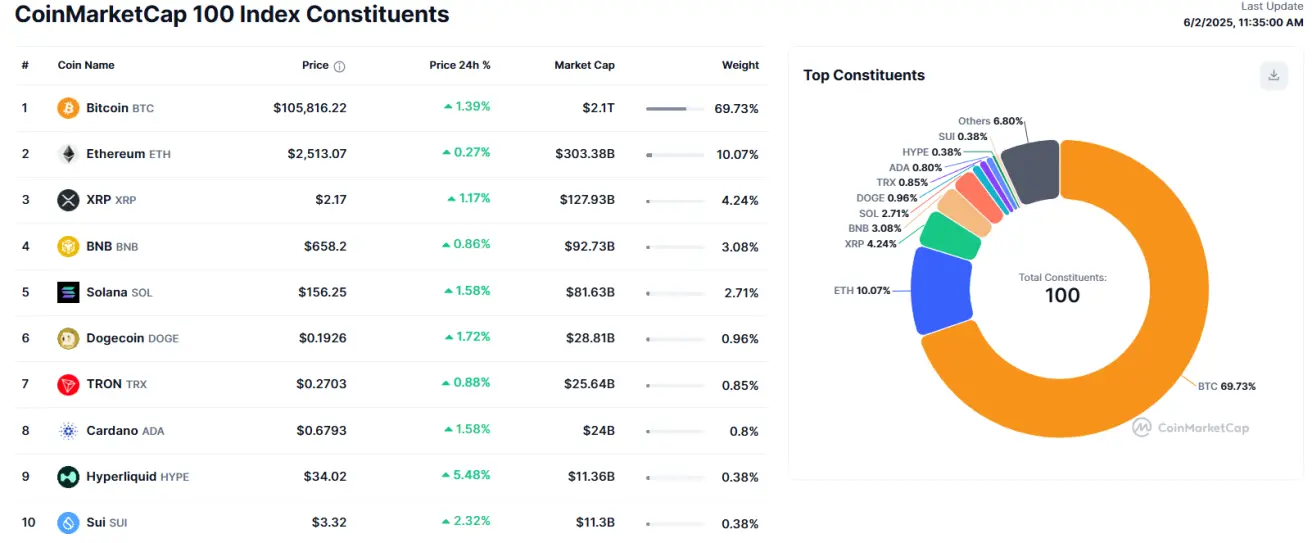
Crypto Market Capitalization: $3.3 trillion (vs $3.45 trillion previous week) (coinmarketcap.com).
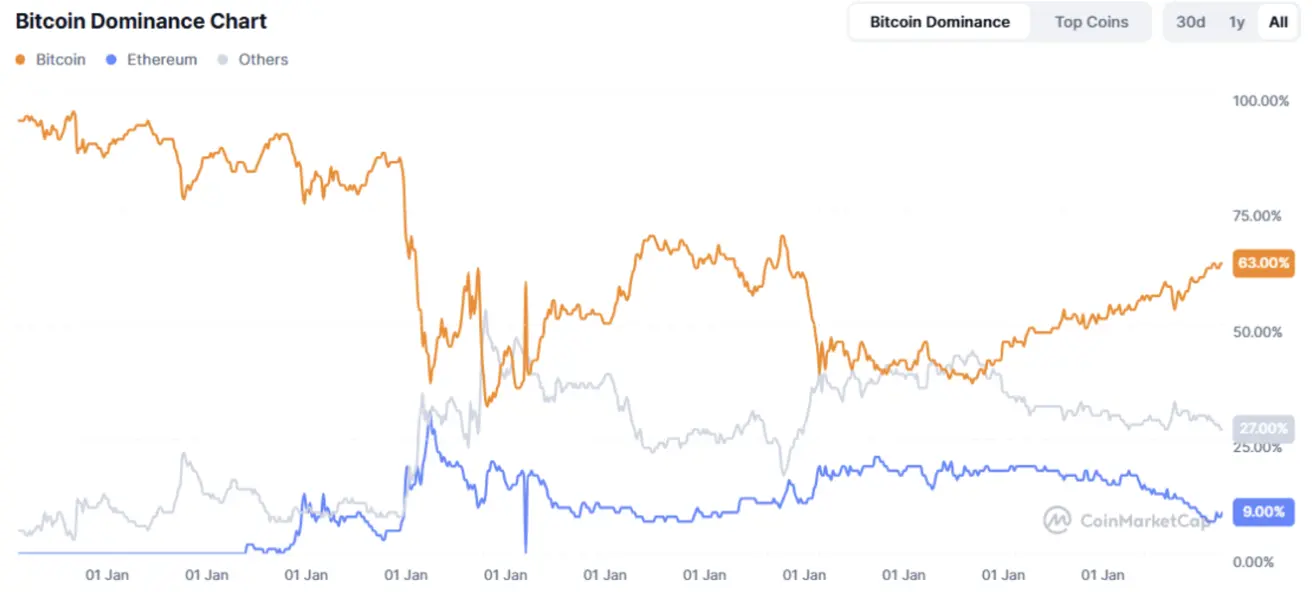
Bitcoin dominance: 63.7% (prev: 63.3%), Ethereum: 9.2% (prev: 9.0%), Others: 27.1% (prev: 27.0%):
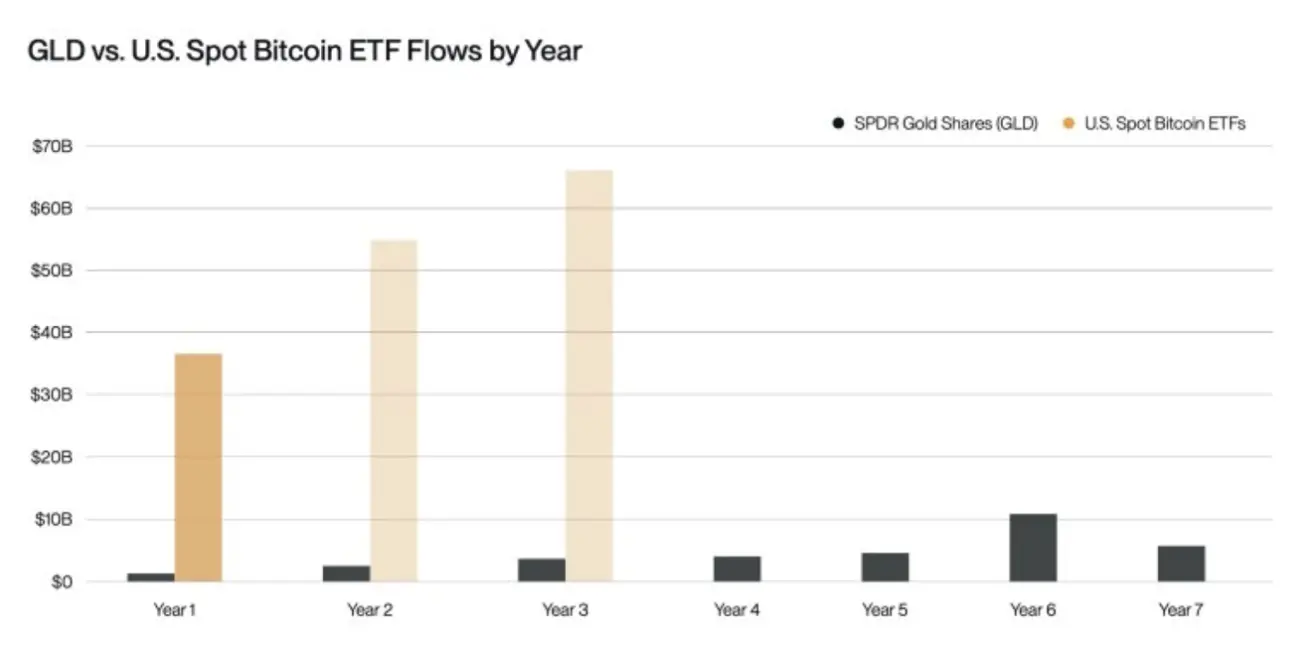
Bitwise projects Bitcoin capital inflows could exceed $55 billion by year-end 2025. In 2024, US spot Bitcoin ETFs attracted over $36 billion in net inflows, outperforming the SPDR Gold Shares ETF (GLD) by a factor of 20.
Crypto Market News
US Vice President JD Vance at a Bitcoin conference endorsed the cryptocurrency with the following key points:
“Cryptocurrencies serve as insurance against Washington’s poor fiscal policies (referring to national debt growth);
Bitcoin is a hedge against inflation;
We will remove all regulators opposing Bitcoin (citing former SEC Chair Gary Gensler as an example);
We will implement regulations that fully integrate cryptocurrency into our economy. Crypto and Bitcoin are now part of the US core economy and will remain so.”
Emma Reynolds, Member of the UK Labour Party, stated: “The UK government currently has no plans to create a strategic Bitcoin reserve.”