Русский
 Қазақша
 Eesti
November 2 – November 8, 2026: Weekly economic update
Key market updates

United States
Last week, the U.S. held its midterm elections, and the results affected sentiment in financial markets.
Democrats won control of the House of Representatives and the Senate, which could potentially lead to changes in both U.S. domestic and foreign policy. However, the scale of these changes is hard to assess for now: Donald Trump remains president for two more years and retains his veto power, so a significant share of the Democrats’ legislative initiatives will require either a compromise with the White House or broad bipartisan support.
Democratic control is relative: formally, the House of Representatives can impeach Trump by a simple majority. But removing the president requires two-thirds of the senators present, and the Democrats do not have such a majority. Therefore, even if impeachment proceedings are launched, removing Trump without significant Republican support would be extremely difficult.
Key Takeaways:
- The policy rate was raised to a range of 3.75 - 4.00%; rhetoric is hawkish;
- Monetary policy remains moderately restrictive;
- U.S. macroeconomic data continue to support a soft-landing scenario: inflation risks are increasing, the labor market is cooling without signs of recession, and current conditions do not yet warrant a rate cut.
- The Fed slightly improved its GDP and employment forecasts and raised its near-term inflation forecasts.
Inflation: Consumer Price Index (September)
- Core CPI (MoM): 0.3% (previous: 0.3%).
- Core CPI (YoY): 2.6% (previous: 2.4%).
- CPI (MoM): 0.6% (previous: 0.4%).
- CPI (YoY): 3.7% (previous: 3.4%).
Producer Price Index (September)
- PPI (MoM): 1.3% (previous: 0.4%).
- Core PPI (MoM): 0.7% (previous: 0.3%).
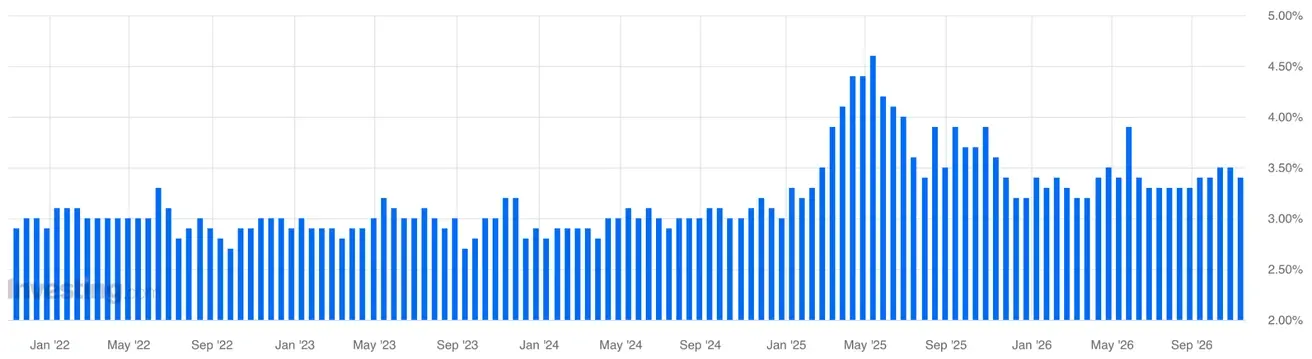
Inflation Expectations (Michigan) (October)
- 12-month Inflation Expectations: 4.3% (previous: 4.7%).
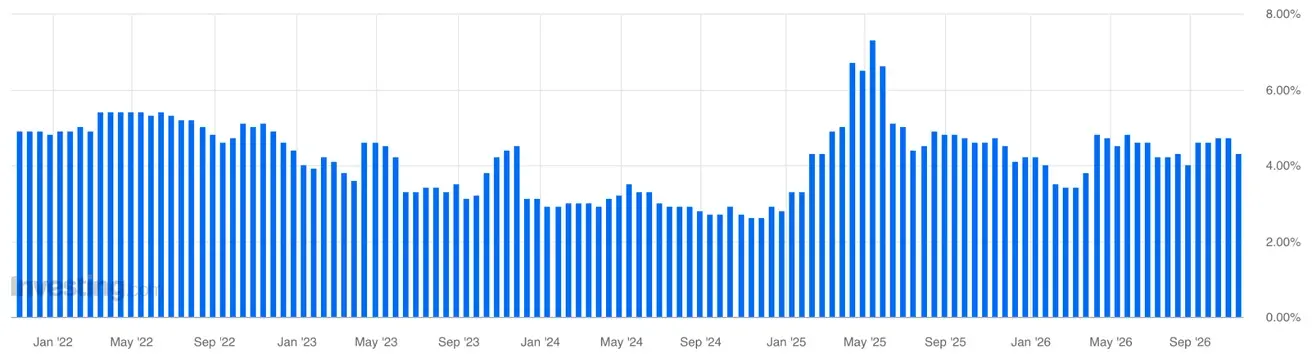
- 5-Year Inflation Expectations: 3.4% (previous: 3.5%).
The Fed’s inflation benchmark:
Core PCE Price Index (September): MoM: 0.3% (previous: 0.2%); YoY: 3.1% (previous: 3.0%):
Headline PCE Price Index (September): MoM: 0.5% (previous: 0.3%); YoY: 3.6% (previous: 3.4%):
GDP (U.S. Bureau of Economic Analysis, BEA) — Q3 2026 (QoQ), advance estimate: 3.4% (Q2 2026: 2.2%):
GDPNow (the Atlanta Fed’s real-time estimate of official GDP growth ahead of release (Q3 2026)): 3.4% (previous: 3.6%).
Business Activity Index (PMI) (October)
(Above 50 indicates expansion; below 50 indicates contraction)
- Services PMI: 56.1 (previous: 58.8)
- Manufacturing PMI: 54.9 (previous: 56.0)
- Composite PMI: 55.9 (previous: 58.4)
Labor Market (BLS) (October)
- Unemployment rate: 4.1% (previous: 4.2%);
- Total number of people receiving unemployment benefits in the U.S.: 1,718K (previous: 1,701K);
- Initial jobless claims: 189K (previous: 194K) — no signs of mass layoffs;
- Change in nonfarm payrolls: 165K (previous: 60K, revised);
- Change in private nonfarm payrolls: 159K (previous: 78K, revised);
- Average hourly earnings (YoY): 3.1% (previous: 3.2%, revised) — a slowdown, which is positive in terms of inflationary pressure;
- JOLTS job openings: 7.523M (prev: 7.271M).
Monetary Policy
Fed officials’ rhetoric:
Richmond Fed President Thomas Barkin (November 5): hawkish rhetoric, but in favor of gradual tightening. Barkin said that inflation remains too high and unemployment very low, so further rate hikes are, in his view, likely; at the same time, he prefers to move gradually given high uncertainty and the need to gather more data.
New York Fed President John Williams (November 6): a cautiously hawkish signal. He stressed that inflation is still “too high” and must be sustainably returned to 2%, but also noted that inflation expectations remain anchored, wage growth is consistent with the Fed’s goal, and it is now sensible to gather more data before the next decision — that is, without calling for an immediate hike.
Both speakers: in favor of further but gradual hikes.
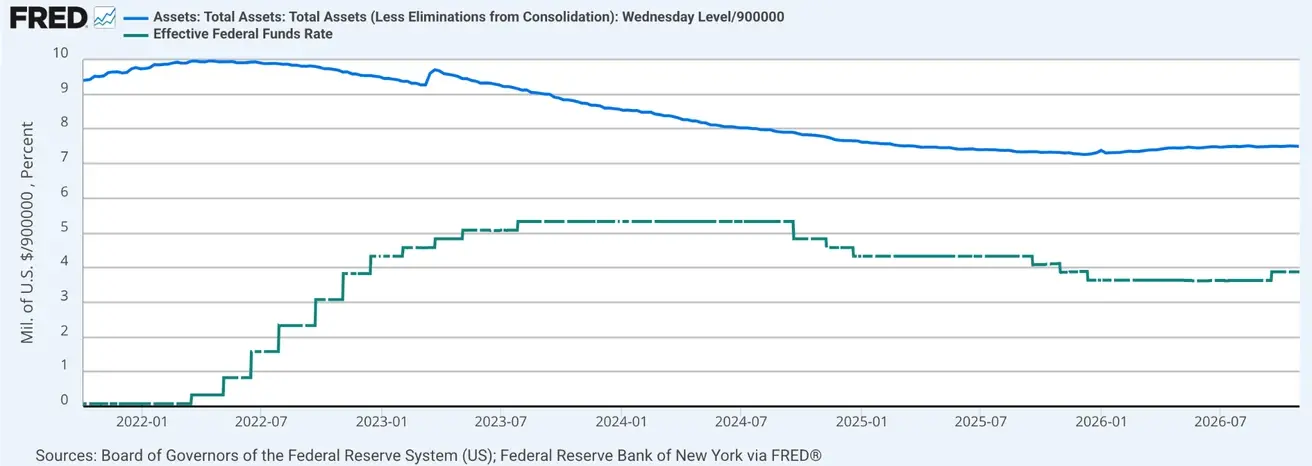
Federal funds rate (EFFR): 3.75%–4.00%
Federal Reserve balance sheet: $6.748 trillion, +3.26% since the end of QT ($6.535 trillion):
Market Forecast for Rate (FedWatch)
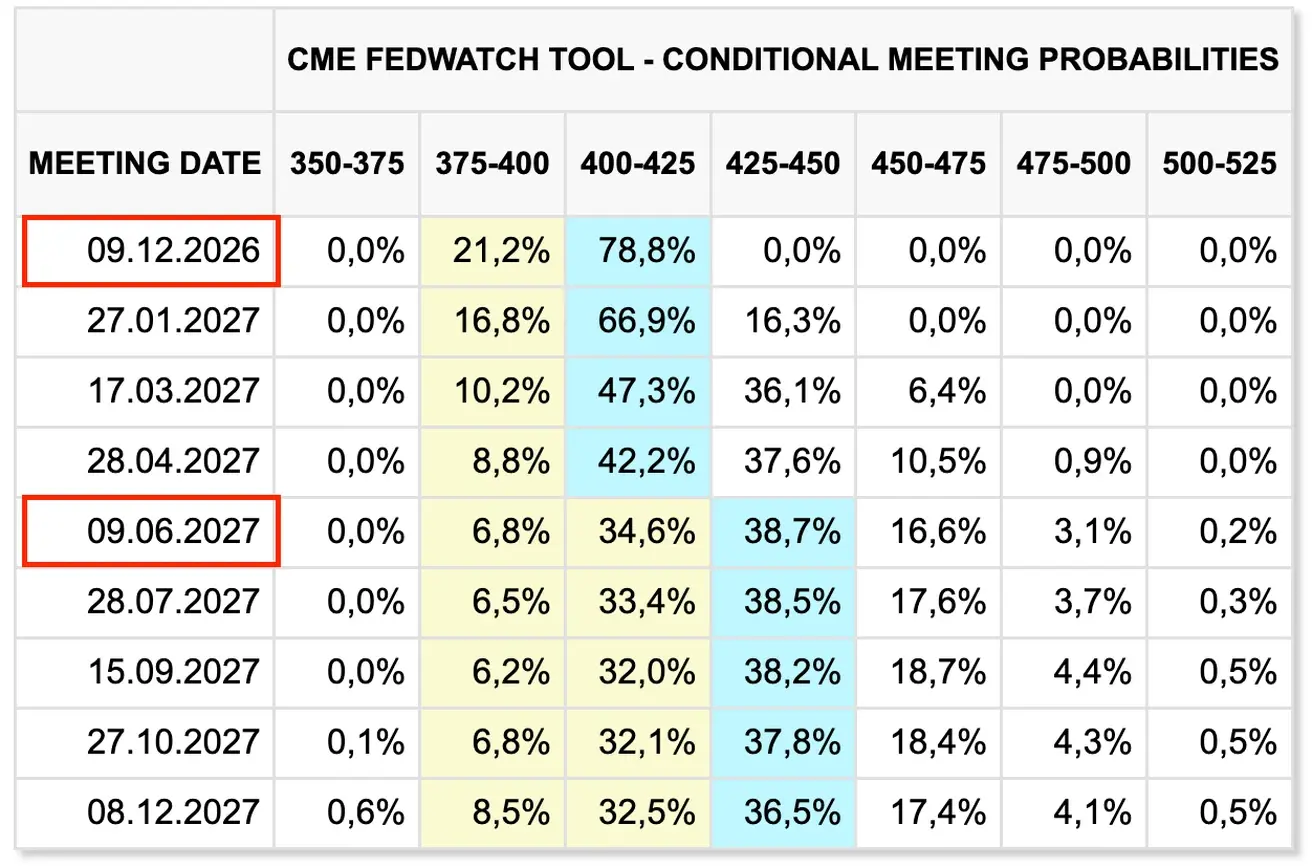
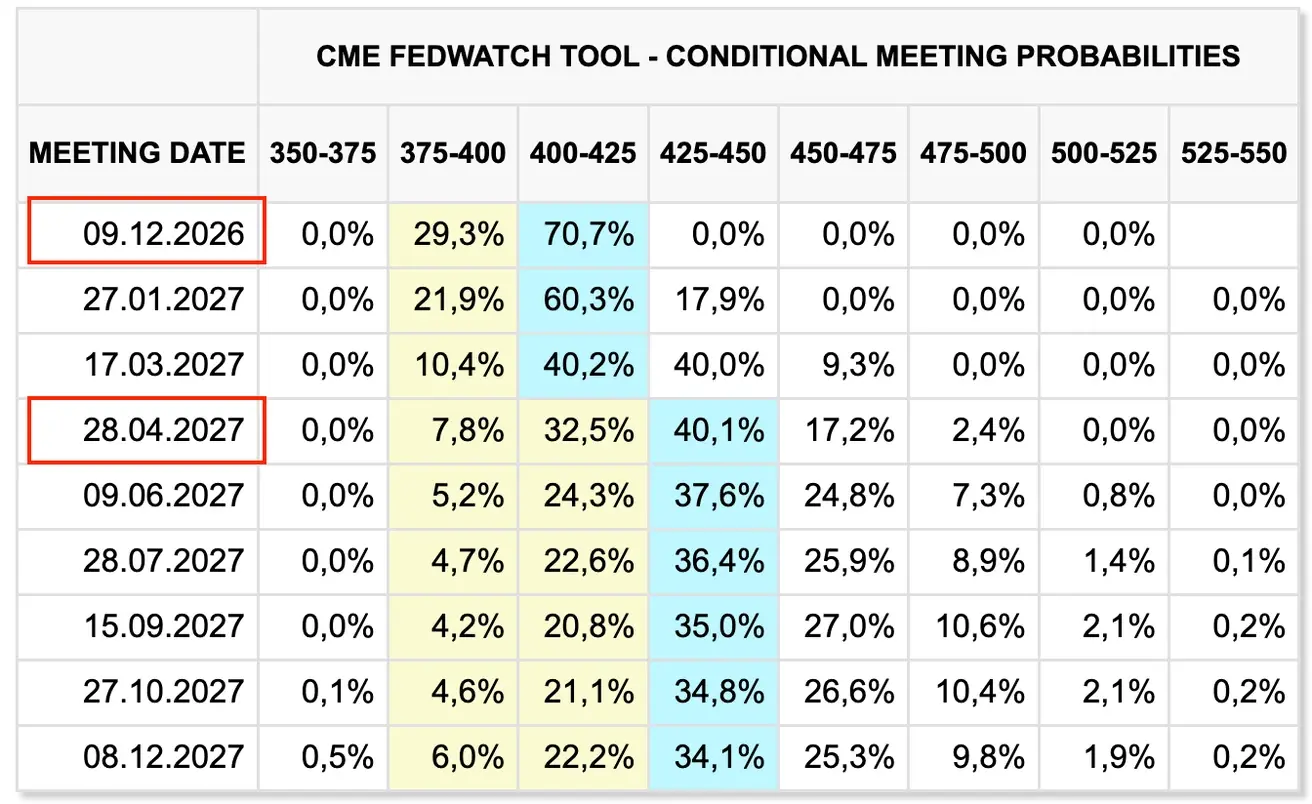
For the next FOMC meeting (December 9), a rate hike remains the more likely outcome: the probability of a 0.25% hike stands at 78.83% (a week earlier: 70.74%):
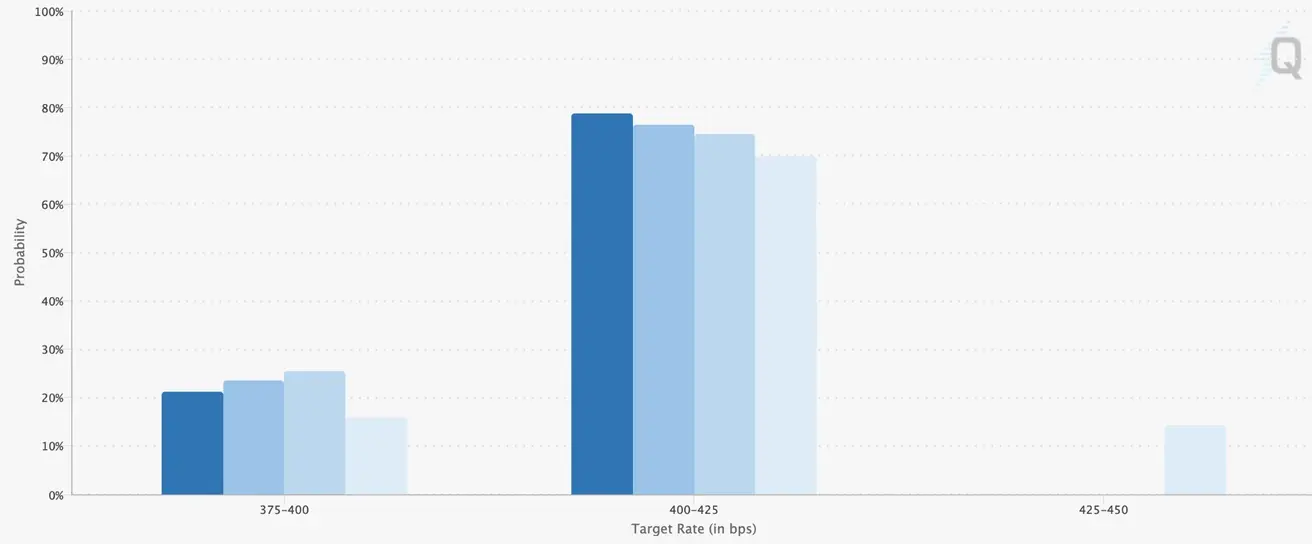
Over the next 12 months: two 0.25% rate hikes, bringing the rate to a range of 4.25–4.50%, with the first hike at the next meeting:
Today:
A week earlier:
Bond Market
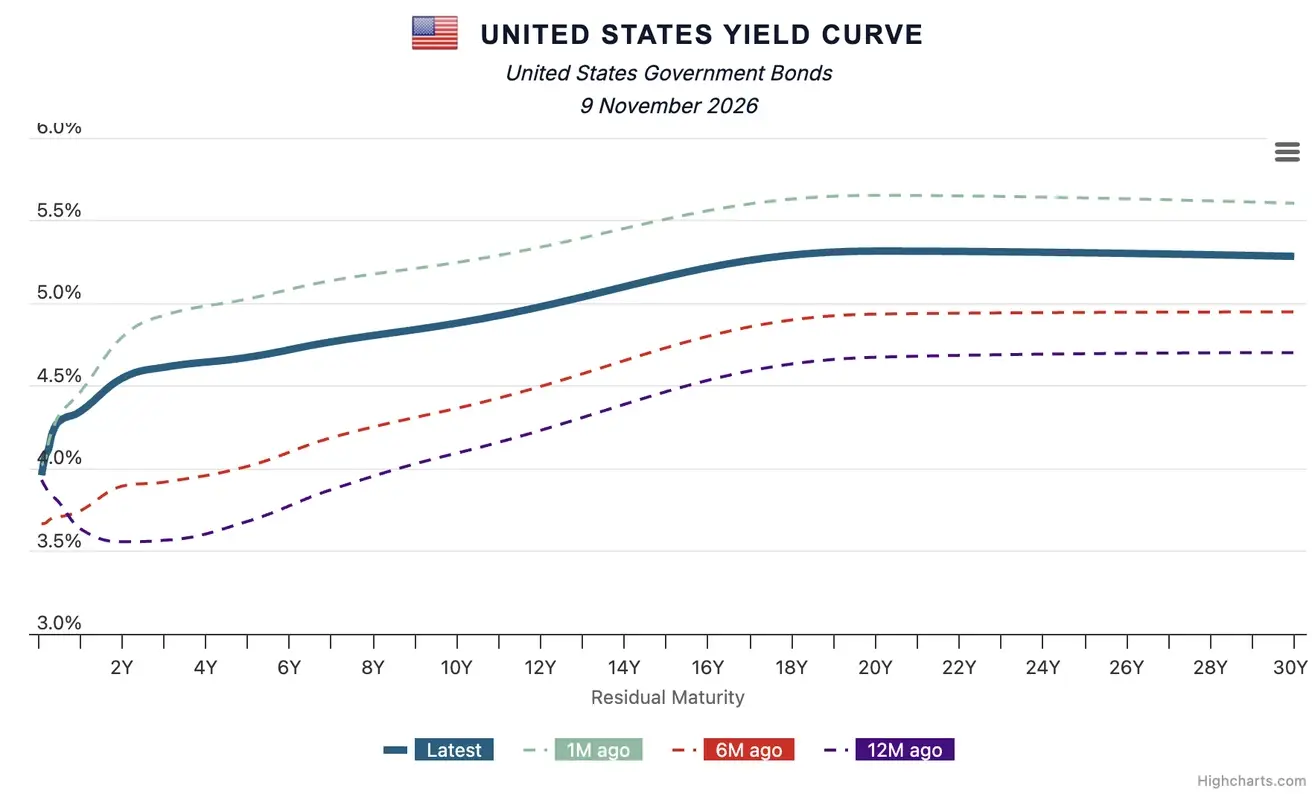
U.S. debt market: yields declined across the curve, indicating rising demand for bonds and a partial decline in the risk premium after the October sell-off, although the long end of the curve remains elevated.
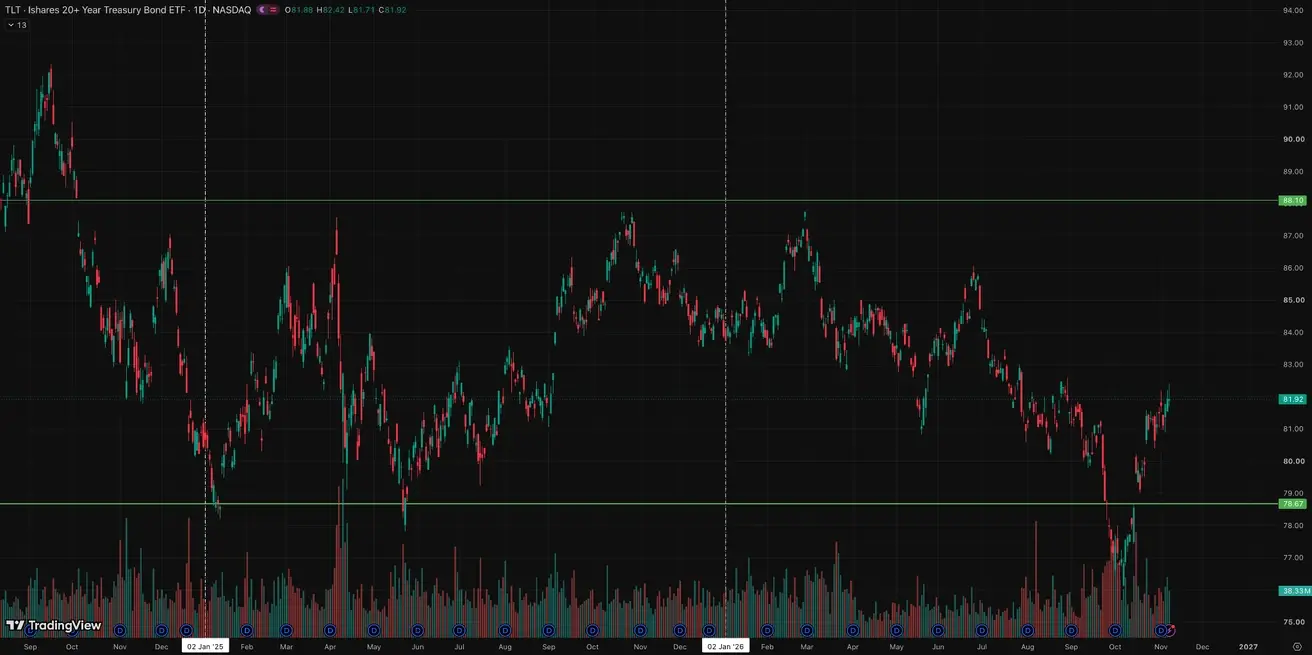
U.S. Treasury Bonds 20+ Years (TLT ETF): weekly performance: +0.10% (week close: $81.92); year-to-date: -6.01%
Yields and Spreads
- Market Yield on U.S. Treasury Securities at 10-Year Constant Maturity: 4.88% (previous: 4.93%);
- 2-Year U.S. Treasury Yield: 4.54% (previous: 4.58%);
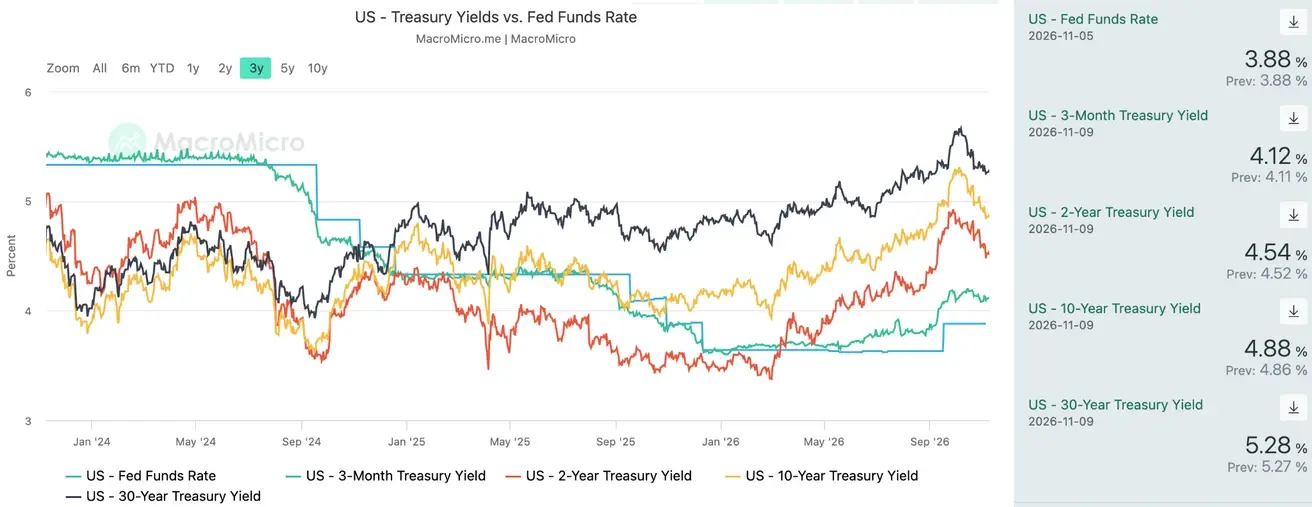
- The yield spread between 10-year and 2-year U.S. Treasury securities stands at 34 basis points (previous: 35 bps);
- The yield spread between 10-year and 3-month U.S. Treasury securities stands at 76 basis points (previous: 85 bps).
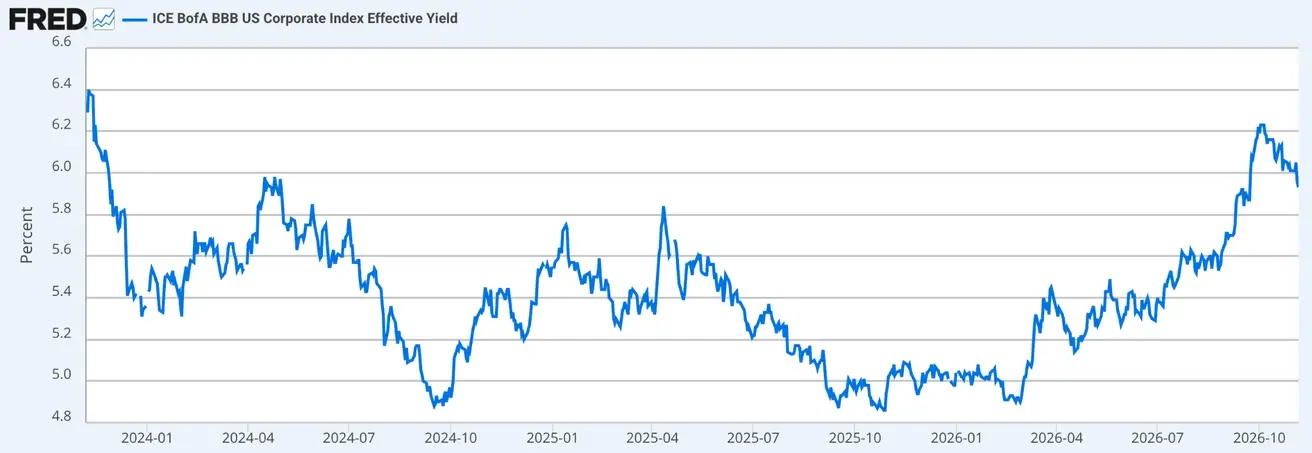
- ICE BofA BBB US Corporate Index Effective Yield: 5.93% (previous: 6.01%).
U.S. Treasury Yield Curve
The cost of a 5-year U.S. Credit Default Swap (CDS) (insurance against default): 34.87 bps (vs. 34.87 bps a week earlier).
On Thursday, the tech sell-off was accompanied by narratives about threats to AI development.
After the Democratic victory, several candidates who had previously opposed data centers won gubernatorial races in states where AI development is concentrated — Texas, Georgia, Ohio and others — which account for about 40% of planned data center capacity in the U.S.
Accordingly, the market is now concerned that this political alignment could slow AI development. By some estimates, state-level suspensions of data center operations put roughly 5–7% of AI capital expenditures in 2027 at risk.
The Democratic majority in the House of Representatives and the Senate will take effect in January 2027. A federal moratorium on data centers would require the president’s signature, and it is highly doubtful that Trump would sign it.
Even if restrictions are introduced, hyperscalers would move their projects to other states, which is a key risk mitigator.
In addition, if capex growth does slow, big tech companies can direct their huge operating cash flow toward share buybacks, dividends, and debt reduction.
Last week’s sell-off should rather be interpreted as a repricing of political risk and expectations for the pace of AI capex, not as a fundamental break in the investment cycle. Meanwhile, third-quarter corporate earnings remain strong.
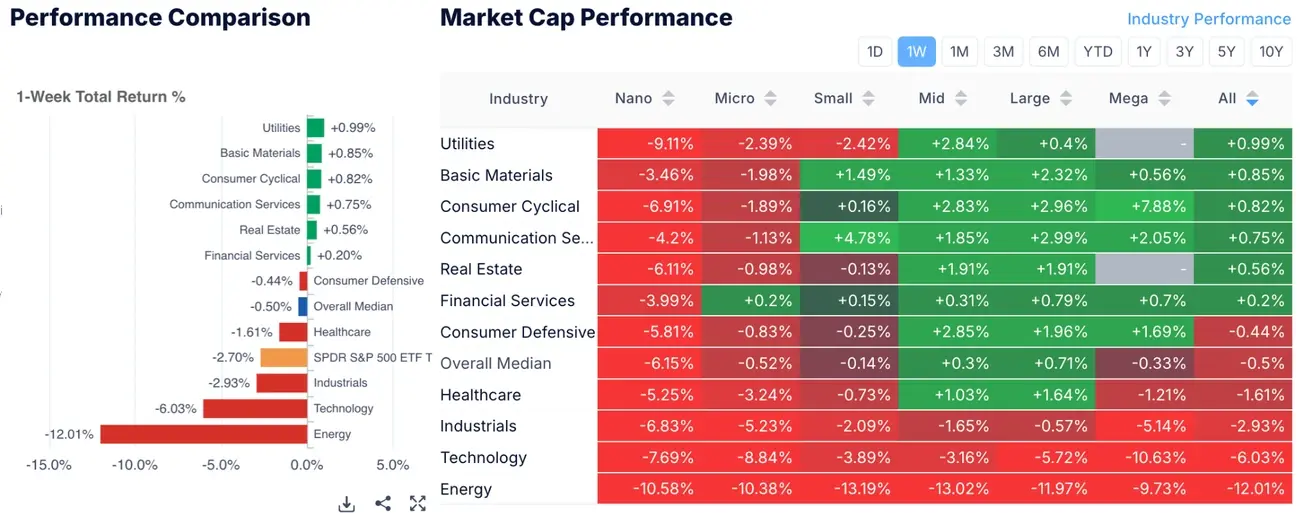
Defensive sectors were last week’s beneficiaries:
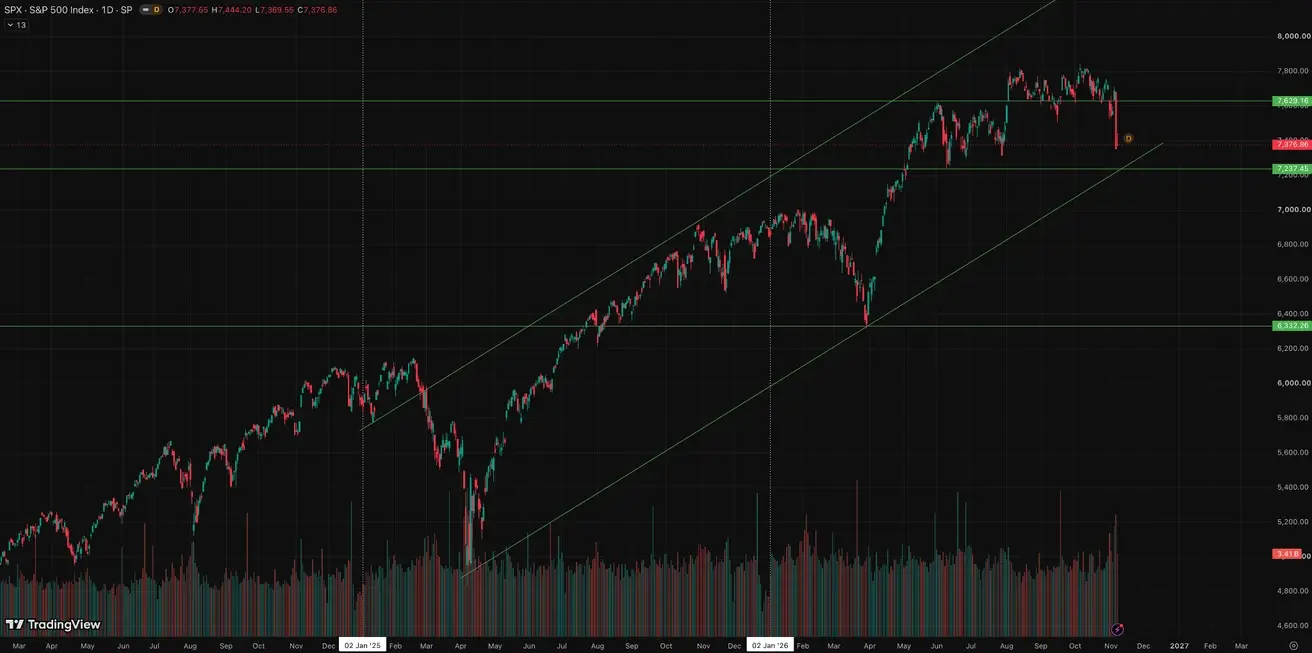
S&P500
Weekly performance: -2,68% (week-end close: 7376,86); year-to-date: +7,76%.
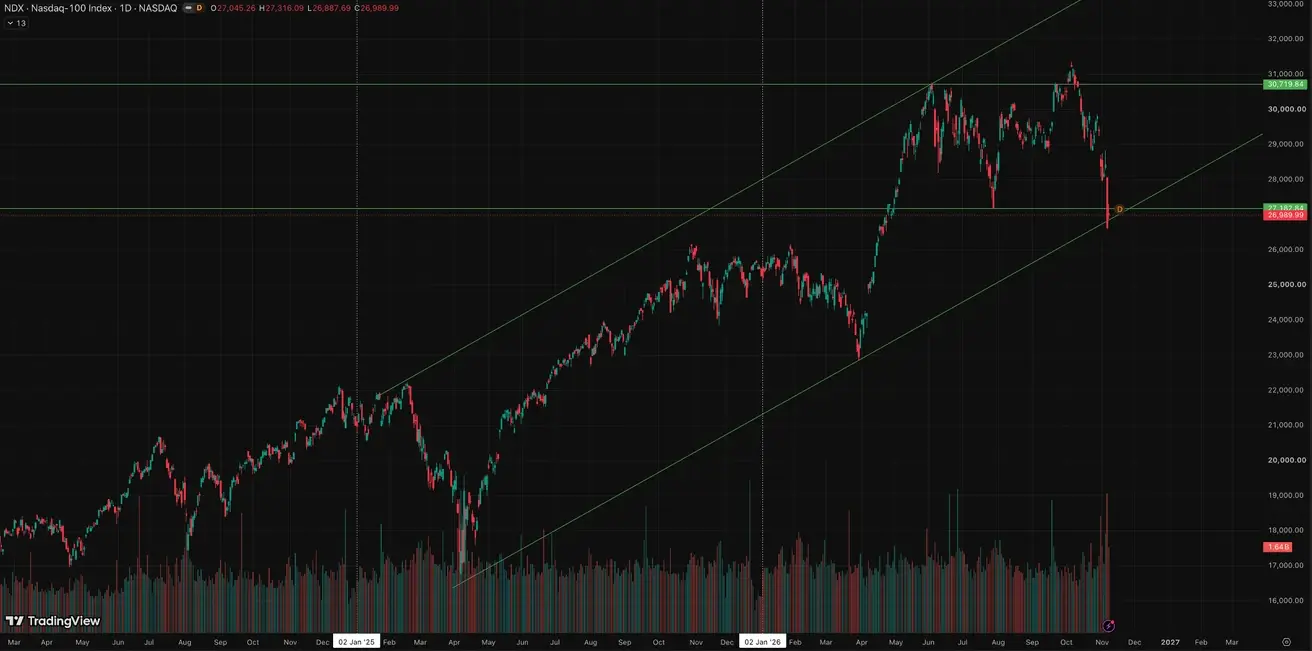
NASDAQ100
Weekly performance: -4,91% (week-end close: 26989,99); year-to-date: +6,89%.
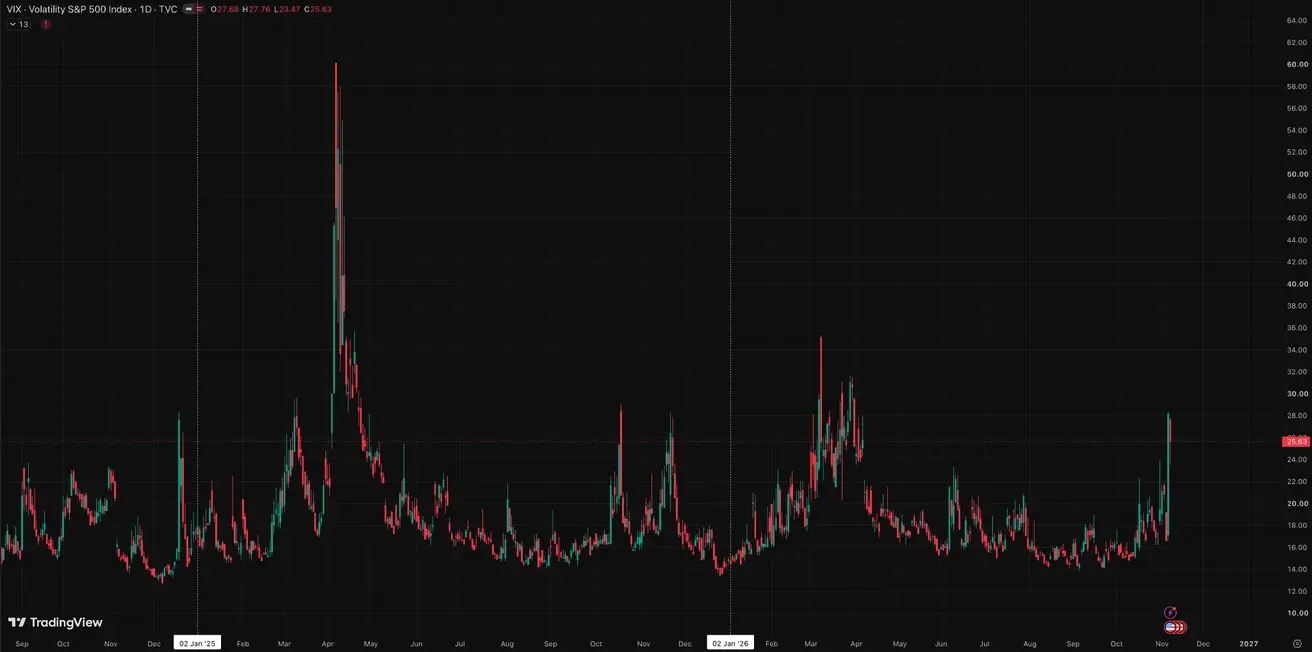
VIX
VIX (volatility index): week-end close at 25,63 points.
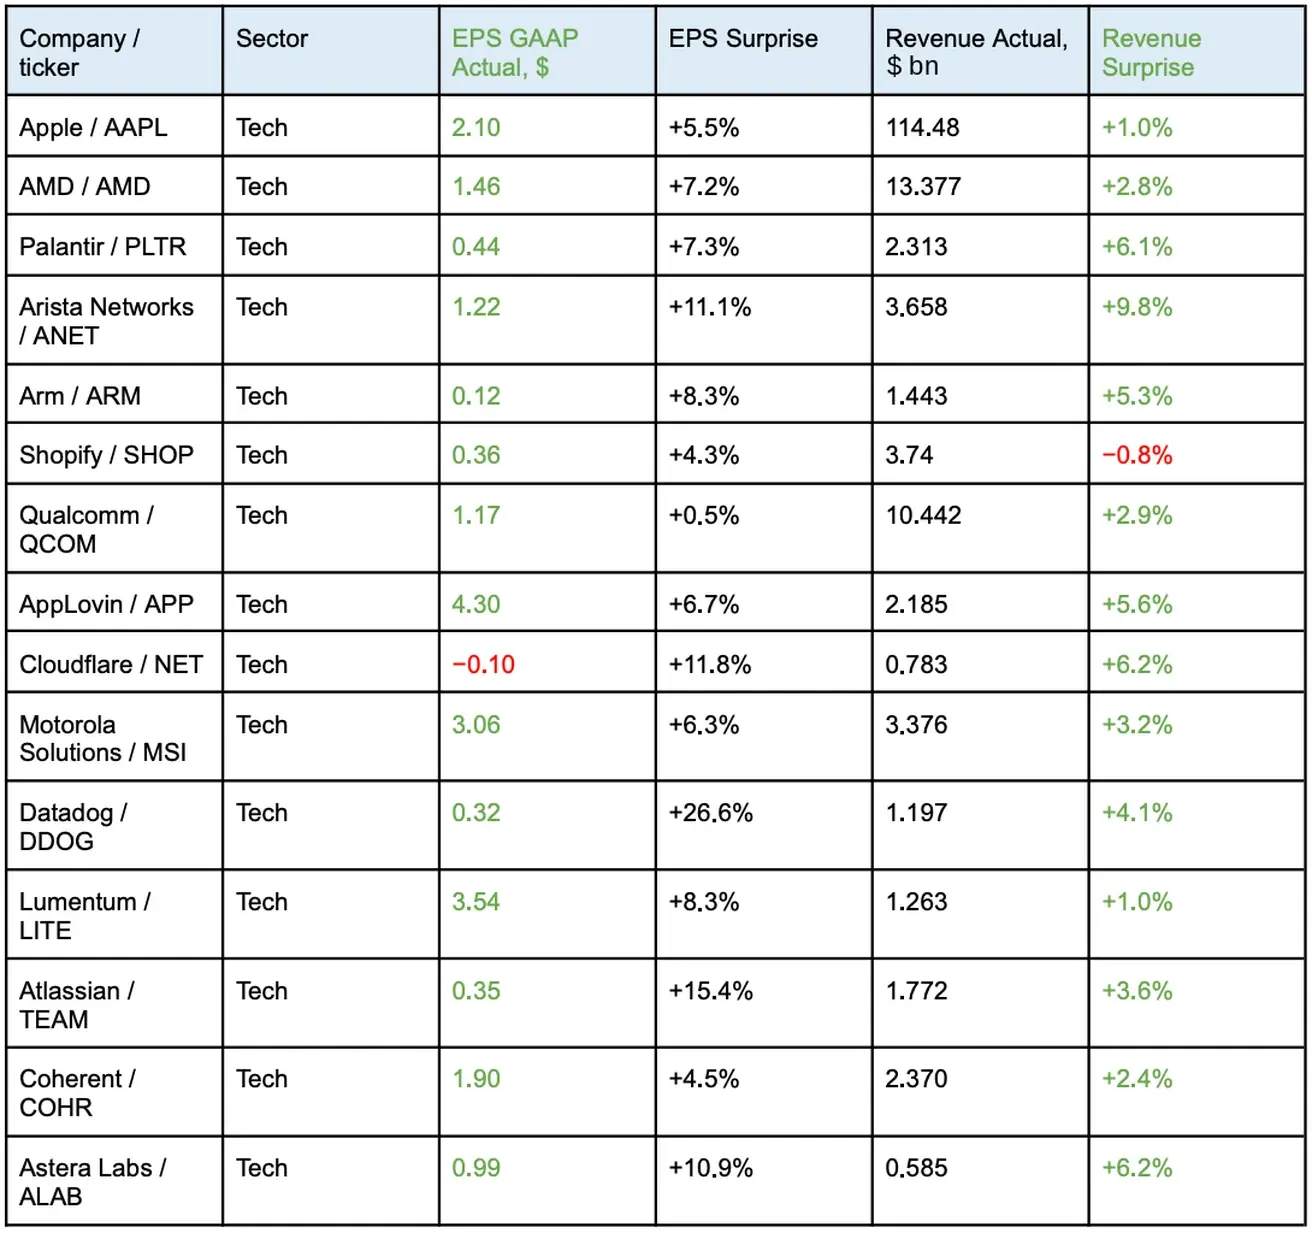
Earnings of the 15 Largest Tech Companies, November 2–6, 2026
Commentary:
The dynamics are positive. During the week of November 2–6, the U.S. tech sector delivered largely strong financial results: most companies in the sample beat analysts’ earnings and revenue forecasts. Datadog, Atlassian, Cloudflare and Arista Networks posted especially notable adjusted earnings beats. Reports from AMD, Palantir and networking equipment makers point to continued strong demand for AI solutions and cloud infrastructure. Overall, the earnings look very positive.
However, on November 5, after the U.S. midterm congressional elections, U.S. tech stocks fell amid investor concerns over the Democratic victory. Nevertheless, most tech giants' financial performance is very good.
Company Guidance:
Overall, guidance is positive: most executives expect revenue growth, strong demand or further business expansion, especially in AI and cloud infrastructure, but four companies have specific weak spots or headwinds:
- Apple expects revenue growth but warns of margin pressure due to rising memory prices and the costs of new Siri features.
- Shopify forecasts slower gross profit growth than revenue growth.
- Arm notes that royalties grew more slowly than licensing revenue and came in below management’s expectations.
- Atlassian expects lower revenue from its Data Center business, although its cloud segment continues to grow.
None of the companies expect lower earnings next quarter.
Company Comments on the Congressional Elections:
After the U.S. congressional elections, none of the companies announced changes to their guidance specifically because of the election results. Only three companies made comments in interviews on November 4 and 5.
AMD — AMD CEO Lisa Su called the election results a reason for the industry to explain the benefits of data centers more clearly to local residents. In her words, everyone should benefit from AI, including the communities where the infrastructure is being built.
Arm — Arm CEO Rene Haas acknowledged that political changes could affect where and how data centers are built in the U.S. in the short term. In his view, if some states find it harder to attract projects, others may take them on. He also warned that if the U.S. slows construction, other countries will develop this infrastructure. He does not consider the long-term threat to Arm significant.
Qualcomm — Qualcomm CEO Cristiano Amon said that concerns about the pace of data center construction do not pose the same threat to the company as to manufacturers that are more dependent on that market: data centers are only one part of Qualcomm’s business. He added that demand for computing remains, although possible construction locations (by state) are shifting, and the pace of expansion is currently also constrained by the availability of equipment and power.
Eurozone
- ECB — the rhetoric is moderately hawkish, but there is no signal that aggressive rate hikes are needed. The ECB acknowledges inflation risks while taking into account the cooling effect of already tighter financial conditions;
- Against the backdrop of the conflict in the Middle East, the ECB revised its GDP forecasts downward and raised its inflation projections for the coming years.
ECB officials’ rhetoric:
Isabel Schnabel (November 5): The main message is that the world has become less predictable and inflation shocks may recur more often, so the ECB must remain flexible and not rely on a single instrument or a single scenario. Schnabel separately highlighted the risks of fiscal and financial pressure on central banks and the need to preserve independence and the ability to respond quickly to new shocks. The rhetoric remains rather hawkish/cautious.
Macroeconomic Data
Interest Rates
- Deposit Facility Rate: 2.50% (previous: 2.50%);
- Marginal Lending Facility Rate: 2.9% (previous: 2.9%) — the rate at which banks can obtain overnight funding from the central bank;
- Main Refinancing Rate (Policy Rate): 2.65% (previous: 2.65%).
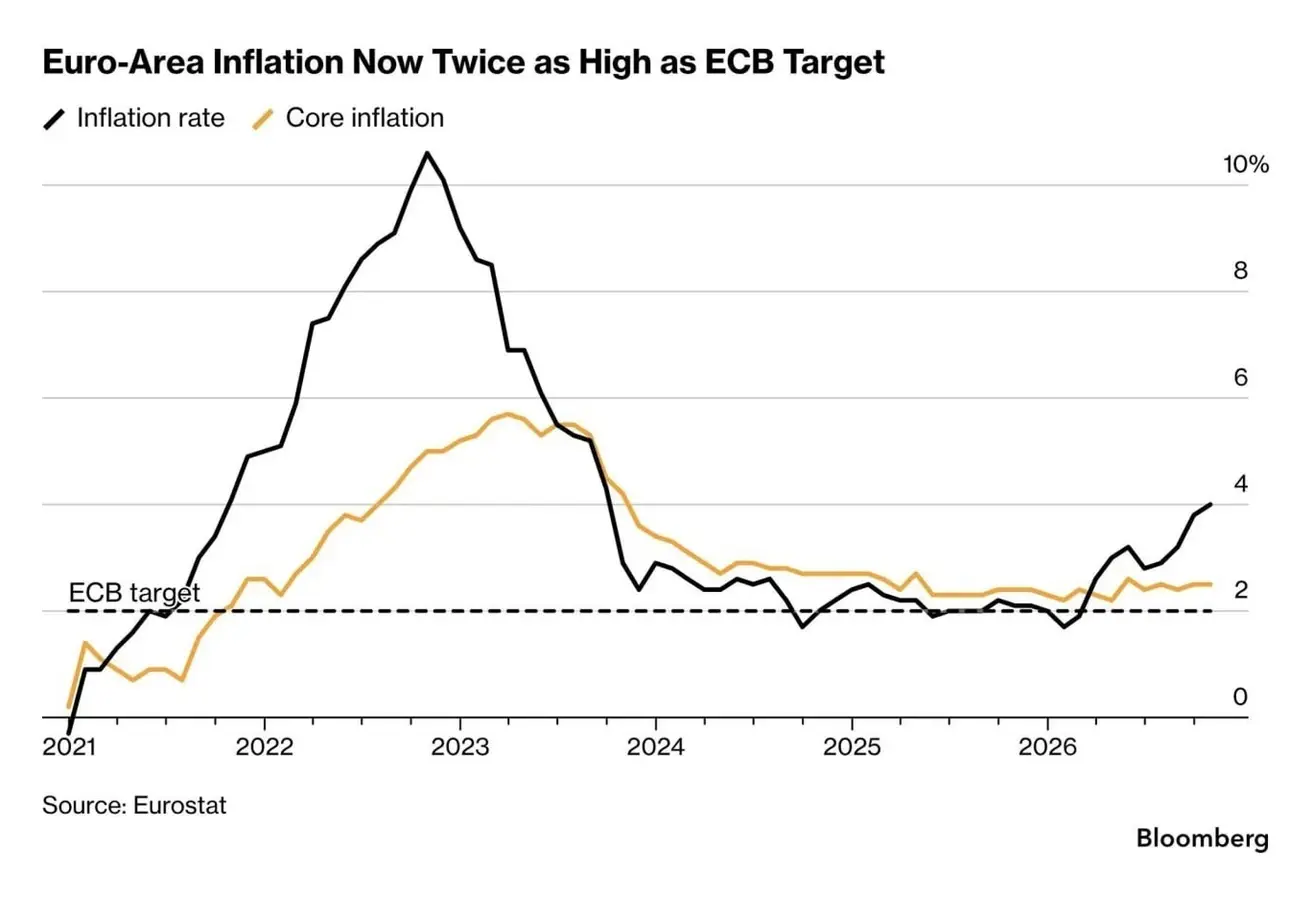
Inflation: Consumer Price Index (CPI) (October, flash estimate)
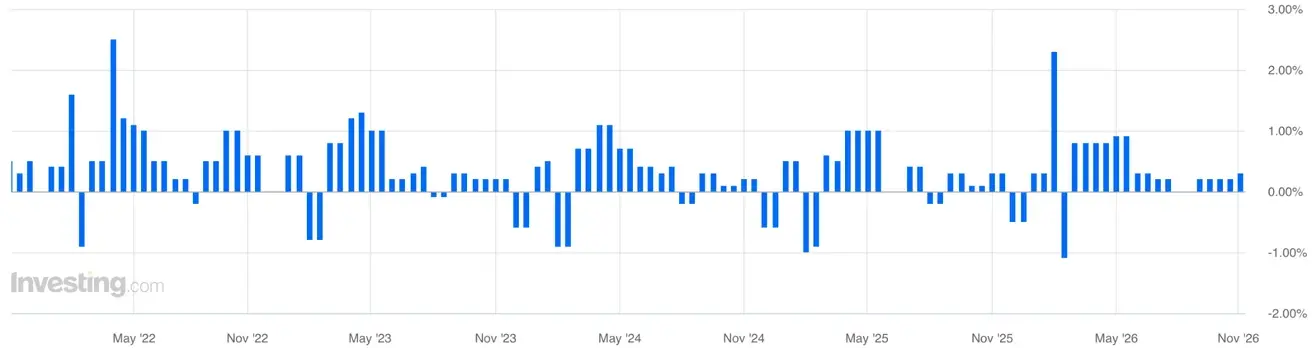
- Core CPI (MoM): 0.3% (previous: 0.2%):
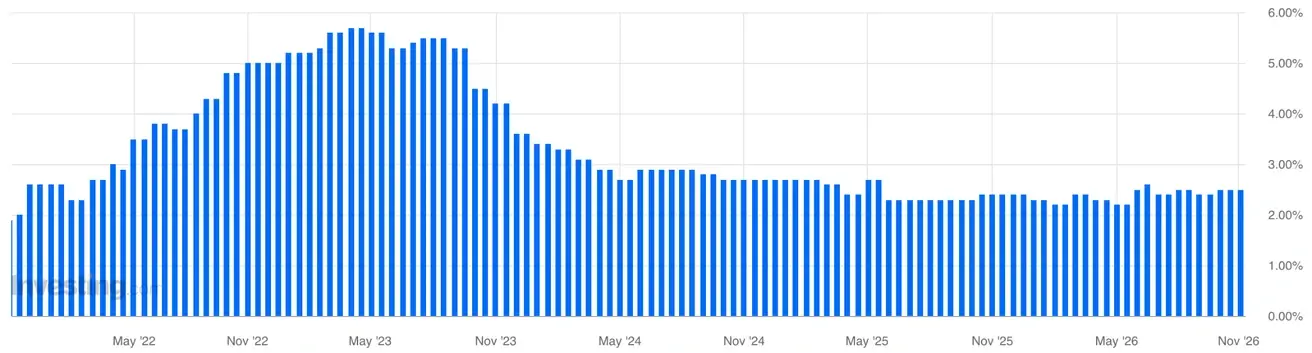
- Core CPI (YoY): 2.5% (previous: 2.5%):
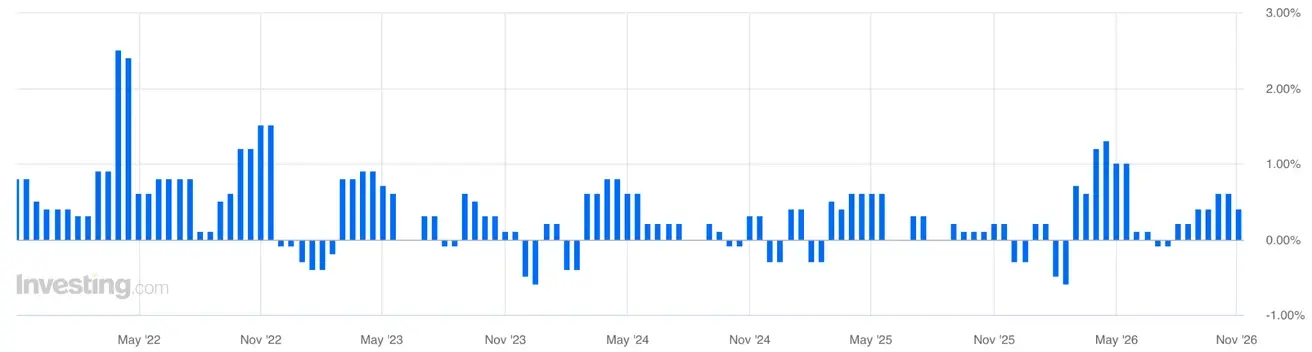
- Headline CPI: 0.4% (MoM) (previous: 0.6%);
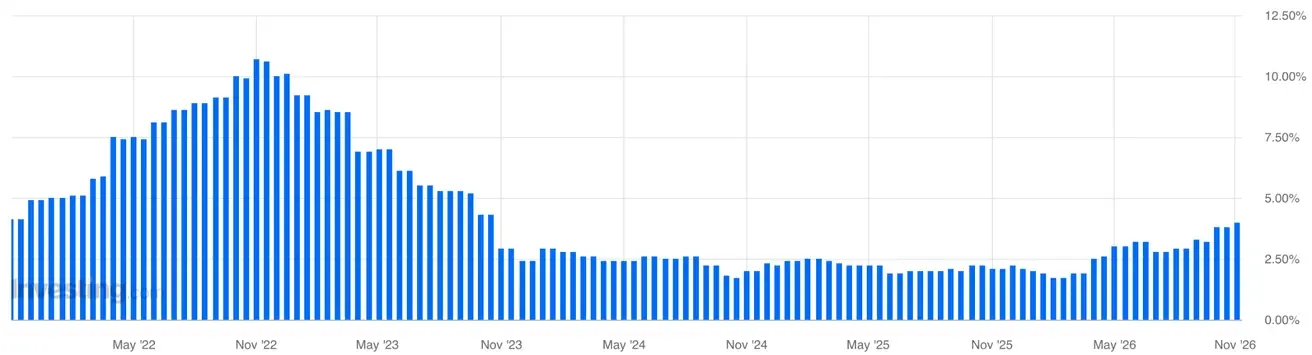
- CPI: 4.0% (YoY) (previous: 3.8%).
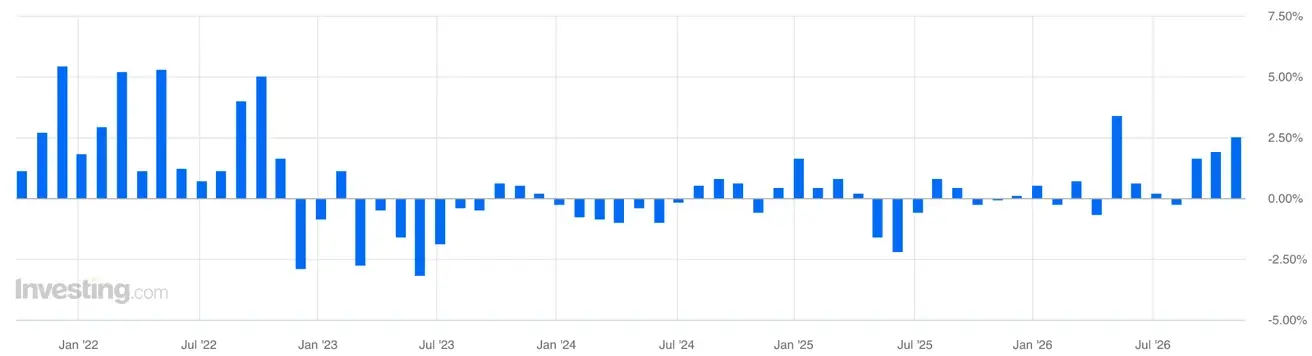
Producer Price Index (PPI) (October)
- MoM: 2.5% (previous: 2.0%):
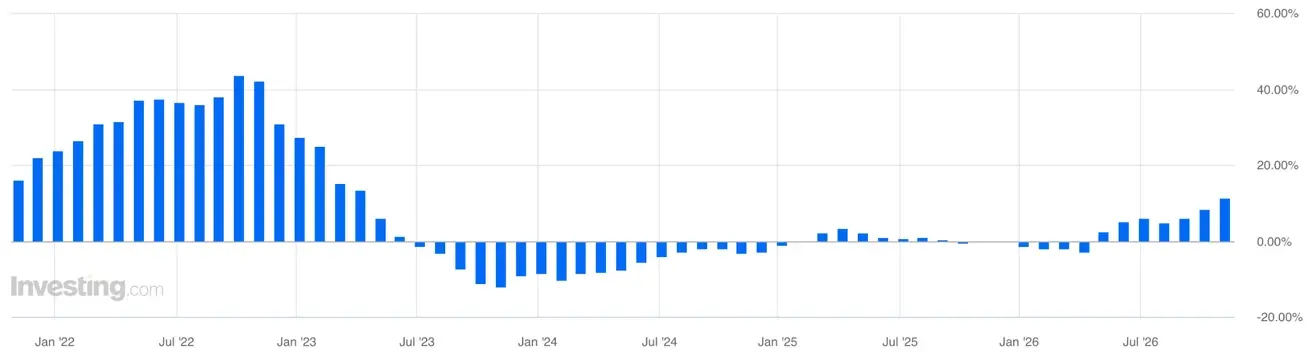
- YoY: 11.1% (previous: 8.3%):
GDP Q2 2026 (preliminary estimate)
- QoQ: 0.4% (previous: 0.6%);
- YoY: 1.3% (previous: 0.5%).
Trade balance (USD) (YoY): -16.1 bn (previous: 10.7 bn);
Industrial production (September): (MoM) -0.5% (previous: -0.3%, revised):
Unemployment Rate (August): 6.5% (previous: 6.4%).
Eurozone Consumer Confidence Index: -17.9 (previous: -16.8)
Purchasing Managers’ Index (PMI) (September)
- Services PMI: 51.4 (previous: 53.0, revised);
- Manufacturing PMI: 52.7 (previous: 52.9);
- S&P Global Composite PMI: 51.7 (previous: 52.9).
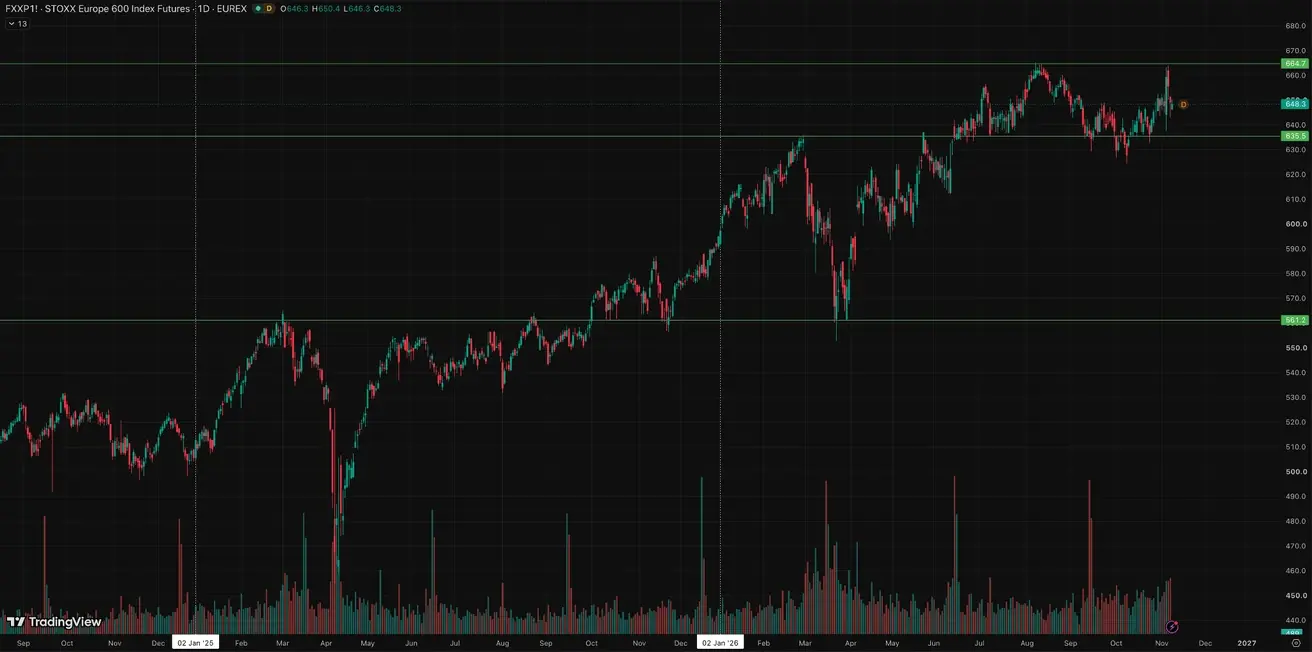
Euro Stoxx 600 (FXXP1!)
Weekly performance: +0,20% (week-end close: 649,1); year-to-date: +9,28%.
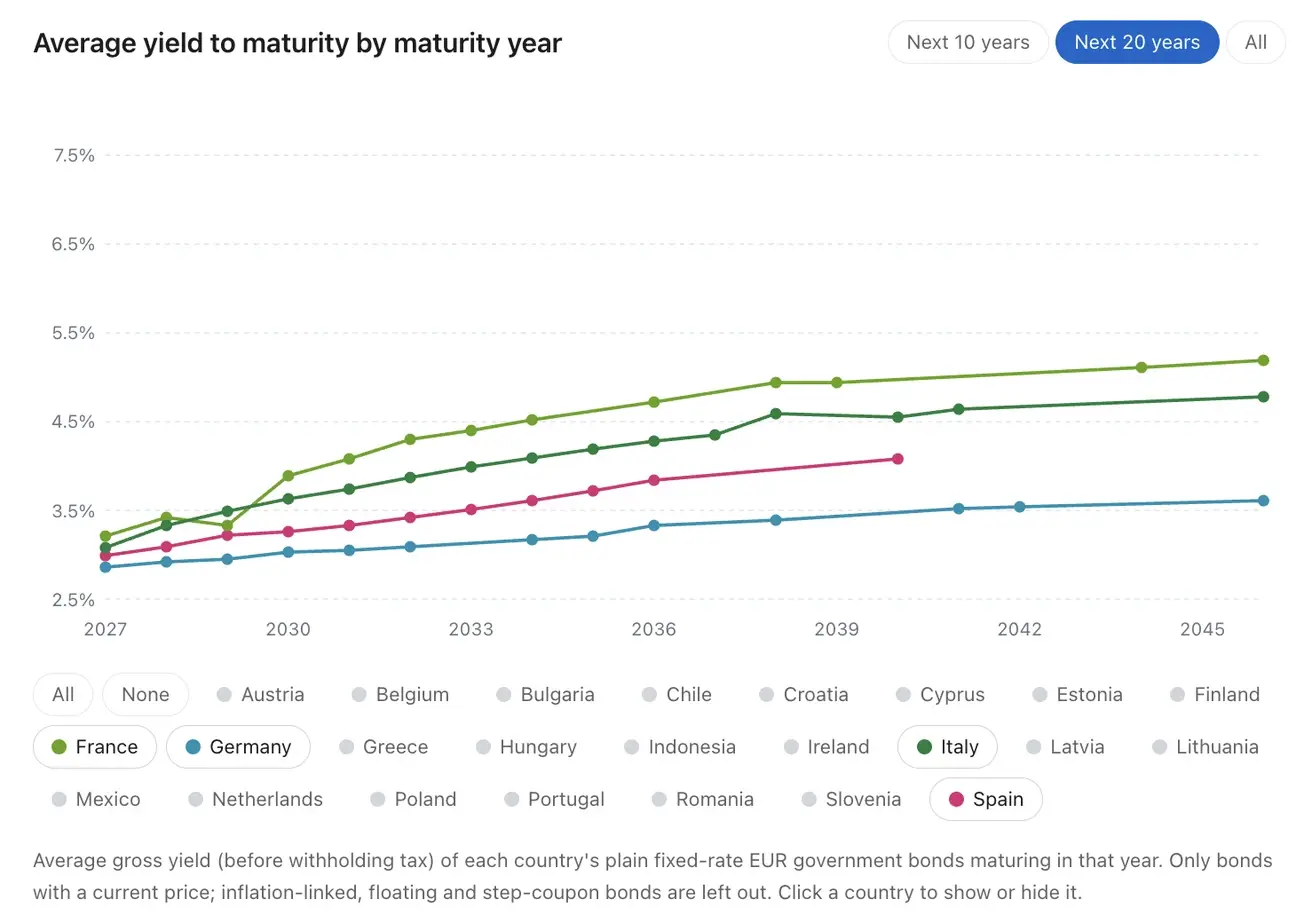
Fitch Ratings made an unscheduled revision of France’s rating outlook to negative, affirming the rating at A+. The agency cites weak growth, high borrowing costs and a deteriorating fiscal trajectory: debt could rise to ~124% of GDP by 2028, and stabilizing it would require a fiscal adjustment of about 3.5% of GDP.
The eurozone yield curve indicates that fiscal risk is already becoming a persistent part of the European risk premium.
Government bond yields by country:
China
China’s economy continues to stabilize, supported by strong exports, while domestic demand and investment gradually recover. Policymakers remain measured and targeted in their stimulus approach.
- Interest rates remain unchanged;
- Monetary policy remains accommodative;
- China reaffirmed its commitment to fiscal support for economic growth under its 2026 plan, including measures to stimulate domestic demand, optimize tax incentives and subsidies, and modernize industrial capacity.
Macroeconomic Data
Interest Rates
- 1-Year Loan Prime Rate (medium-term lending): 3.00%;
- 5-Year Loan Prime Rate (benchmark for mortgage lending): 3.50%.
Inflation Indicators (September)
- Consumer Price Index (CPI): 0.2% MoM (previous: 0.4%)
- Consumer Price Index (CPI): 0.9% YoY (previous: 0.8%)
- Producer Price Index (PPI): 5.0% YoY (previous: 3.8%).
Trade Data (September)
Trade balance (USD) (YoY): $133.53 bn (previous: $119.9 bn);
Imports: 31.0% YoY (previous: 28.2%);
Exports: 36.3% YoY (previous: 25.0%);
GDP (Q3 2026)
- QoQ: 1.2% (previous: 0.9%);
- YoY: 4.5% (previous: 4.3%).
Labor Market
- Unemployment Rate (September): 5.2% (previous: 5.3%).
Industrial Activity
- Industrial Production (September, YoY): 5.5% (previous: 5.2%).
Fixed Asset Investment
- September, YoY: -7.2% (previous: -6.7%).
Retail Sales
- September, YoY: 1.1% (previous: 0.4%):
Purchasing Managers’ Indices (PMI) (October)
- Manufacturing PMI: 49.3 (previous: 50.1);
- Non-Manufacturing PMI: 49.7 (previous: 50.2);
- Composite PMI: 49.7 (previous: 50.7).
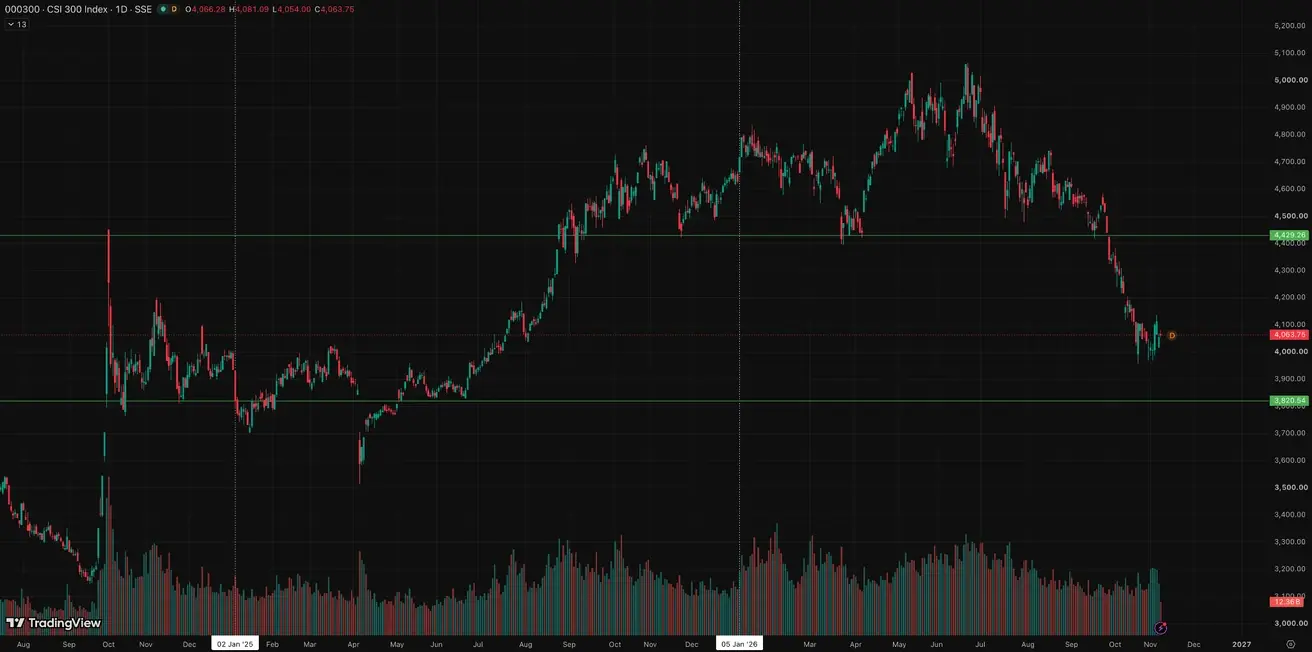
CSI 300 Index (000300.HK)
Weekly performance: +1,73% (week-end close: 4054,28); year-to-date: -13,03%.
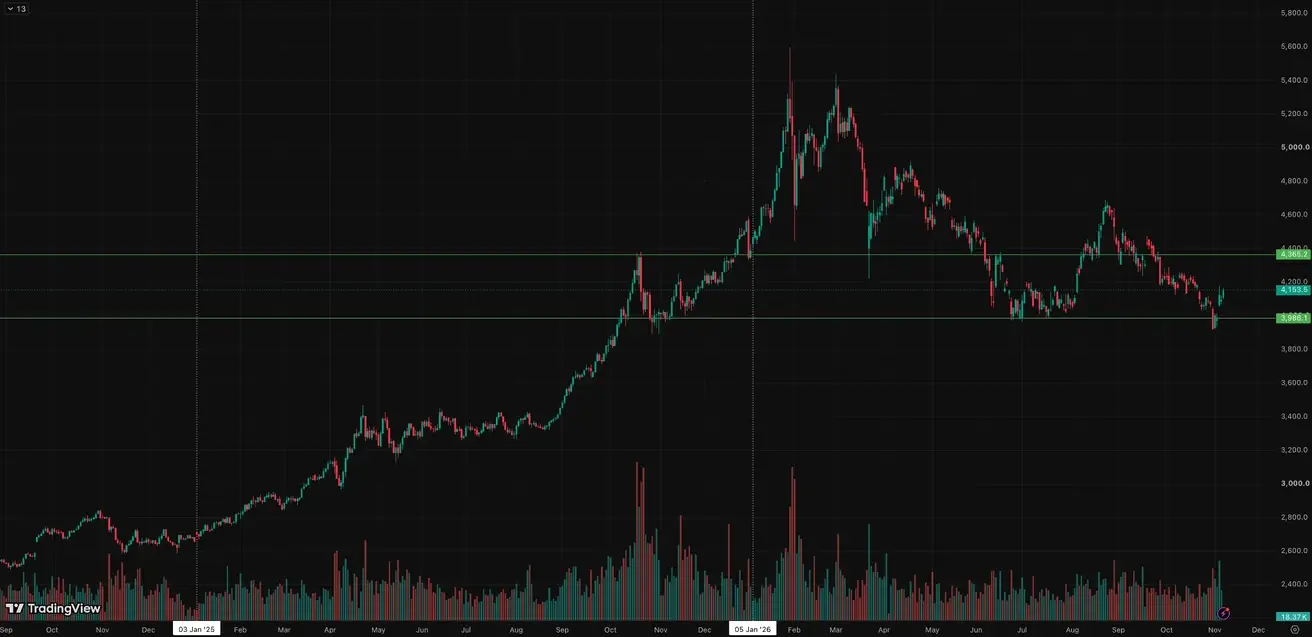
Gold Futures (GC)
Weekly performance: +4,09% (week close: $4094,4 per troy oz); year-to-date: -5,49%
This is a strong signal of safe-haven demand specifically. Amid the equity sell-off, political uncertainty following the midterm elections, and increased demand for safe-haven assets, gold is once again acting as a hedge.
In the third quarter, central banks bought 321 tonnes of gold. China (+63 tonnes) and Poland (+41 tonnes) led purchases. Year-to-date, central bank gold purchases have reached 675 tonnes.
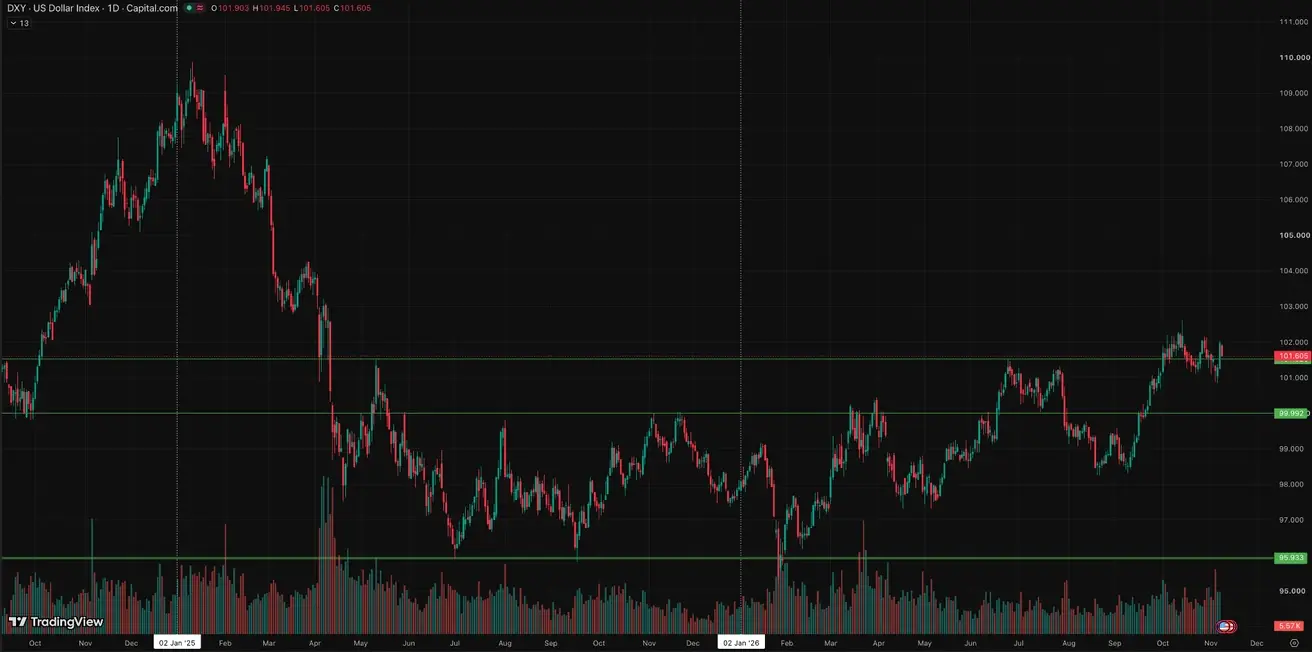
Dollar Index Futures (DX)
Weekly performance: +0,32% (week close: 101,964); year-to-date: +4,05%.
Like gold, the dollar may now be attracting safe-haven demand during a period of uncertainty.
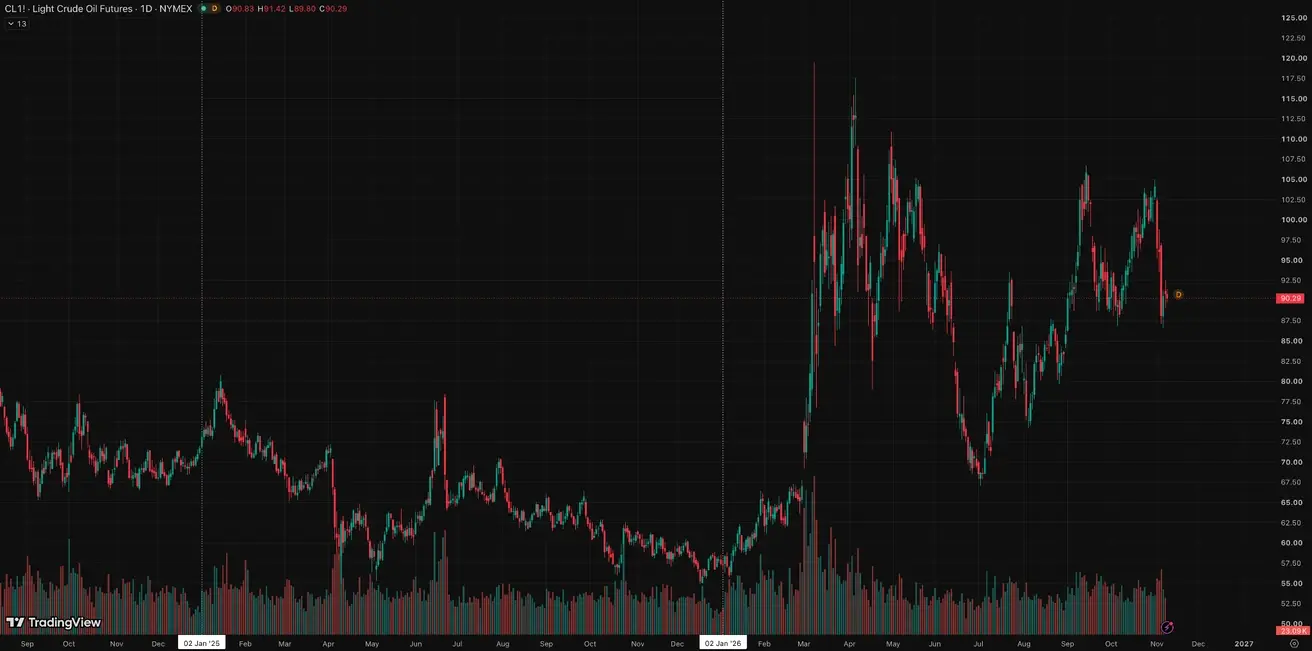
Oil Futures
Weekly performance: -12,76% (week close: $90,83 per barrel); year-to-date: +58,21%
The sharp drop in oil prices signals disinflation. The market has begun to remove part of the geopolitical premium, especially after Democratic Senator Chuck Schumer said: “We will end the war with Iran.”
This is positive for the inflation outlook: if oil holds at lower levels, CPI pressure should ease in the coming months.
According to Bloomberg (November 2), Iranian President Masoud Pezeshkian said that Supreme Leader Mojtaba Khamenei had granted the government certain powers to continue peace talks. The specific scope of these powers was not disclosed.
Crypto Market
The regulatory backdrop for the crypto market has worsened: the likelihood of the CLARITY Act passing in its current form has dropped sharply.
The future agenda is shifting toward stricter oversight, investor protection, and control over DeFi and conflicts of interest. This raises the political risk premium for crypto assets, although support for certain elements of crypto regulation remains within the Democratic Party.
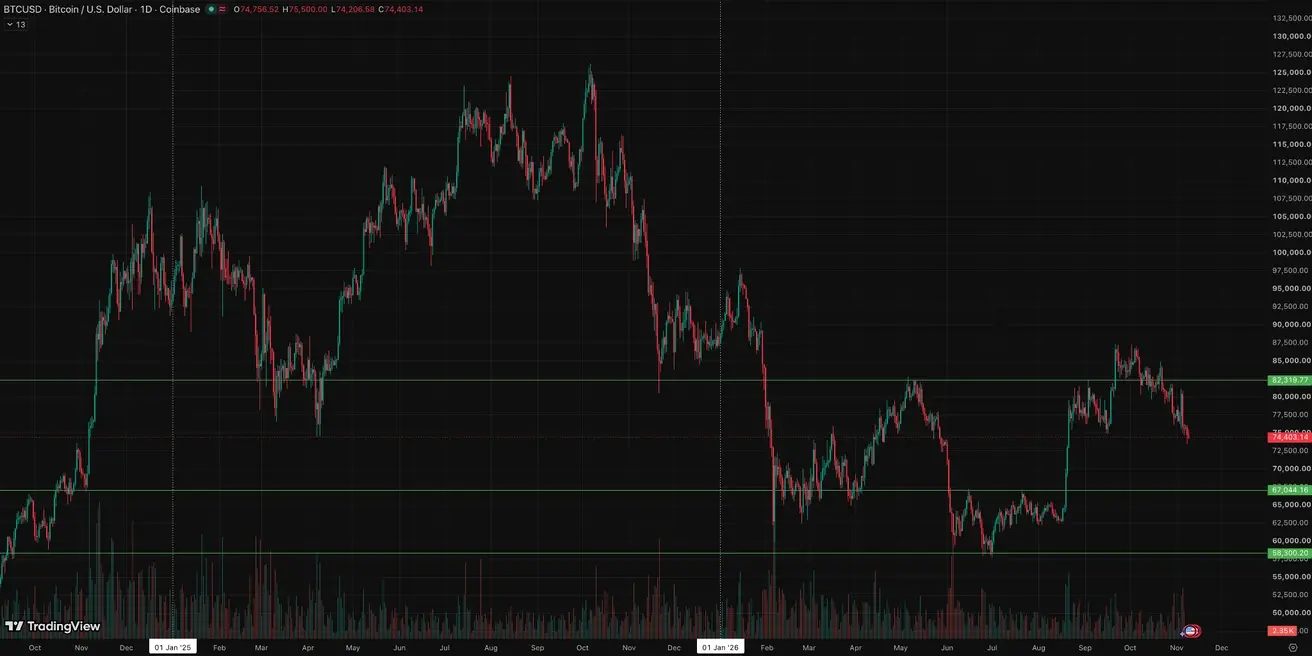
BTC Futures
Weekly performance: -4,44% (week close: $74,754.08); year-to-date: -14,78%.
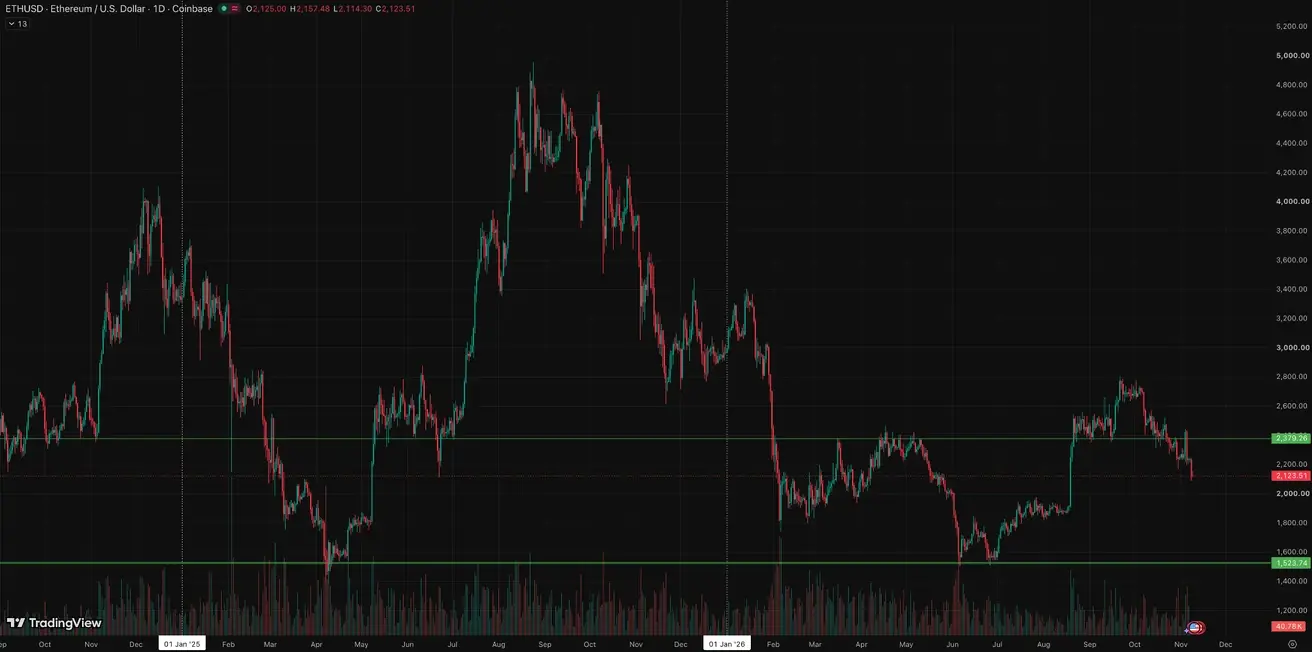
ETH Futures
Weekly performance: -6,47% (week close: $2125,32); year-to-date: -28,53%.
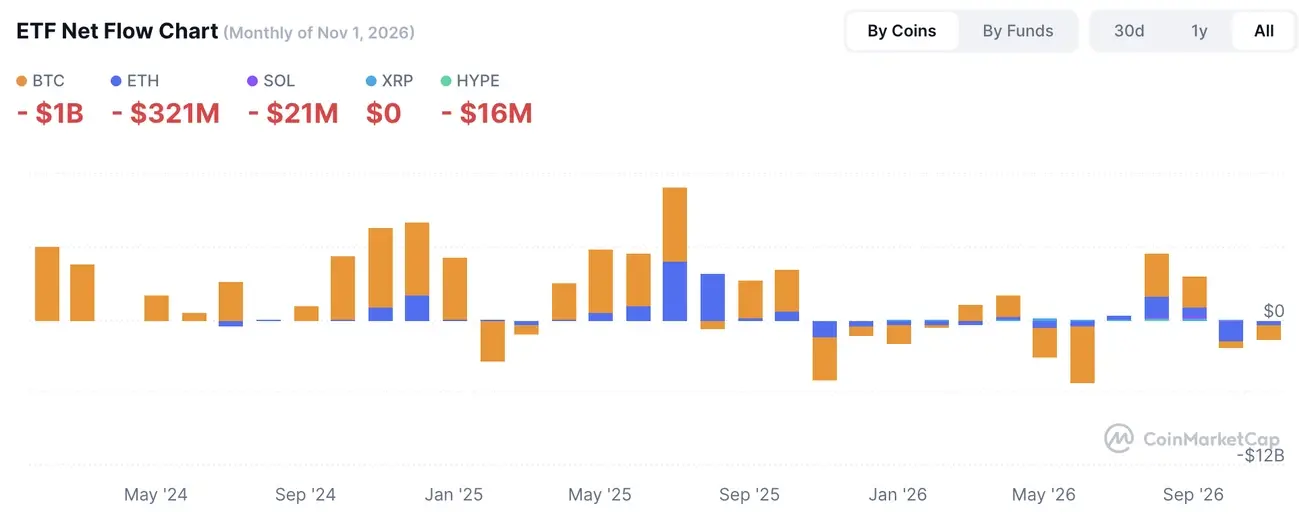
ETF Net Flows