Русский
 Қазақша
 Eesti
October 26 – November 1, 2026: Weekly economic update
Key market updates

Key Takeaways:
- The policy rate was raised to a range of 3.75 - 4.00%; rhetoric is hawkish;
- Monetary policy remains moderately restrictive;
- U.S. macroeconomic data continue to support a soft-landing scenario: inflation risks are increasing, the labor market is cooling without signs of recession, and current conditions do not yet warrant a rate cut.
- The Fed slightly improved its GDP and employment forecasts and raised its near-term inflation forecasts.
Inflation: Consumer Price Index (September)
- Core CPI (MoM): 0.3% (previous: 0.3%).
- Core CPI (YoY): 2.6% (previous: 2.4%).
- CPI (MoM): 0.6% (previous: 0.4%).
- CPI (YoY): 3.7% (previous: 3.4%).
Producer Price Index (September)
- PPI (MoM): 1.3% (previous: 0.4%).
- Core PPI (MoM): 0.7% (previous: 0.3%).
Inflation Expectations (Michigan) (September)
- 12-month Inflation Expectations: 4.7% (previous: 4.6%).
- 5-Year Inflation Expectations: 3.5% (previous: 3.4%).
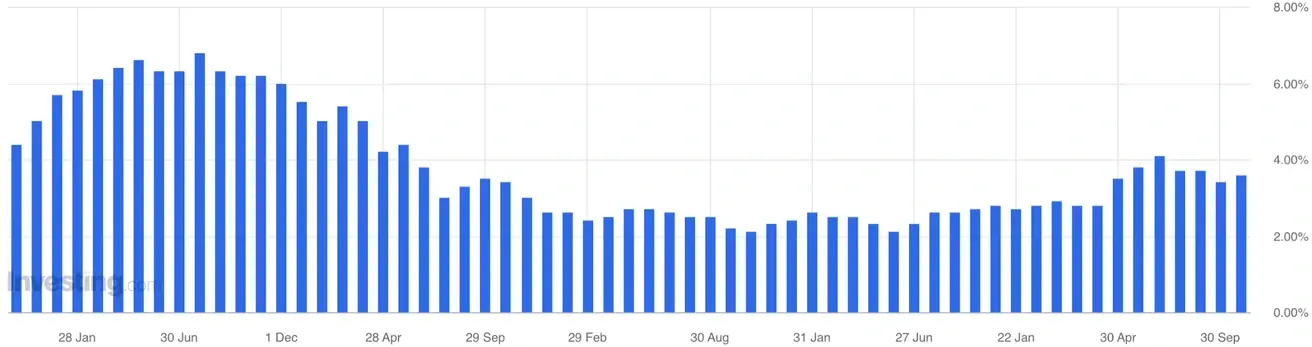
The Fed’s inflation benchmark:
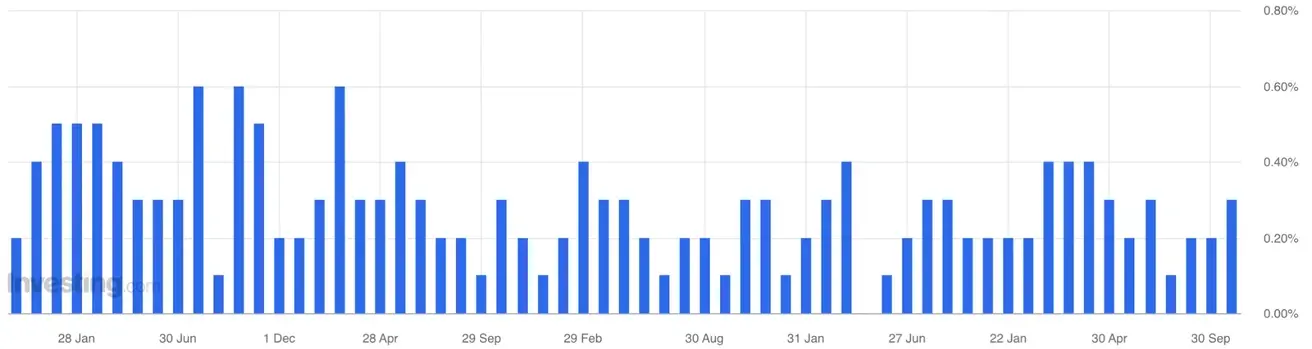
Core PCE Price Index (September): MoM: 0.3% (previous: 0.2%):
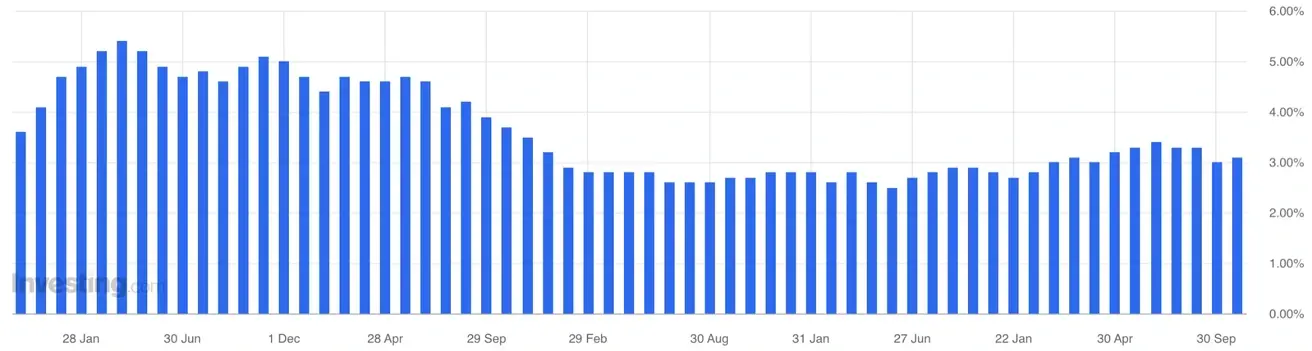
YoY: 3.1% (previous: 3.0%):
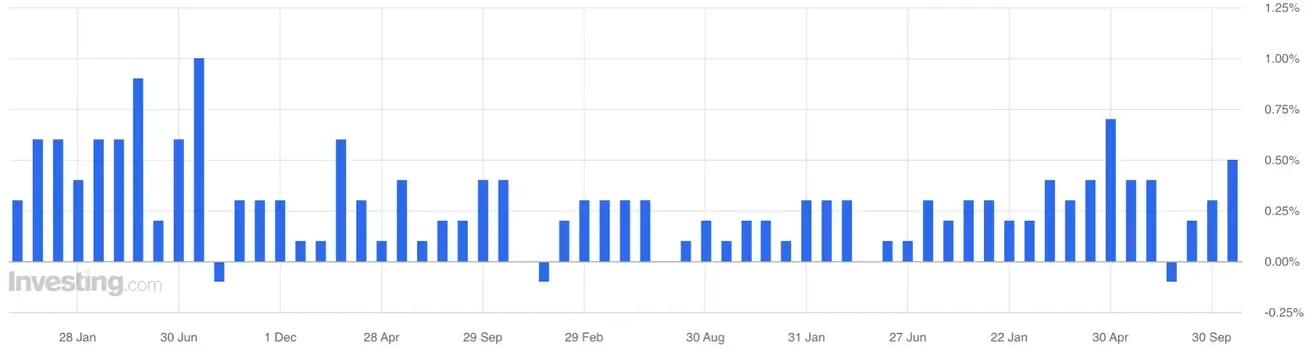
Headline PCE Price Index (September): MoM: 0.5% (previous: 0.3%):
YoY: 3.6% (previous: 3.4%):
U.S. GDP Deflator (QoQ): 2.2% (previous: 6.1%)
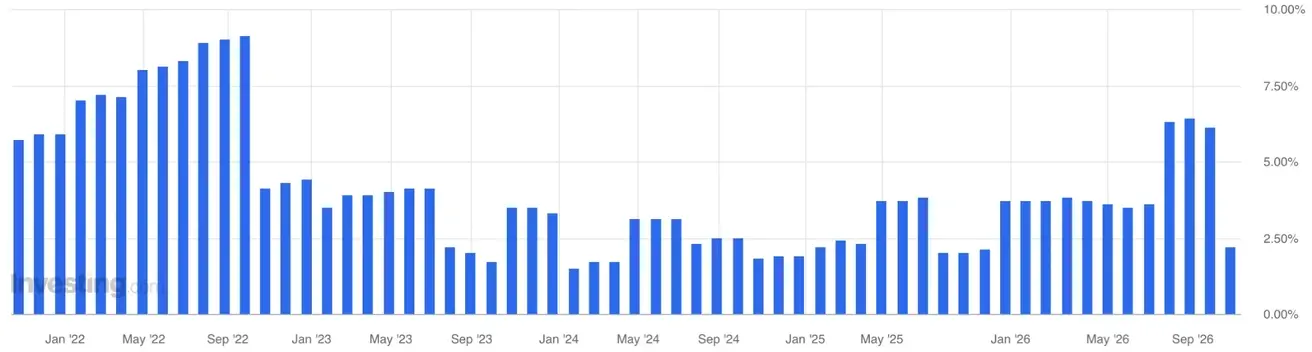
* The GDP deflator reflects price changes across all final goods and services produced domestically, not just consumer spending. Its slowdown is therefore a positive signal; however, the acceleration in PCE and Core PCE in September shows that inflationary pressure in the consumer sector persists.
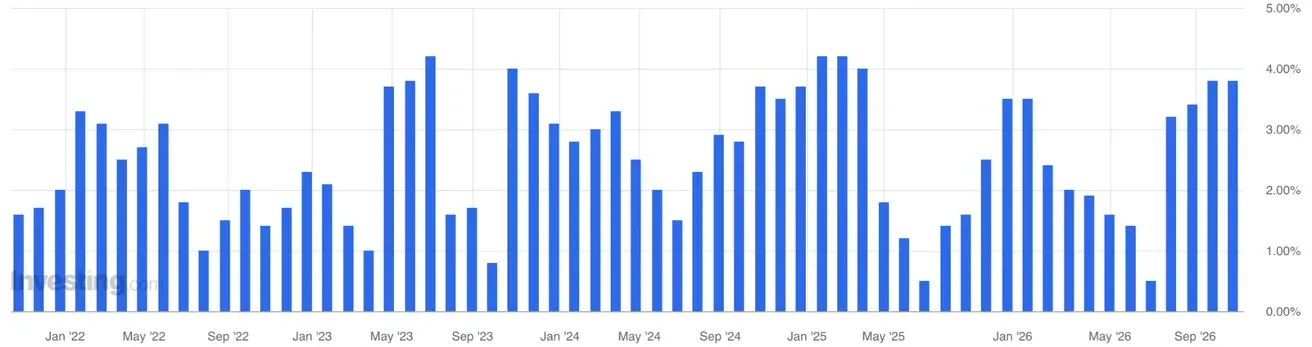
Real Consumer Spending, Q3 2026: 3.8% (previous: 3.8%)
GDP (U.S. Bureau of Economic Analysis, BEA) — Q3 2026 (QoQ), advance estimate: 3.4% (Q2 2026: 2.2%):
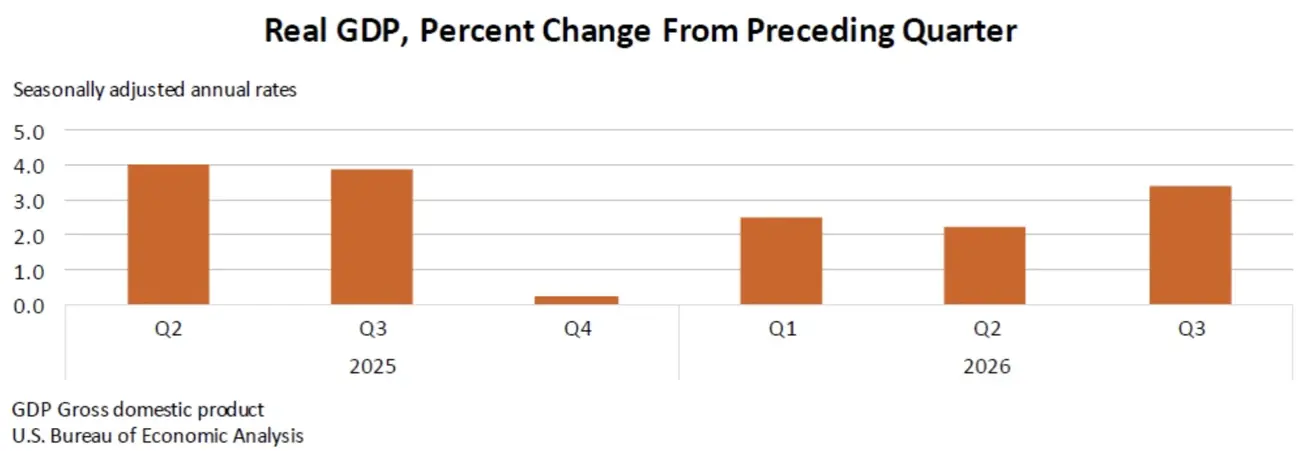
Compared with the second quarter, the acceleration in real GDP growth in the third quarter mainly reflected faster investment growth and higher government spending, partly offset by a decline in exports. Imports rose more in the third quarter than in the second.
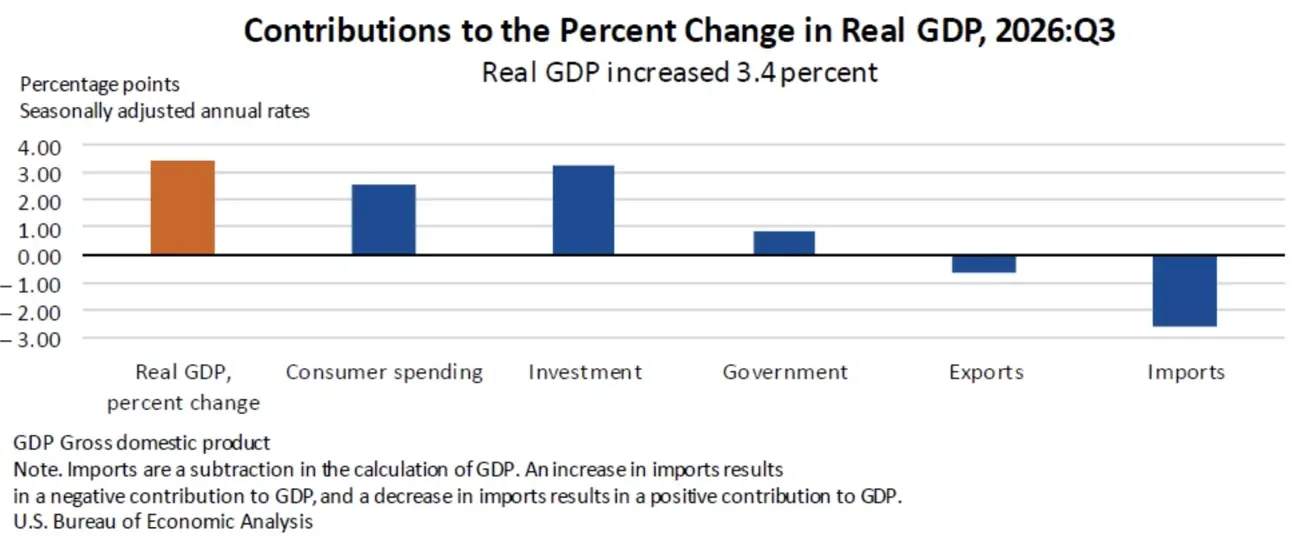
GDPNow (the Atlanta Fed’s real-time estimate of official GDP growth ahead of release (Q3 2026)): 3.4% (previous: 3.6%).
Business Activity Index (PMI) (October)
(Above 50 indicates expansion; below 50 indicates contraction)
- Services PMI: 57.9 (previous: 58.8)
- Manufacturing PMI: 56.0 (previous: 55.9)
- Composite PMI: 57.6 (previous: 58.4)
Labor Market (BLS) (September/October)
- Unemployment rate: 4.2% (previous: 4.1%);
- Total number of people receiving unemployment benefits in the U.S.: 1,701K (previous: 1,728K);
- Initial jobless claims: 194K (previous: 194K) — no signs of mass layoffs;
- Change in nonfarm payrolls: 29K (previous: 133K, revised) — a significant slowdown in hiring;
- Change in private nonfarm payrolls: 46K (previous: 89K, revised) — a significant slowdown in hiring;
- Average hourly earnings (YoY): 3.0% (previous: 3.1%) — a slowdown, which is positive in terms of inflationary pressure;
- JOLTS job openings: 7.271M (prev: 6.866M).
Monetary Policy
Macroeconomic indicators are consistent with Kevin Warsh’s rhetoric: economic activity and the labor market remain resilient, productivity is rising, and business investment is high.
FOMC meeting in brief — rates were left unchanged; the rhetoric on meeting the inflation target remains uncompromising, but actual policy actions do not yet reflect it:
- According to Warsh, the inputs have not changed since the previous meeting, yet the rate is on hold;
- A shift in rhetoric: strong business activity is not, in itself, a reason for the Fed to raise rates.
Likely scenarios:
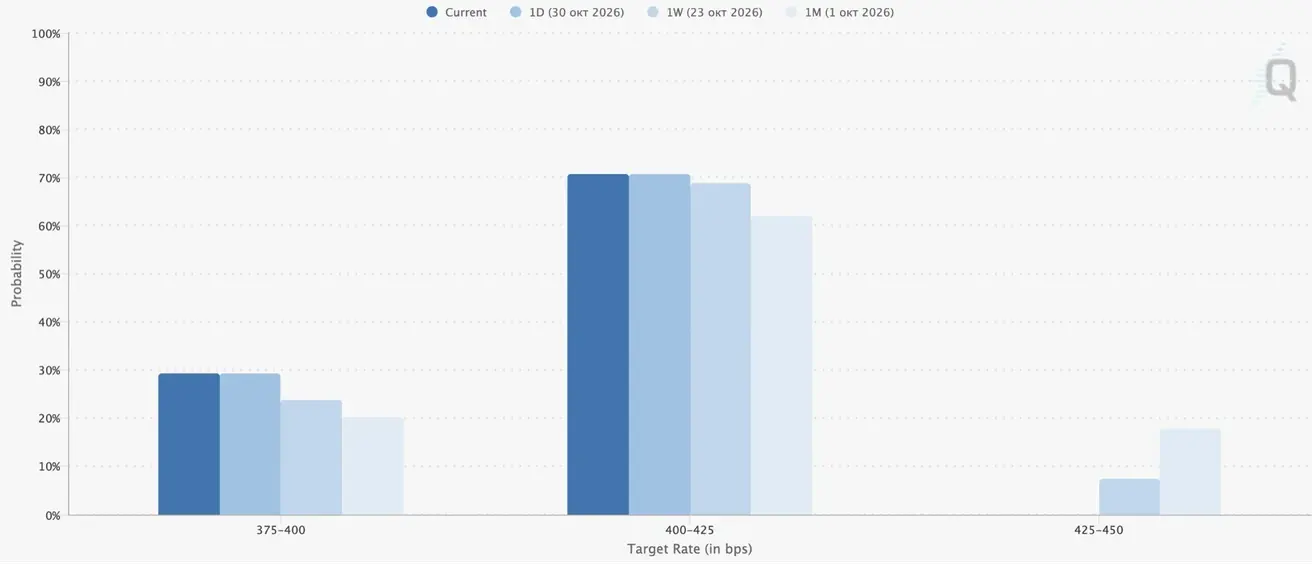
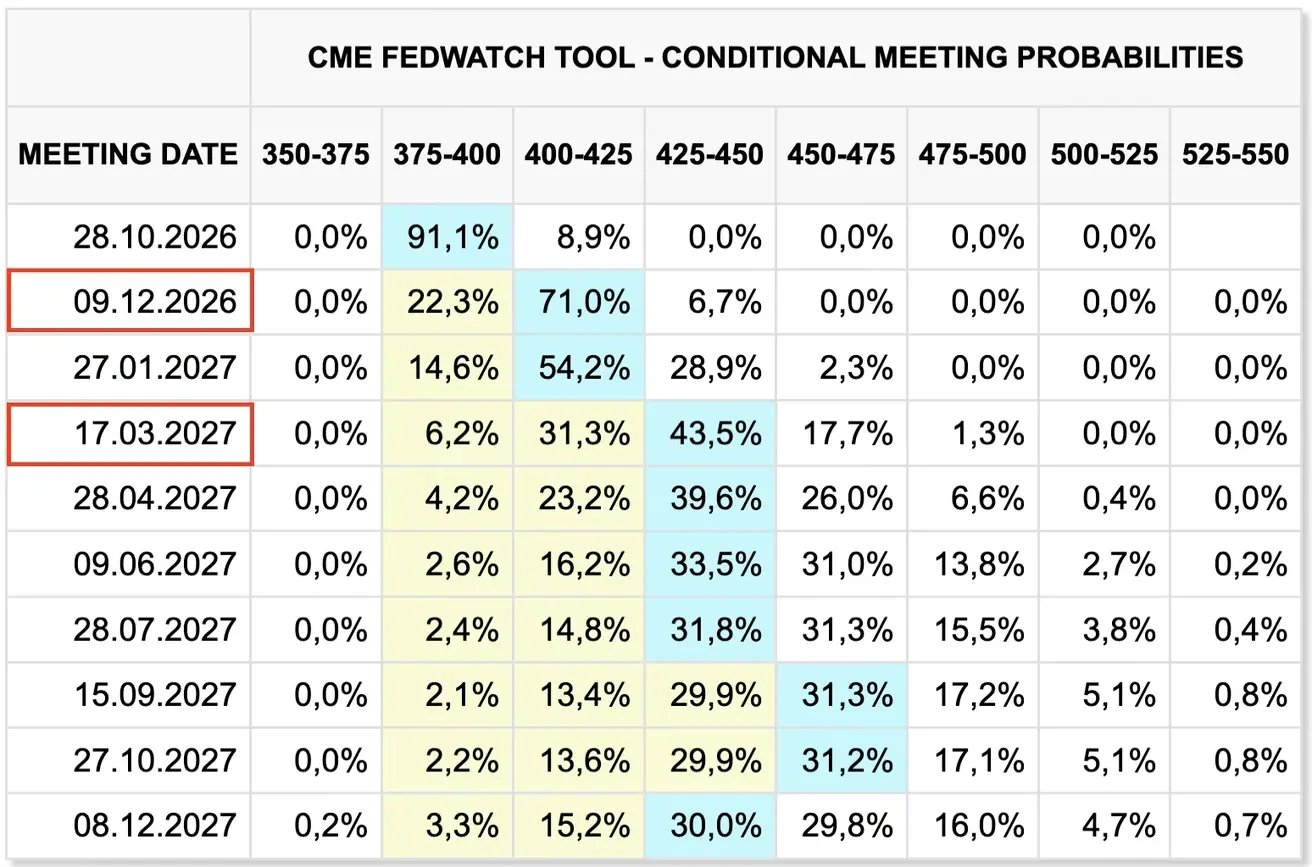
A rate cut is not on the table for now. If inflationary pressure intensifies, the rate will be raised — currently the most likely scenario based on market expectations for the next meeting on December 9. The market is pricing in a 70% probability of a Fed hike, and not without reason: the Fed’s inflation benchmark (the PCE Price Index) rose after three months of decline. Accordingly, inflation data will remain in the market’s focus.
At the same time, expectations of a hold have risen somewhat, to almost 30%. Over the next 12 months, the market expects two 0.25% hikes, in December and in April 2027.
Judging by Warsh’s remarks, the Fed can be expected to do its utmost to avoid a sharp tightening of monetary policy while maintaining its hawkish rhetoric.
The market reaction to the FOMC meeting was moderately positive in FedWatch expectations and the bond market, and neutral in stock index performance.
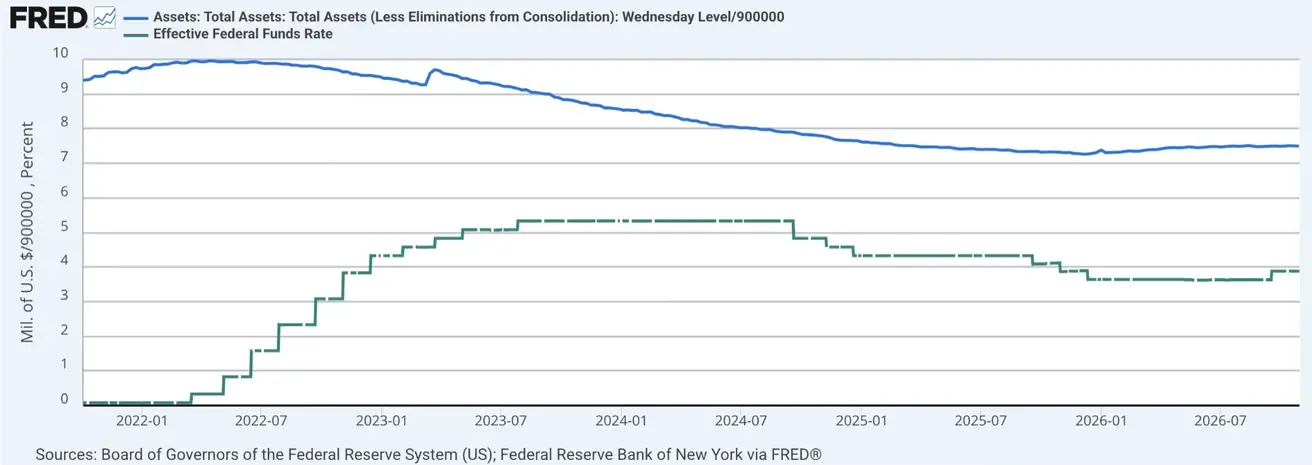
Federal funds rate (EFFR): 3.75%–4.00%
Federal Reserve balance sheet: $6.745 trillion, +3.21% since the end of QT ($6.535 trillion):
Market Forecast for Rate (FedWatch)
For the next FOMC meeting (December 9), a rate hike remains the more likely outcome: the probability of a 0.25% hike stands at 70.74% (a week earlier: 68.86%):
Over the next 12 months: two 0.25% rate hikes, bringing the rate to a range of 4.25–4.50%, with the first hike at the next meeting:
Today:
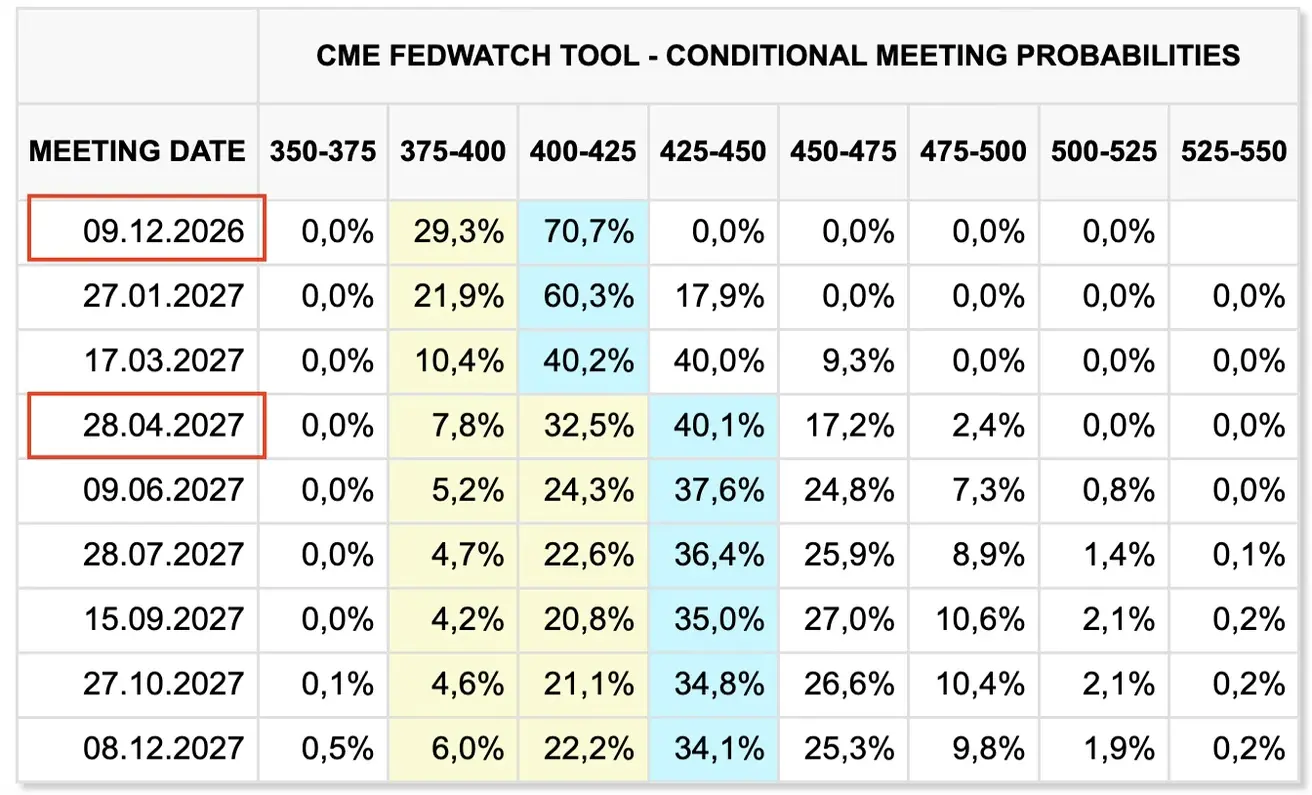
A week earlier:
Bond Market
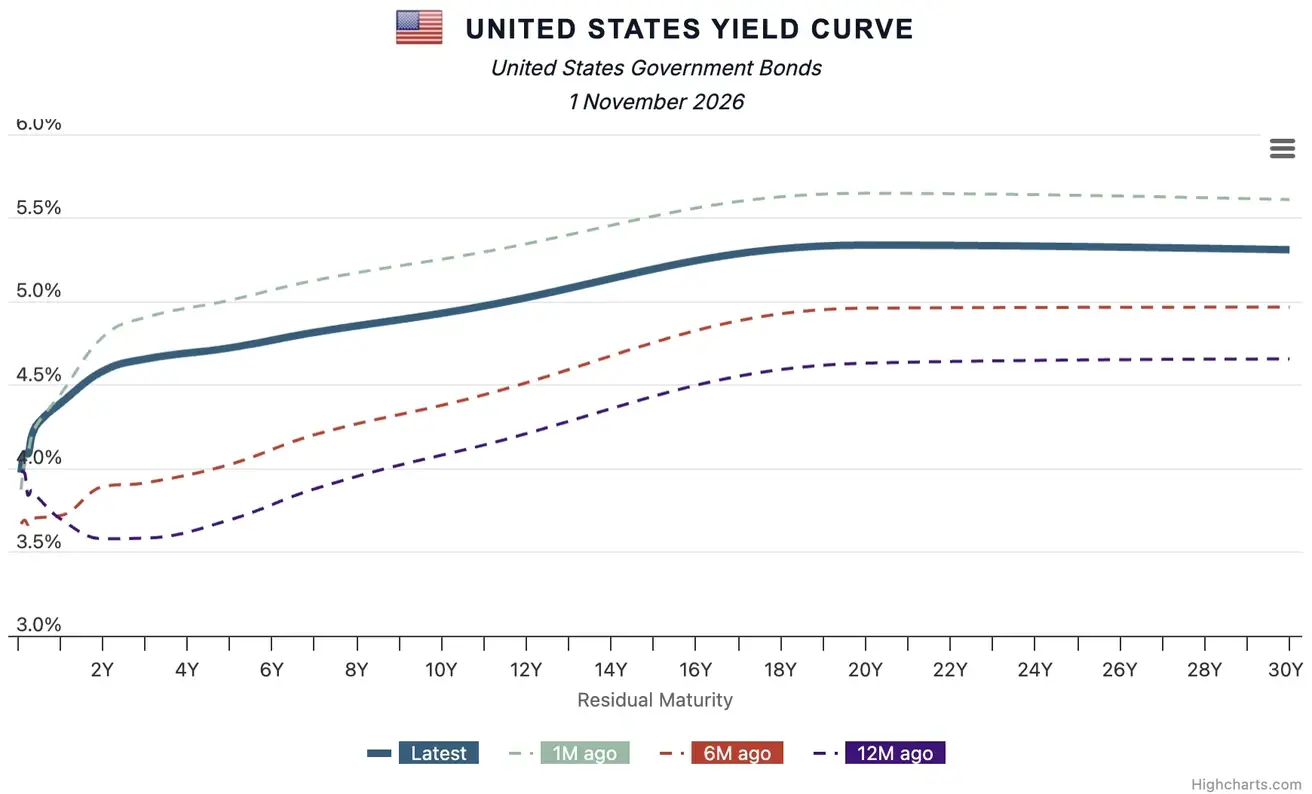
The U.S. debt market performed positively after the FOMC meeting: yields declined across the curve in both primary auctions and the secondary market.
Primary Treasury auctions:
- 3-month Treasury bills: 4.050% (previous: 4.095%);
- 6-month Treasury bills: 4.210% (previous: 4.220%);
- 2-year Treasury notes: 4.708% (previous: 4.787%);
- 5-year Treasury notes: 4.708% (previous: 5.033%);
- 7-year Treasury notes: 4.894% (previous: 5.085%).
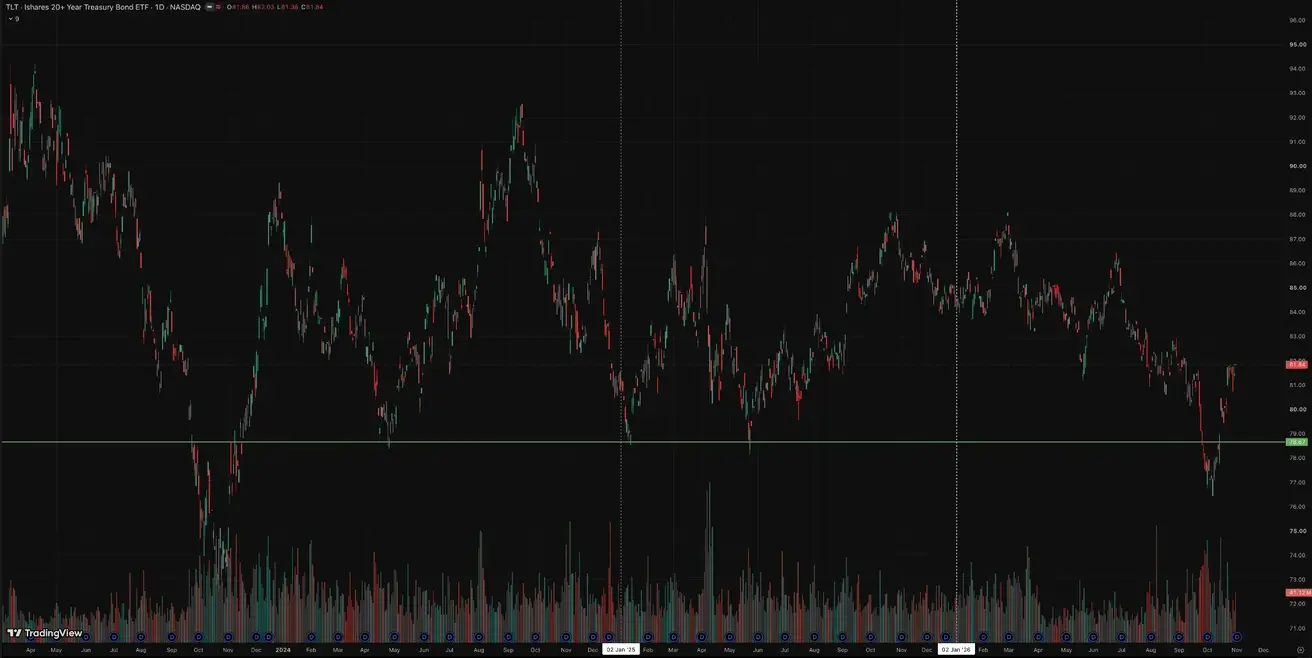
U.S. Treasury Bonds 20+ Years (TLT ETF): weekly performance: +0.61% (week close: $81.84); year-to-date: -6.10%
Yields and Spreads
- Market Yield on U.S. Treasury Securities at 10-Year Constant Maturity: 4.93% (previous: 4.96%);
- 2-Year U.S. Treasury Yield: 4.58% (previous: 4.66%);
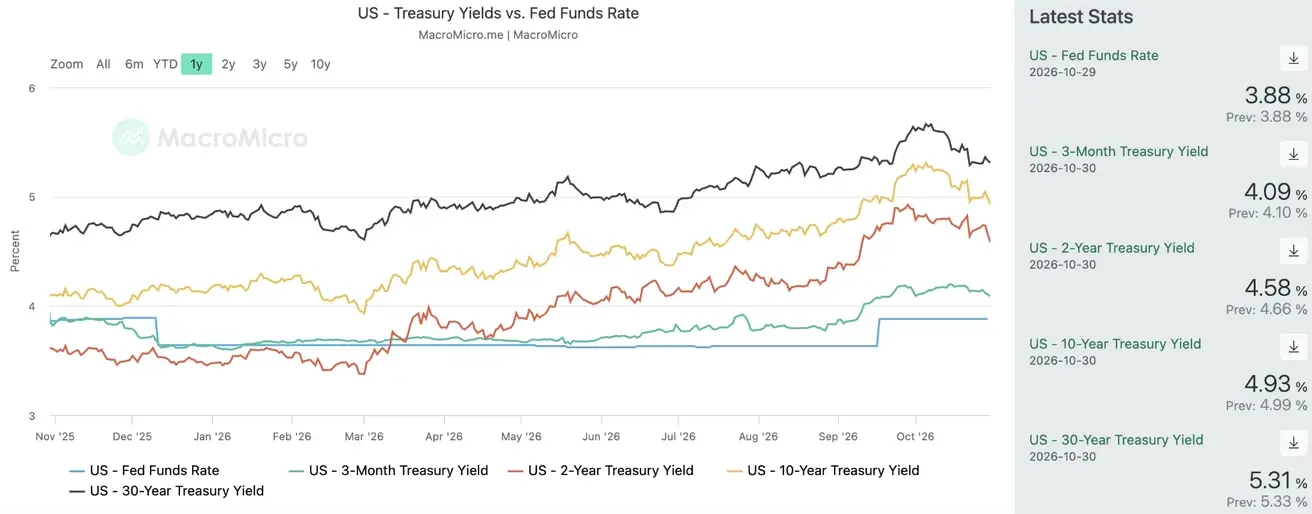
- The yield spread between 10-year and 2-year U.S. Treasury securities stands at 35 basis points (previous: 30 bps);
- The yield spread between 10-year and 3-month U.S. Treasury securities stands at 85 basis points (previous: 82 bps).
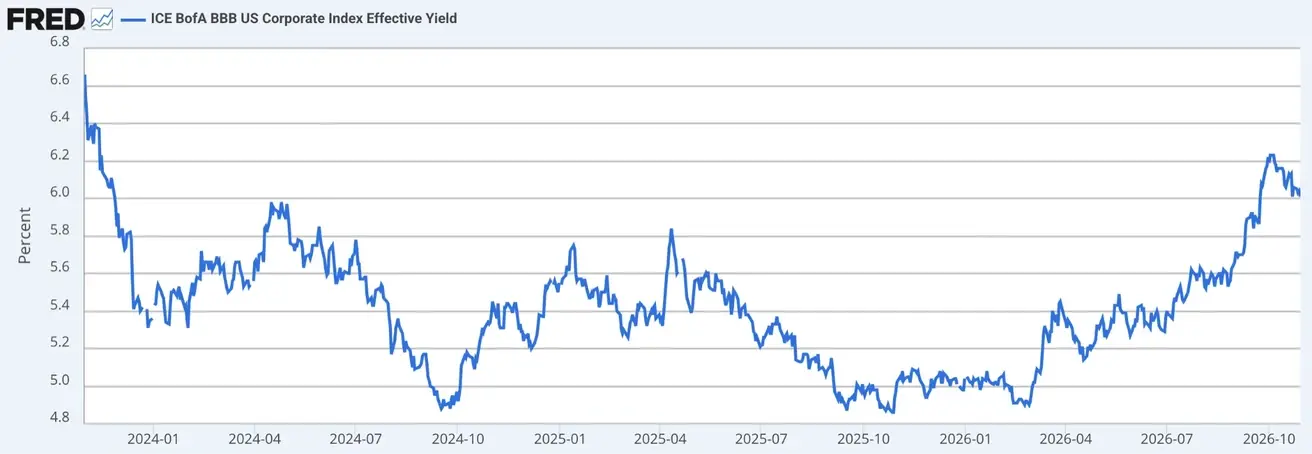
- ICE BofA BBB US Corporate Index Effective Yield: 6.01% (previous: 6.01%).
U.S. Treasury Yield Curve
The cost of a 5-year U.S. Credit Default Swap (CDS) — a market-based measure of sovereign default insurance — is 34.87 basis points (vs. 34.14 basis points a week earlier).
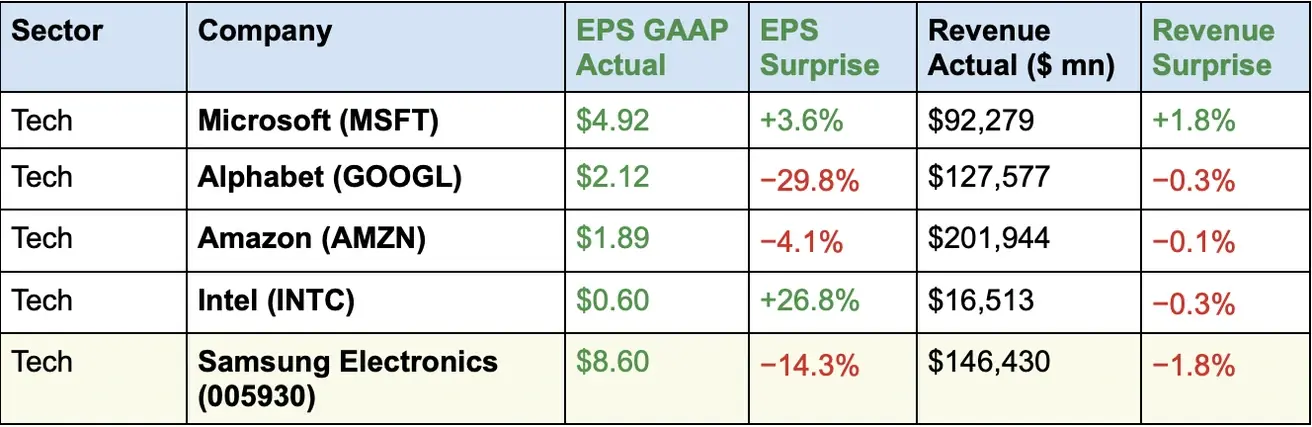
Market leaders delivered highly mixed reports relative to forecasts and expectations.
The key takeaway is not weak earnings, but the market’s extremely high expectations — investors had priced in even faster growth, and even strong operating performance no longer guarantees a positive market reaction. In addition, companies are reaffirming high capex, while free cash flow is deteriorating at some of the tech giants.
It is too early to conclude that the AI investment cycle is over, but the market will demand more convincing evidence that this spending will pay off.
The market reaction was negative.
Selected earnings reports, October 26–30, 2026.
Actual revenue growth:
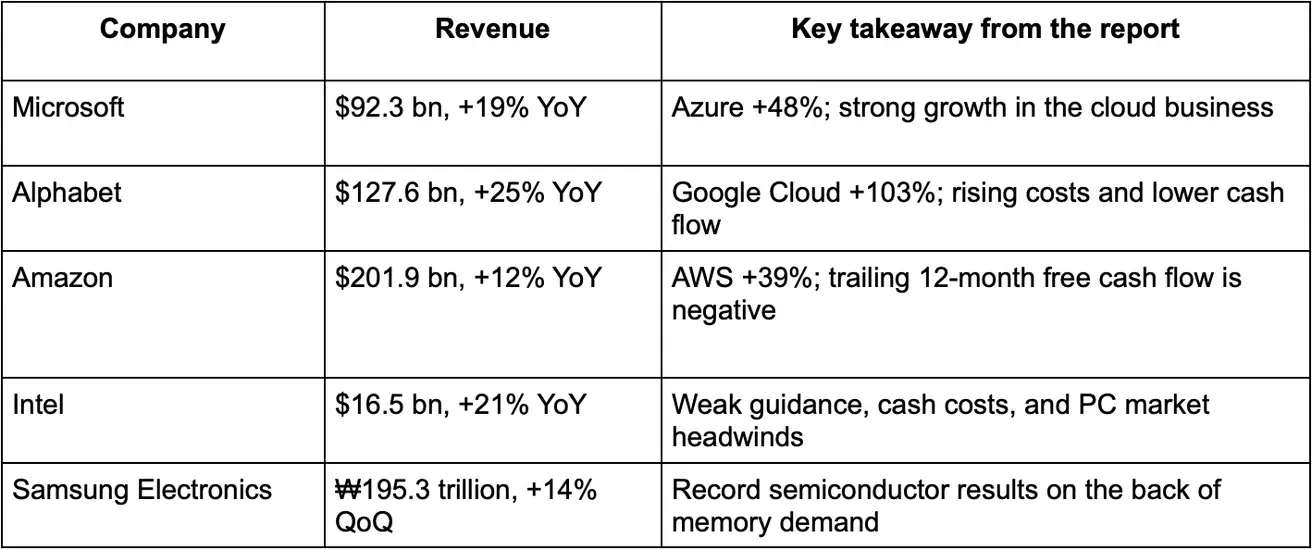
Guidance:
1. Microsoft (MSFT)
Revenue for Q2 FY2027: $96–97.1 bn (+18–19% YoY).
CapEx: over $50 bn next quarter and about $170 bn for calendar 2026.
Plans: further expansion of AI infrastructure, GPU and CPU purchases, and greater data center efficiency.
Additionally: management expects free cash flow to remain positive in FY2027 despite large-scale investment.
Takeaway: Microsoft’s management is confident that rapid growth in the cloud business will continue. Notably, the company says demand for the Azure platform still exceeds available compute capacity.
2. Alphabet (GOOGL)
CapEx for 2026: $195–205 bn.
2027: the company expects capital expenditures to increase significantly further.
Google Cloud: sales of its in-house TPU chips are expected to scale further in Q4, with a substantial increase in related revenue in 2027.
Profitability: management warned of pressure on cloud margins due to third-party compute capacity (e.g., SpaceX).
Google Search: revenue growth may slow in Q4 due to a high base of comparison from last year.
Takeaway: Alphabet maintains optimistic long-term expectations for AI and cloud services but acknowledges that massive investment will weigh on free cash flow and profitability.
3. Amazon (AMZN)
Guidance: very optimistic
Revenue for Q4 2026: $240–247 bn (+12–16% YoY).
Operating income: $28.5–33.5 bn vs. $25 bn a year earlier.
AWS: management projects cloud revenue growth of more than 40% annually in 2027 and 2028.
Long-term ambitions: Amazon CEO Andy Jassy believes AWS could become a business with $1 trillion in annual revenue within the next 5–10 years.
CapEx: about $220 bn in 2026, with a further substantial increase in 2027.
New initiatives: the company plans to begin external sales of its in-house Trainium AI chips in late 2027.
Takeaway: Amazon presented the most ambitious long-term guidance among the companies reviewed. However, massive AI spending is already putting significant pressure on free cash flow, so execution of these plans remains a key risk.
4. Intel (INTC)
Guidance: negative in the short term, cautiously positive in the long term
Revenue for Q4 2026: guidance of $15–16 bn, well below analysts’ expectations of $17.07 bn.
EPS: guidance of $0.10 GAAP and $0.25 adjusted.
Gross margin: expected to decline to 37.1% GAAP.
PC market: management expects demand to remain weak until at least mid-2027.
Plans: increase Xeon processor production, advance the Intel 14A process node, and expand its collaboration with Oracle.
CapEx: about $20 bn in 2026, with plans to increase investment substantially in 2027.
Takeaway: Intel’s management expects to strengthen its position as a semiconductor industry leader, backed by growing demand for server processors and the development of its foundry business. However, weak short-term guidance and capacity constraints pose significant risks.
5. Samsung Electronics
Guidance: very optimistic for the semiconductor business, cautious for consumer electronics.
HBM and AI memory: management expects memory demand to significantly exceed supply, with the supply shortage persisting until 2028 (a major positive).
Foundry: double-digit revenue growth is expected in Q4 2026 relative to Q3. In 2027, the company plans to expand production of advanced 2nm and 4nm chips.
New U.S. fab: Samsung plans to start operations at its new plant in Texas in 2027, increasing capacity for advanced semiconductor production.
CapEx: capital expenditures in 2026 will total approximately $62.8 bn, of which $57.1 bn is allocated to the semiconductor business.
Smartphones: management warns of margin pressure due to rising component costs. It plans to increase the share of premium devices and improve operating efficiency.
Shareholder returns: Samsung expects total payouts of $66.99–81.84 bn for 2026, including dividends and share buybacks. Samsung is scheduled to announce the final decision in January 2027.
Takeaway: Samsung’s management is highly optimistic about its semiconductor outlook for 2027. The company is counting on a prolonged memory shortage, record investment in AI infrastructure, and expanded production of advanced chips. In effect, the company has found a new niche in the AI boom. However, rising smartphone production costs pose risks to overall profitability. Overall, management’s guidance is very positive, especially in the AI memory segment.
Stock Indices (October performance)
- Risk appetite for the largest tech companies declined. The technology sector lost 8.56%, and communication services lost 12.25%. These two sectors account for a significant share of the largest U.S. companies.
- At the same time, seven of the eleven sectors ended the month higher. Capital reallocated toward companies with more resilient demand, making the shift predominantly defensive: consumer staples, healthcare, utilities, and energy led the gains.
The main takeaway: capital is rotating out of the largest companies into a broader range of stocks — a reallocation of capital rather than a broad-based sell-off.
Sector performance in October:
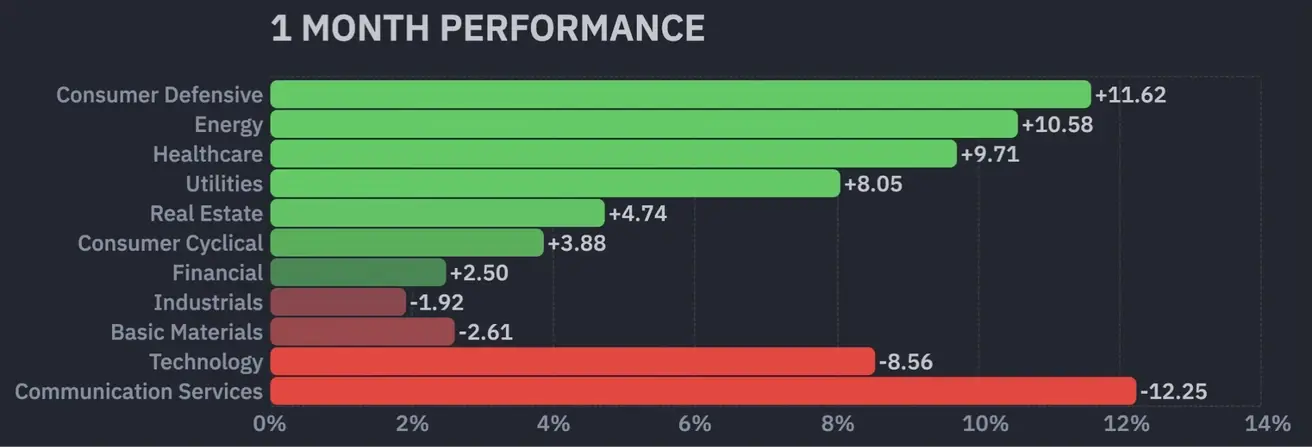
Despite the prevailing negative sentiment in the media, October showed signs of broadening market participation.
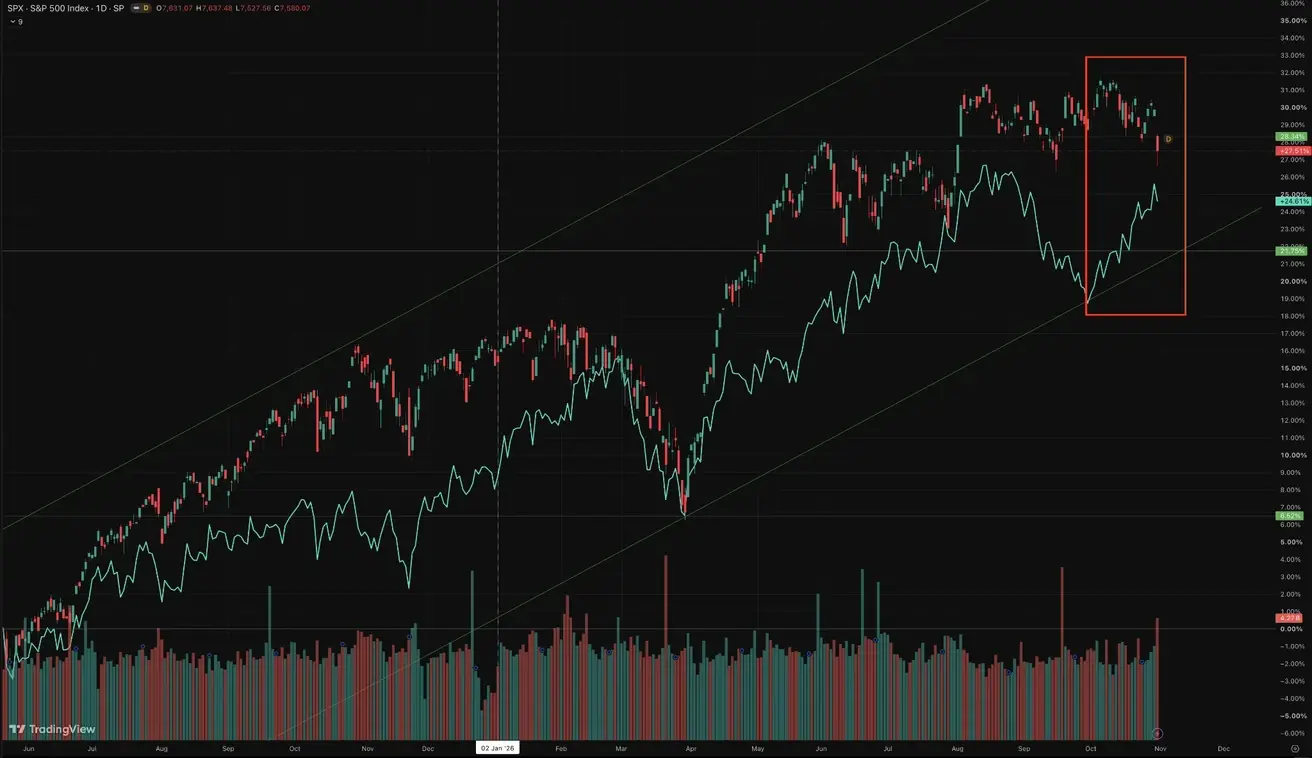
S&P500
Weekly performance: -0,57% (week-end close: 7580,07); year-to-date: +10,73%.
October result — RSP (equal-weighted S&P 500, line): +4.45%; SPX (cap-weighted S&P 500, candles): -1.38%:
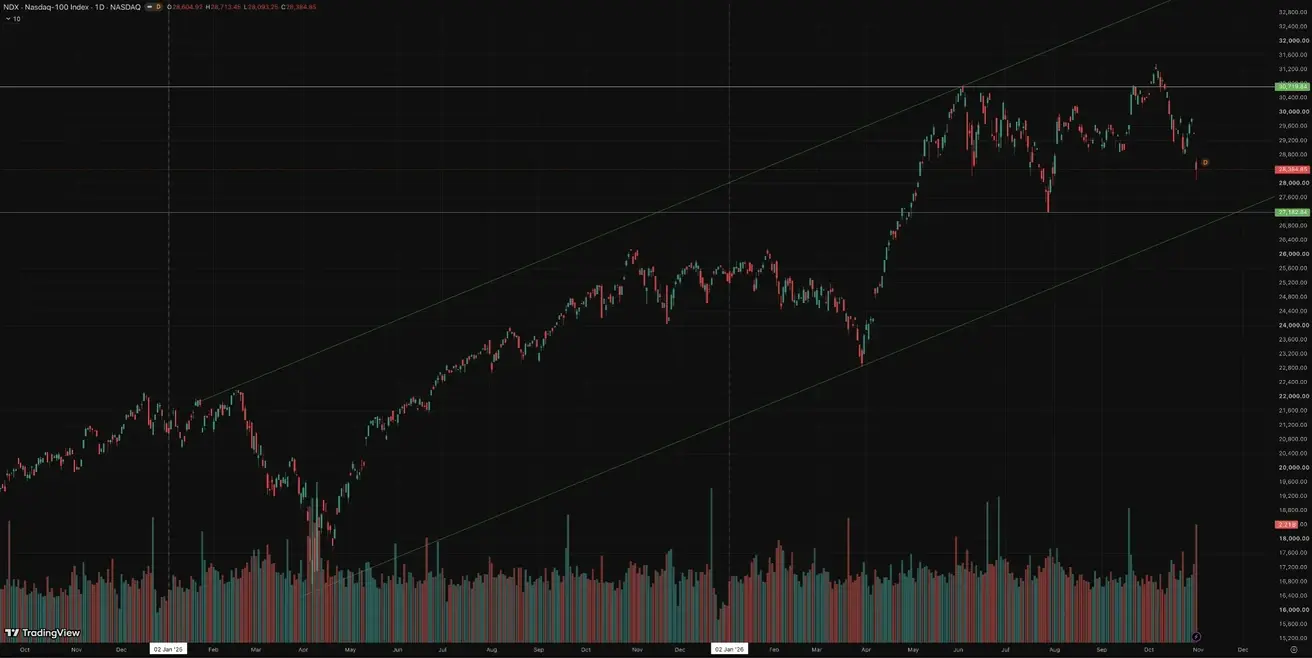
NASDAQ100
Weekly performance: -1,98% (week-end close: 28384,85); year-to-date: +12,42%.
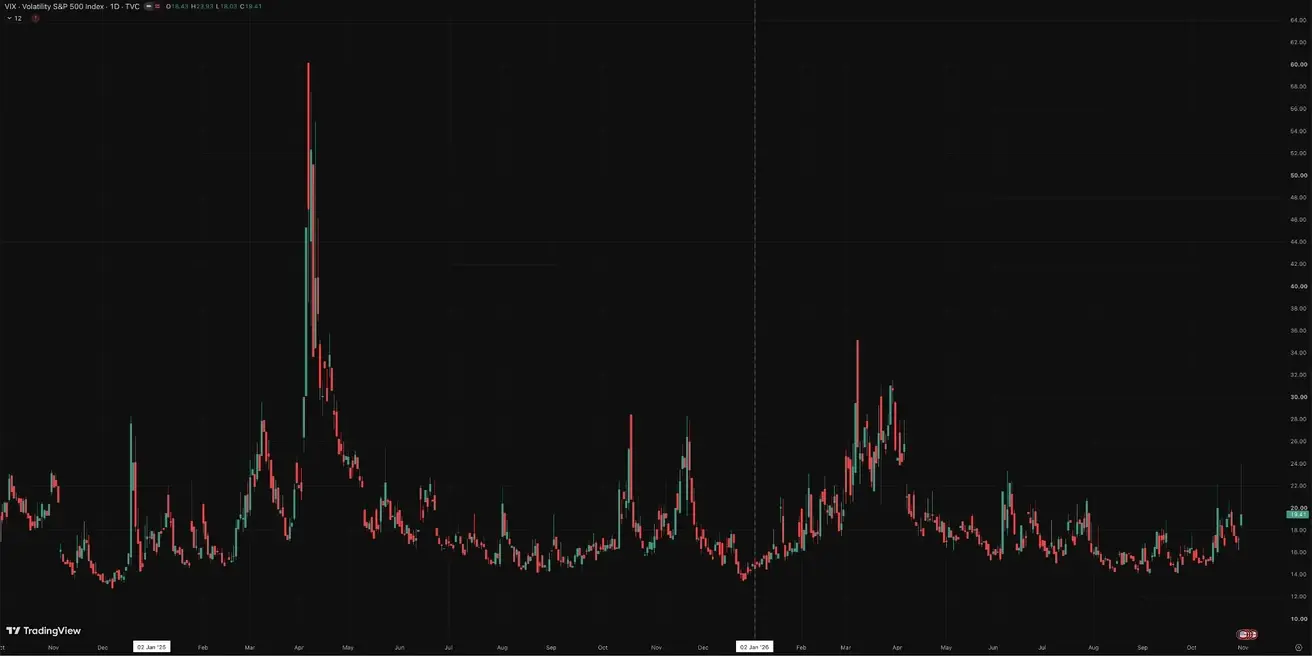
VIX
VIX (volatility index): week-end close at 19,41 points.
Eurozone
- ECB — the rhetoric is moderately hawkish, but there is no signal that aggressive rate hikes are needed. The ECB acknowledges inflation risks while taking into account the cooling effect of already tighter financial conditions;
- Against the backdrop of the conflict in the Middle East, the ECB revised its GDP forecasts downward and raised its inflation projections for the coming years.
At its October 29 meeting, the ECB kept rates unchanged, with the main refinancing rate at 2.65%. The key message: eurozone inflation accelerated to 3.8% YoY in September amid high energy prices. The ECB is maintaining a wait-and-see stance, given the risks of further inflation growth and an economic slowdown.
Christine Lagarde announced that she will step down early as ECB President on February 7, 2027, almost nine months before the end of her term. She said the decision reflects her wish to speak more freely on issues beyond monetary policy. The process of appointing her successor is already underway.
Macroeconomic Data
Interest Rates
- Deposit Facility Rate: 2.50% (previous: 2.50%);
- Marginal Lending Facility Rate: 2.9% (previous: 2.9%) — the rate at which banks can obtain overnight funding from the central bank;
- Main Refinancing Rate (Policy Rate): 2.65% (previous: 2.65%).
Inflation: Consumer Price Index (CPI) (September)
- Core CPI (YoY): 2.5% (previous: 2.4%);
- Headline CPI: 0.6% (MoM) (previous: 0.4%);
- CPI: 3.8% (YoY) (previous: 3.2%).
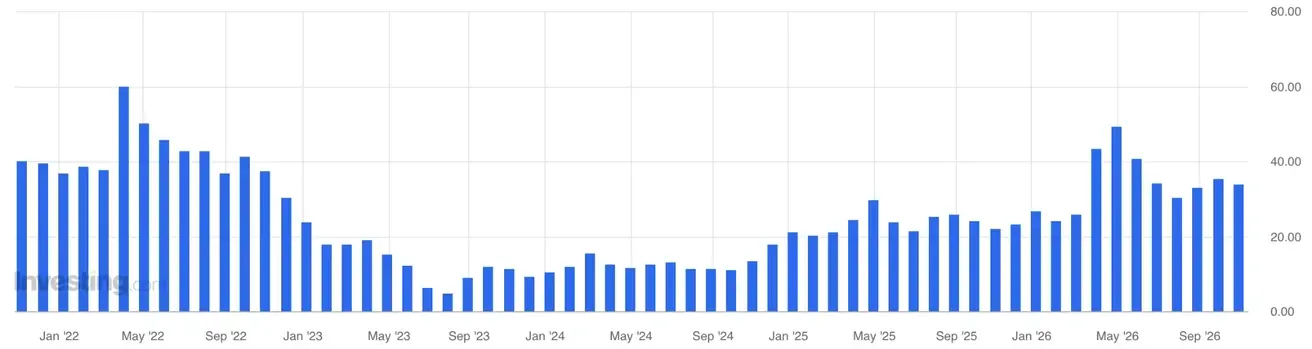
Eurozone consumer inflation expectations: 33.9 (previous: 34.7):
GDP Q2 2026 (preliminary estimate)
- QoQ: 0.4% (previous: 0.6%);
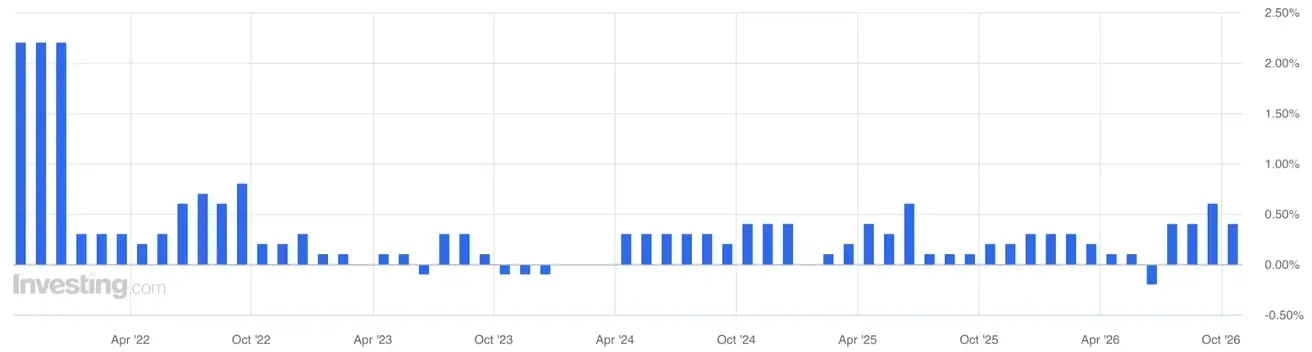
- YoY: 1.3% (previous: 0.5%).
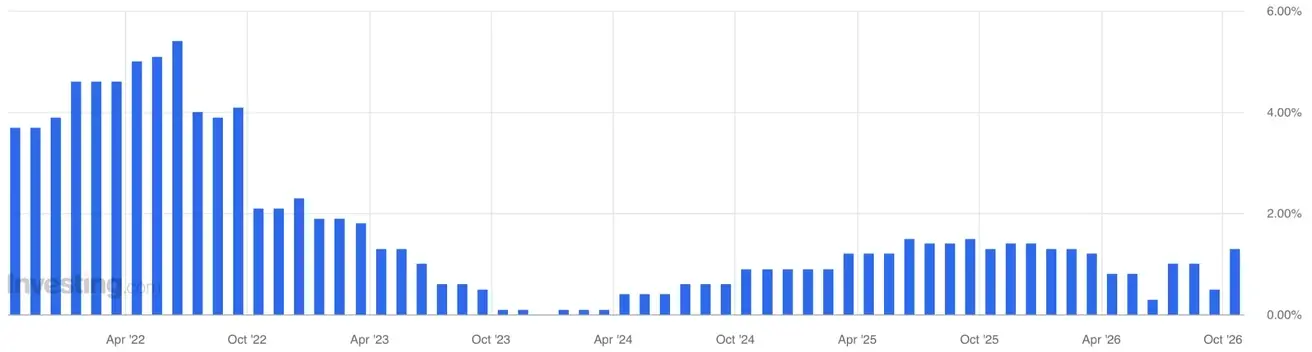
Trade balance (USD) (YoY): -16.1 bn (previous: 10.7 bn);
Industrial production (September): (MoM) -0.5% (previous: -0.3%, revised):
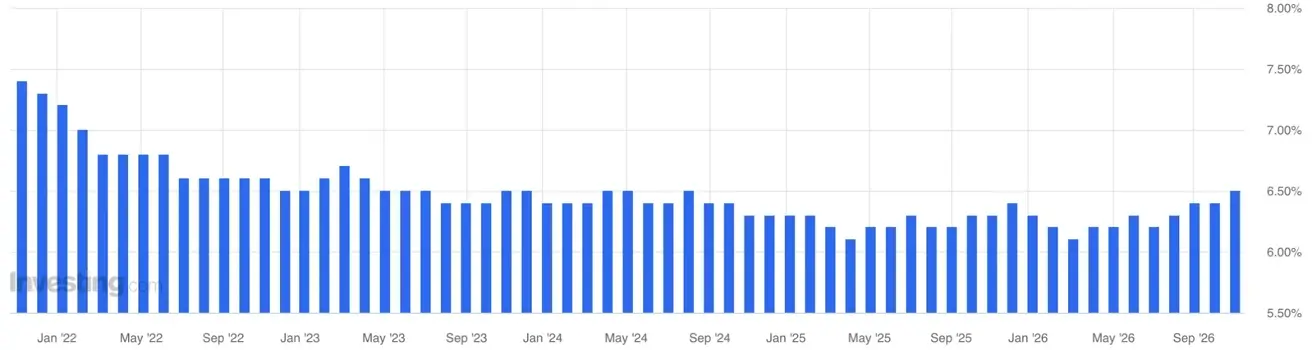
Unemployment Rate (August): 6.5% (previous: 6.4%).
Eurozone Consumer Confidence Index: -17.9 (previous: -16.8)
Purchasing Managers’ Index (PMI) (September)
- Services PMI: 51.7 (previous: 53.0, revised);
- Manufacturing PMI: 52.4 (previous: 52.9);
- S&P Global Composite PMI: 51.9 (previous: 52.9).
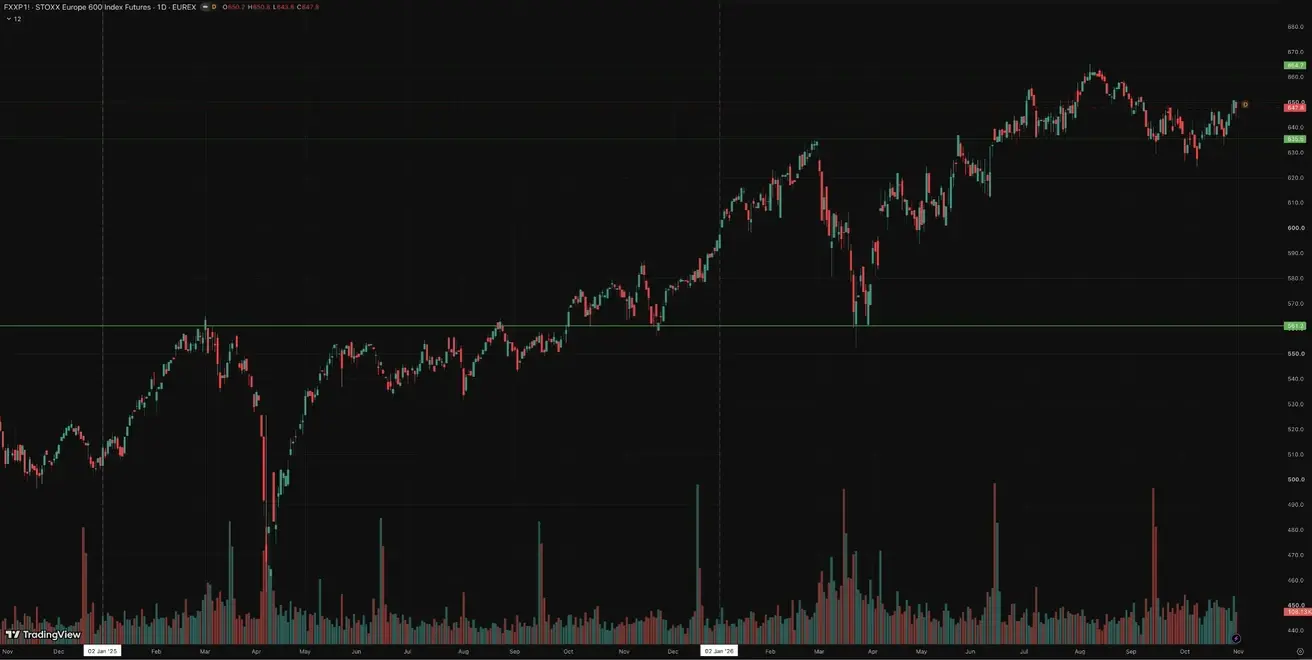
Euro Stoxx 600 (FXXP1!)
Weekly performance: -1,79% (week-end close: 647,80); year-to-date: +9,06%.
China
China’s economy continues to stabilize, supported by strong exports, while domestic demand and investment gradually recover. Policymakers remain measured and targeted in their stimulus approach.
- Interest rates remain unchanged;
- Monetary policy remains accommodative;
- China reaffirmed its commitment to fiscal support for economic growth under its 2026 plan, including measures to stimulate domestic demand, optimize tax incentives and subsidies, and modernize industrial capacity.
PMI data came in weak: manufacturing activity slipped back into contraction territory in October, falling from 50.1 to 49.3. The services index declined to 49.4, and the composite PMI fell to 49.7.
Macroeconomic Data
Interest Rates
- 1-Year Loan Prime Rate (medium-term lending): 3.00%;
- 5-Year Loan Prime Rate (benchmark for mortgage lending): 3.50%.
Inflation Indicators (September)
- Consumer Price Index (CPI): 0.2% MoM (previous: 0.4%)
- Consumer Price Index (CPI): 0.9% YoY (previous: 0.8%)
- Producer Price Index (PPI): 5.0% YoY (previous: 3.8%).
Trade Data (September)
Trade balance (USD) (YoY): $133.53 bn (previous: $119.9 bn);
Imports: 31.0% YoY (previous: 28.2%);
Exports: 36.3% YoY (previous: 25.0%);
GDP (Q3 2026)
- QoQ: 1.2% (previous: 0.9%);
- YoY: 4.5% (previous: 4.3%).
Labor Market
- Unemployment Rate (September): 5.2% (previous: 5.3%).
Industrial Activity
- Industrial Production (September, YoY): 5.5% (previous: 5.2%).
Fixed Asset Investment
- September, YoY: -7.2% (previous: -6.7%).
Retail Sales
- September, YoY: 1.1% (previous: 0.4%):
Purchasing Managers’ Indices (PMI) (October)
- Manufacturing PMI: 49.3 (previous: 50.1);
- Non-Manufacturing PMI: 49.7 (previous: 50.2);
- Composite PMI: 49.7 (previous: 50.7).
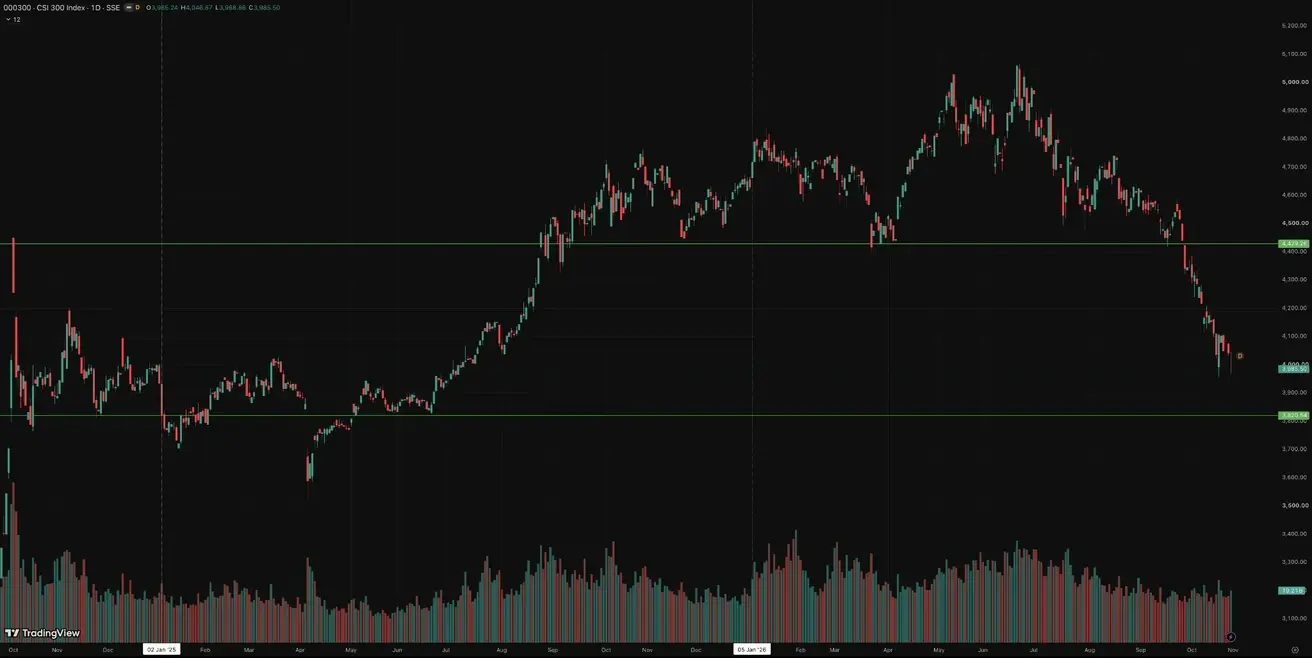
CSI 300 Index (000300.HK)
Weekly performance: -2,92% (week-end close: 3985,50); year-to-date: -14,50%.
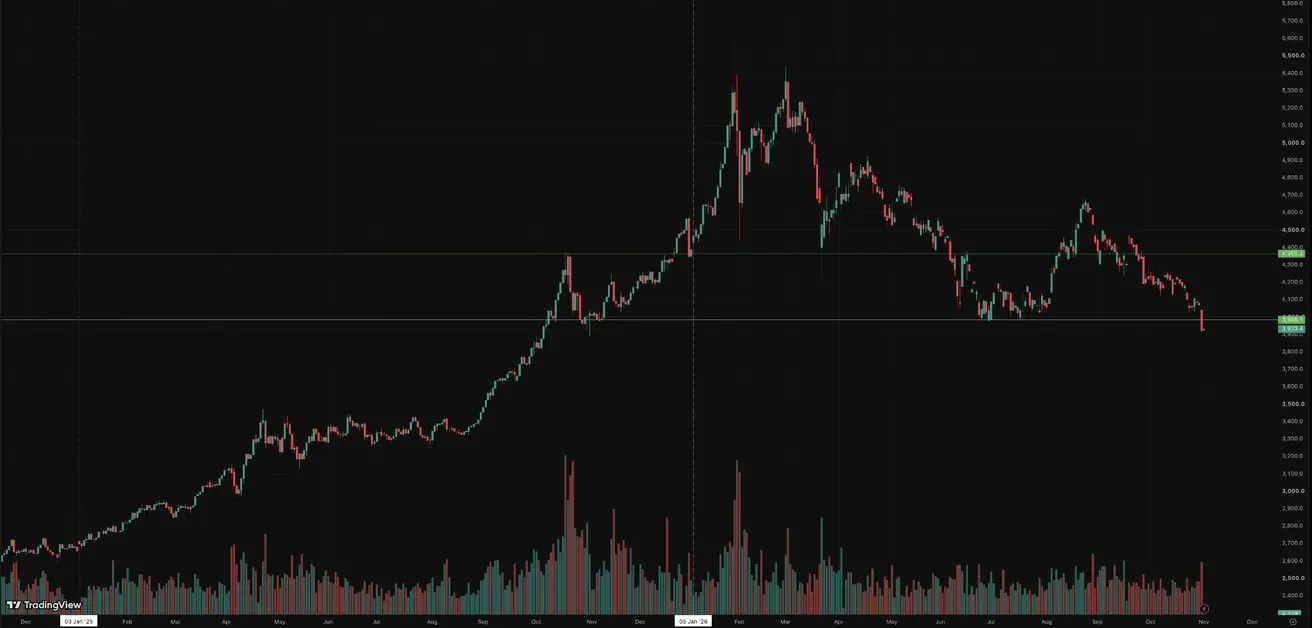
Gold Futures (GC)
Weekly performance: -2,99% (week close: $3933,40 per troy oz); year-to-date: -9,20%
Gold has broken below $4,000; the metal remains under pressure from high yields and a strengthening dollar.
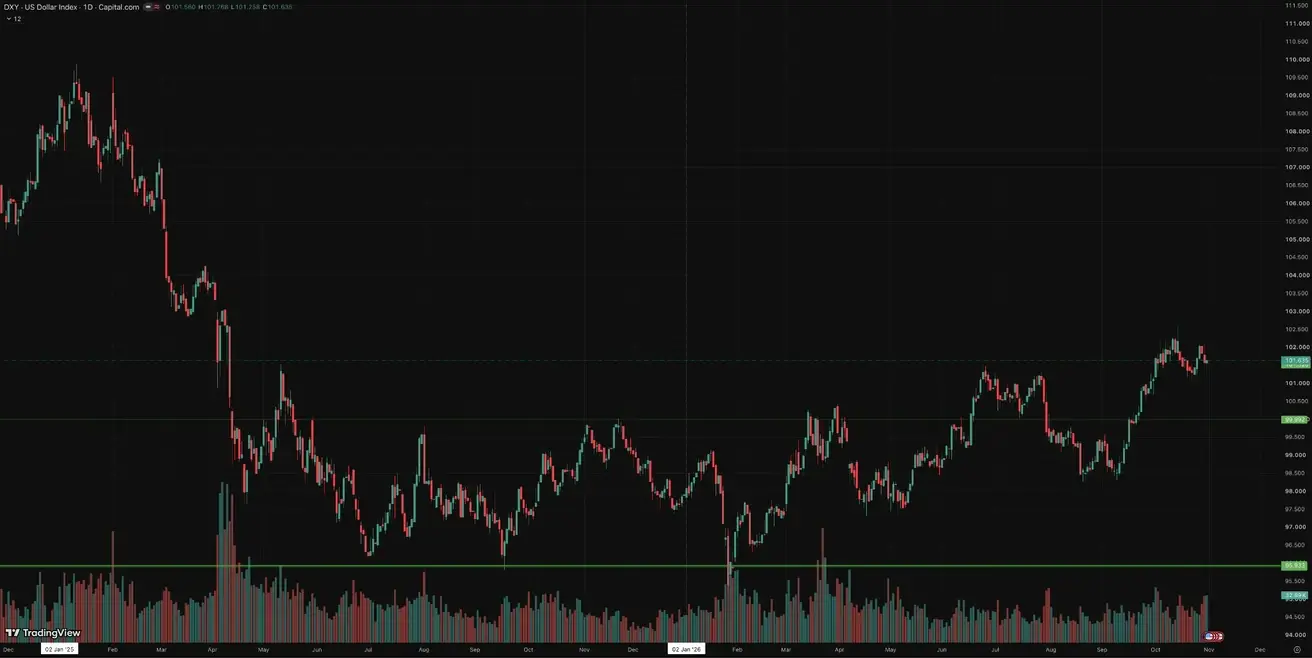
Dollar Index Futures (DX)
Weekly performance: +0,20% (week close: 101,635); year-to-date: +3,71%.
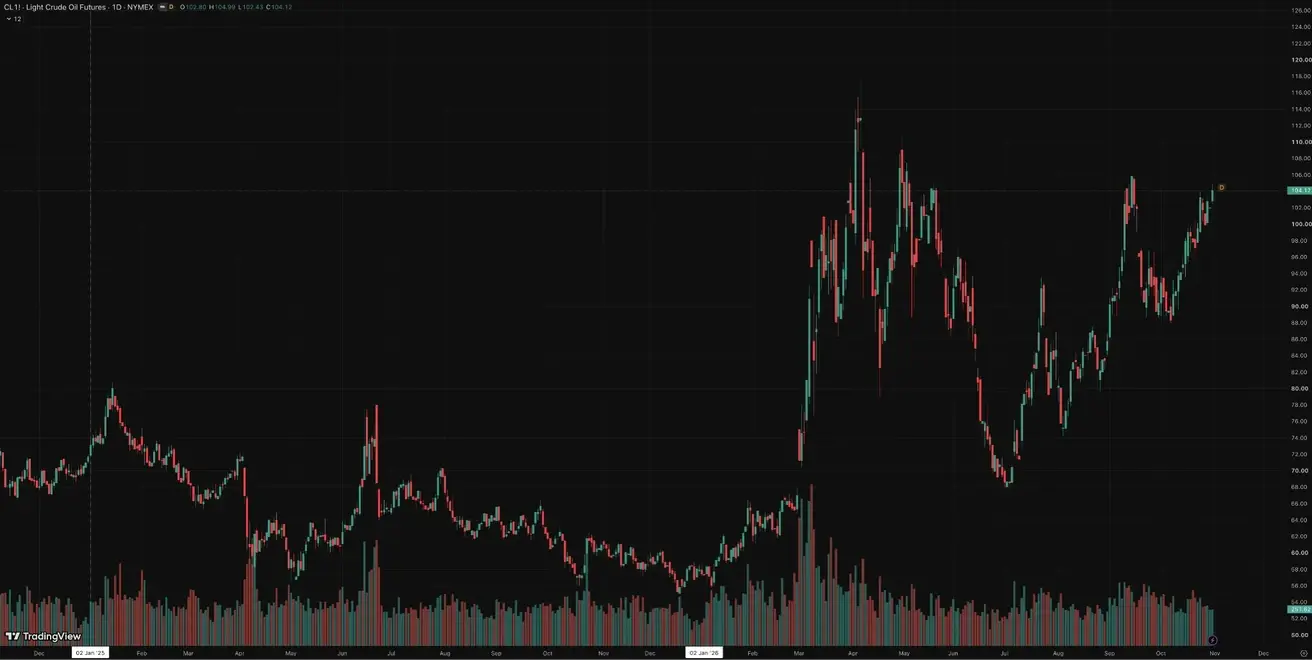
Oil Futures
Weekly performance: +0,82% (week close: $104,12 per barrel); year-to-date: +81,36%
Oil remains the most pronounced source of potential inflationary pressure. Persistently high energy prices may hinder further disinflation and limit the Fed’s room to ease monetary policy.
Crypto Market
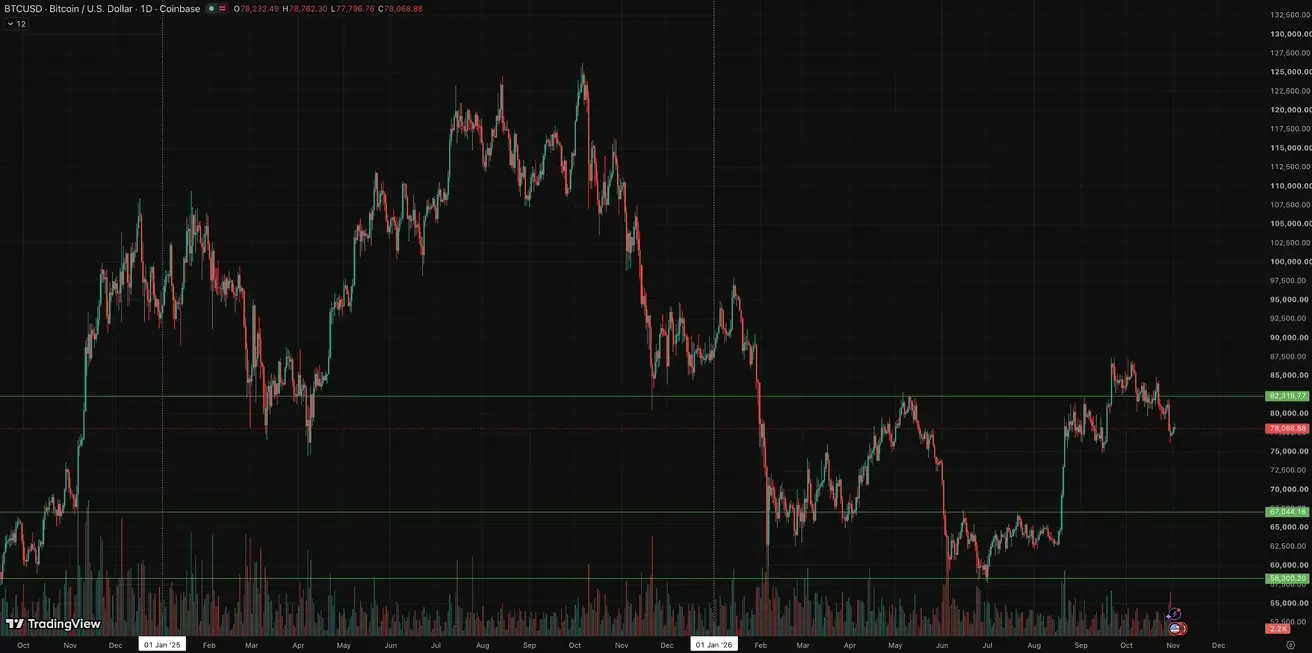
Crypto Market is under pressure after a large-scale hack of Binance, in which about $6.3 bn was stolen. The exchange said it intends to cover the losses from its own funds.
BTC Futures
Weekly performance: -2,28% (week close: $78,230.50); year-to-date: -10,82%.
ETH Futures
Weekly performance: -2,34% (week close: $2272,23); year-to-date: -23,59%.
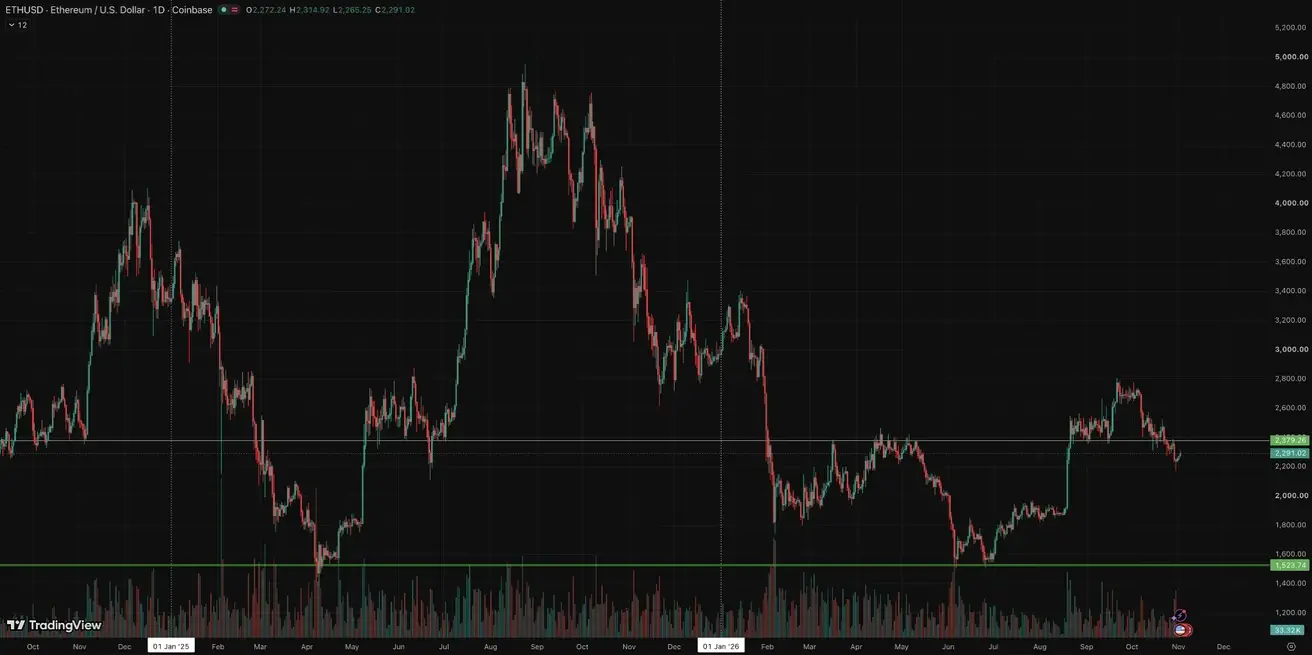
No critical crash occurred, but short-term risks of elevated volatility and further deleveraging persist.
Market stabilization depends on restoring confidence in Binance, normalizing liquidity, and improving sentiment across global risk markets.
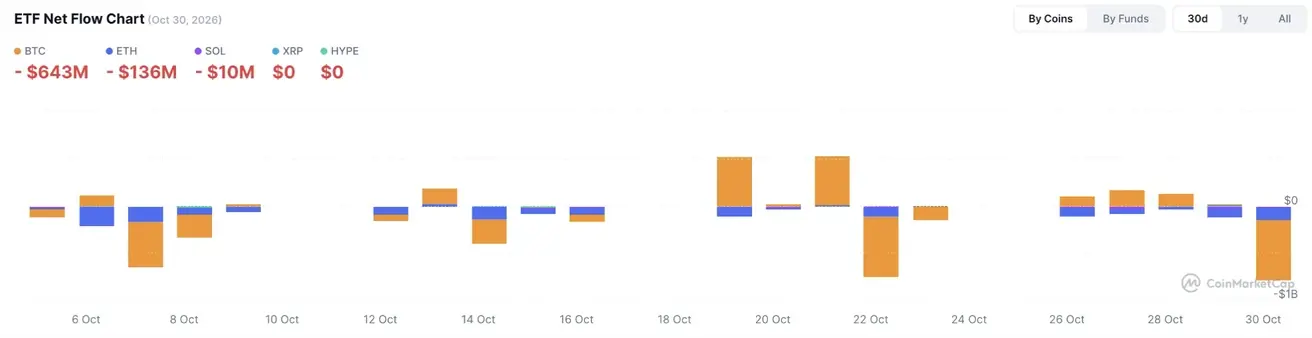
ETF Net Flows