Русский
 Қазақша
 Eesti
October 12 – October 18, 2026: Weekly economic update
Key market updates

Key Takeaways:
- The policy rate was raised to a range of 3.75 - 4.00%; rhetoric is hawkish;
- Monetary policy remains moderately restrictive;
- U.S. macroeconomic data continue to support a soft-landing scenario: inflation risks are increasing, the labor market is cooling without signs of recession, and current conditions do not yet warrant a rate cut.
- The Fed slightly improved its GDP and employment forecasts and raised its near-term inflation forecasts.
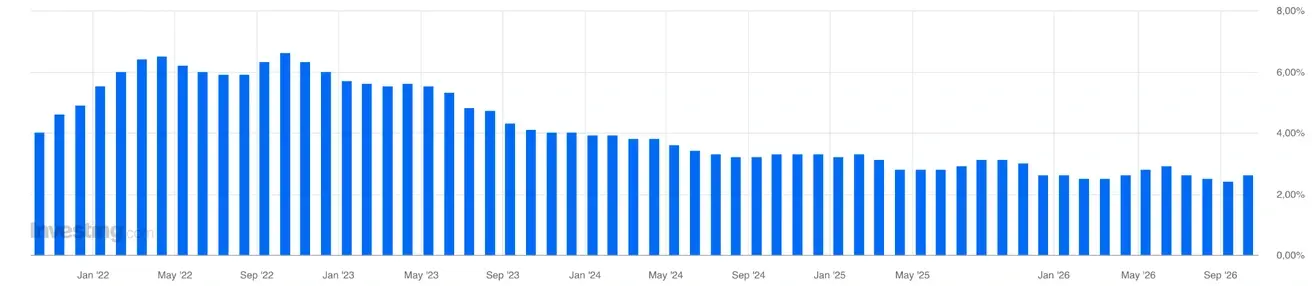
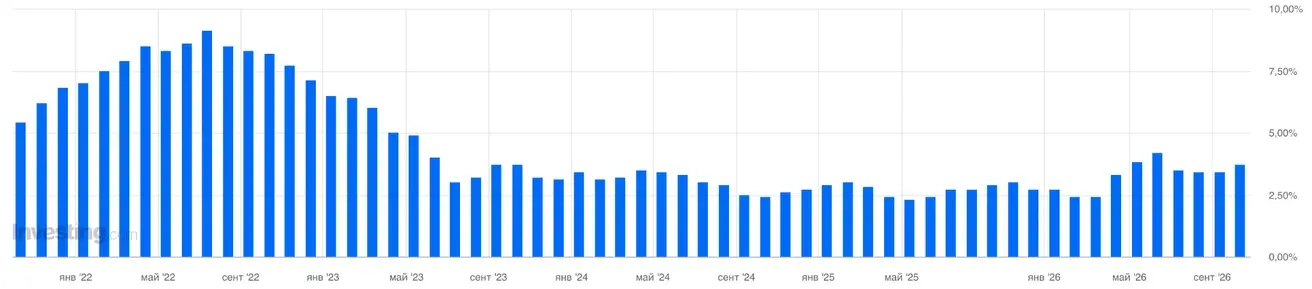
Inflation data showed a slight uptick in volatile components, while core inflation was unchanged month-over-month and rose to 2.6% (+0.2 pp) year-over-year after five months of decline.
Inflation: Consumer Price Index (September)
- Core CPI (MoM): 0.3% (previous: 0.3%).
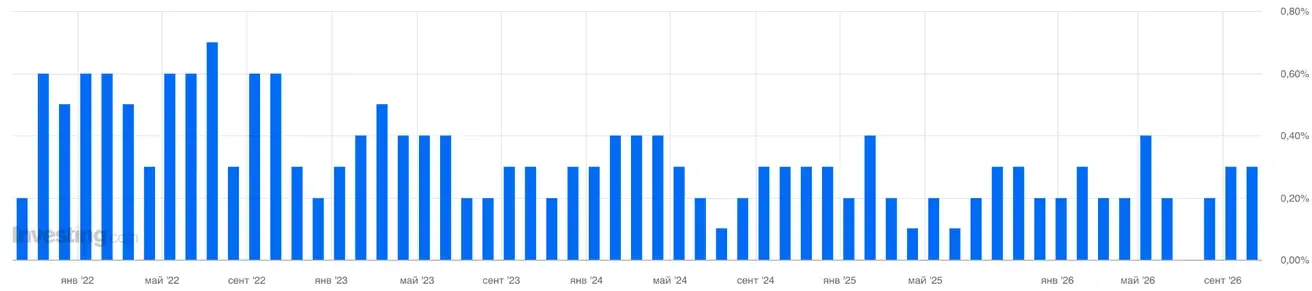
- Core CPI (YoY): 2.6% (previous: 2.4%).
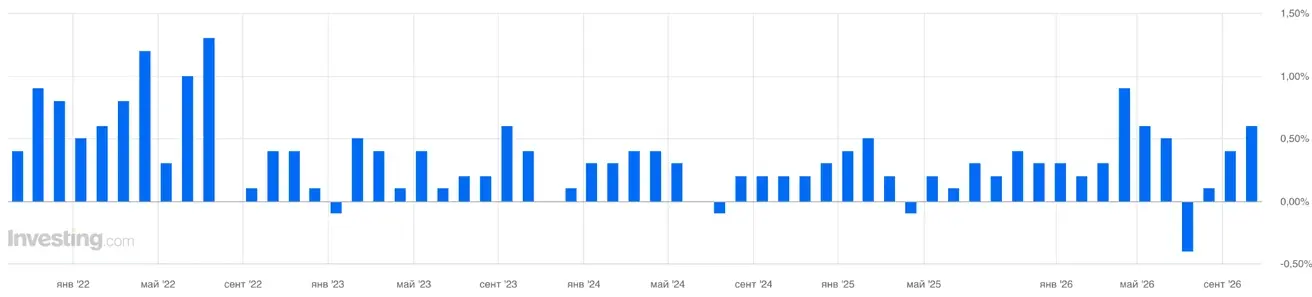
- CPI (MoM): 0.6% (previous: 0.4%).
- CPI (YoY): 3.7% (previous: 3.4%).
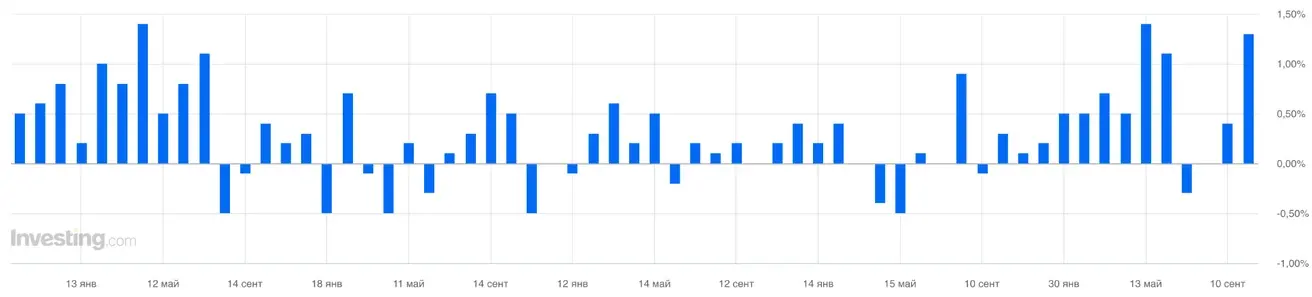
Producer Price Index (September)
- PPI (MoM): 1.3% (previous: 0.4%).
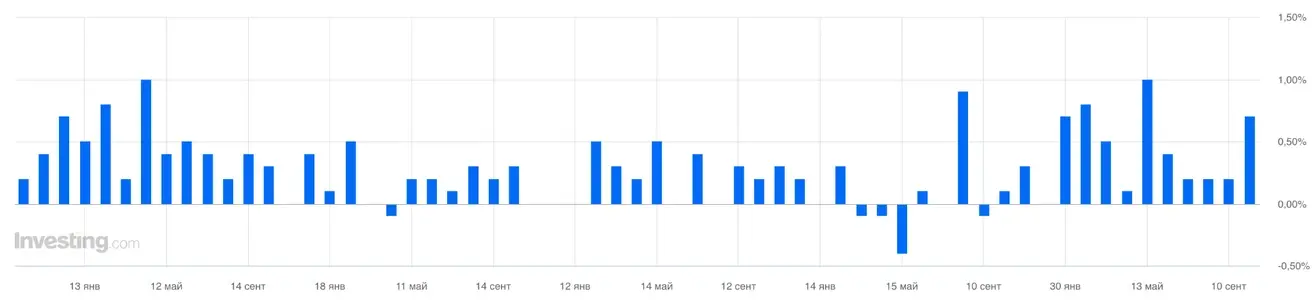
- Core PPI (MoM): 0.7% (previous: 0.3%).
Inflation Expectations (Michigan) (September)
- 12-month Inflation Expectations: 4.7% (previous: 4.6%).
- 5-Year Inflation Expectations: 3.5% (previous: 3.4%).
The Fed’s inflation benchmark:
Core PCE Price Index (August): MoM: 0.2% (previous: 0.1%); YoY: 3.0% (previous: 3.7%):
Headline PCE Price Index (August): MoM: 0.3% (previous: 0.1%); YoY: 3.4% (previous: 3.4%):
GDP (U.S. Bureau of Economic Analysis, BEA) — Q2 2026 annualized, third estimate: 2.2% (second estimate: +1.5%; Q1 2026 was revised from +2.1% to 2.5%).
GDPNow (the Atlanta Fed’s real-time estimate of official GDP growth ahead of release (Q3 2026)): 3.6% (previous: 3.6%).
Labor Market (BLS) (September)
- Unemployment rate: 4.2% (previous: 4.1%):
- Total number of people receiving unemployment benefits in the U.S.: 1,710K (previous: 1,716K);
- Initial jobless claims: 199K (previous: 197K);
- Change in nonfarm payrolls: 29K (previous: 133K, revised):
- Change in private nonfarm payrolls: 46K (previous: -89K, revised):
- Average hourly earnings (YoY): 3.0% (previous: 3.1%):
- JOLTS job openings: 7.271M (prev: 6.866M).
Business Activity Index (PMI) (August)
(Above 50 indicates expansion; below 50 indicates contraction)
- Services PMI: 58.8 (previous: 58.7).
- Manufacturing PMI: 55.9 (previous: 53.9).
- Composite PMI: 58.4 (previous: 58.4).
Monetary Policy
Fed officials’ rhetoric:
Kevin Warsh (October 16, after the inflation data): his rhetoric was cautious, with no direct signal on the next rate move. He reiterated the priority of price stability and noted that since the September hike, the economy has broadly evolved close to the Fed’s expectations, but declined to comment in advance on the October and December meeting decisions. The softer, less aggressive tone signaled to markets a pause in October rather than an immediate further hike.
Separately, Warsh highlighted the AI investment boom: in the short term it may support demand and inflationary pressure, while in the long term it may boost productivity.
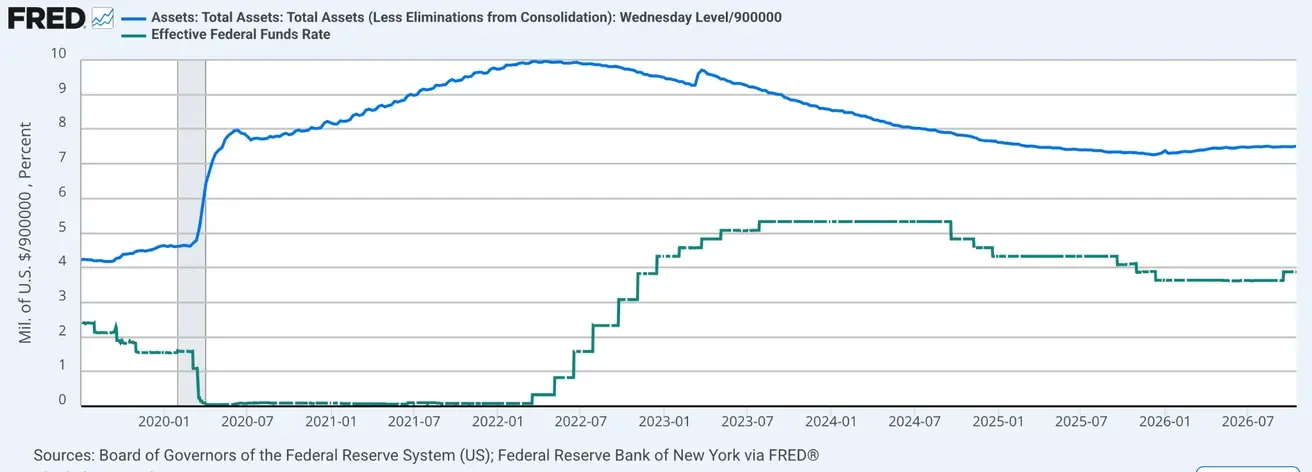
Federal funds rate (EFFR): 3.75%–4.00%
Federal Reserve balance sheet: $6.755 trillion, +3.37% since the end of QT ($6.535 trillion):
Market Forecast for Rate (FedWatch)
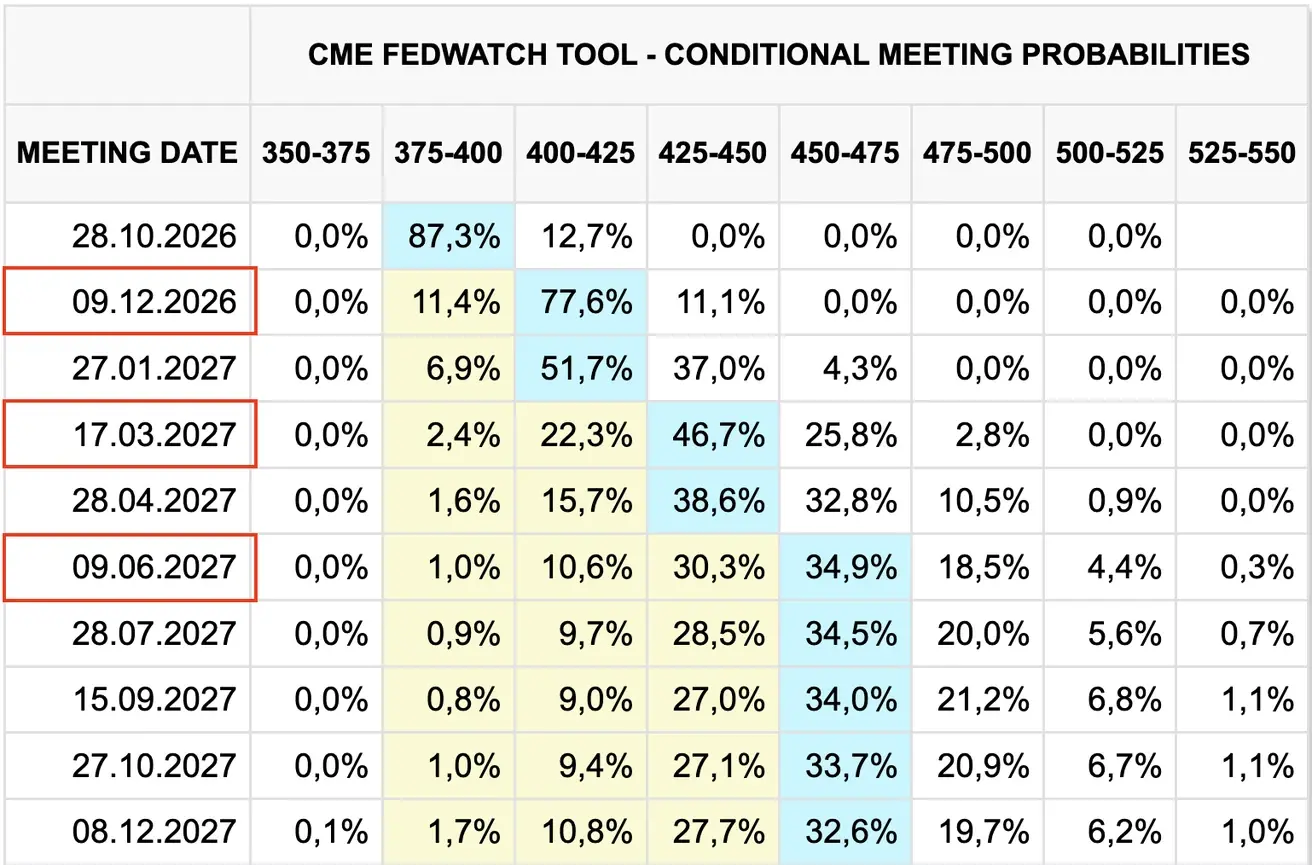
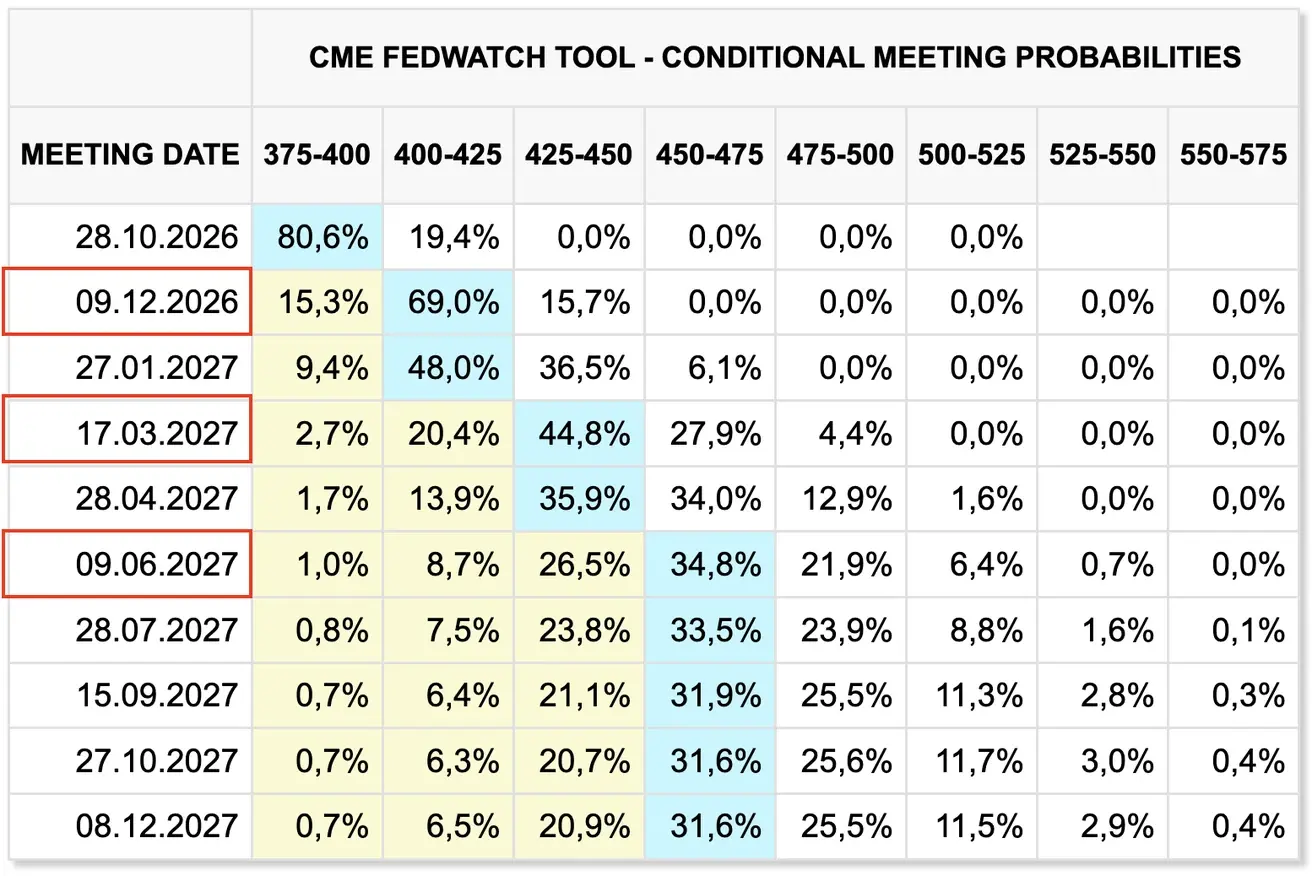
For the next FOMC meeting (October 28), the estimated probability of a 0.25% rate hike is 12.73% (a week earlier: 19.37%; three weeks earlier: 68.1%).
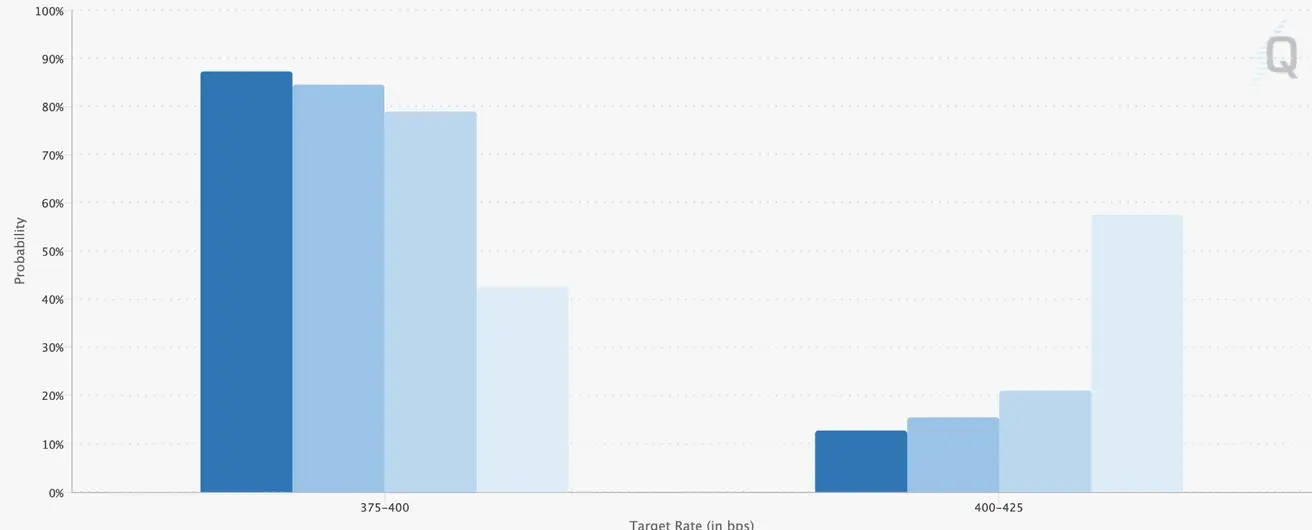
Over the next 12 months, unchanged: the market expects three 0.25% rate hikes to bring rates to 4.50–4.75%, with the final hike expected in June 2027. The market continues to price in geopolitical uncertainty as energy prices remain elevated.
Today:
A week earlier:
Bond Market
Yields fell sharply across the 2- to 30-year range.
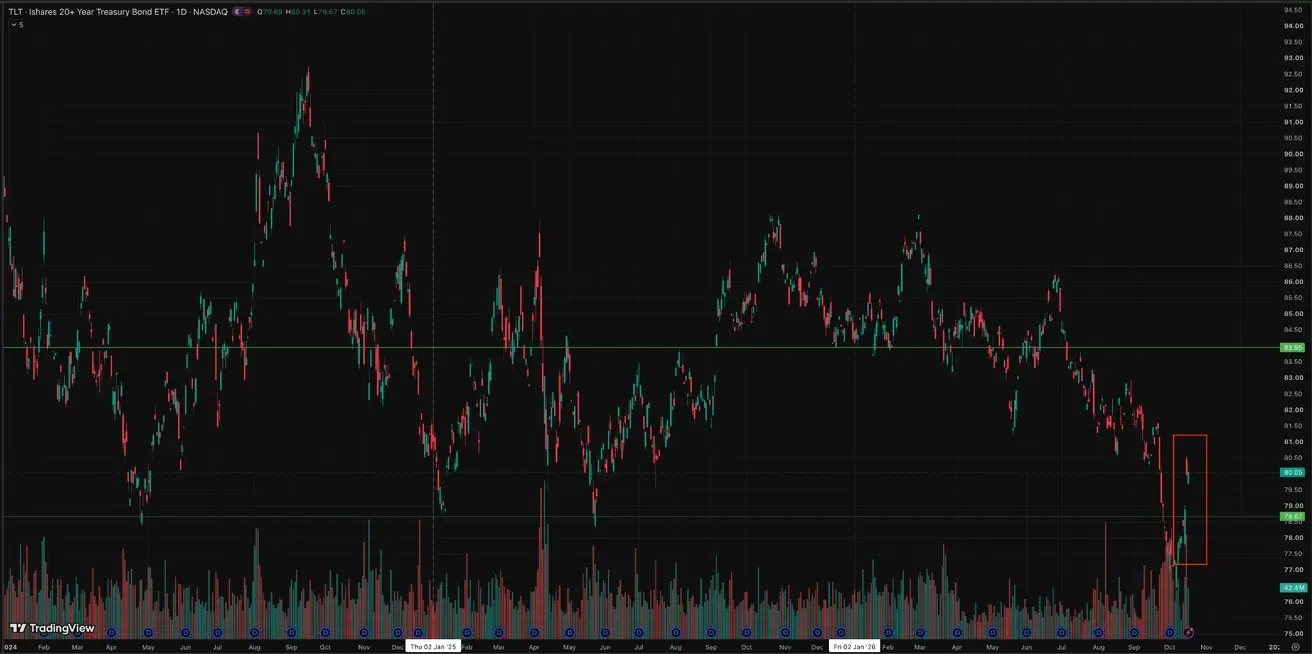
Long-duration bond prices began rising immediately after the consumer inflation release, which showed only a modest increase. This suggests yields had already priced in a significant share of inflation risk—in other words, current high yields anticipated a larger rise in inflation than the data showed. Accordingly, the moderate CPI print pushed bond prices higher:
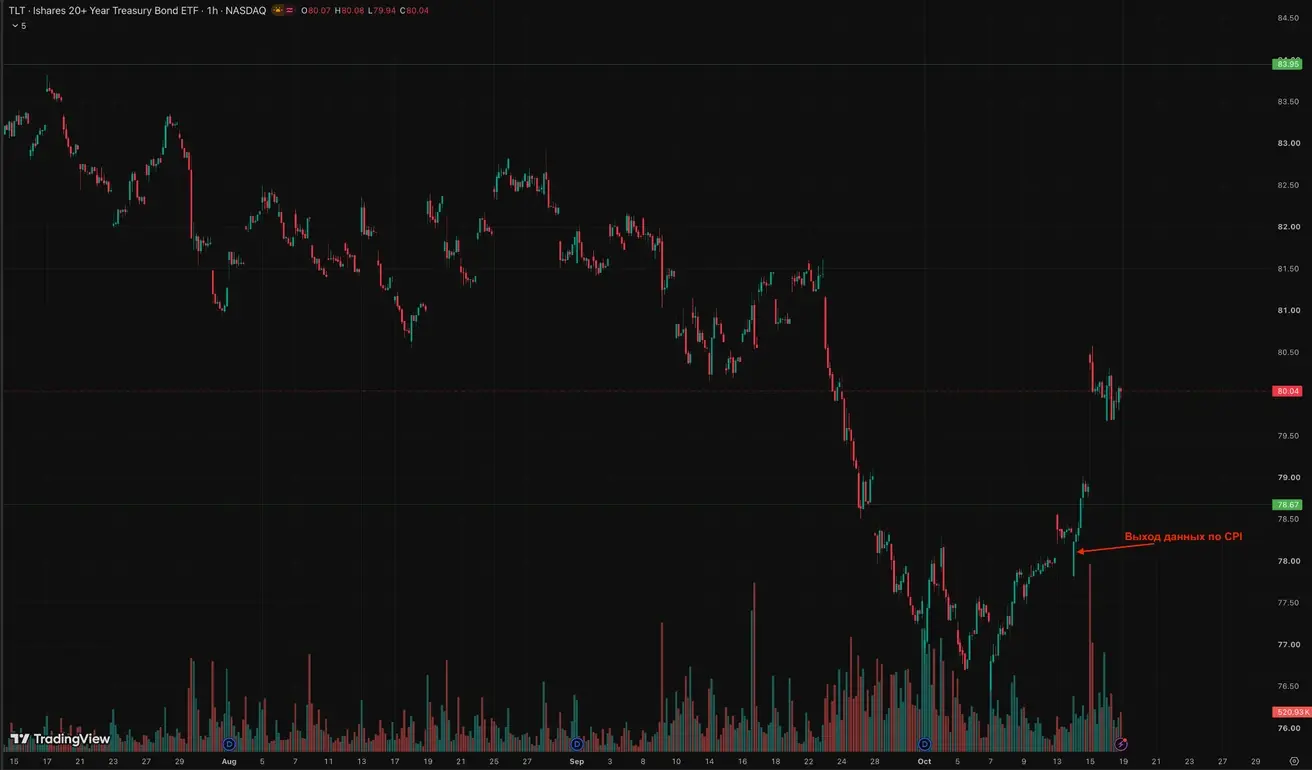
U.S. Treasury Bonds 20+ Years (TLT ETF): weekly performance: +2.65% (week close: $80.05); year-to-date: -8.61%
Yields and Spreads
- Market Yield on U.S. Treasury Securities at 10-Year Constant Maturity: 5.07% (previous: 5.23%);
- 2-Year U.S. Treasury Yield: 4.72% (previous: 4.79%);
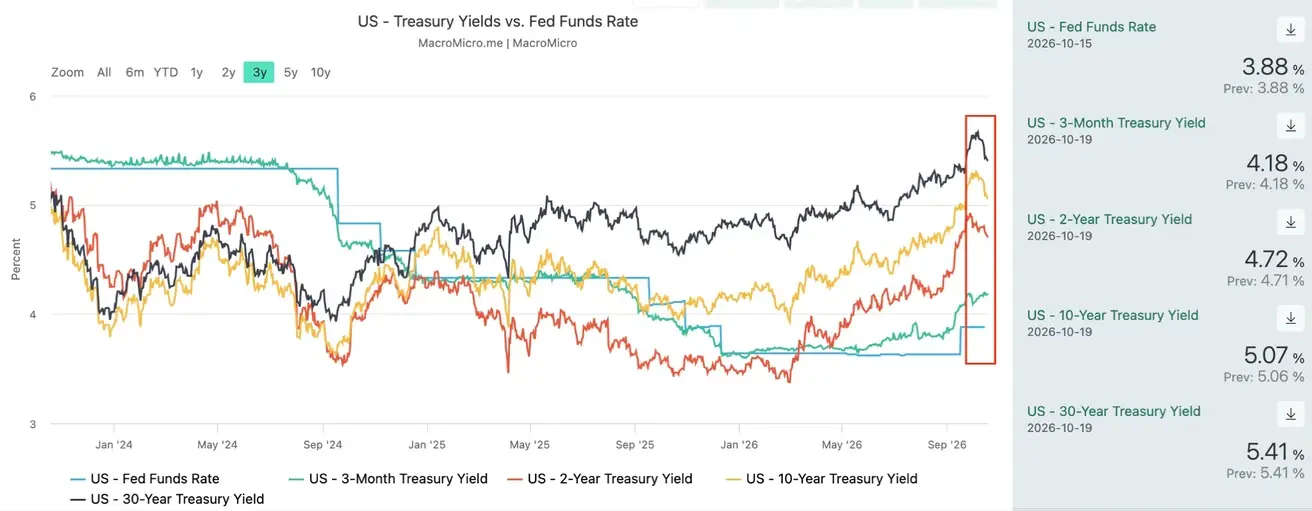
- The yield spread between 10-year and 2-year U.S. Treasury securities stands at 35 basis points (previous: 44 bps);
- The yield spread between 10-year and 3-month U.S. Treasury securities stands at 89 basis points (previous: 107 bps).
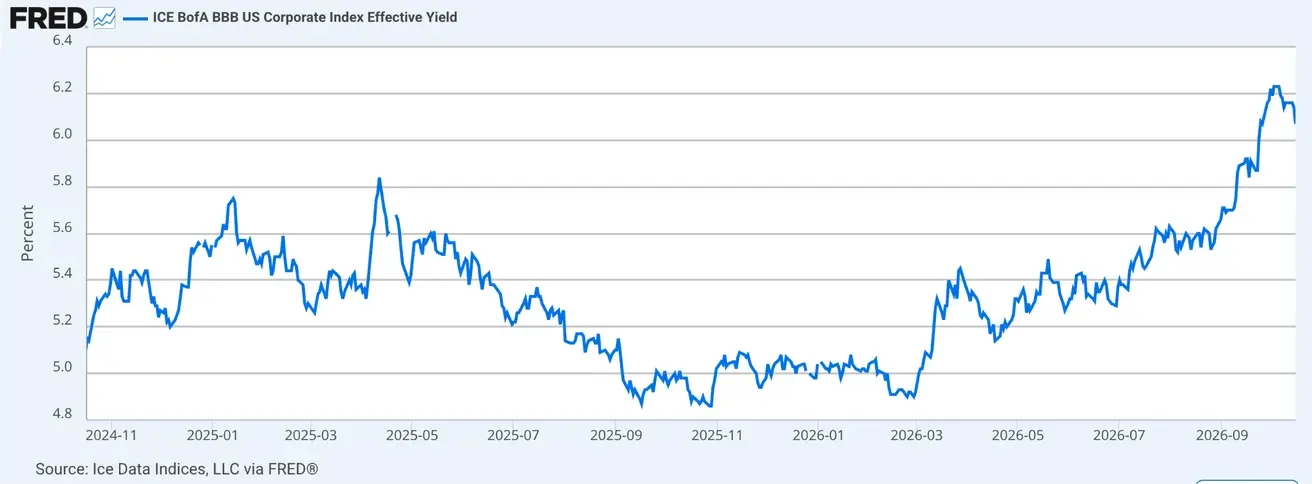
- ICE BofA BBB US Corporate Index Effective Yield: 6.07% (previous: 6.14%).
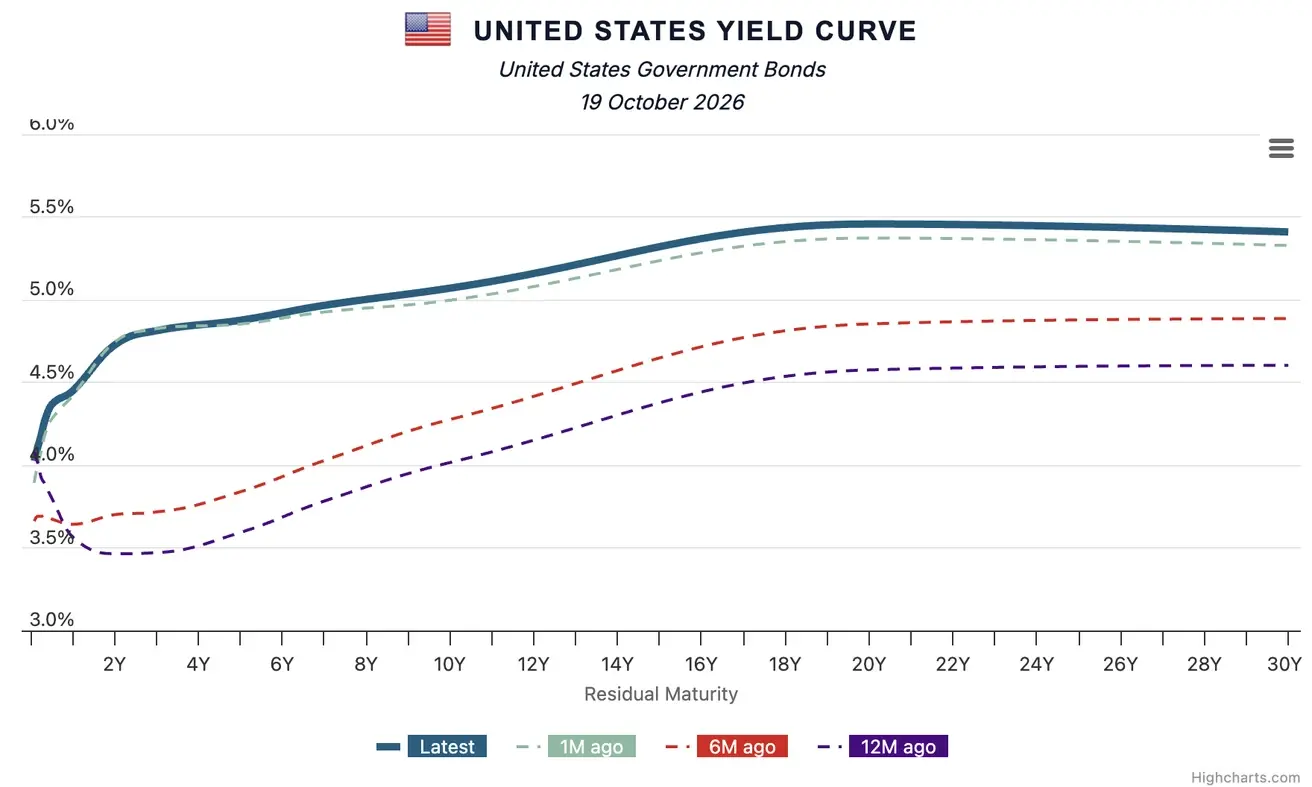
U.S. Treasury Yield Curve
The cost of a 5-year U.S. Credit Default Swap (CDS) — a market-based measure of sovereign default insurance — is 37.36 basis points (vs. 37.36 basis points a week earlier).
Stock Indices
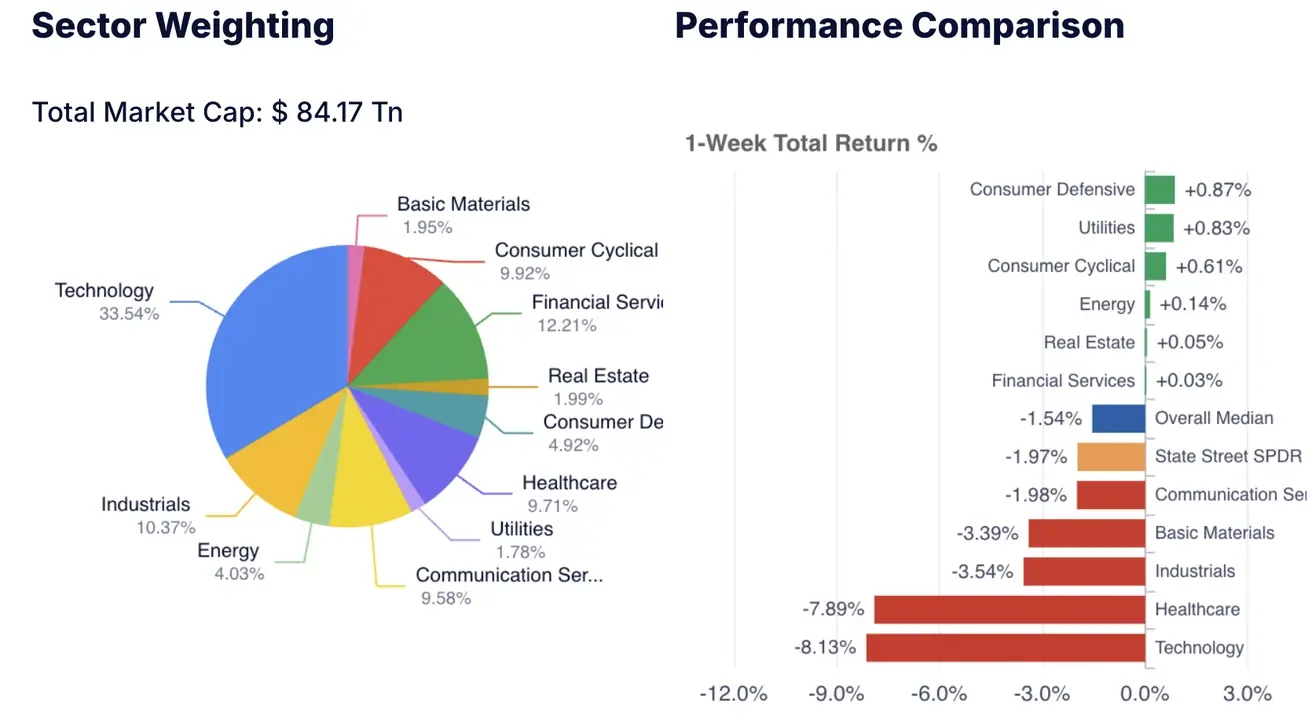
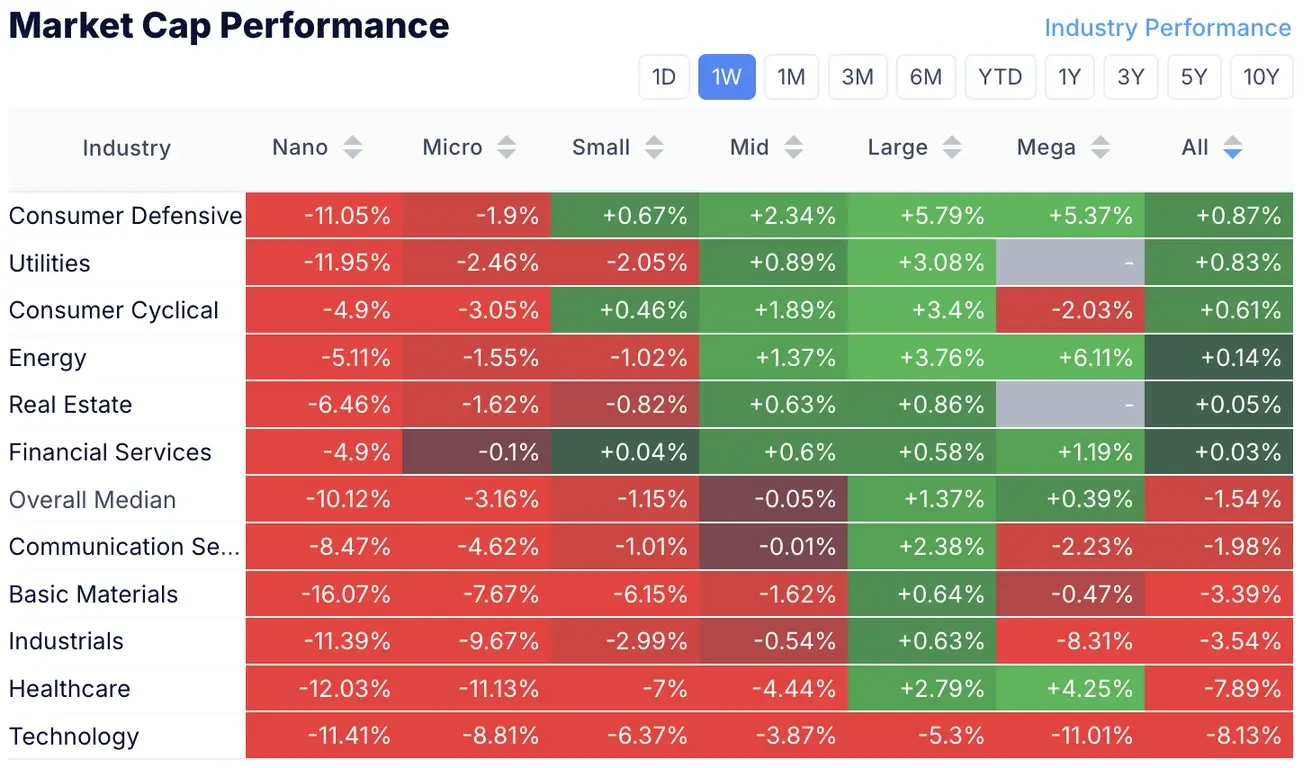
Following Wednesday’s inflation data, the stock market dipped briefly but closed Thursday above Wednesday’s level. A second wave of selling hit on Friday, though not because of inflation. The immediate driver was a continued heavy sell-off in AI and semiconductor stocks.
The market focused on CoreWeave: the yield on its 2031 bond climbed to around 15.8%, triggering negative sentiment about credit risk in AI infrastructure. Against this backdrop, AMD, Micron, Intel, Broadcom and other semiconductor stocks also came under heavy pressure.
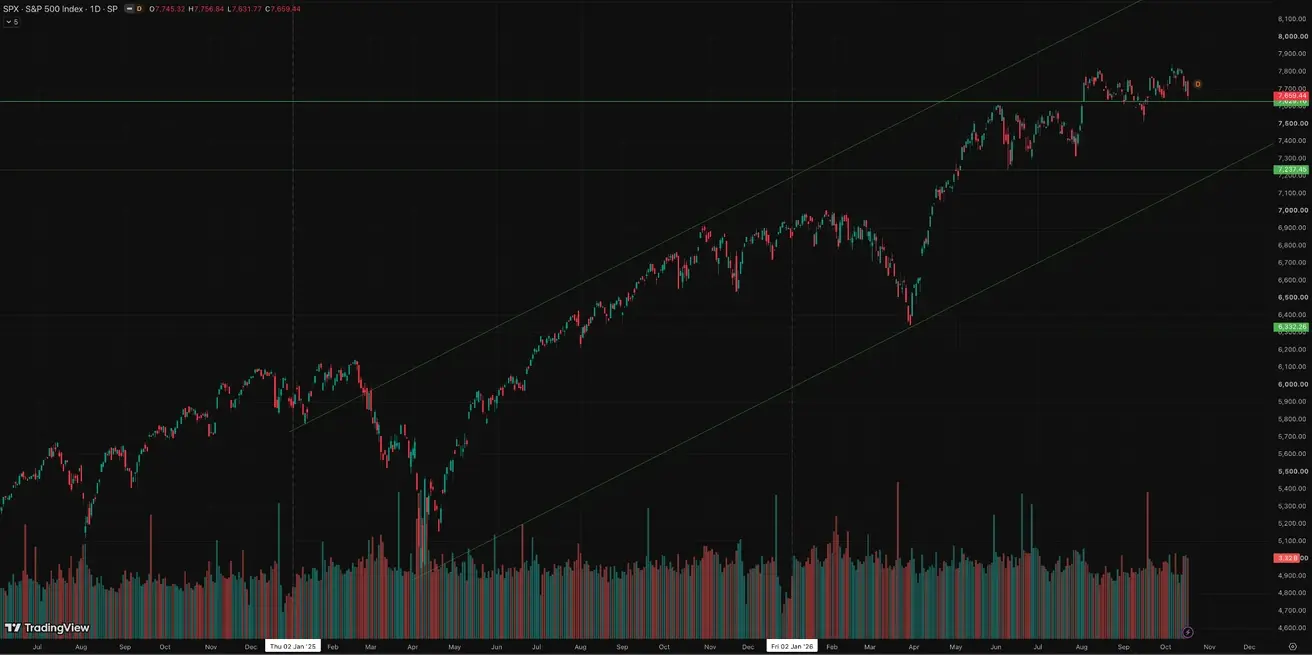
S&P500
Trading near its all-time high.
Weekly performance: -1,95% (week-end close: 7659,44); year-to-date: +11,89%.
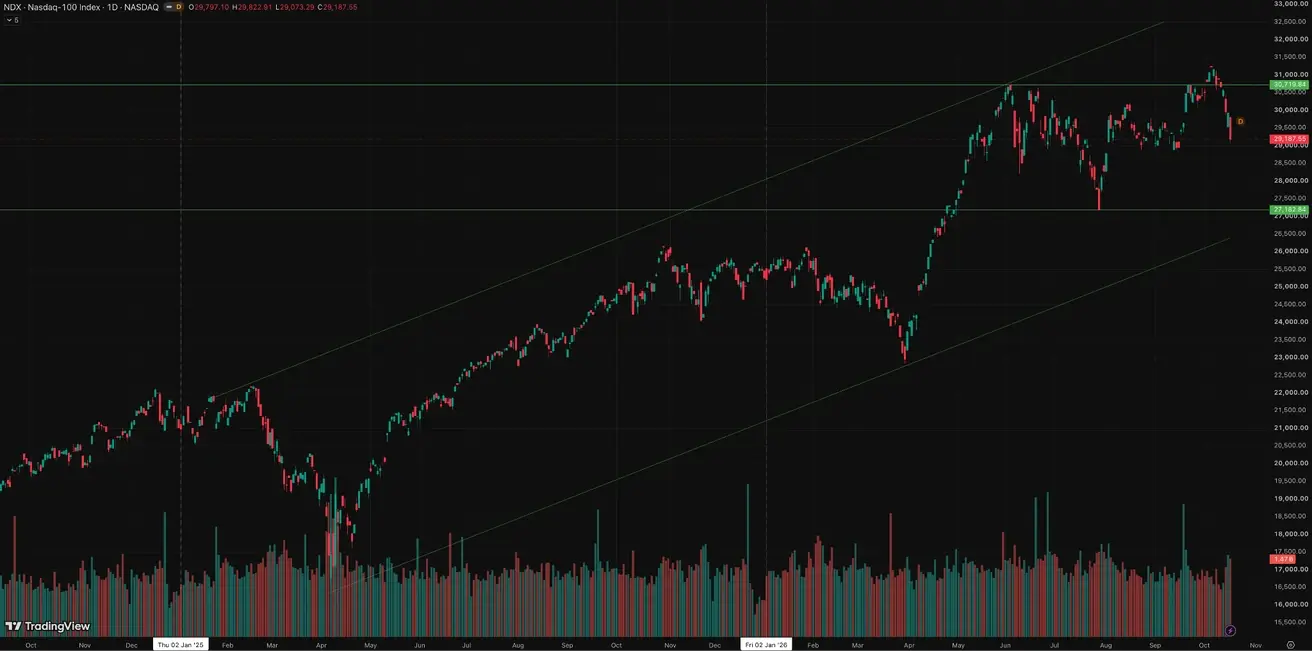
NASDAQ100
Weekly performance: -5,49% (week-end close: 29187,55); year-to-date: +15,59%.
VIX
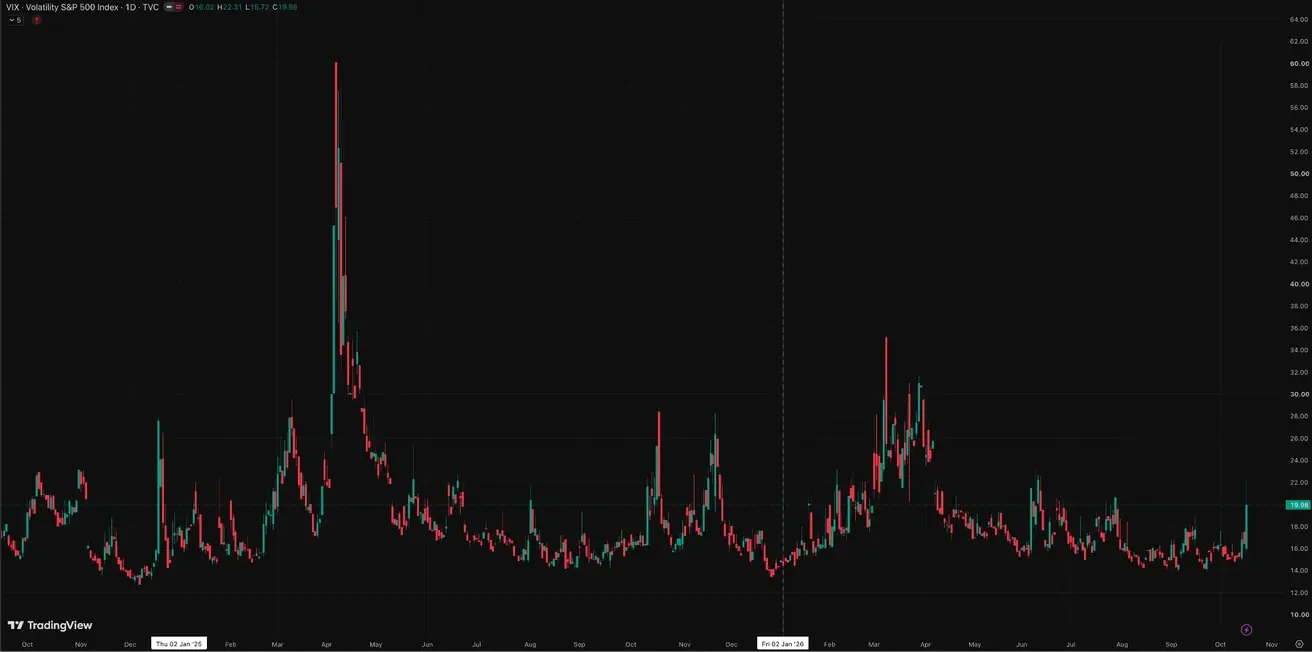
VIX (volatility index): week-end close at 19,98 points.
Earnings Season
Technology Sector
Performance: negative, despite strong earnings.
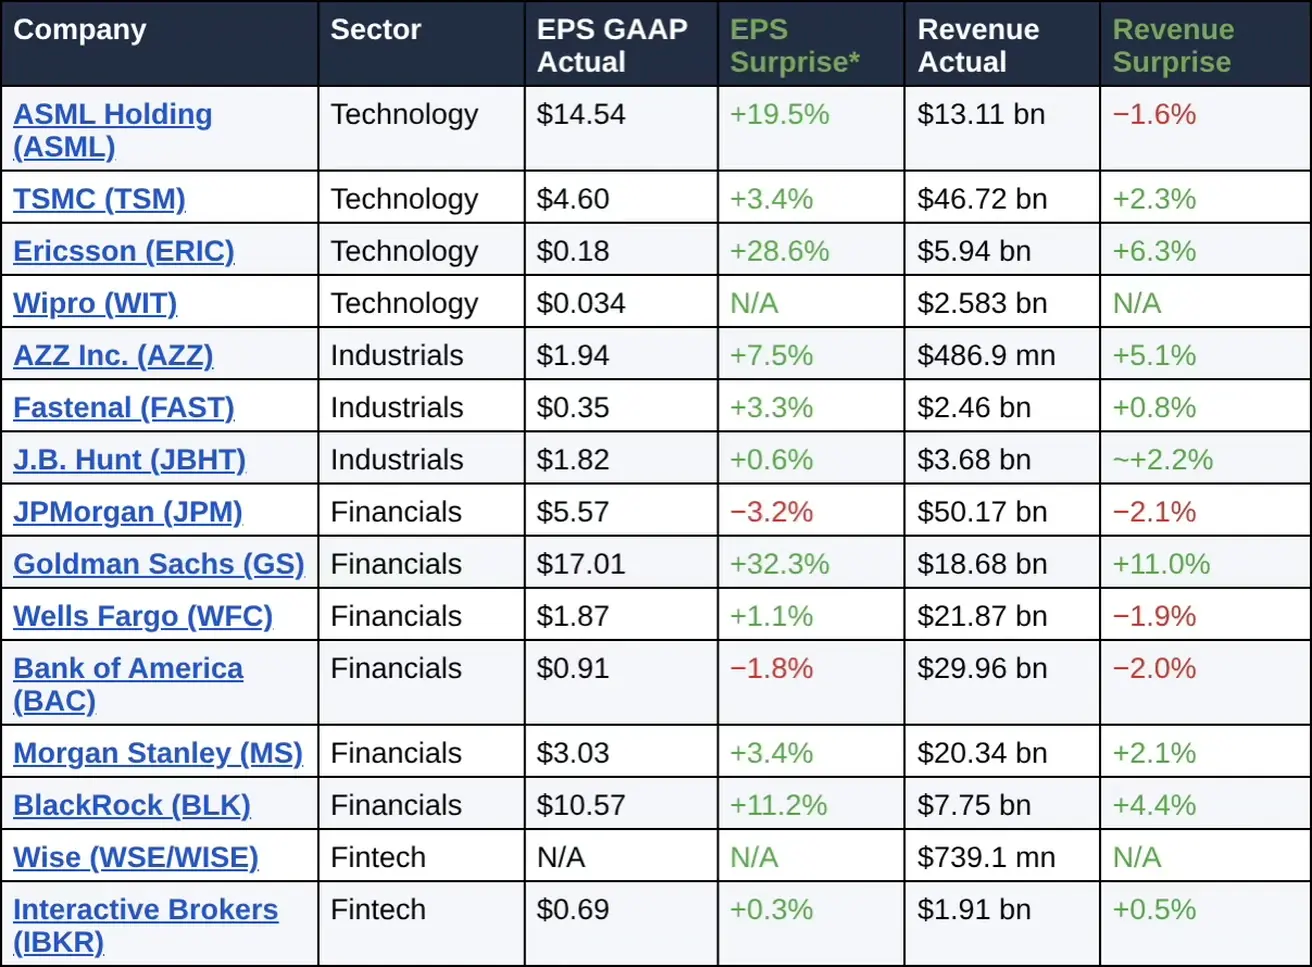
The technology sector came under pressure despite solid financial results from the largest semiconductor manufacturers. ASML and TSMC reported resilient demand for equipment and advanced chips, driven by investment in artificial intelligence. Ericsson also beat analyst expectations on network equipment sales and cost control. However, the positive results failed to offset investor concerns about the payback on AI infrastructure, rising borrowing costs, and stretched valuations of technology companies. Semiconductor stocks continued to fall. Nevertheless, stock repricing, not deteriorating company fundamentals, drove market dynamics.
Industrial Sector
Performance: moderately positive, with resilient operating metrics.
The industrial sector delivered relatively resilient results amid broader stock market volatility. Fastenal reported a 15.5% year-over-year increase in daily sales, driven by new large customer wins, price increases, and steady demand from industrial companies. Improved operating margins point to effective cost control. AZZ’s earnings and revenue beats also indicate continued activity in certain industrial segments. Despite inflation risks and high financing costs, the reports point to sustained demand and companies’ ability to maintain profitability in a challenging macroeconomic environment.
Banking Sector
Performance: positive.
The banking sector delivered strong results, reflecting increased activity in capital markets. The first wave of bank earnings showed that consumers and the corporate sector remain fairly resilient for now, credit losses are under control, and high rates continue to support net interest income. Goldman Sachs, Morgan Stanley, and BlackRock posted solid results backed by trading activity. Shares of most major banks rose.
Fintech Sector
Performance: fundamentally positive; market reaction mixed.
The fintech sector showed steady growth in operating metrics, driven by an expanding client base and higher financial transaction volumes. Wise reported accelerating cross-border transfers and raised its annual revenue growth guidance to the upper end of its previously stated range. Interactive Brokers beat analyst expectations on both earnings and revenue, growing client accounts by 35% year-over-year. However, trading volumes were mixed: equity trading activity declined despite the growth in total clients. Overall, the results point to resilient demand for digital financial services, although investors remain slightly cautious about further growth prospects.
Eurozone
- The ECB raised interest rates, while maintaining a hawkish stance as inflationary risks continue to increase;
- Against the backdrop of the conflict in the Middle East, the ECB revised its GDP forecasts downward and raised its inflation projections for the coming years.
ECB officials’ rhetoric:
ECB Executive Board member Frank Elderson (October 14): his speech focused on banks’ resilience to climate-related and other non-linear risks rather than on monetary policy. The main message: traditional risk models based on historical data work less well as shocks become sharper and more interconnected; banks therefore need larger buffers, stronger scenario analysis, and preparation for events that past statistics capture poorly. Elderson gave no new signal on rates.
ECB Chief Economist Philip Lane (October 13): his speech focused on artificial intelligence and productivity. His key thesis: Europe could reap significant gains from AI through higher productivity and innovation, but this requires investment in infrastructure, energy, financing, education, and technology adoption at the company level. At the same time, Lane noted that AI is creating a new source of electricity demand and requires large capital expenditure, so the economic impact will depend on Europe’s ability to scale up infrastructure and financing quickly. The ECB gave no direct monetary policy signal.
Overall, the ECB gave no new signals on rates. The general backdrop therefore remains unchanged: the ECB maintains its hawkish stance but is waiting for more data ahead of the October 29 meeting.
Macroeconomic Data
Interest Rates
- Deposit Facility Rate: 2.5% (previous: 2.25%);
- Marginal Lending Facility Rate: 2.9% (previous: 2.65%) — the rate at which banks can obtain overnight funding from the central bank;
- Main Refinancing Rate (Policy Rate): 2.65% (previous: 2.40%).
Macro data in brief: inflation in Europe shows no sharp acceleration for now but remains elevated. Against this backdrop, the real economy is cooling: industrial production continues to decline, and the trade balance has swung into deficit.
Inflation: Consumer Price Index (CPI) (September)
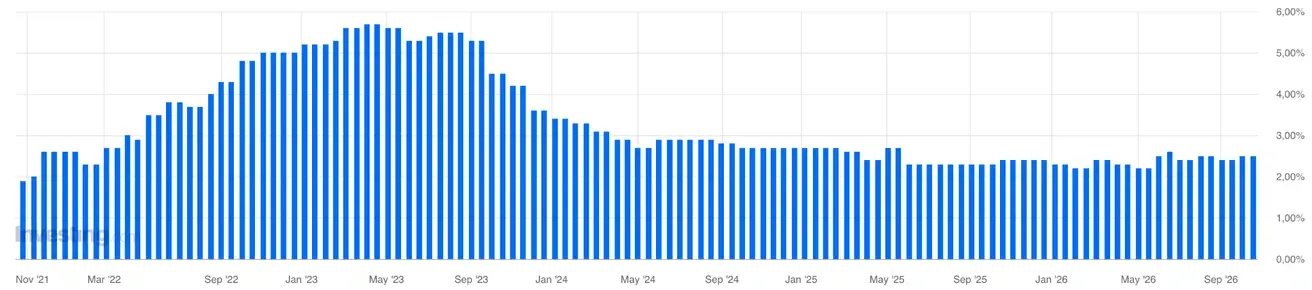
- Core CPI (YoY): 2.5% (previous: 2.4%);
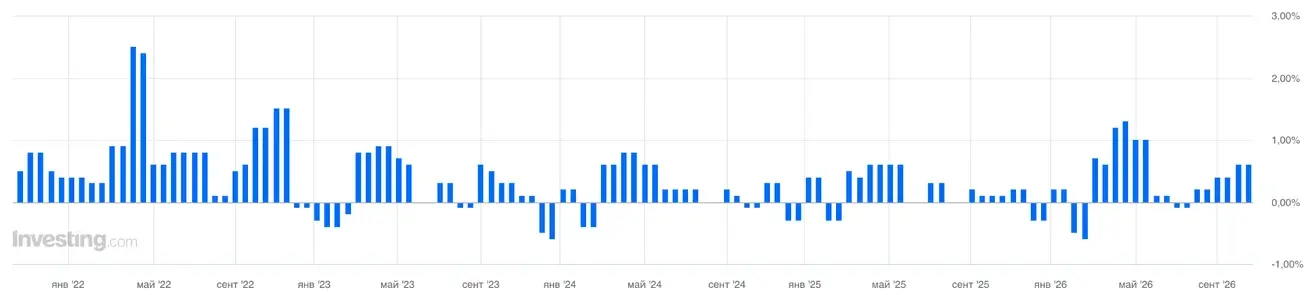
- Headline CPI: 0.6% (MoM) (previous: 0.4%);
- CPI: 3.8% (YoY) (previous: 3.2%).
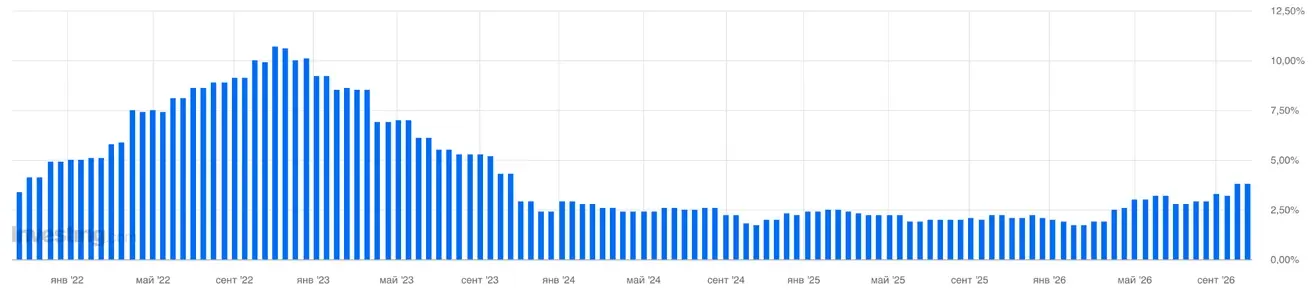
GDP (Q2 2026)
- QoQ: 0.6% (previous: -0.2%);
- YoY (final): 0.5% (preliminary estimate: 0.4%); (previous: 0.3%).
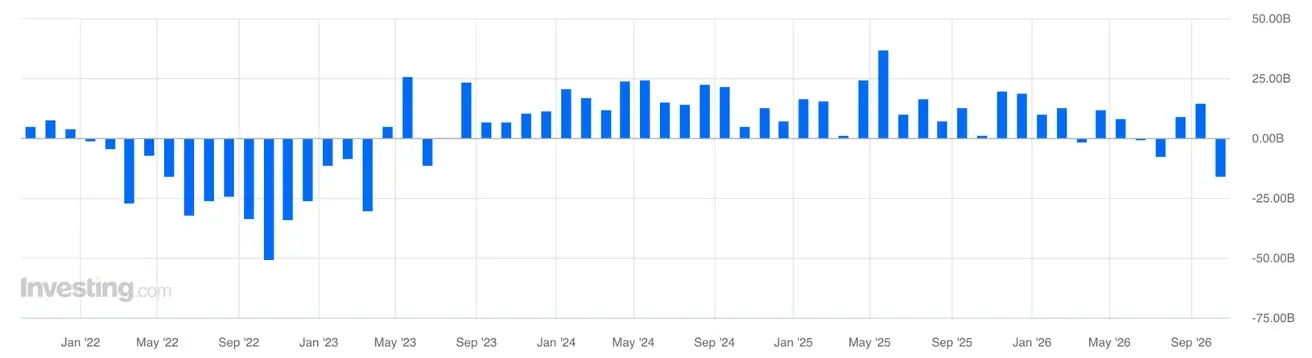
Trade Balance (USD)
(YoY): -16.1 bn (previous: 10.7 bn);
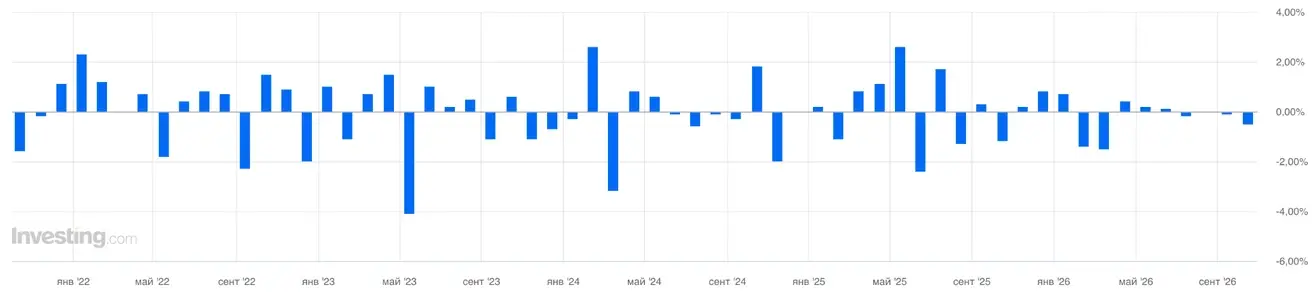
Industrial Production (September)
(MoM) -0.5% (previous: -0.3%, revised):
Unemployment Rate (August)
- 6.4% (previous: 6.4%).
Purchasing Managers’ Index (PMI) (September)
- Services PMI: 51.3 (previous: 51.3, revised);
- Manufacturing PMI: 52.9 (previous: 52.7);
- S&P Global Composite PMI: 52.0 (previous: 51.3).
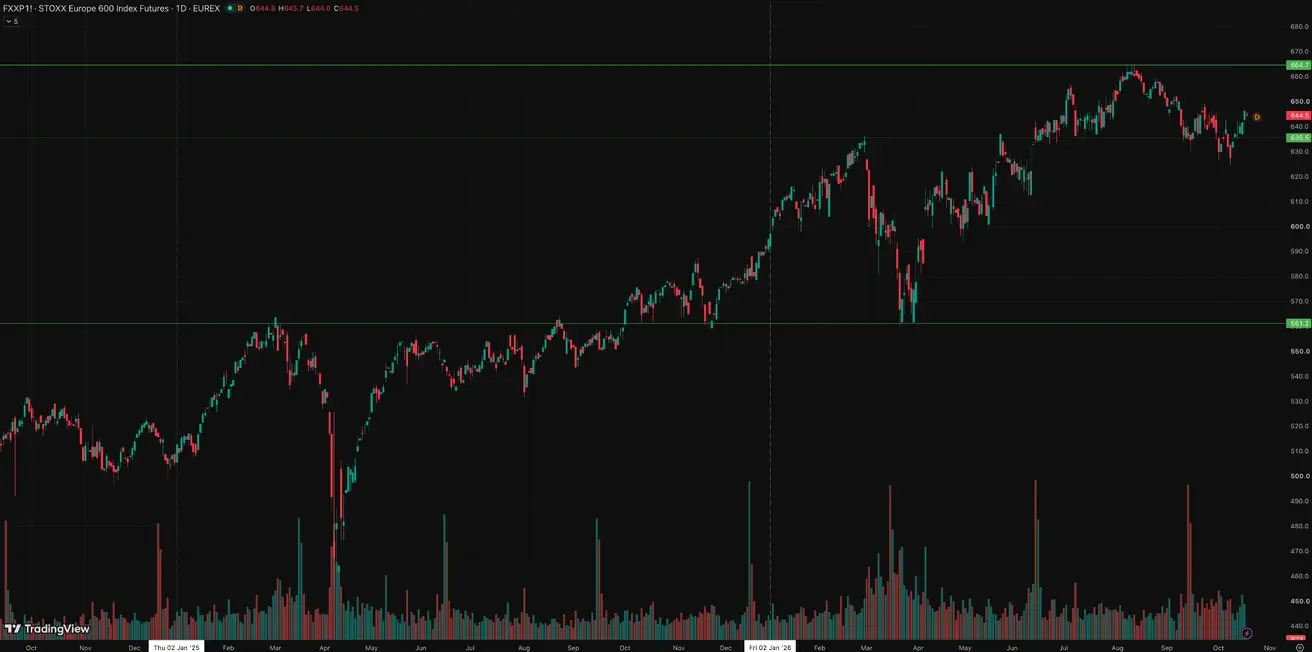
Euro Stoxx 600 (FXXP1!)
Weekly performance: +1,92% (week-end close: 646,10); year-to-date: +8,77%.
China
China’s economy continues to stabilize, supported by strong exports, while domestic demand and investment gradually recover. Policymakers remain measured and targeted in their approach to economic stimulus.
- Interest rates remain unchanged;
- Monetary policy remains accommodative;
- China reaffirmed its commitment to fiscal support for economic growth under its 2026 plan, including measures to stimulate domestic demand, optimize tax incentives and subsidies, and modernize industrial capacity.
Macroeconomic Data
Interest Rates
- 1-Year Loan Prime Rate (medium-term lending): 3.00%;
- 5-Year Loan Prime Rate (benchmark for mortgage lending): 3.50%.
Inflation Indicators (September)
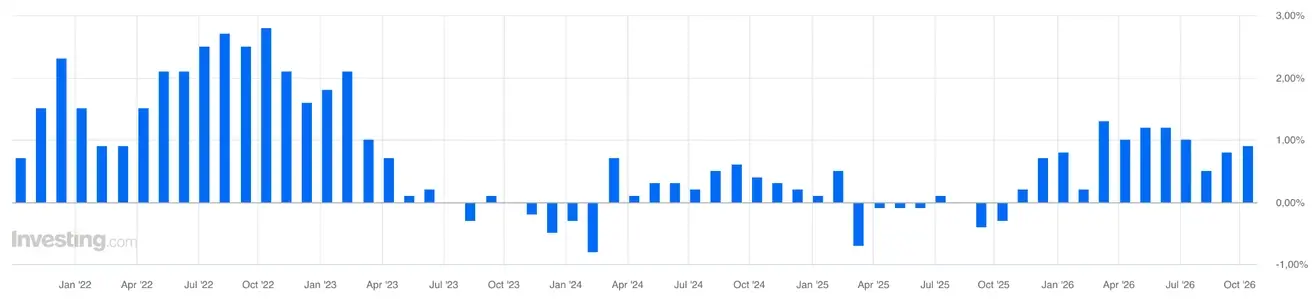
So far, China's accelerating inflation looks more like imported price pressure from energy and raw materials than a full-fledged recovery in domestic consumer demand.
September CPI rose only 0.9% YoY and 0.2% MoM, while core inflation excluding food and energy held at 1.0% YoY. Moreover, services prices fell 0.2% MoM in September, and food prices fell 1.7% YoY. This does not suggest a strong, consumer-driven domestic inflationary impulse.
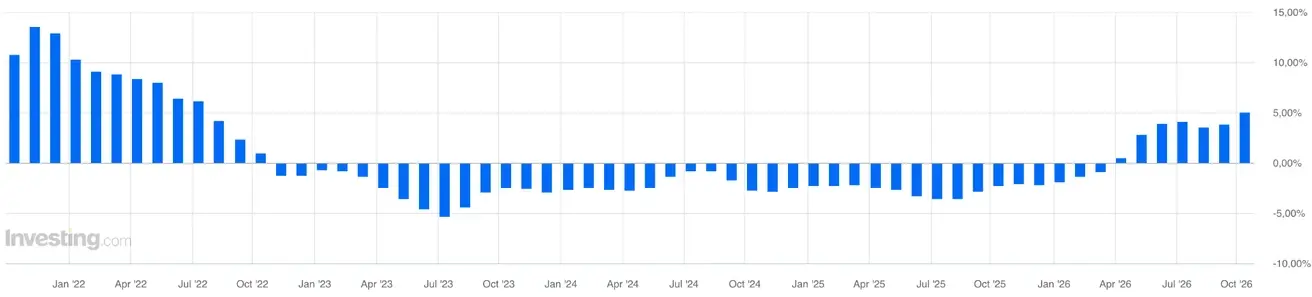
PPI paints the opposite picture: +5.0% YoY and +1.2% MoM, with almost all of the increase coming through production inputs. Prices of producer goods rose 6.5%, mining 25.4%, and raw materials 9.4%. Producer purchase prices rose even more — by 6.9% YoY. Fuel and energy (+13.6%), chemical raw materials (+12.6%), and non-ferrous metals (+20%) stand out.
Thus, domestic demand remains too weak for companies to fully pass rising costs on to consumers. As a result, business margins may be squeezed for some time before part of the pressure feeds through to retail prices.
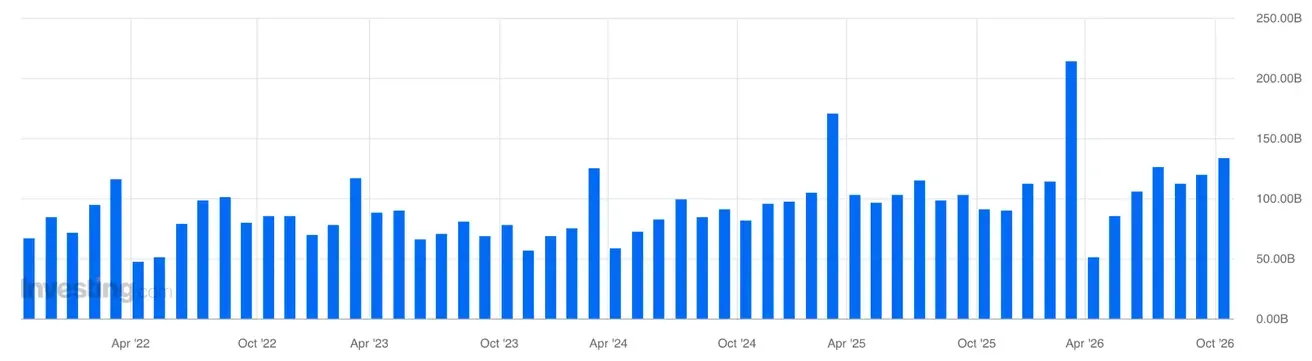
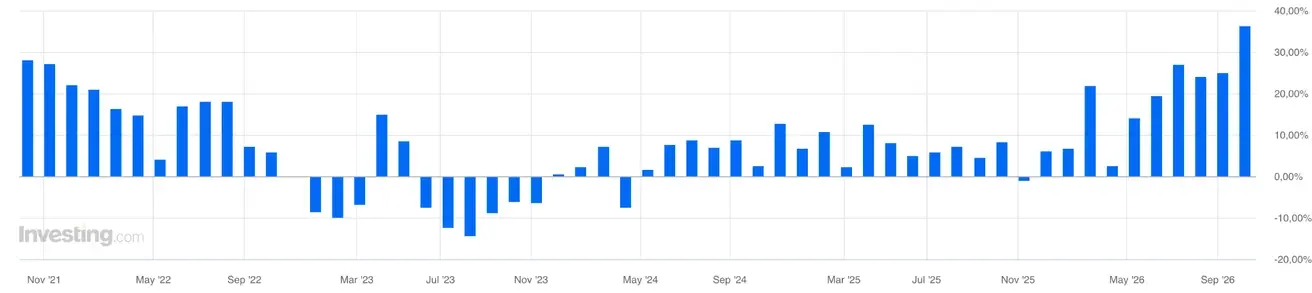
Foreign trade, however, is doing well: China’s exports rose 36% year-over-year in September — the fastest pace since February, despite U.S. tariffs. Imports increased by 31%, and the trade surplus reached nearly $134 bn, beating economists’ forecasts.
The main growth driver was the global AI boom: shipments of high-tech products rose by almost 64%. Exports to the U.S. jumped 40% — the fastest pace in more than five years.
- Consumer Price Index (CPI): 0.2% MoM (previous: 0.4%)
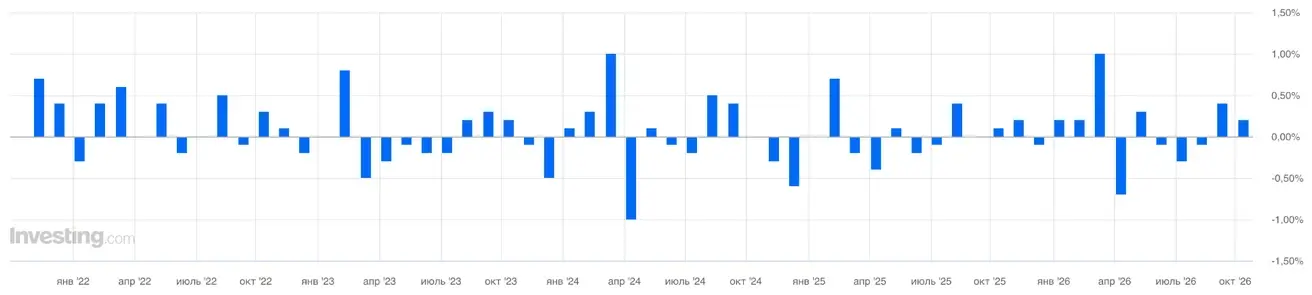
- Consumer Price Index (CPI): 0.9% YoY (previous: 0.8%)
- Producer Price Index (PPI): 5.0% YoY (previous: 3.8%).
Trade Data (September)
Trade balance (USD) (YoY): $133.53 bn (previous: $119.9 bn);
Imports: 31.0% YoY (previous: 28.2%);
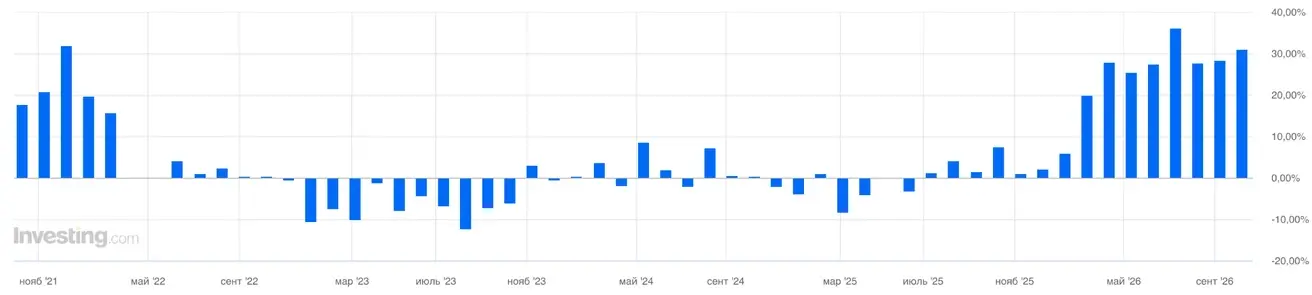
Exports: 36.3% YoY (previous: 25.0%);
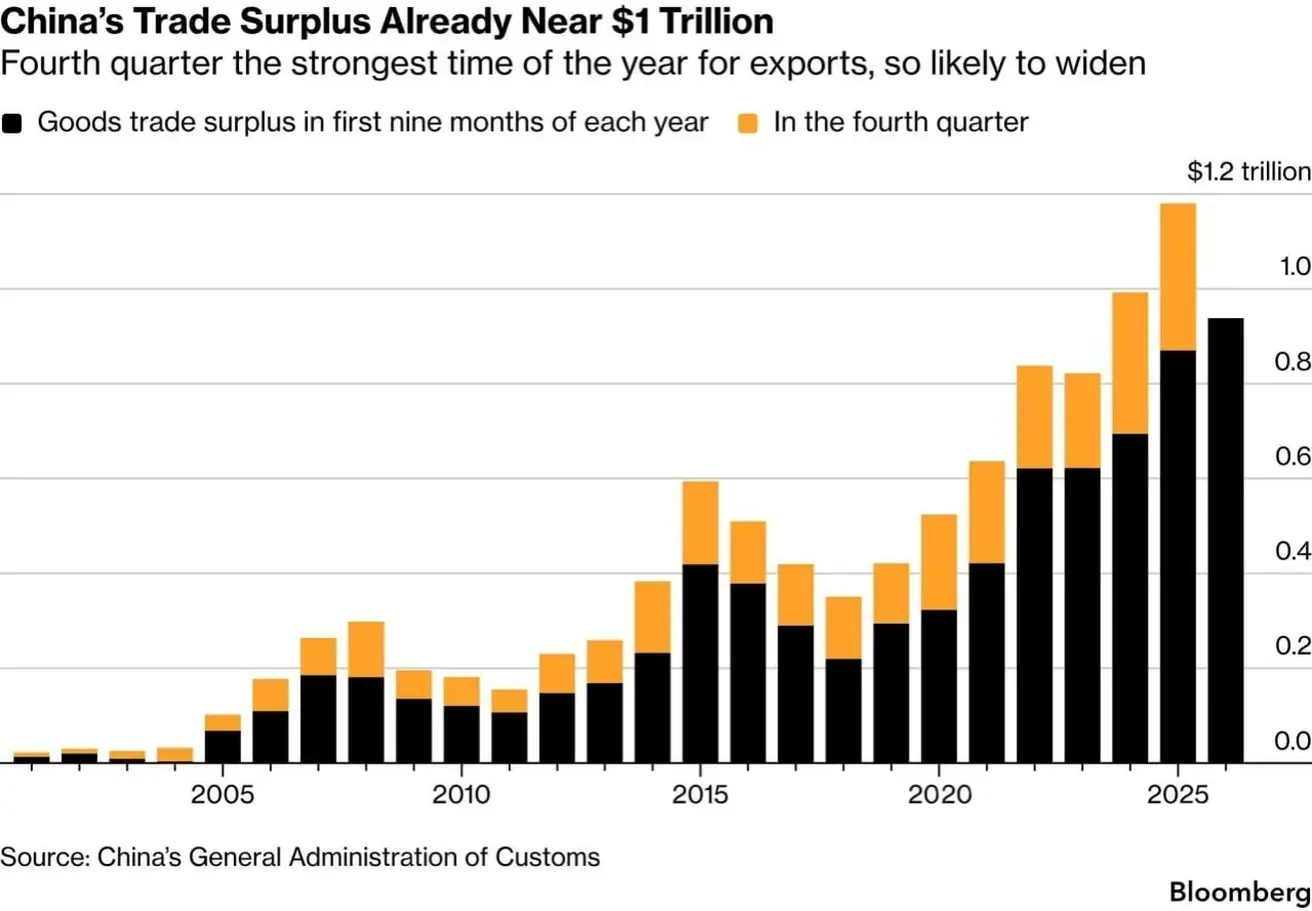
Year-to-date, China’s trade surplus has already reached $938 bn and is forecast to exceed the record $1.2 trillion set a year earlier by the end of 2026.
GDP (Q2 2026)
- QoQ: 0.9% (previous: 1.3%);
- YoY: 4.3% (previous: 5.0%).
This is below the target trajectory and reflects weaker domestic momentum.
Labor Market
- Unemployment Rate (August): 5.3% (previous: 5.2%).
Industrial Activity
- Industrial Production (August, YoY): 5.2% (previous: 4.5%).
Fixed Asset Investment
- August, YoY: -7.2% (previous: -6.7%).
Retail Sales
- July, YoY: 0.6% (previous: 0.9%).
Purchasing Managers’ Indices (PMI) (August)
- Manufacturing PMI: 50.1 (previous: 49.8);
- Non-Manufacturing PMI: 50.2 (previous: 49.0);
- Composite PMI: 50.7 (previous: 49.5).
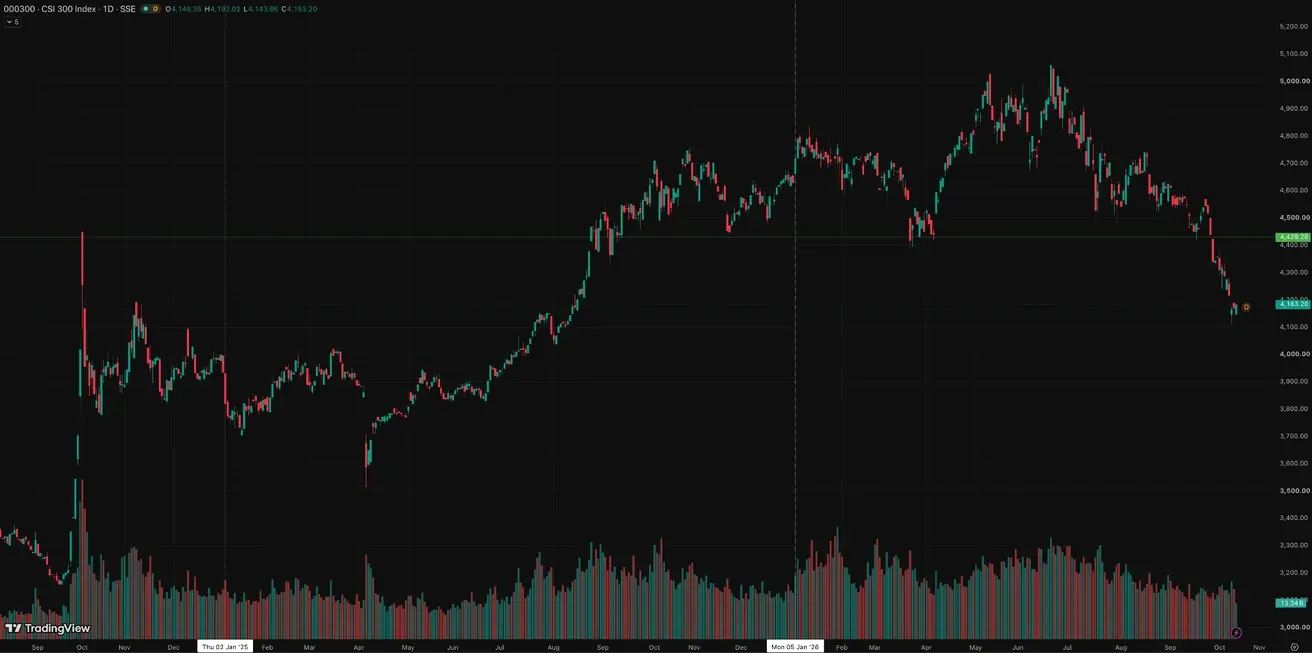
China’s stock index fell on news that a trade agreement with the U.S. restricted Taiwan’s AI chip exports to China.
CSI 300 Index (000300.HK)
Weekly performance: -3,40% (week-end close: 4170,61); year-to-date: -10,53%.
Gold Futures (GC)
Weekly performance: -0,57% (week close: $4215,8 per troy oz); year-to-date: -2,68%
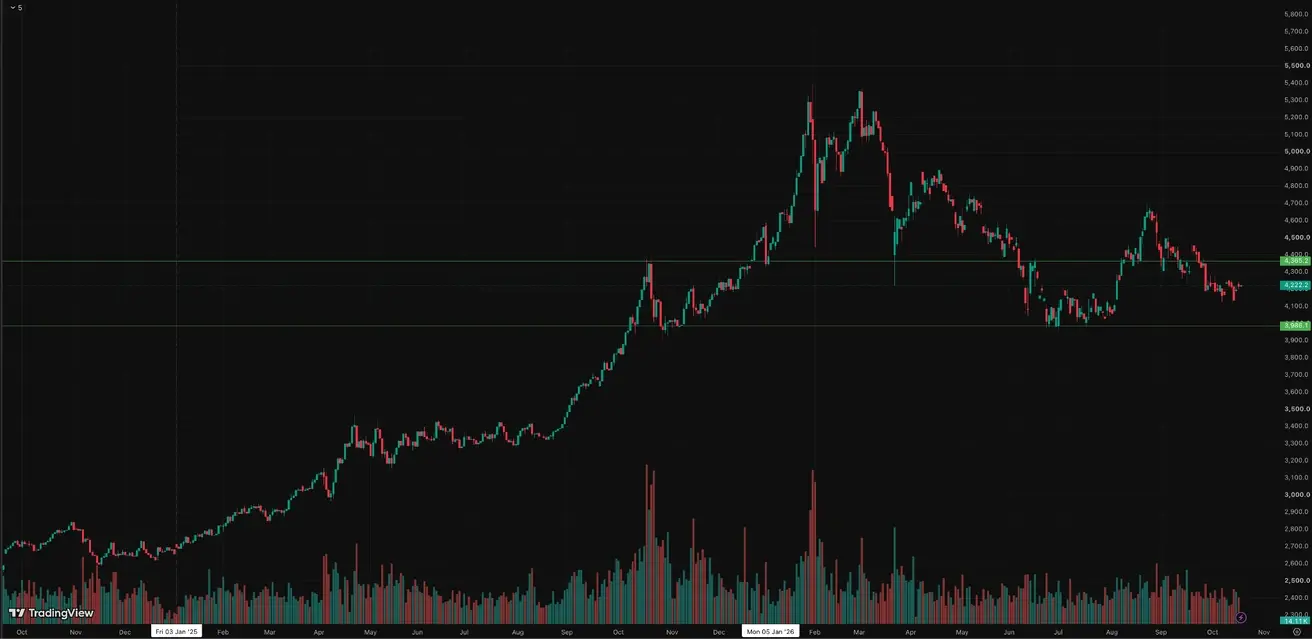
According to preliminary World Gold Council data, central banks bought about 63 tonnes of gold in September — the largest monthly volume since November 2024. China also continues to build up its gold reserves, which have reached approximately 2,410 tonnes.
According to Bloomberg, the National Bank of Kazakhstan plans to reduce gold's share of its international reserves from about 78% to 75% by the end of 2026. The main reasons are the high concentration of reserves in gold and the growing appeal of dollar-denominated bonds amid multi-year highs in Treasury yields.
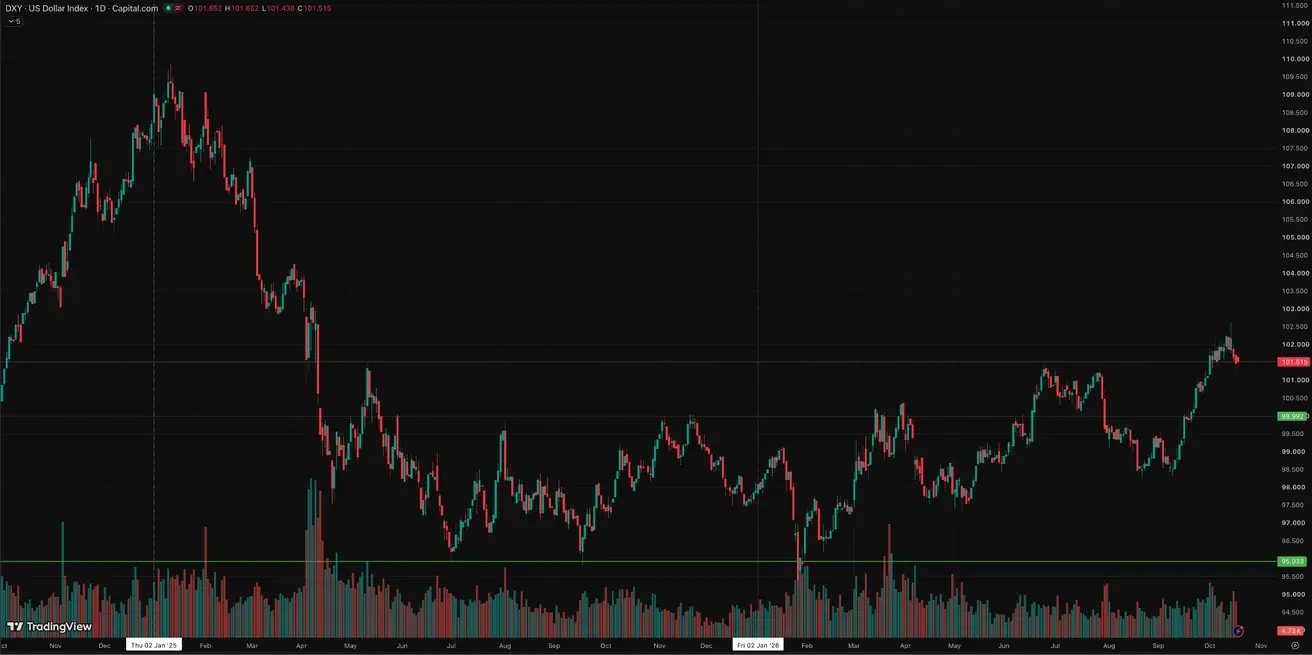
Dollar Index Futures (DX)
Weekly performance: -0,43% (week close: 101,46); year-to-date: +3,54%.
Oil Futures
Weekly performance: +7,81% (week close: $99,02 per barrel); year-to-date: +72,48%
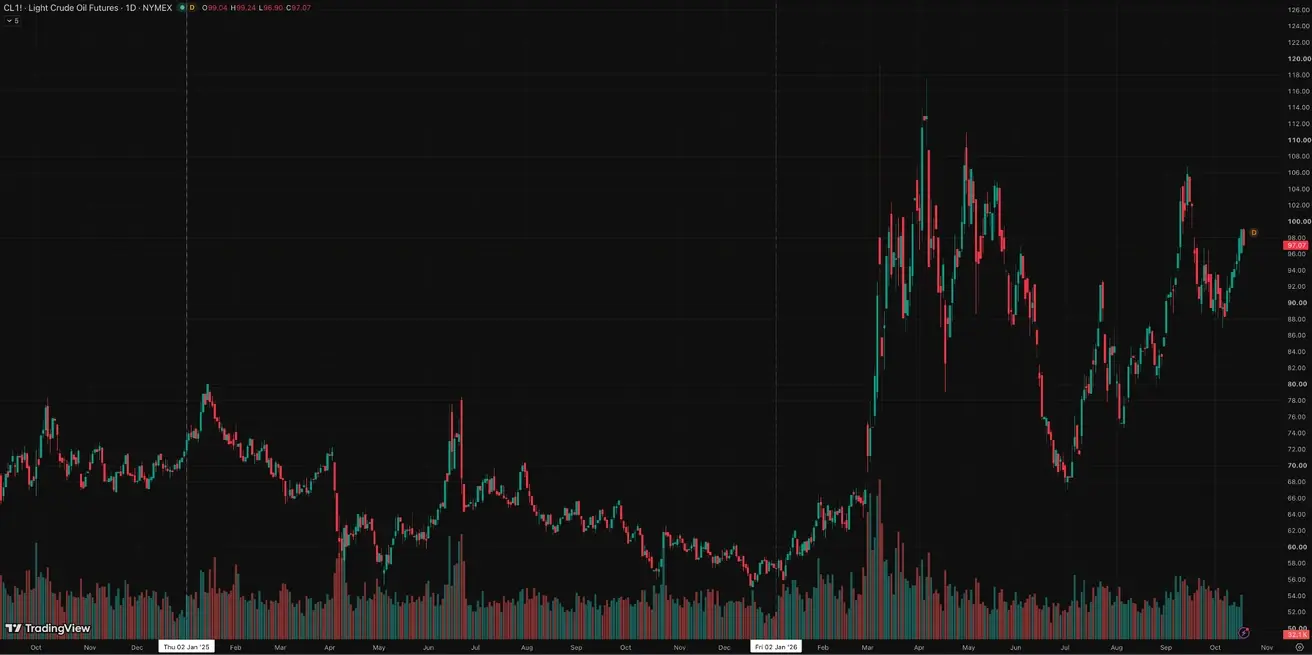
OPEC+ monthly report: the organization maintained its current course toward stabilizing the oil market but announced no new quota changes. The focus has shifted to supply risks: disruptions on maritime routes have sharply increased the cost of shipping and insuring oil, constraining physical flows and adding to inflationary pressure.
Crypto Market
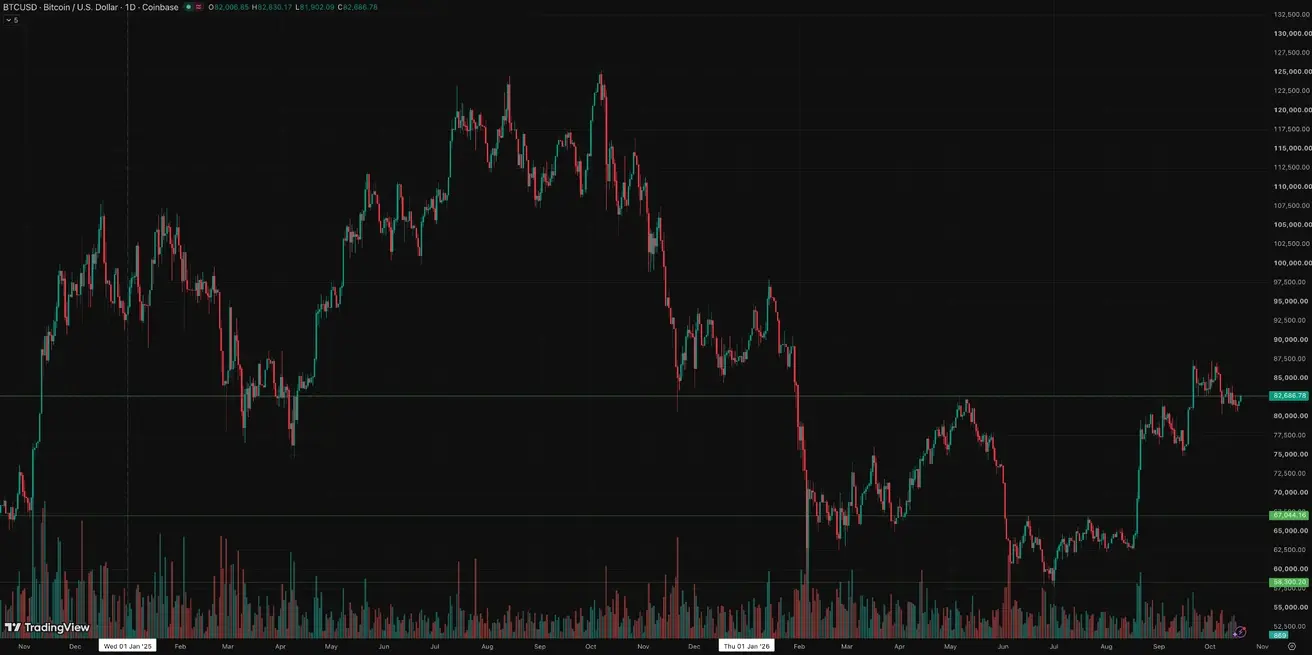
BTC Futures
Weekly performance: -2,00% (week close: $82,006.85); year-to-date: -6,51%.
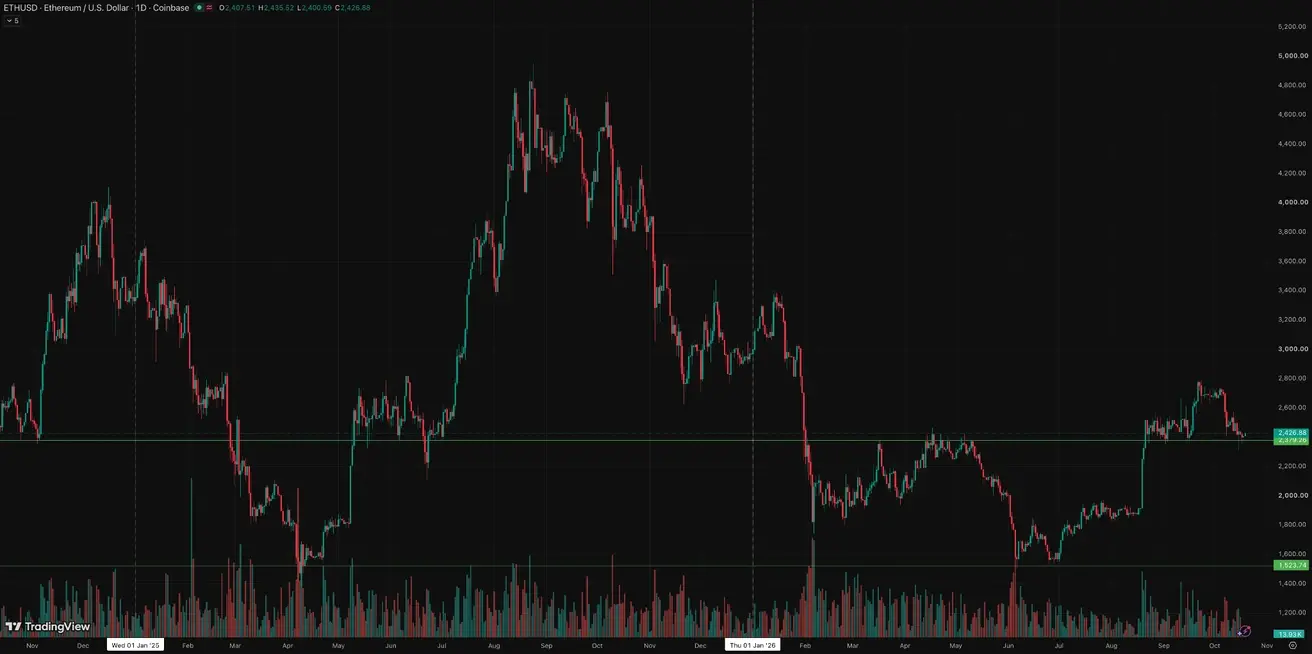
ETH Futures
Weekly performance: -5,00% (week close: $2407,51); year-to-date: -19,05%.
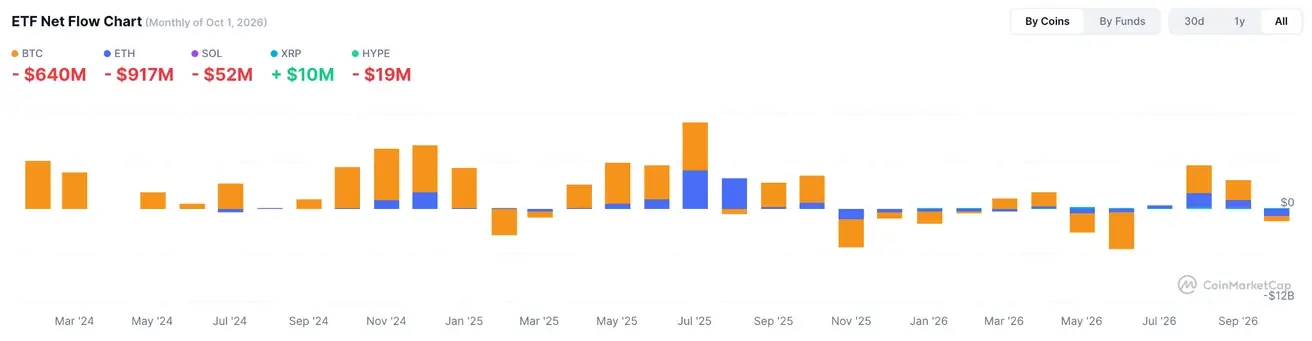
ETF Net Flows