Русский
 Қазақша
 Eesti
EestiSeptember 28 – October 4, 2026: Weekly economic update
Key market updates

Key Takeaways:
- The policy rate was raised to a range of 3.75 - 4.00%; rhetoric is hawkish;
- Monetary policy remains moderately restrictive;
- U.S. macroeconomic data continue to support a soft-landing scenario: inflation risks are increasing, the labor market is cooling without signs of recession, and current conditions do not yet warrant a rate cut.
- The Fed slightly improved its GDP and employment forecasts; it raised near-term inflation forecasts.
Inflation: Consumer Price Index (August)
- Core CPI (MoM): 0.3% (previous: 0.2%).
- Core CPI (YoY): 2.4% (previous: 2.5%).
- CPI (MoM): 0.4% (previous: 0.1%).
- CPI (YoY): 3.4% (previous: 3.4%).
Producer Price Index (August)
- PPI (MoM): 0.4% (previous: 0.0%).
- Core PPI (MoM): 0.3% (previous: 0.2%).
Inflation Expectations (Michigan) (September)
- 12-month Inflation Expectations: 4.6% (previous: 4.6%).
- 5-Year Inflation Expectations: 3.4% (previous: 3.3%).
The Fed’s preferred inflation gauge shows no upward momentum.
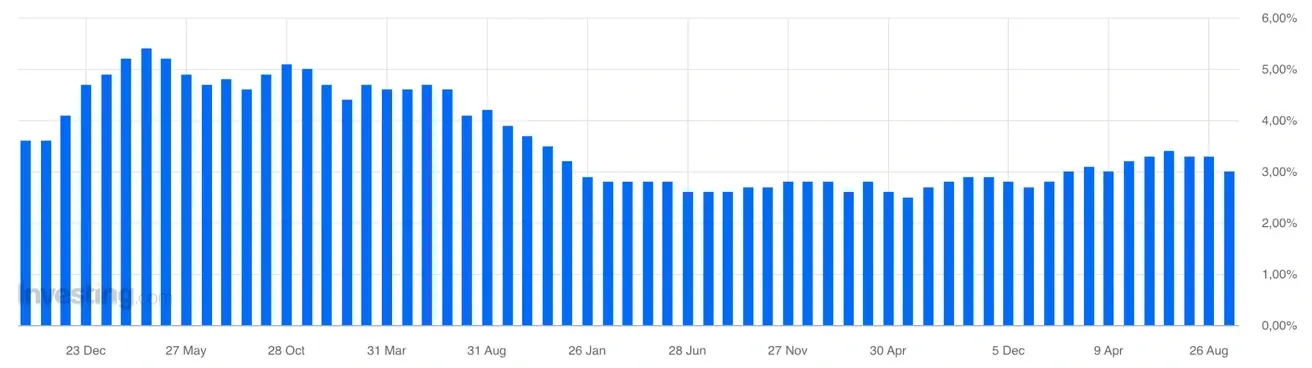
Core PCE Price Index (August): MoM: 0.2% (previous: 0.1%); YoY: 3.0% (previous: 3.7%):
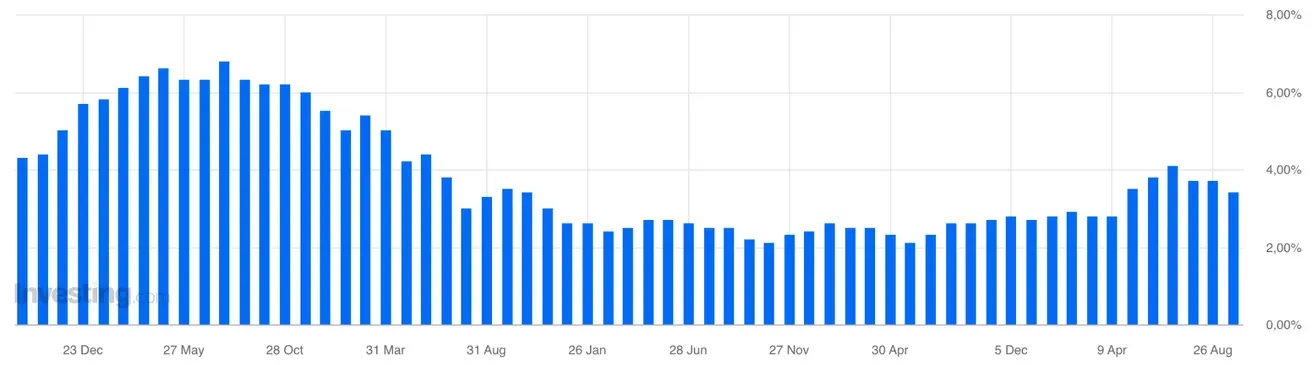
Headline PCE Price Index (August): MoM: 0.3% (previous: 0.1%); YoY: 3.4% (previous: 3.7%):
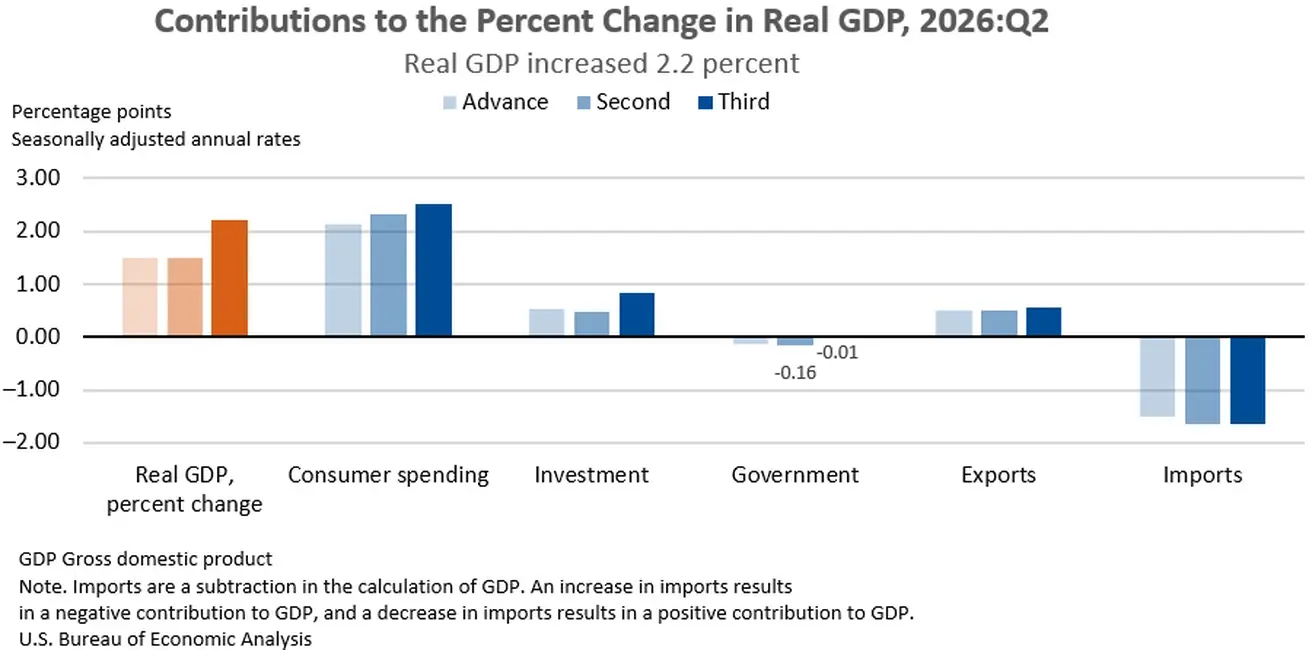
GDP (U.S. Bureau of Economic Analysis, BEA) — Q2 2026 annualized, third estimate: 2.2% (second estimate: +1.5%; Q1 2026 was revised from +2.1% to 2.5%).
In the third estimate, real GDP rose 0.7 percentage points from the second estimate, mainly reflecting upward revisions to investment, consumer spending, and government spending.
GDPNow (the Atlanta Fed’s real-time estimate of official GDP growth ahead of release (Q3 2026)): 3.7% (previous: 5.0%).
Trade balance (July): -$88 bn (-$71.2 bn).
Labor Market (BLS) (September)
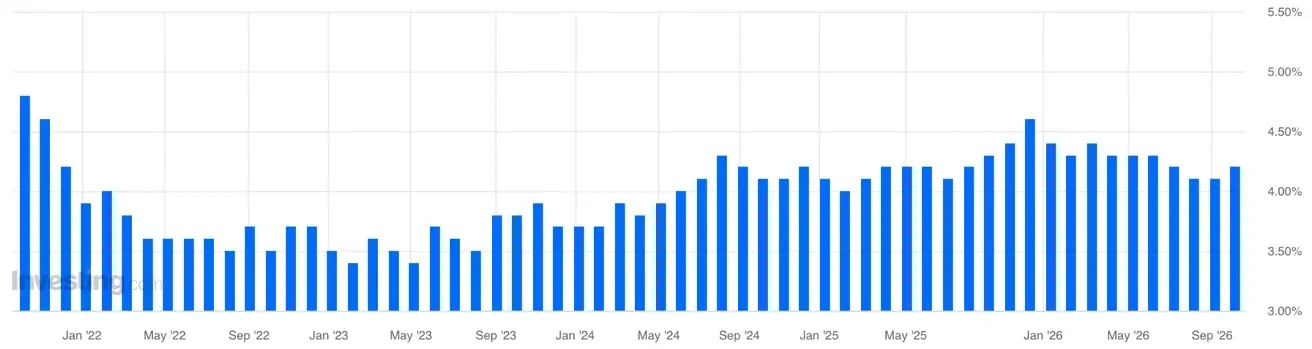
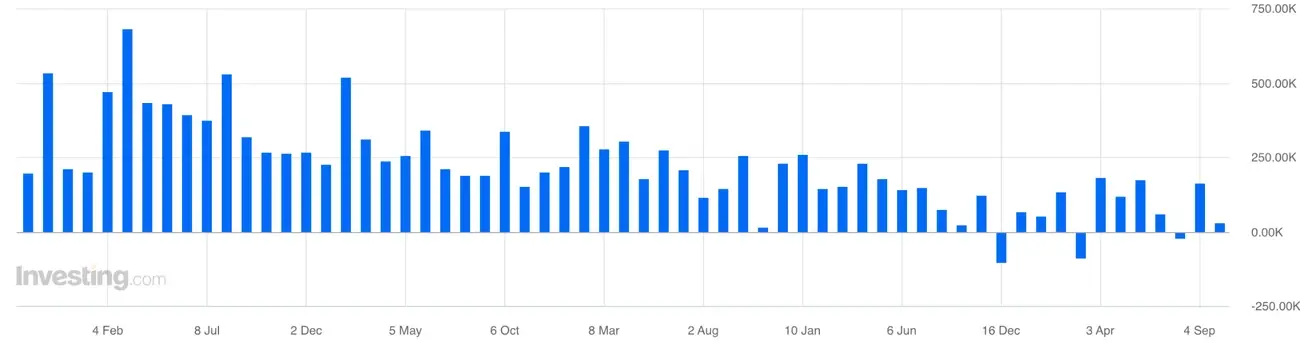
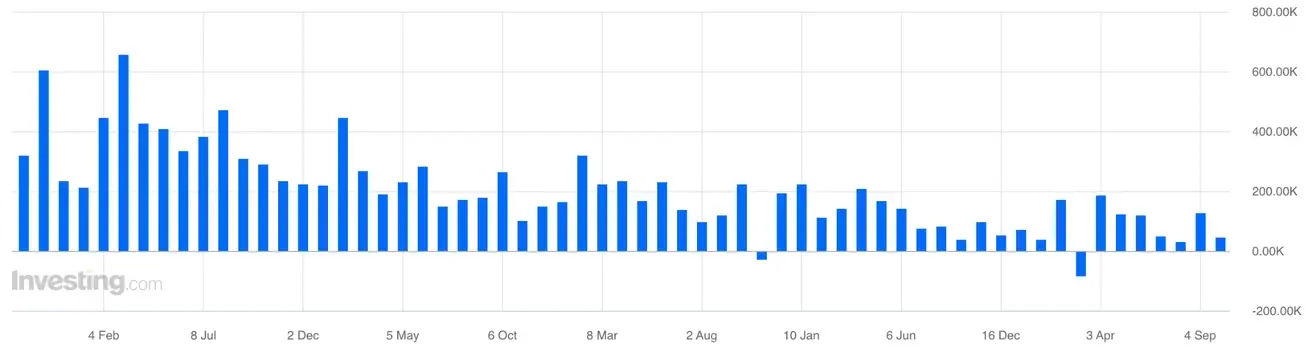
The U.S. labor market continues to cool gradually: unemployment rose to 4.2%, job growth in September slowed to 29K (46K in the private sector), and prior months were revised down.
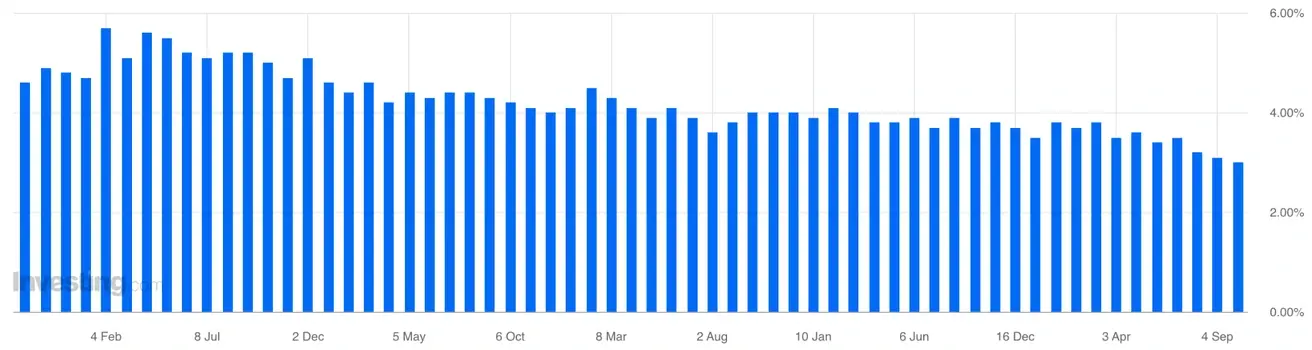
Wage growth slowed to 3.0% YoY. At the same time, layoffs remain low, so for now this points to weak hiring rather than a sharp deterioration in the labor market. Still, the overall trend is gradually narrowing the Fed’s room for further tightening.
- Unemployment rate: 4.2% (previous: 4.1%):
- Total number of people receiving unemployment benefits in the U.S.: 1,701K (previous: 1,719K);
- Initial jobless claims: 197K (previous: 196K);
- Change in nonfarm payrolls: 29K (previous: 133K, revised):
- Change in private nonfarm payrolls: 46K (previous: -89K, revised):
- Average hourly earnings (YoY): 3.0% (previous: 3.1%):
- JOLTS job openings: 7.271M (prev: 6.866M).
Business Activity Index (PMI) (August)
(Above 50 indicates expansion; below 50 indicates contraction)
- Services PMI: 58.7 (previous: 56.5).
- Manufacturing PMI: 55.9 (previous: 57.0).
- Composite PMI: 58.4 (previous: 56.0).
Monetary Policy
Key takeaways from Fed officials’ speeches:
- Minneapolis Fed President Neel Kashkari (September 30, Council on Foreign Relations): the message was moderately hawkish — further rate hikes are possible. He expects the Fed will likely need to raise rates further if the economy and inflation evolve in line with current expectations. However, he stressed that the September FOMC projections are merely a “snapshot in time,” not a commitment to a predetermined path.
- John Williams (New York Fed): views the U.S. economy as resilient and the labor market as strong, while inflation at around 3.7% is still too high. The main sources of pressure right now are energy, geopolitics, and strong demand tied to AI investment. After the September rate hike, there is no need to rush further moves; however, if the economy evolves along the current scenario, one more rate hike before year-end may be warranted.
- Christopher Waller: his speech last week focused primarily on the development of payment infrastructure and the use of AI in the financial system rather than on the rate path. He highlighted AI’s potential to improve the efficiency of cross-border payments, combat fraud, and automate settlements, while emphasizing the need for reliability, security, and oversight of new technologies. He gave no new direct signal on monetary policy.
- Michelle Bowman: The main focus was on bank regulation and the functioning of the Treasury market. Bowman noted that the previous leverage ratio requirements had overly constrained large banks’ ability to act as intermediaries in the Treasury market, so adjusting them should improve market liquidity and resilience. This speech also offered no new signals on rates or inflation.
Overall, the rhetoric supports a “higher for longer” scenario with the possibility of one more hike, but without a predetermined path. However, macroeconomic data are beginning to constrain hawkish policy. Accordingly, market expectations for monetary policy have improved.
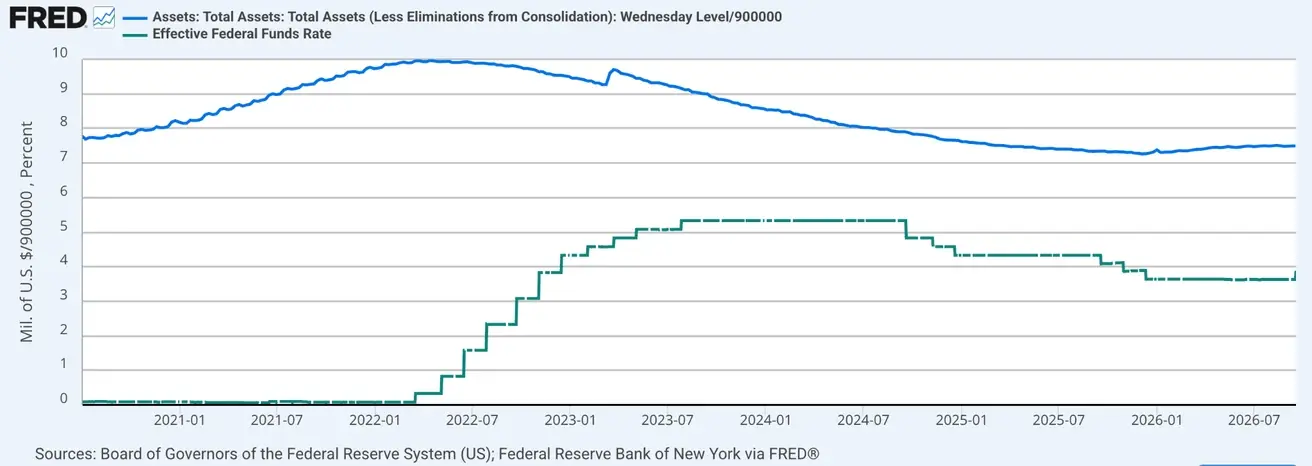
Federal funds rate (EFFR): 3.75%–4.00%
Federal Reserve balance sheet: $6.743 trillion, +3.18% since the end of QT ($6.535 trillion):
Market Forecast for Rate (FedWatch)
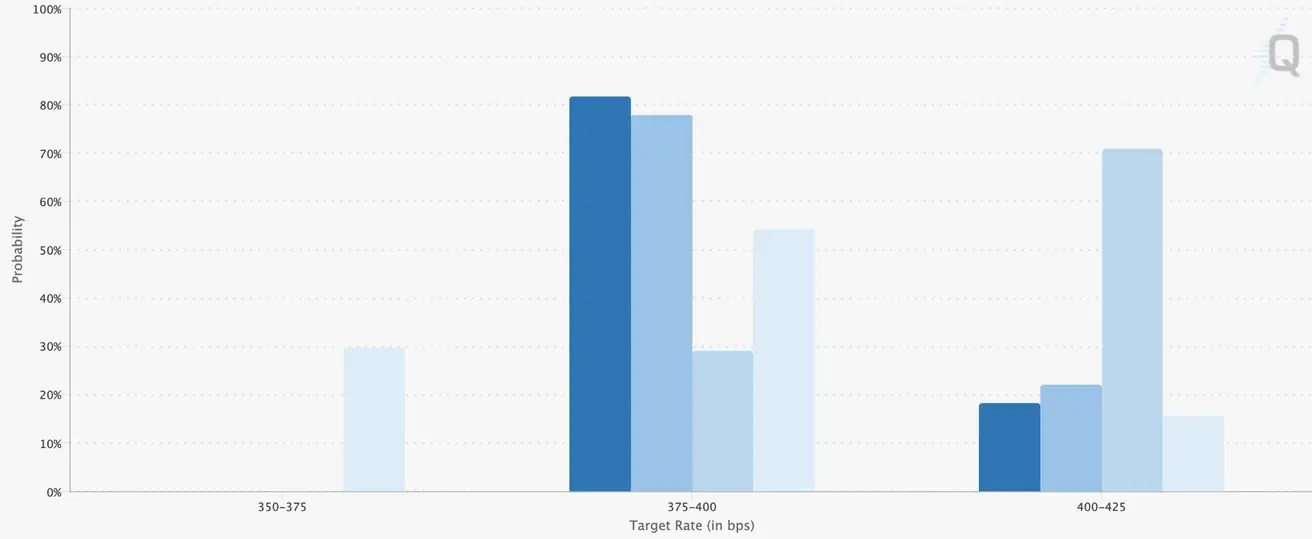
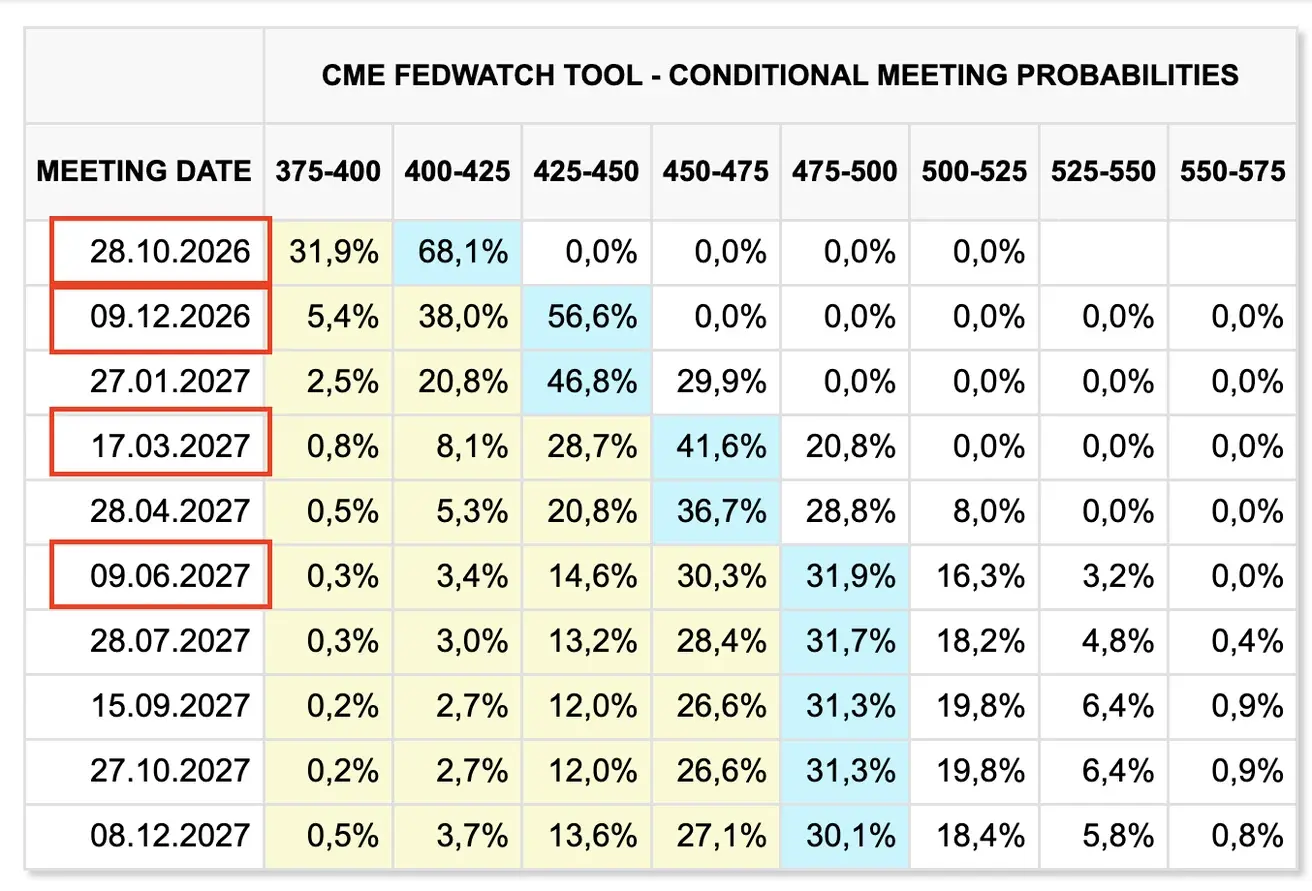
For the next FOMC meeting (October 28), the estimated probability of a 0.25% rate hike dropped sharply to 18.27% (a week earlier: 68.1%).
In effect, the market is no longer pricing in a hike at the next meeting.
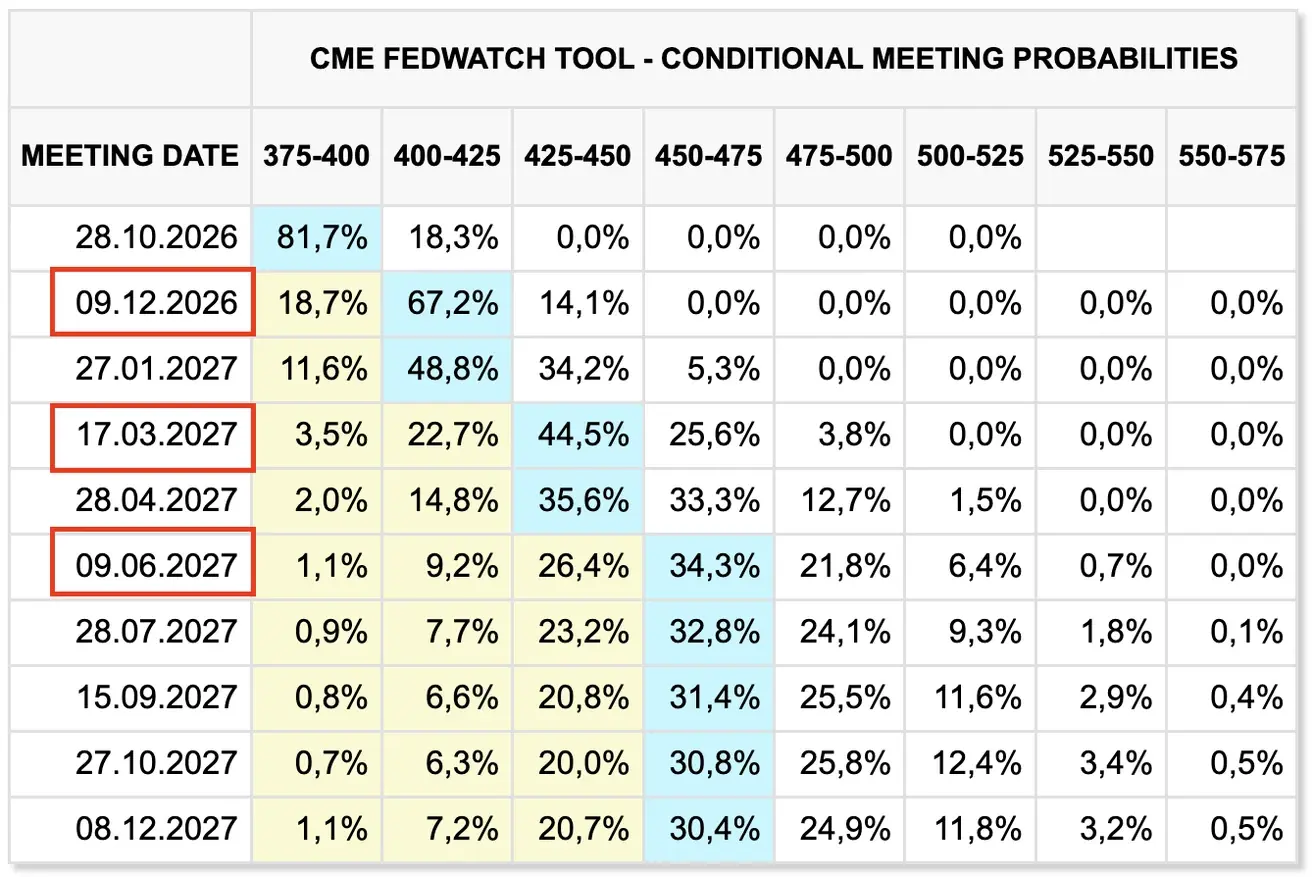
Over the next 12 months, the market expects three rate hikes of 25 basis points each to a range of 4.50–4.75%, with the final hike expected in June 2027:
Today:
A week earlier:
Bond Market
U.S. bond market — yields diverged across maturities.
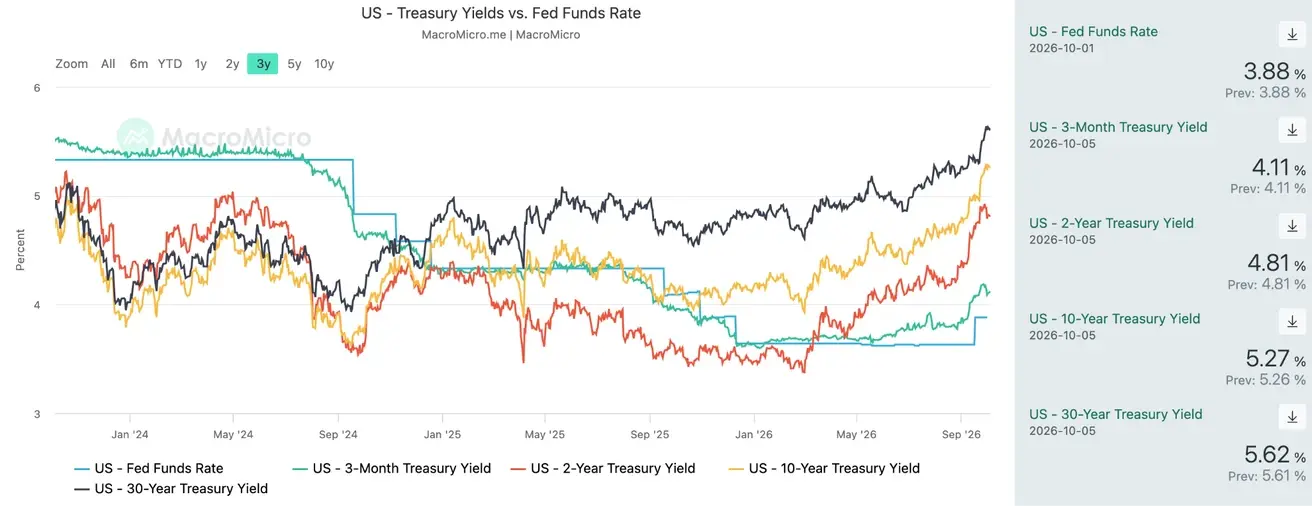
The short end of the curve reacted to the weak labor market: the 2-year yield fell from 4.91% to 4.81% as the market scaled back the probability of an immediate Fed rate hike.
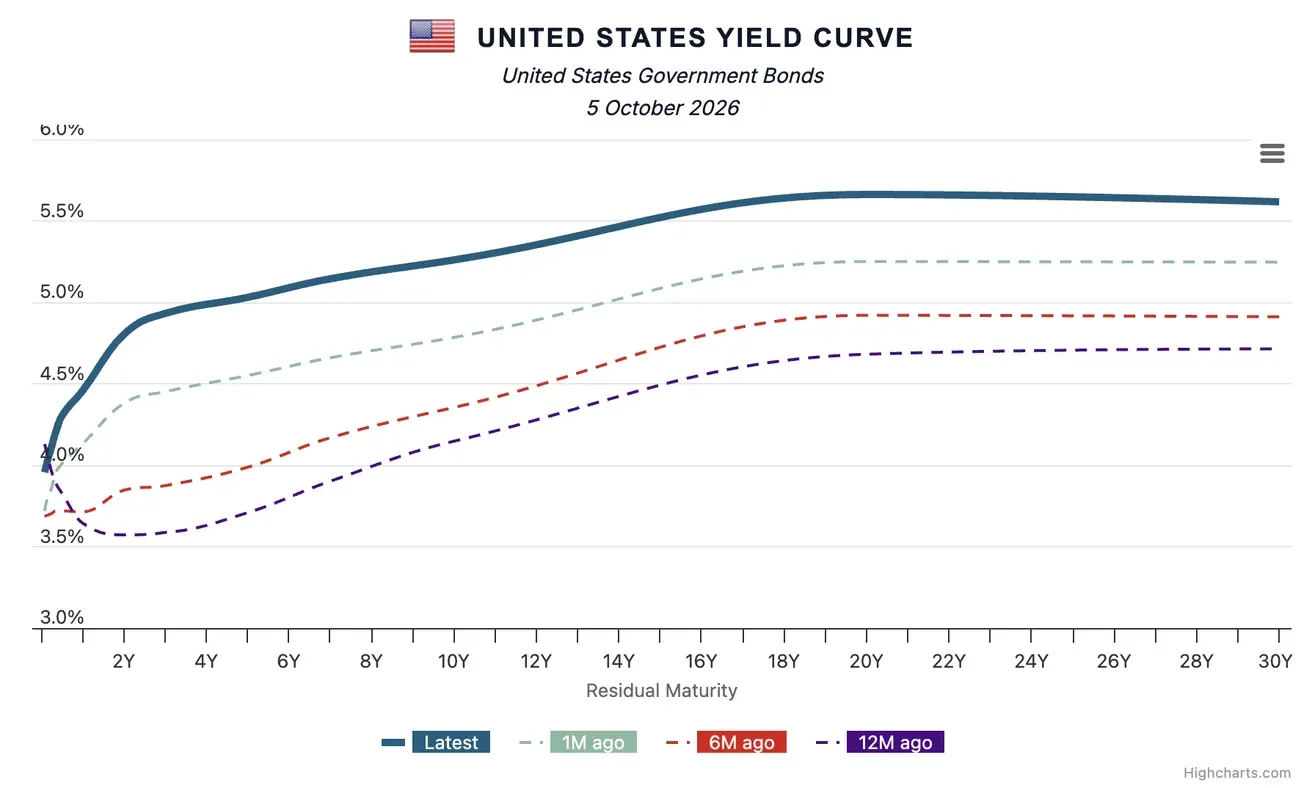
The long end of the curve, however, moved in the opposite direction: the 10-year yield rose to 5.27% and the 30-year to 5.62%. In other words, the market expects the Fed may turn more cautious in the near term, but long-term risks have not gone away, and investors have again started selling long-dated Treasuries amid concerns over inflation, oil, and high federal debt.
The corporate segment is also deteriorating: the BBB yield rose from 6.08% to 6.19%. In other words, corporate borrowing costs continue to rise even as the labor market cools.
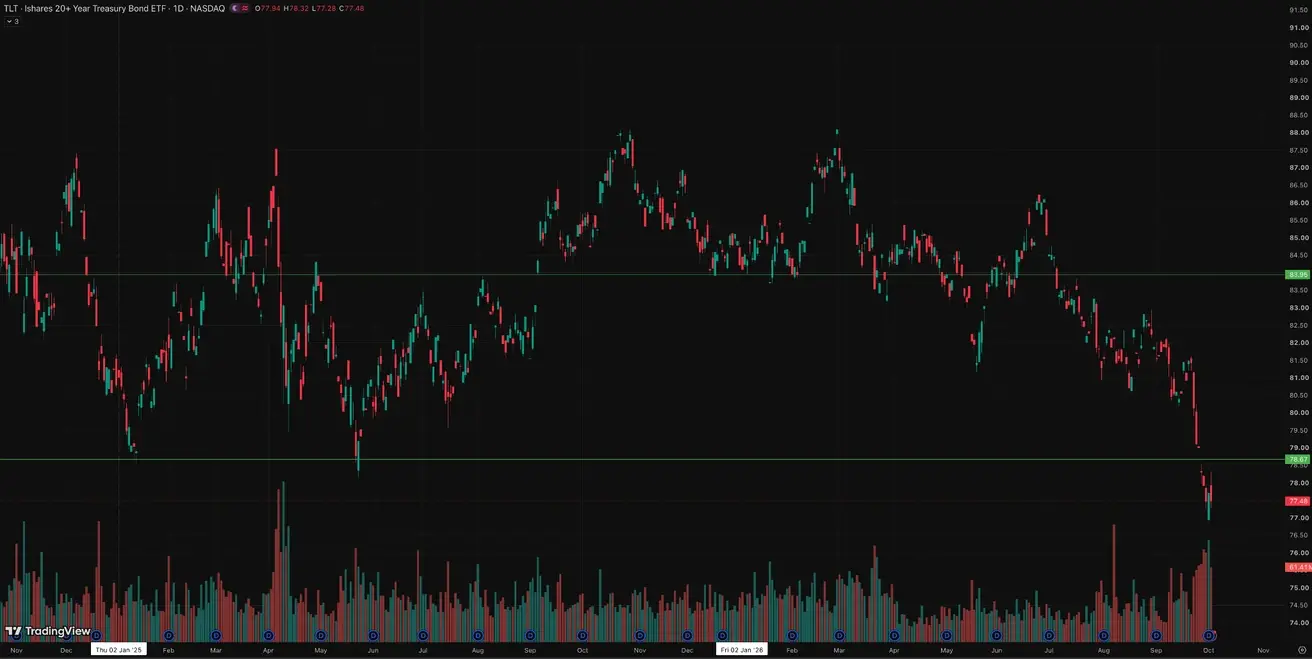
U.S. Treasury Bonds 20+ Years (TLT ETF): weekly performance -2,32% (week close: $77,48); year-to-date: -11.11%
Yields and Spreads
- Market Yield on U.S. Treasury Securities at 10-Year Constant Maturity: 5.27% (previous: 5.21%);
- 2-Year U.S. Treasury Yield: 4.81% (previous: 4.91%);
- ICE BofA BBB US Corporate Index Effective Yield: 6.19% (previous: 6.08%).
- The yield spread between 10-year and 2-year U.S. Treasury securities stands at 46 basis points (previous: 30 bps);
- The yield spread between 10-year and 3-month U.S. Treasury securities stands at 116 basis points (previous: 102 bps).
U.S. Treasury Yield Curve
The cost of a 5-year U.S. Credit Default Swap (CDS) — a market-based measure of sovereign default insurance — is 37.32 basis points, compared with 33.75 basis points a week earlier.
SP500
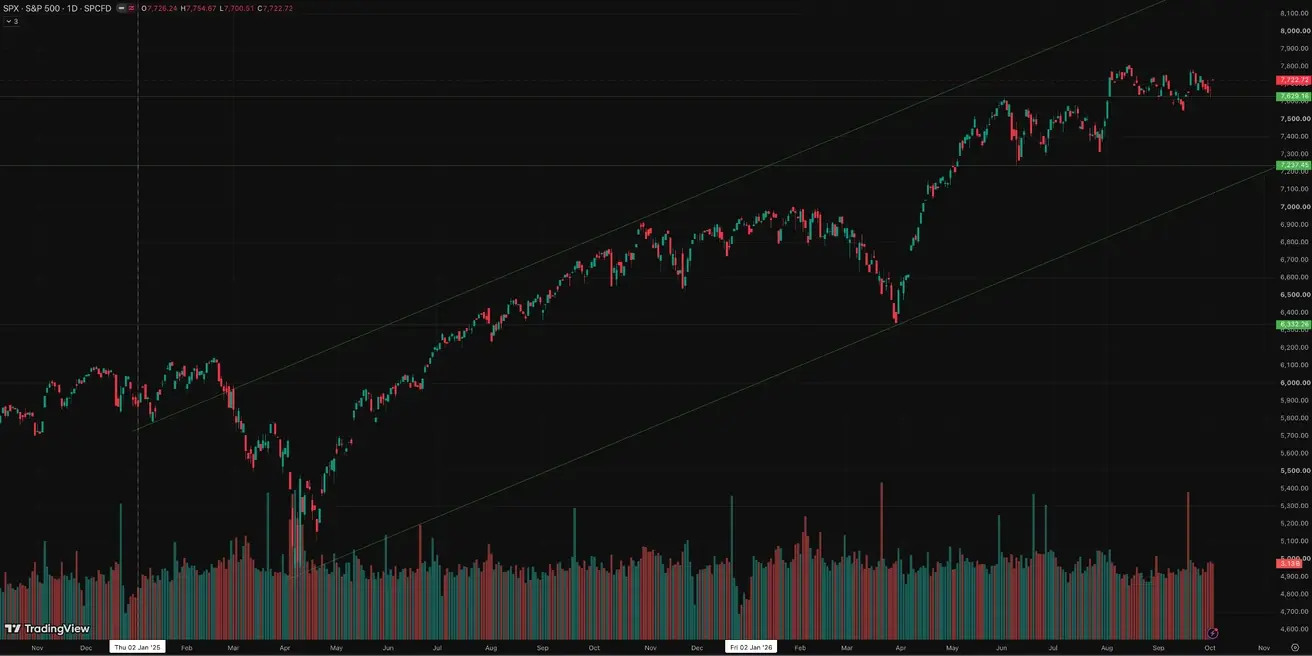
Weekly performance: -0,27% (week-end close: 7722,73); year-to-date: +12,81%.
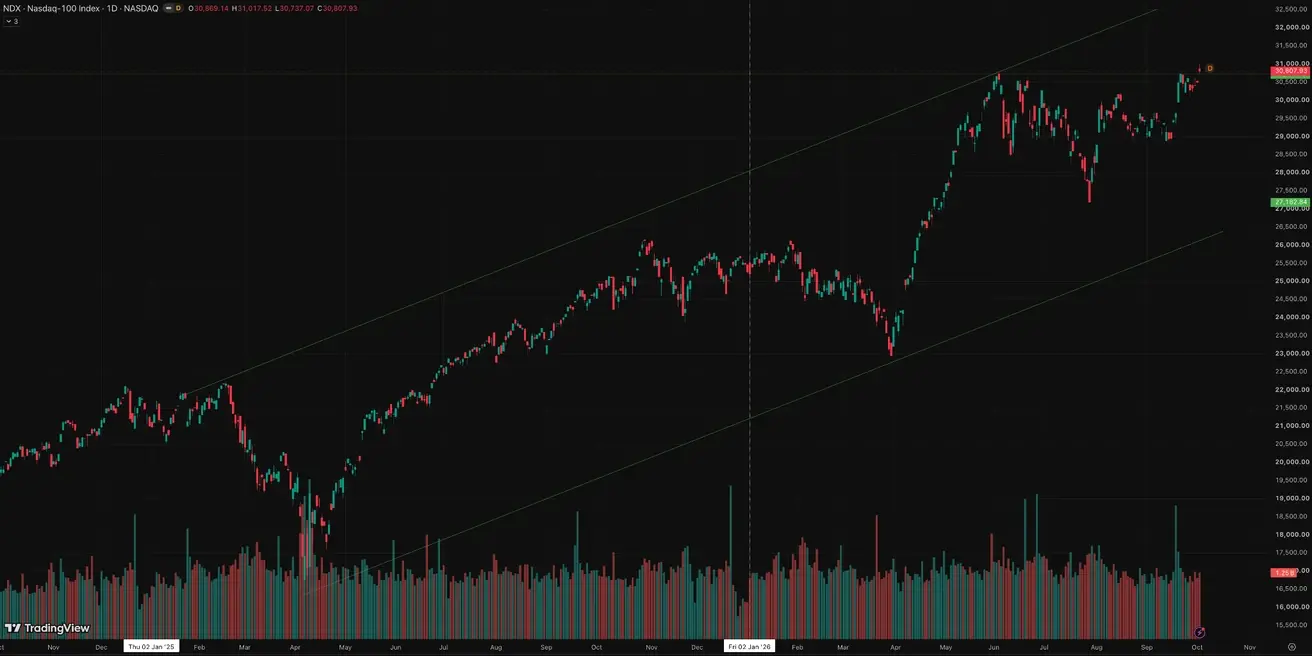
NASDAQ100
Hit an all-time intraday high; weekly performance: +0,65% (week-end close: 30807,93); year-to-date: +22,01%.
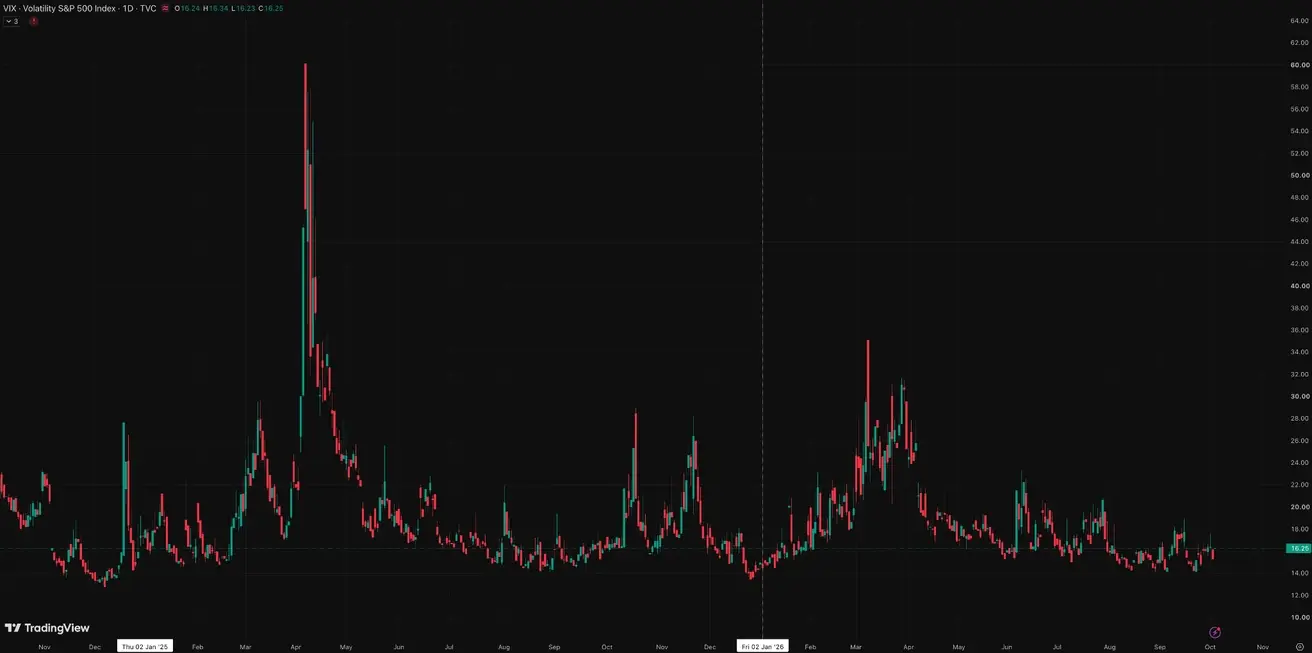
VIX
VIX (volatility index): week-end close at 16,25 points.
Eurozone
- The ECB raised interest rates, while maintaining a hawkish stance as inflationary risks continue to increase;
- Against the backdrop of the conflict in the Middle East, the ECB revised its GDP forecasts downward and raised its inflation projections for the coming years.
ECB officials’ rhetoric:
ECB Executive Board member Isabel Schnabel delivered a landmark speech at a capital markets seminar in Luxembourg. Known for her hawkish stance, she sent markets a clear signal calling for pre-emptive action: inflation has returned due to new shocks, and the central bank cannot afford to delay tough measures.
The next ECB monetary policy meeting is on October 29.
In her October 1 speech, Christine Lagarde focused not on rates but on the risks artificial intelligence poses to financial stability. She highlighted three key areas: trading in financial markets, cyber resilience, and geopolitics. According to Lagarde, widespread use of similar AI models could amplify synchronized trades and market moves, autonomous AI systems could make trading decisions harder to control, and Europe’s dependence on a limited number of frontier models from the U.S. and China creates additional systemic risk. The ECB and European regulators therefore need to strengthen supervision and cyber defenses and develop their own technological capabilities. Lagarde gave no new monetary policy signal in this speech.
Macroeconomic Data
Interest Rates
- Deposit Facility Rate: 2.5% (previous: 2.25%);
- Marginal Lending Facility Rate: 2.9% (previous: 2.65%) — the rate at which banks can obtain overnight funding from the central bank;
- Main Refinancing Rate (Policy Rate): 2.65% (previous: 2.40%).
Eurozone inflation continued to rise.
Inflation: Consumer Price Index (CPI) (September, preliminary data)
- Core CPI (YoY): 2.5% (previous: 2.4%);
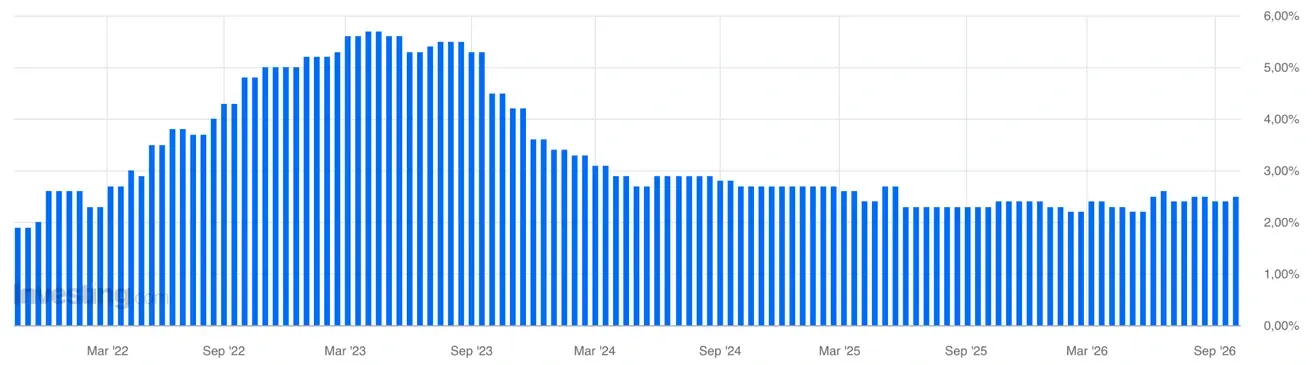
- Headline CPI: 0.4% (MoM) (previous: 0.4%);
- CPI: 3.8% (YoY) (previous: 3.2%).
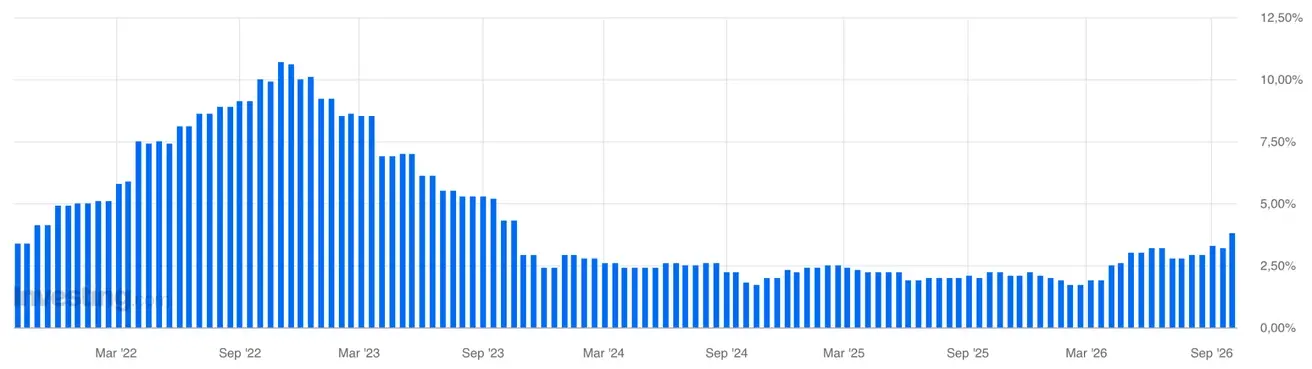
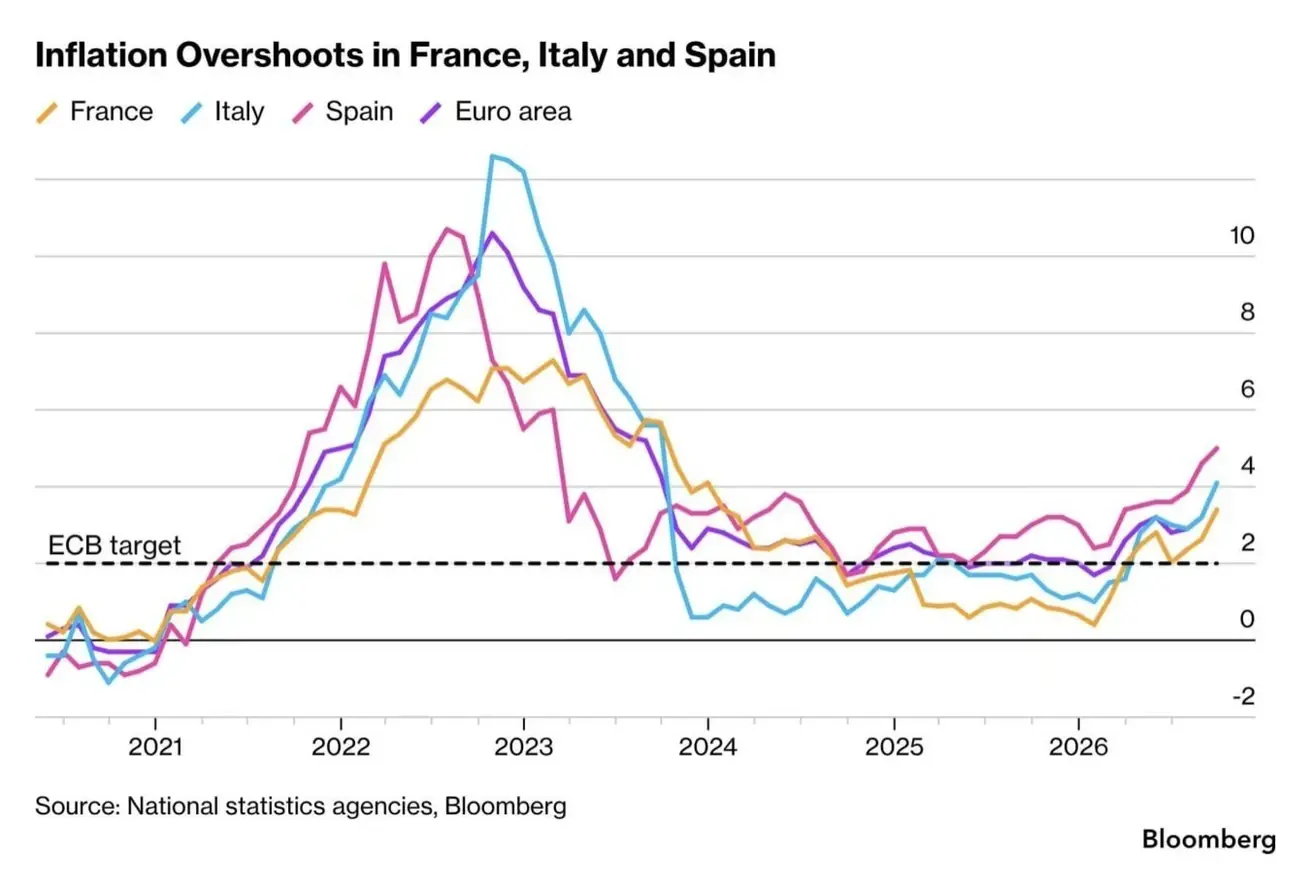
In September, inflation accelerated in three of the eurozone’s largest economies at once — to 3.4% in France, 4.1% in Italy, and 5% in Spain — exceeding analysts’ forecasts. Energy remains the main driver of price growth.
In France, energy prices rose 21.2% year over year, services inflation accelerated to 2.2%, and food inflation to 1.5%.
The data add pressure on the ECB, which has already raised rates twice, to 2.5%. Markets expect further tightening amid rising oil and gas prices.
GDP (Q2 2026)
- QoQ: 0.6% (previous: -0.2%);
- YoY: 0.5% (preliminary estimate: 0.4%); (previous: 0.3%).
Unemployment Rate (August)
- 6.4% (previous: 6.4%).
Industrial Production (August)
- MoM: -0.1% (previous: 0.0%);
- YoY: 1.67% (previous: 1.37%).
Purchasing Managers’ Index (PMI) (September)
- Services PMI: 53.0 (previous: 51.6);
- Manufacturing PMI: 52.9 (previous: 52.7);
- S&P Global Composite PMI: 53.1 (previous: 52.0).
Euro Stoxx 600 (FXXP1!)
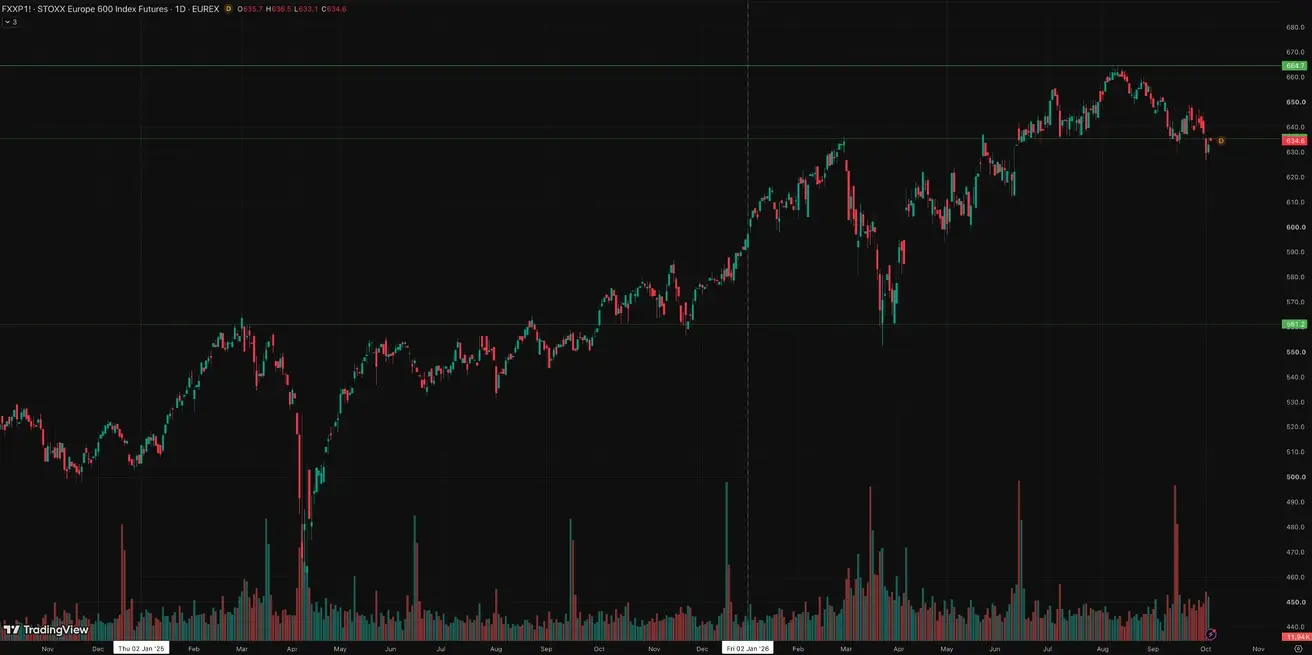
Weekly performance: -1,33% (week-end close: 633,0); year-to-date: +6,57%.
China
China’s economy continues to stabilize, supported by strong exports, while domestic demand and investment gradually recover. Policymakers remain measured and targeted in their approach to economic stimulus.
- Interest rates remain unchanged;
- Monetary policy remains accommodative;
- China reaffirmed its commitment to fiscal support for economic growth under its 2026 plan, including measures to stimulate domestic demand, optimize tax incentives and subsidies, and modernize industrial capacity.
Macroeconomic Data
Interest Rates
- 1-Year Loan Prime Rate (medium-term lending): 3.00%;
- 5-Year Loan Prime Rate (benchmark for mortgage lending): 3.50%.
Inflation Indicators (August)
- Consumer Price Index (CPI): 0.4% MoM (previous: -0.1%); 0.8% YoY (previous: 0.5%):
- Producer Price Index (PPI): 3.8% YoY (previous: 3.5%).
Trade Data
- Imports (August): 28.2% YoY (previous: 27.5%);
- Exports (August): 25.0% YoY (previous: 23.9%);
- Trade Balance (USD) (August, YoY): $119.9 billion (previous: $112.5 billion).
GDP (Q2 2026)
- QoQ: 0.9% (previous: 1.3%);
- YoY: 4.3% (previous: 5.0%).
This is below the target trajectory and reflects weaker domestic momentum.
Labor Market
- Unemployment Rate (August): 5.3% (previous: 5.2%).
Industrial Activity
- Industrial Production (July, YoY): 5.2% (previous: 4.5%).
Fixed Asset Investment
- August, YoY: -7.2% (previous: -6.7%).
Retail Sales
- July, YoY: 0.6% (previous: 0.9%).
Purchasing Managers’ Indices (PMI) (August)
- Manufacturing PMI: 50.1 (previous: 49.8);
- Non-Manufacturing PMI: 50.2 (previous: 49.0);
- Composite PMI: 50.7 (previous: 49.5).
CSI 300 Index (000300.HK)
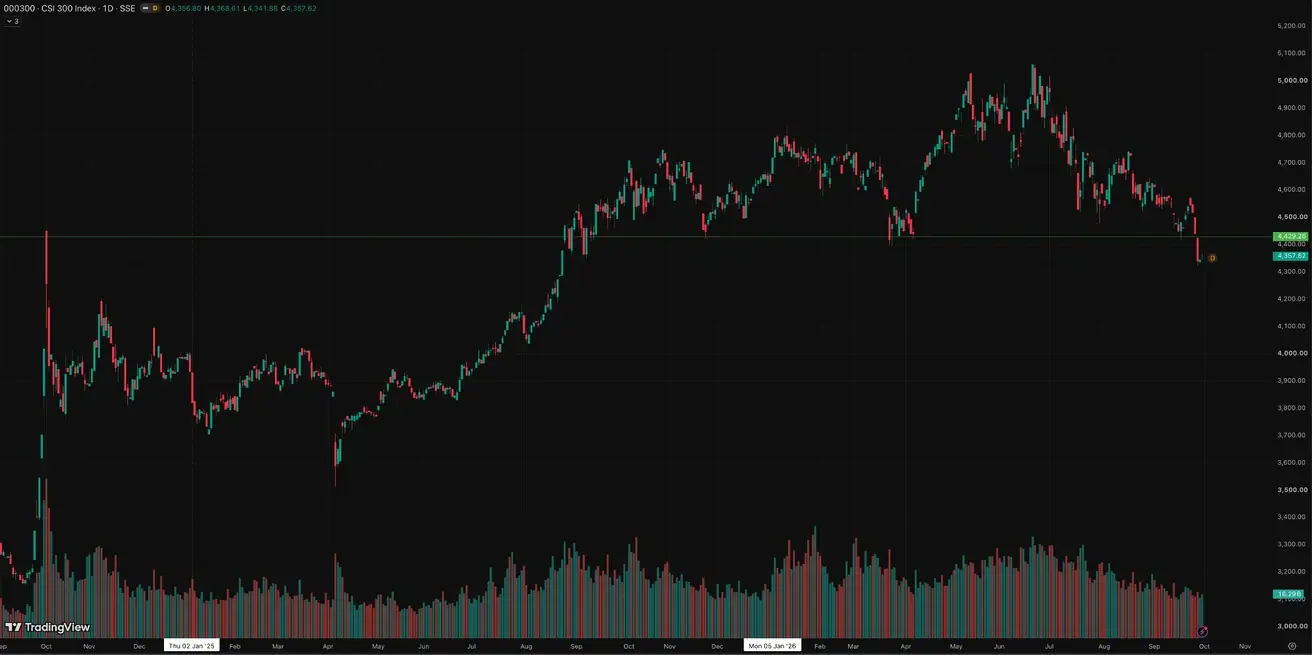
Weekly performance: +2,76% (week-end close: 4357,62); year-to-date: -6,52%.
Gold Futures (GC)
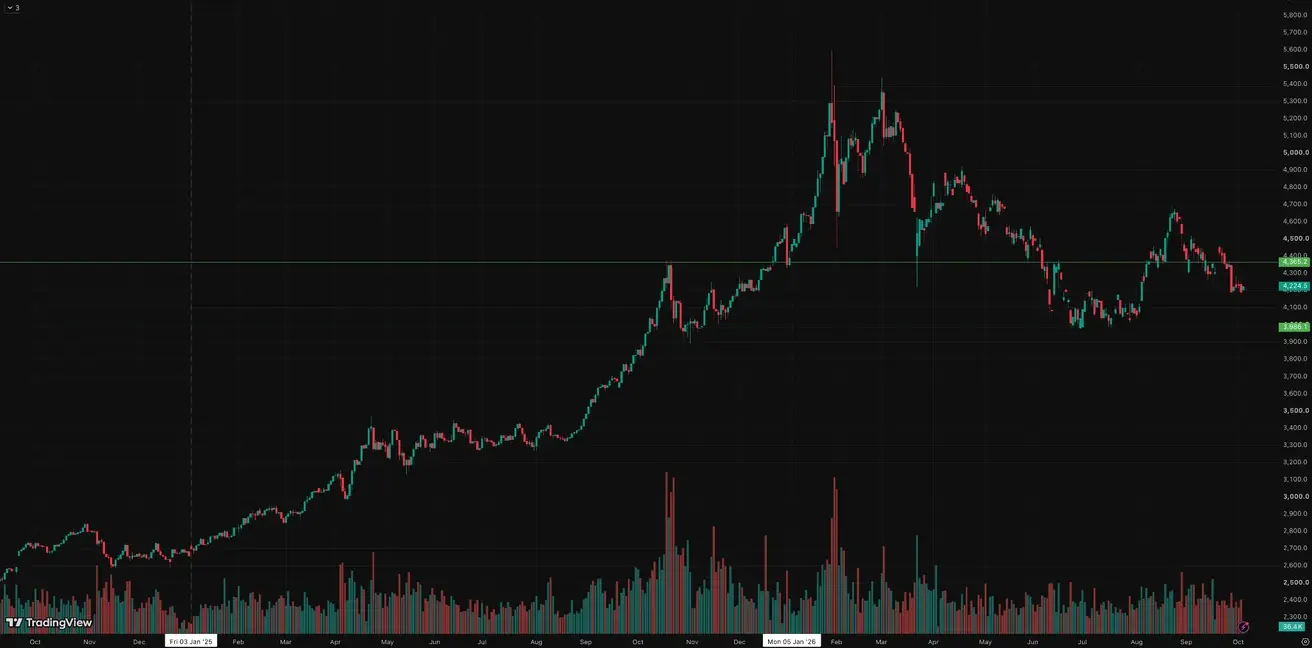
Weekly performance: -0,34% (week close: $4224,2 per troy oz); year-to-date: -2,49%
Gold halted its decline as expectations of further U.S. rate hikes eased, but the stronger dollar is capping gains for now.
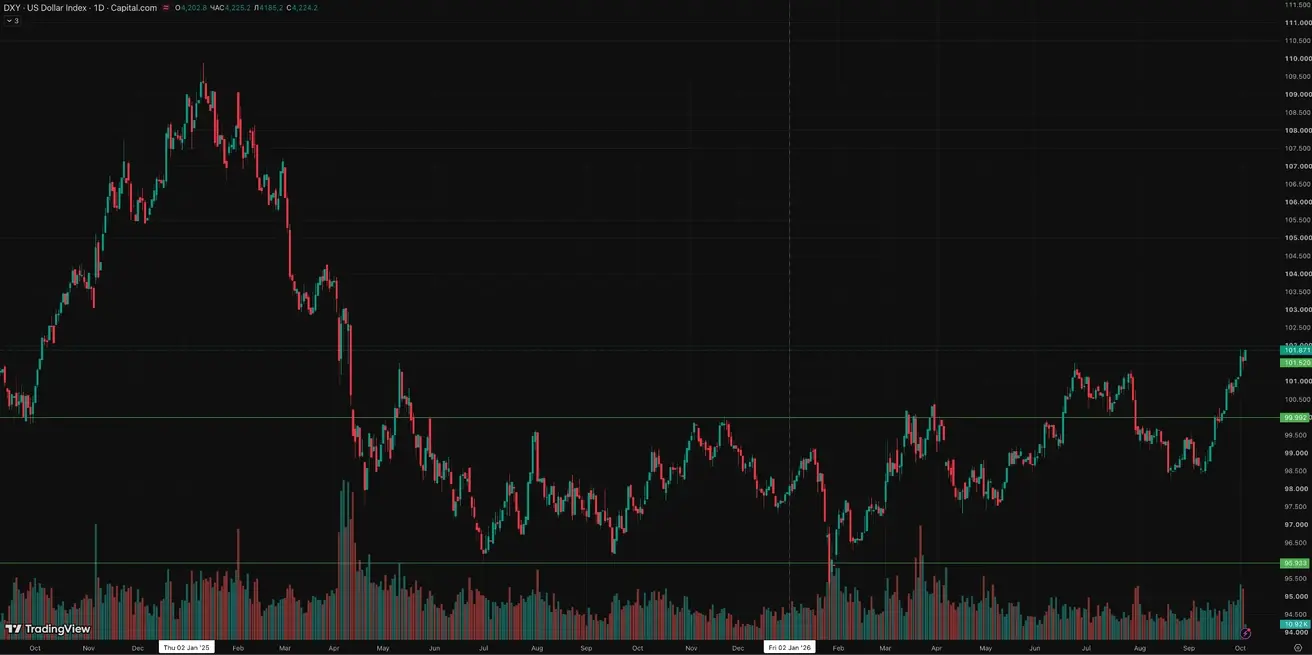
Dollar Index Futures (DX)
Weekly performance: +0,88% (week close: 101,564); year-to-date: +3,64%.
Oil Futures
Weekly performance: -3,79% (week close: $91,11 per barrel); year-to-date: +58,70%
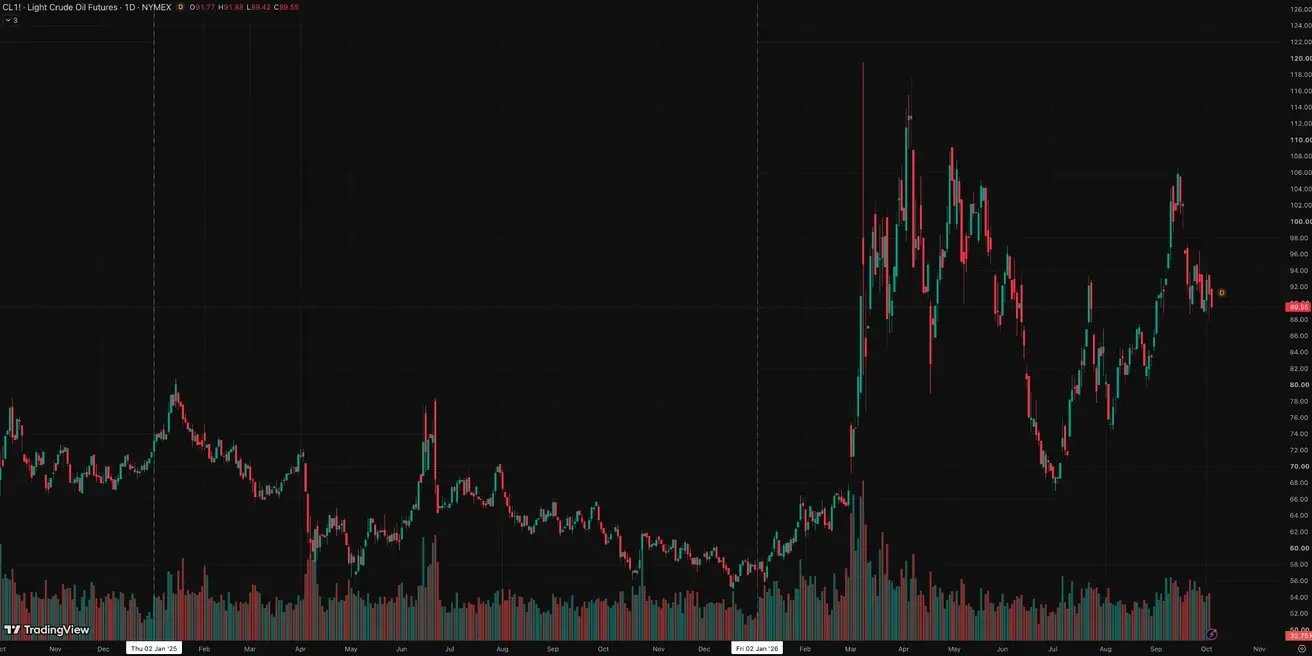
According to Reuters, Middle East crude oil exports exceeded pre-war levels on 4 of the 7 days in the last week of September. On September 24 and from September 27 to 29, they ranged between roughly 19.5 and 22.5 million barrels per day, compared with a pre-war average of about 18 million barrels per day. The seven-day moving average as of October 1 stood at around 18.5 million barrels per day.
Reuters notes that attacks on vessels in the Strait of Hormuz area are continuing, with at least 7 incidents recorded in recent days, which keeps the geopolitical premium in oil prices in place.
G7 countries agreed, through the IEA (International Energy Agency), to release around 100 million barrels of oil and diesel from emergency reserves, with a significant portion of the diesel set to reach the market within the next 20 days. The program is designed to run for roughly four months.
The measure is primarily intended to ease tension in the physical market for petroleum products (especially diesel, where shortages typically pass through more quickly into transportation and production costs) and, in turn, to contain price pressure. In the short term, this could lower inflation expectations and support bonds and risk assets; however, a lasting effect will depend on actual oil supply going forward. In other words, releasing 100 million barrels from reserves will only buy markets time — it will not eliminate the shortage.
Crypto Market
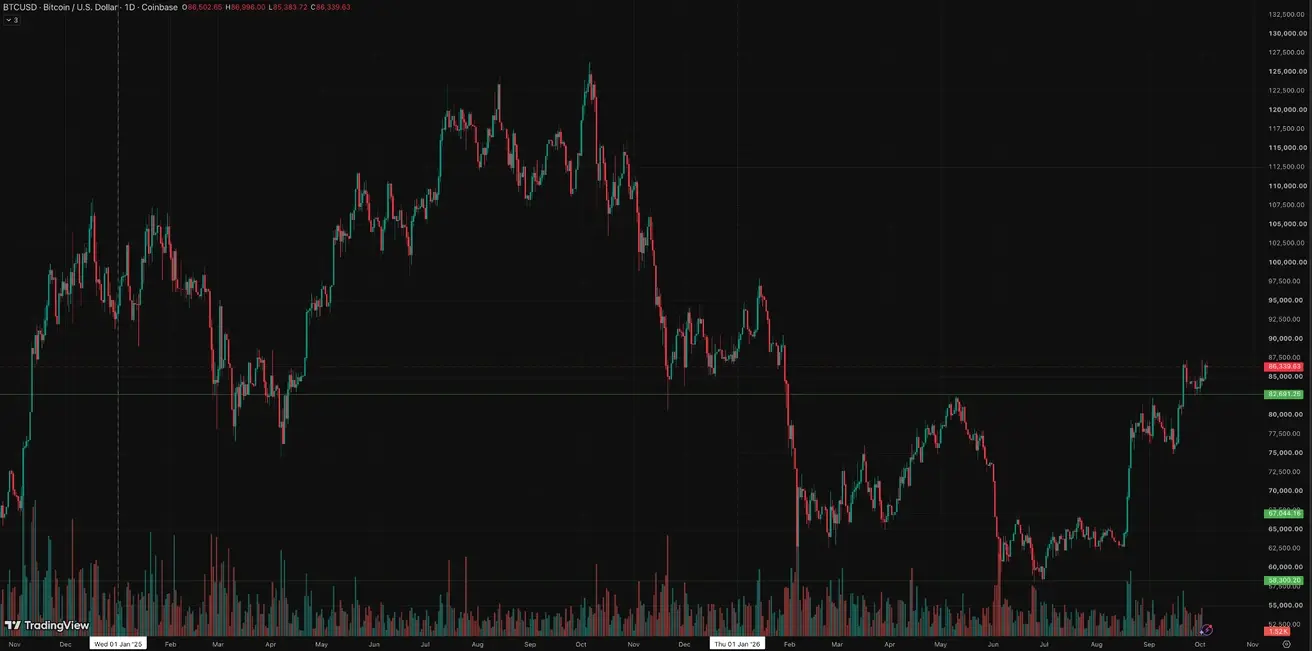
BTC Futures
Weekly performance: +2,42% (week close: $86,507.11); year-to-date: -1,38%.
ETH Futures
Weekly performance: +1,43% (week close: $2726,66); year-to-date: -8,31%.
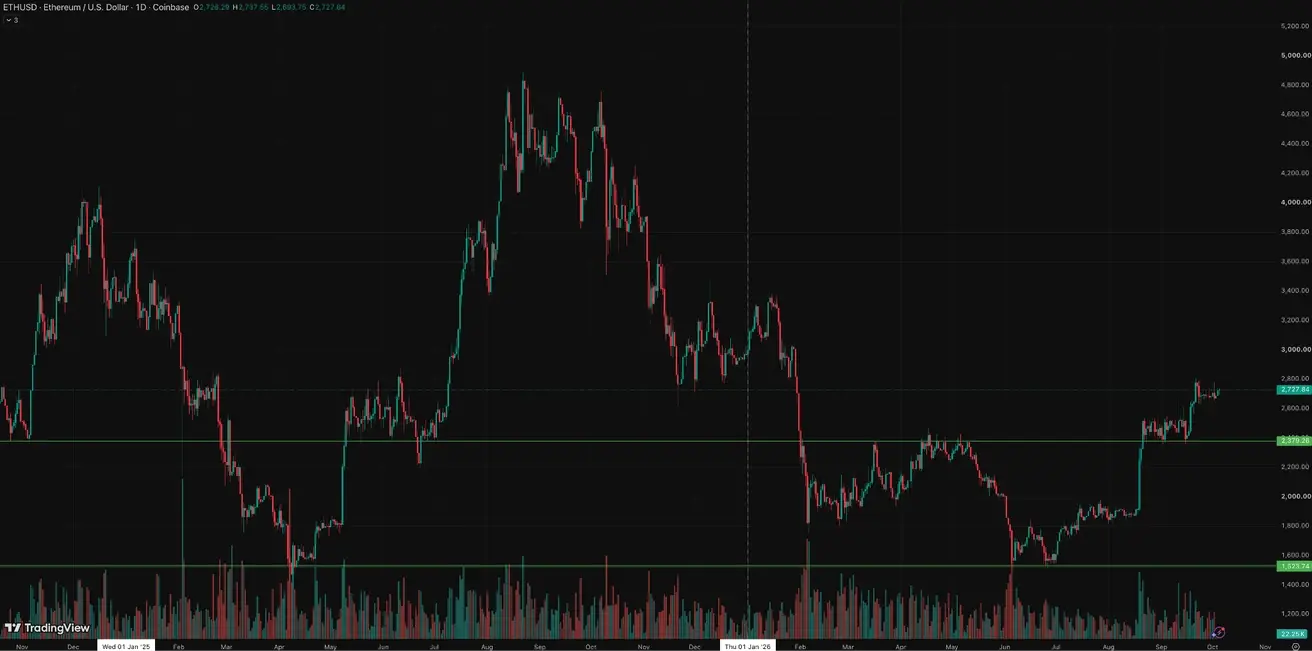
Citi raised its 12-month ETHUSD price target to $3,028 from $2,240.
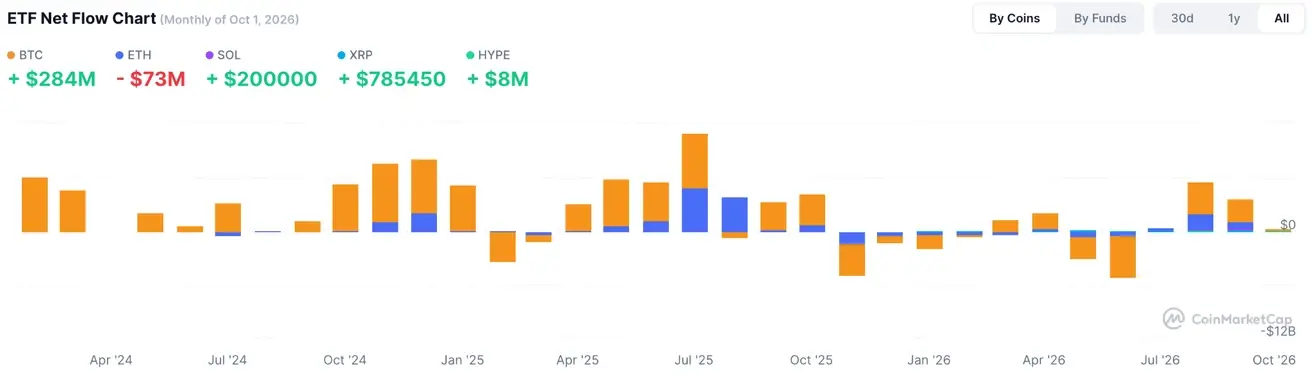
ETF Net Flows
Total Cryptocurrency Market Capitalization
Total crypto market capitalization: $2,948 trillion (vs $2,85 trillion a week earlier) (coinmarketcap.com).
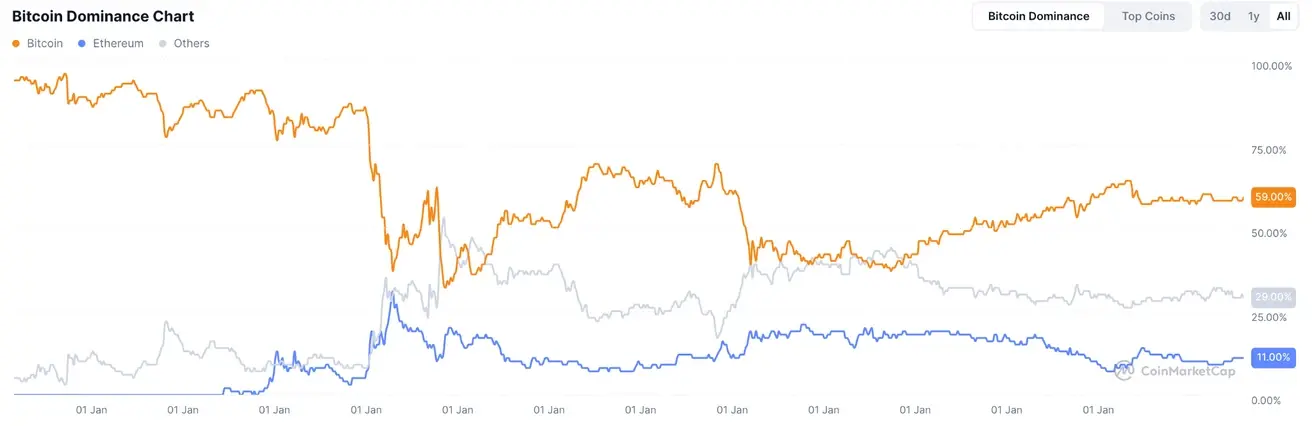
Crypto asset market shares:
- Bitcoin 59,0% (prev. 58,6%)
- Ethereum 11,3% (prev. 11,3%)
- Others 29,6% (prev. 30,0%)