Русский
 Қазақша
 Eesti
EestiSeptember 21 – September 27, 2026: Weekly economic update
Key market updates

Key Takeaways:
- The policy rate was raised to a range of 3.75 - 4.00%; rhetoric turned hawkish;
- Monetary policy remains moderately restrictive;
- U.S. macroeconomic data continue to support a soft-landing scenario: inflation risks are increasing, the labor market is cooling without signs of recession, and current conditions do not yet warrant a rate cut.
- The Fed slightly improved its GDP and employment forecasts; it raised near-term inflation forecasts.
Inflation: Consumer Price Index (August)
- Core CPI (MoM): 0.3% (previous: 0.2%).
- Core CPI (YoY): 2.4% (previous: 2.5%).
- CPI (MoM): 0.4% (previous: 0.1%).
- CPI (YoY): 3.4% (previous: 3.4%).
Producer Price Index (August)
- PPI (MoM): 0.4% (previous: 0.0%).
- Core PPI (MoM): 0.3% (previous: 0.2%).
Inflation Expectations (Michigan) (September)
- 12-month Inflation Expectations: 4.6% (previous: 4.6%).
- 5-Year Inflation Expectations: 3.4% (previous: 3.3%).
GDP (U.S. Bureau of Economic Analysis, BEA) — Q2 2026 annualized growth rate, second estimate: +1.5% (Q1 2026: +2.1%); forecast: 1.5%.
GDPNow (the Atlanta Fed’s real-time estimate of official GDP growth ahead of release (Q3 2026)): 5.0% (previous: 5.1%).
Trade balance (July): -$88 bn (-$71.2 bn).
Labor Market (BLS) (August/September)
- Unemployment rate 4.1% (prev: 4.1%):
- Total number of people receiving unemployment benefits in the US: 1,719K (prev: 1,774K);
- Initial jobless claims: 196K (prev: 207K);
- Change in nonfarm payrolls: 162K (prev: 23K):
- Change in employment in the private nonfarm sector: 127K (prev: -30K):
- Average hourly earnings (y/y): 3.1% (prev: 3.2%);
- JOLTS job openings: 7.271M (prev: 6.866M).
Business Activity Index (PMI) (August)
(Above 50 indicates expansion; below 50 indicates contraction)
- Services PMI: 58.7 (previous: 56.5).
- Manufacturing PMI: 57.0 (previous: 53.9).
- Composite PMI: 58.4 (previous: 56.0).
Monetary Policy
Key takeaways from the speech by Fed Vice Chair for Supervision Michael S. Barr (Economic Outlook and Housing):
- Barr sent a direct and fairly hawkish signal on monetary policy. He said the economy is growing solidly and the labor market remains resilient, while inflation is still above 2% and has not shown a sufficiently convincing return to target. According to Barr, inflation risks have increased, while labor market risks have diminished;
- Accordingly, he supported the September rate hike and believes the Fed had previously been “out of position.” In his baseline scenario, Barr expects that further policy adjustments will return inflation to 2% in a timely manner.
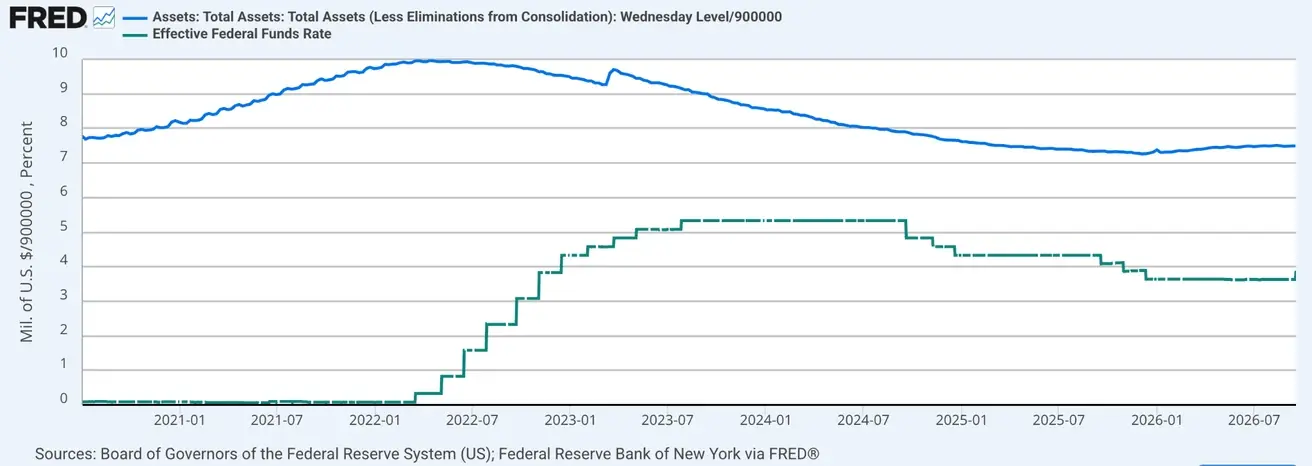
Federal funds rate (EFFR): 3.75%–4.00%
Federal Reserve balance sheet: $6.747 trillion, +3.24% since the end of QT ($6.535 trillion):
Market Forecast for Rate (FedWatch)
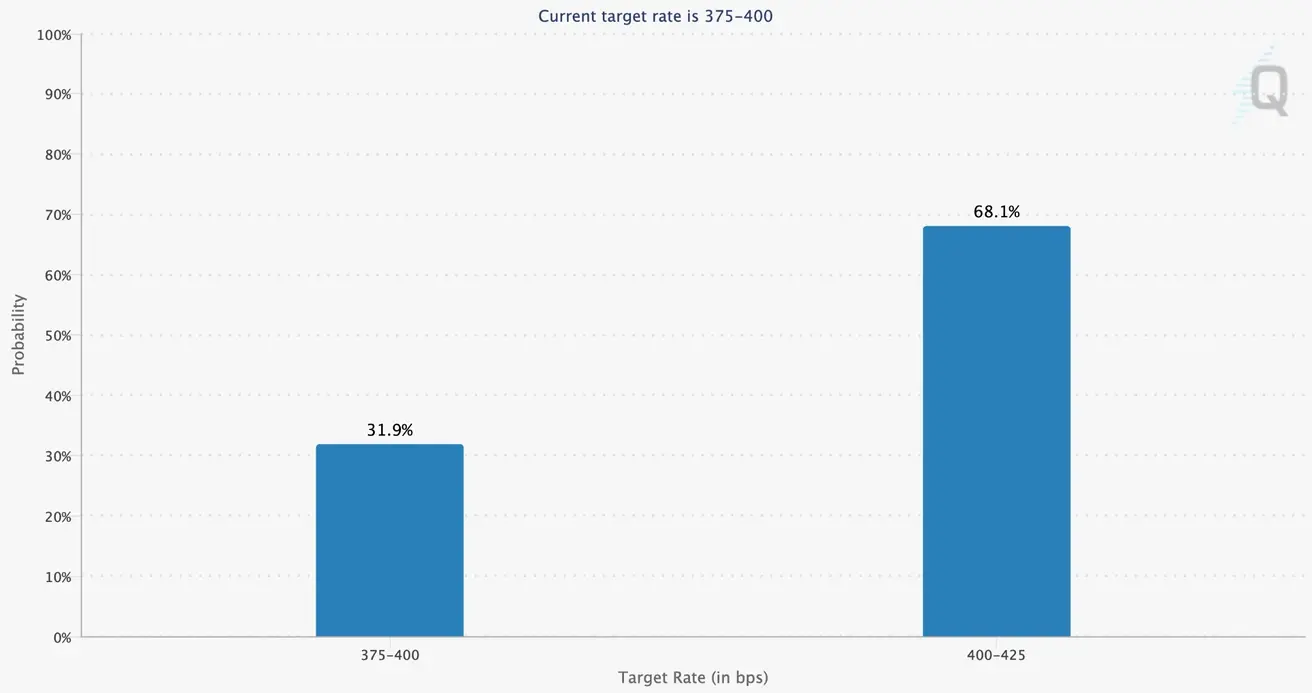
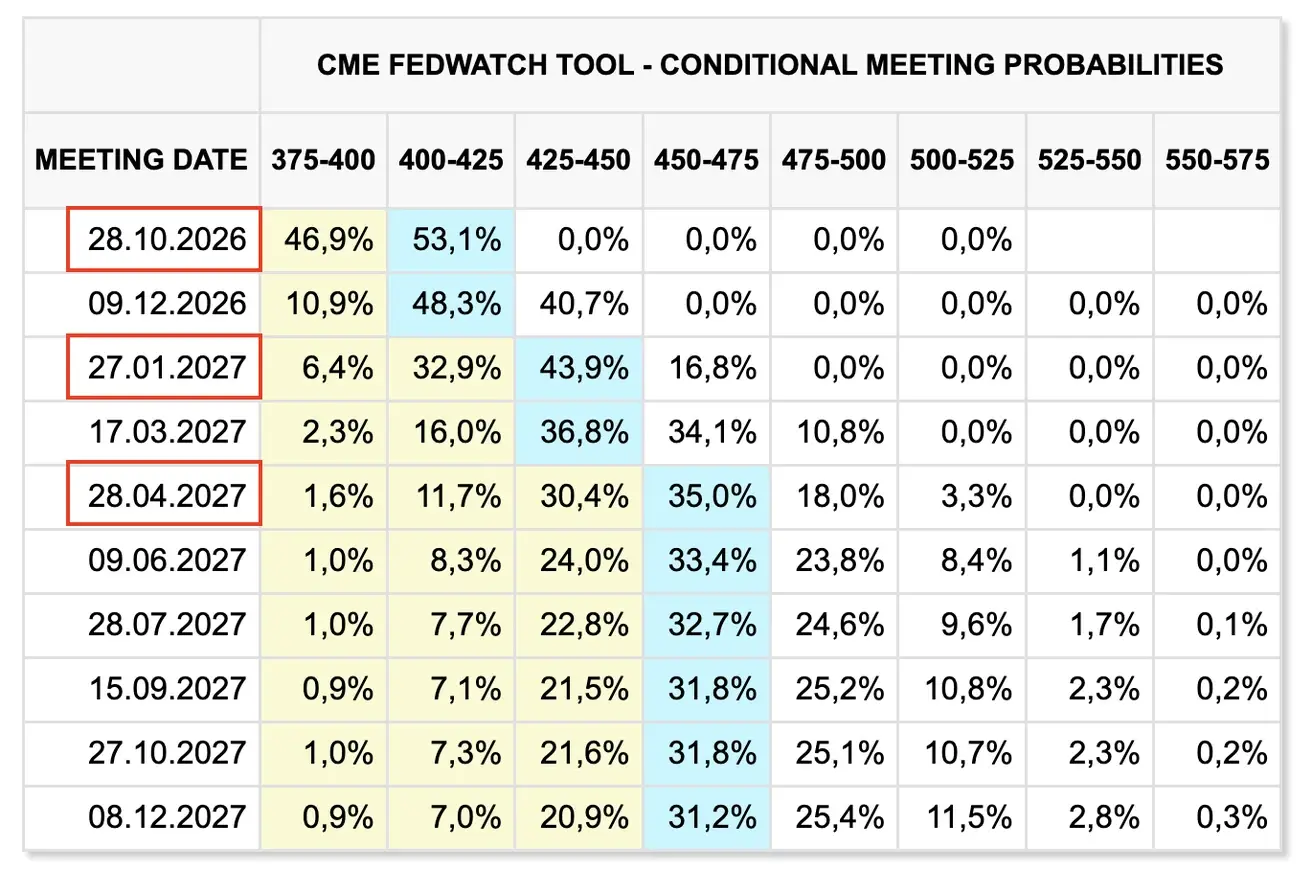
For the next FOMC meeting (October 28) - the estimated probability of a 0.25% rate hike is 68.1% (a week earlier: 53.1%):
Over the next 12 months, the market continues to expect four 25-basis-point rate hikes to a range of 4.75–5.00%, with the final hike expected in June 2027:
Today:
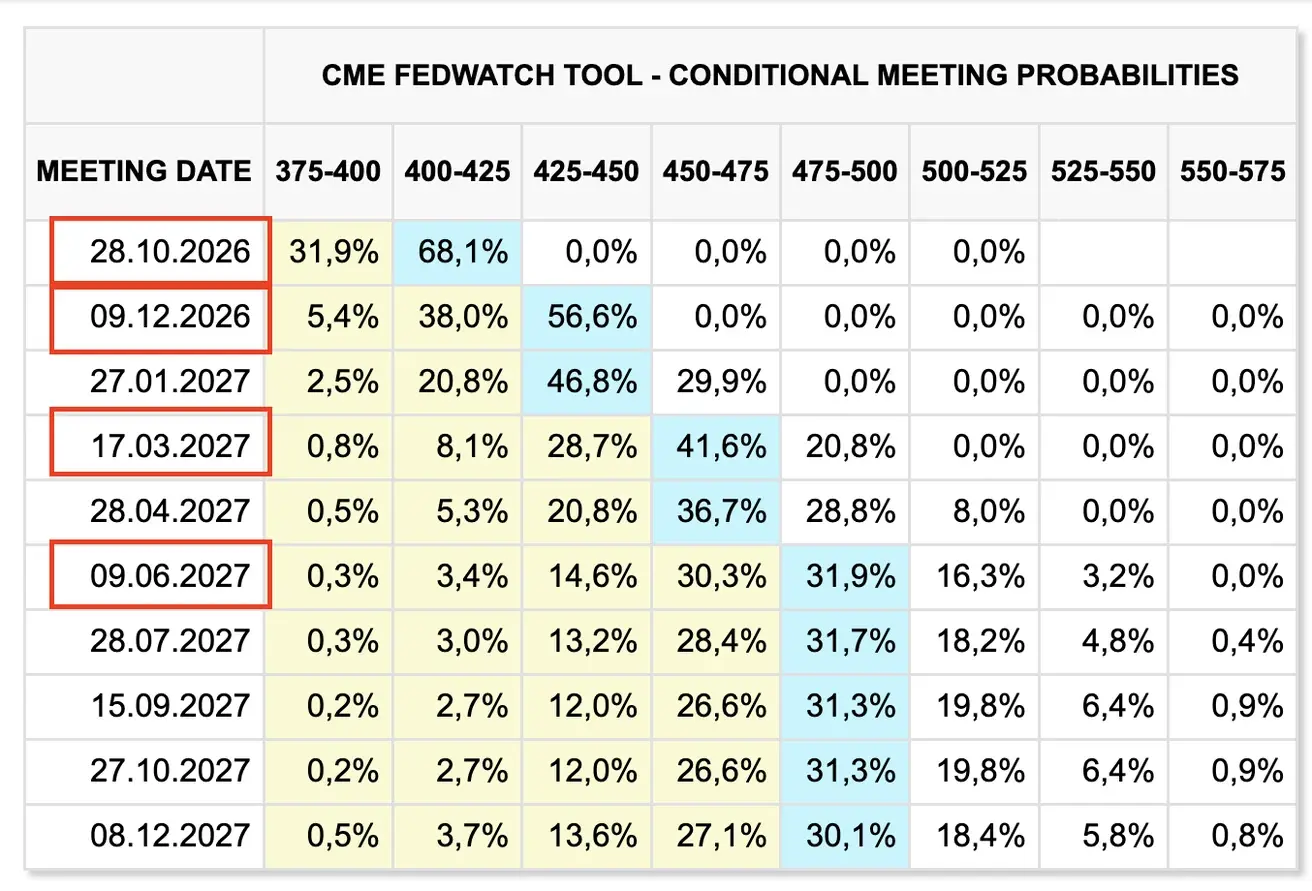
A week earlier:
Bond Market
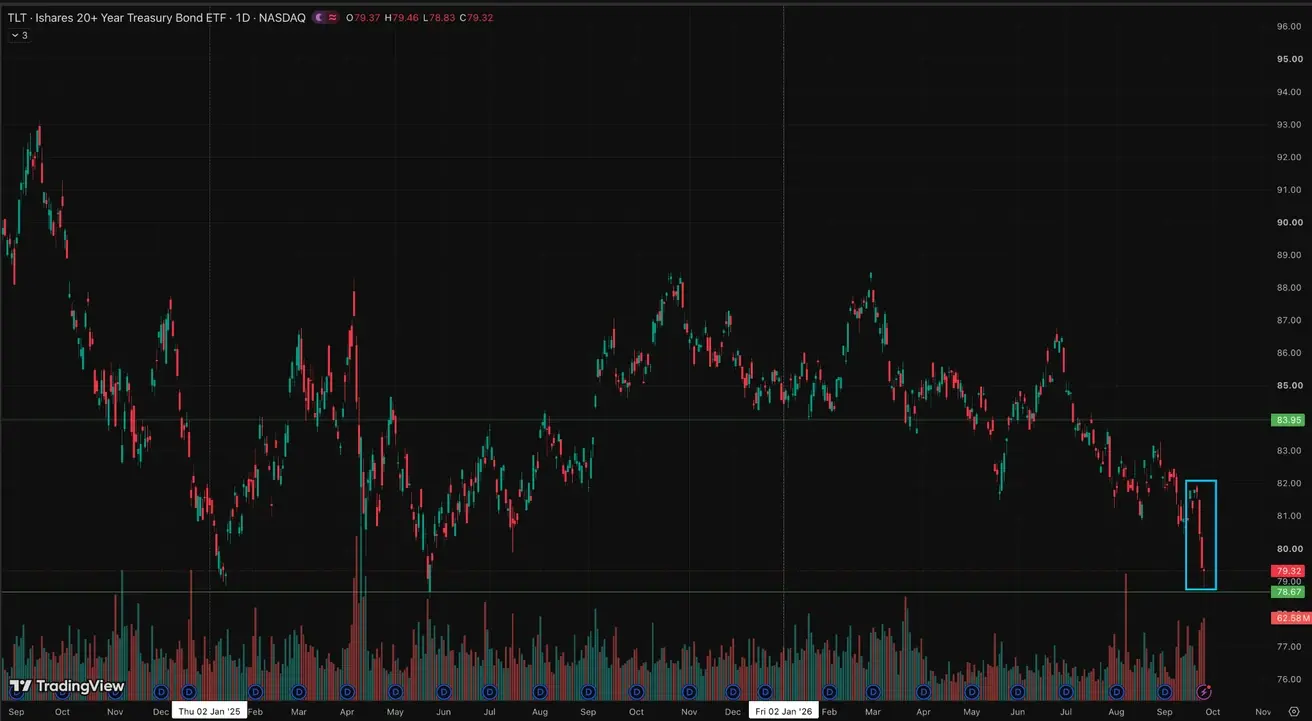
U.S. bond market — yields rose sharply across the entire curve.
U.S. Treasury Bonds 20+ Years (TLT ETF): -2,38% (week close: 79,32); year-to-date: -8.99%
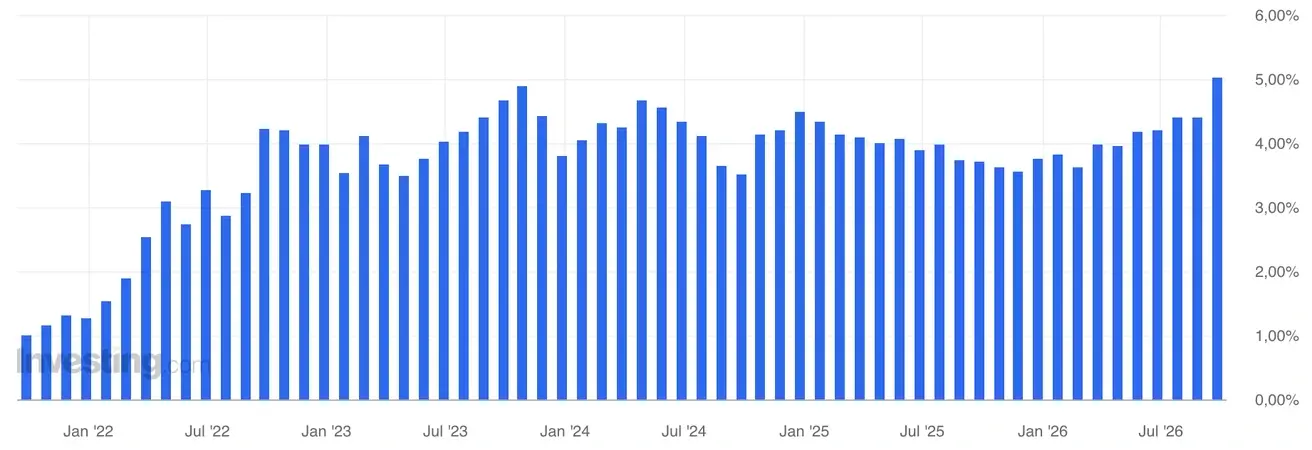
5-Year U.S. Treasury Note Auction: 5.033% (previous: 4.393%):
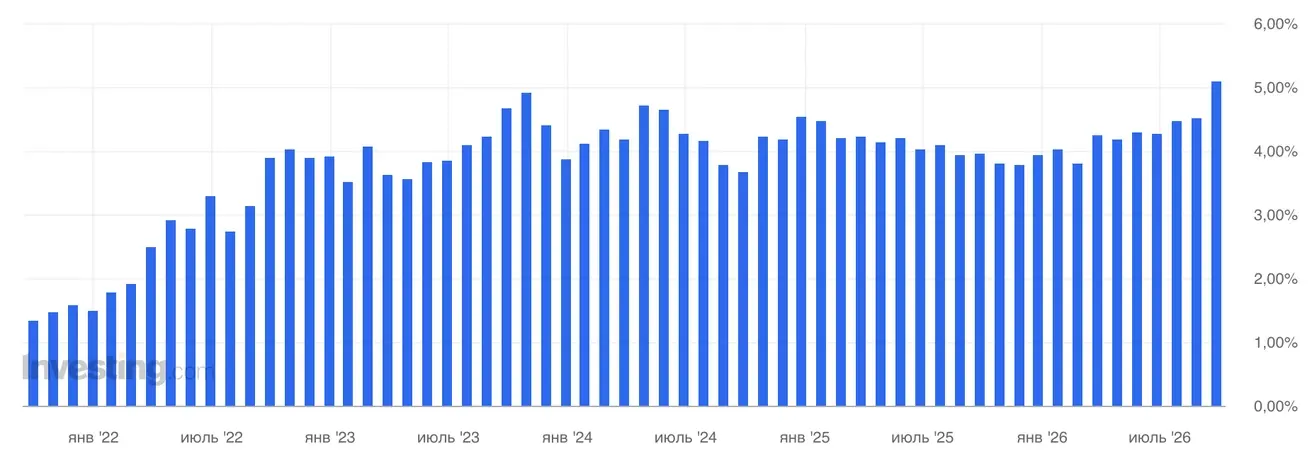
7-Year U.S. Treasury Note Auction: 5.085% (previous: 4.512%):
Yields and Spreads
- Market Yield on U.S. Treasury Securities at 10-Year Constant Maturity: 5.21% (previous: 4.97%);
- 2-Year U.S. Treasury Yield: 4.91% (previous: 4.76%);
- ICE BofA BBB US Corporate Index Effective Yield: 6.08% (previous: 5.84%).
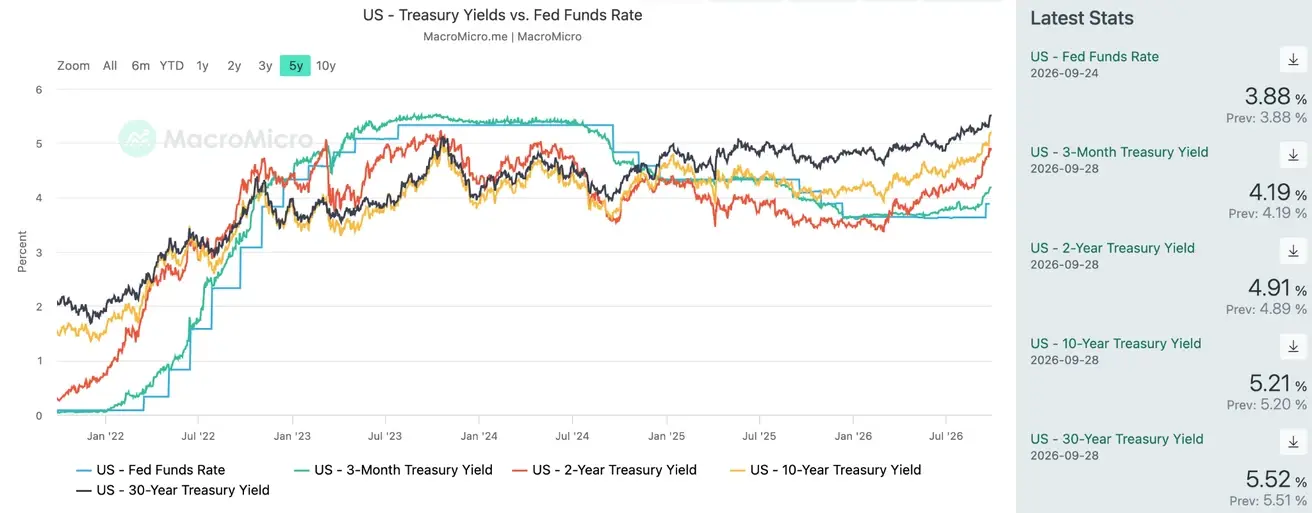
- The yield spread between 10-year and 2-year U.S. Treasury securities stands at 30 basis points (previous: 21 bps);
- The yield spread between 10-year and 3-month U.S. Treasury securities stands at 102 basis points (previous: 89 bps).
U.S. Treasury Yield Curve
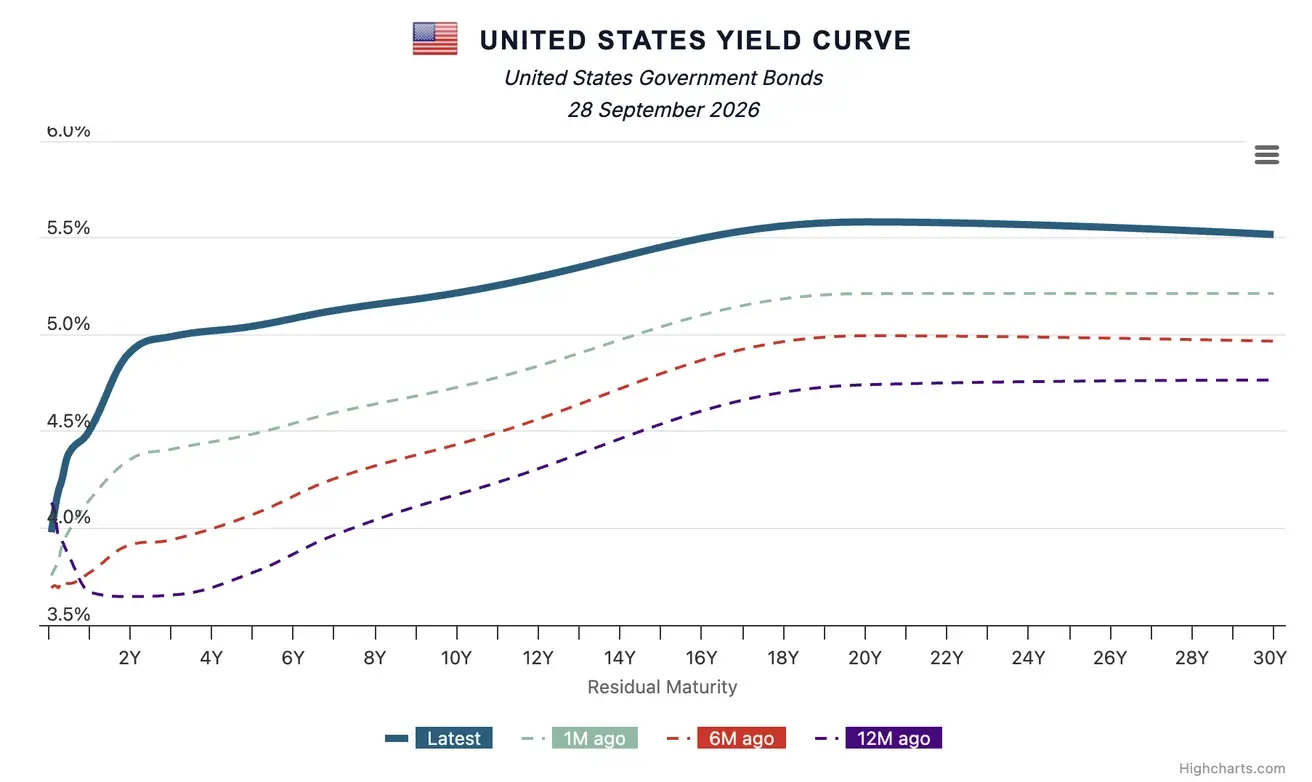
The cost of a 5-year U.S. Credit Default Swap (CDS) — a market-based measure of sovereign default insurance — is 33.75 basis points, compared with 32.39 basis points a week earlier.
SP500
Weekly performance: +1,21% (week-end close: 7743,41); year-to-date: +13,12%.
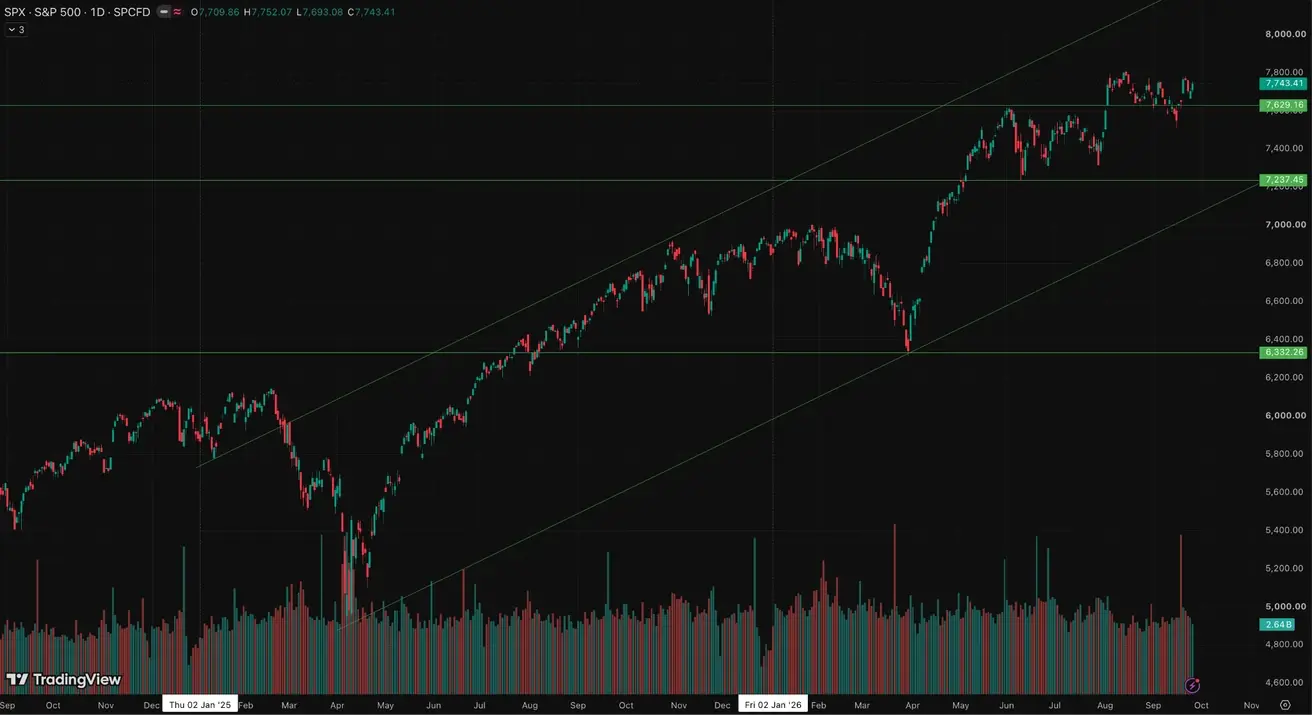
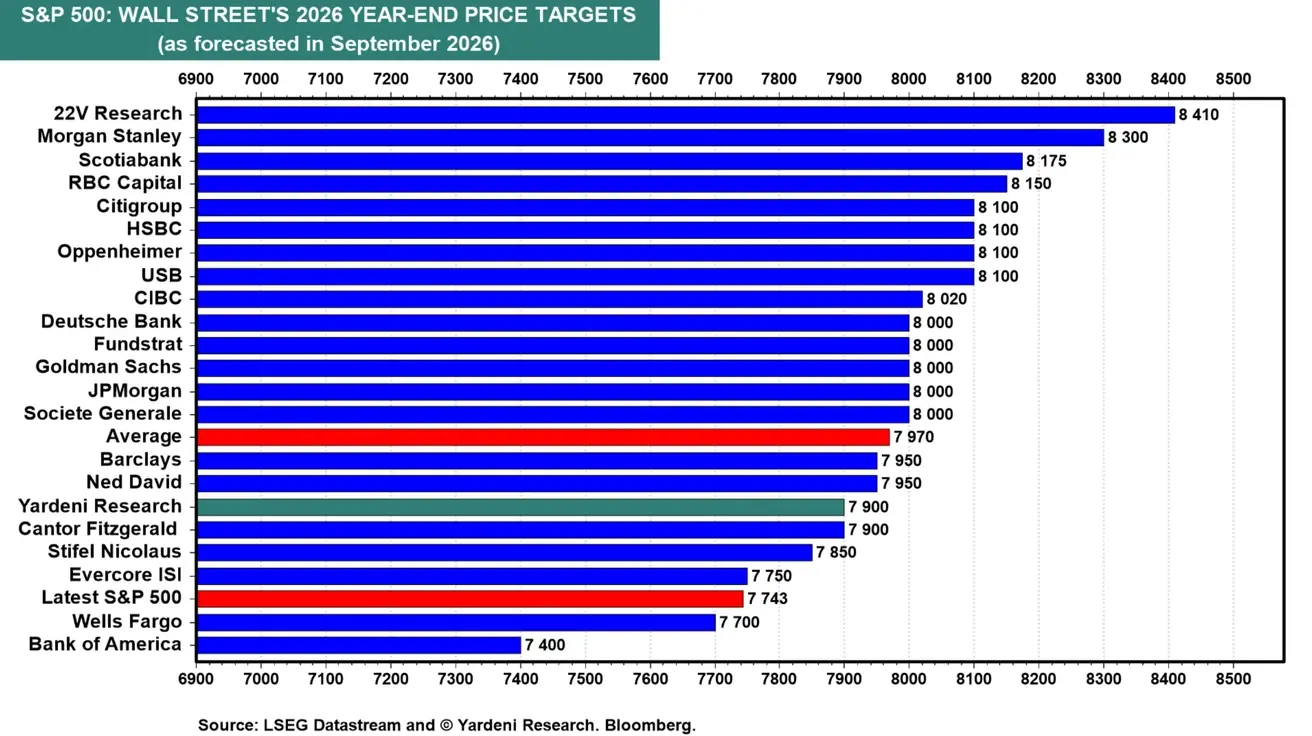
The Wall Street consensus for the S&P 500 at the end of 2026 remains moderately positive: the average year-end target is 7,970 points versus the current level of 7,743, implying roughly 3% upside.
20 of the 22 forecasts are above the index’s current level. At the same time, the forecast range remains wide — from 7,400 at Bank of America to 8,410 at 22V Research.
NASDAQ100
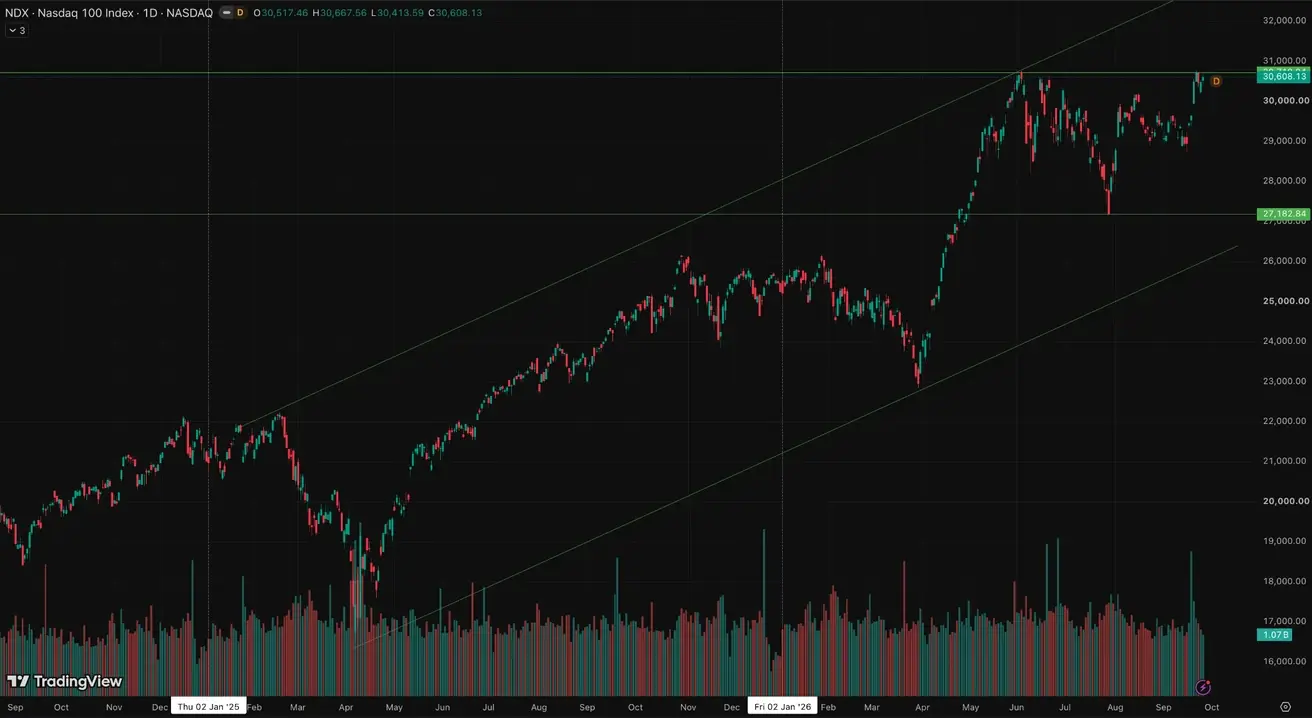
Hit an all-time intraday high; weekly performance: +3,25% (week-end close: 30608,13); year-to-date: +21,22%.
VIX
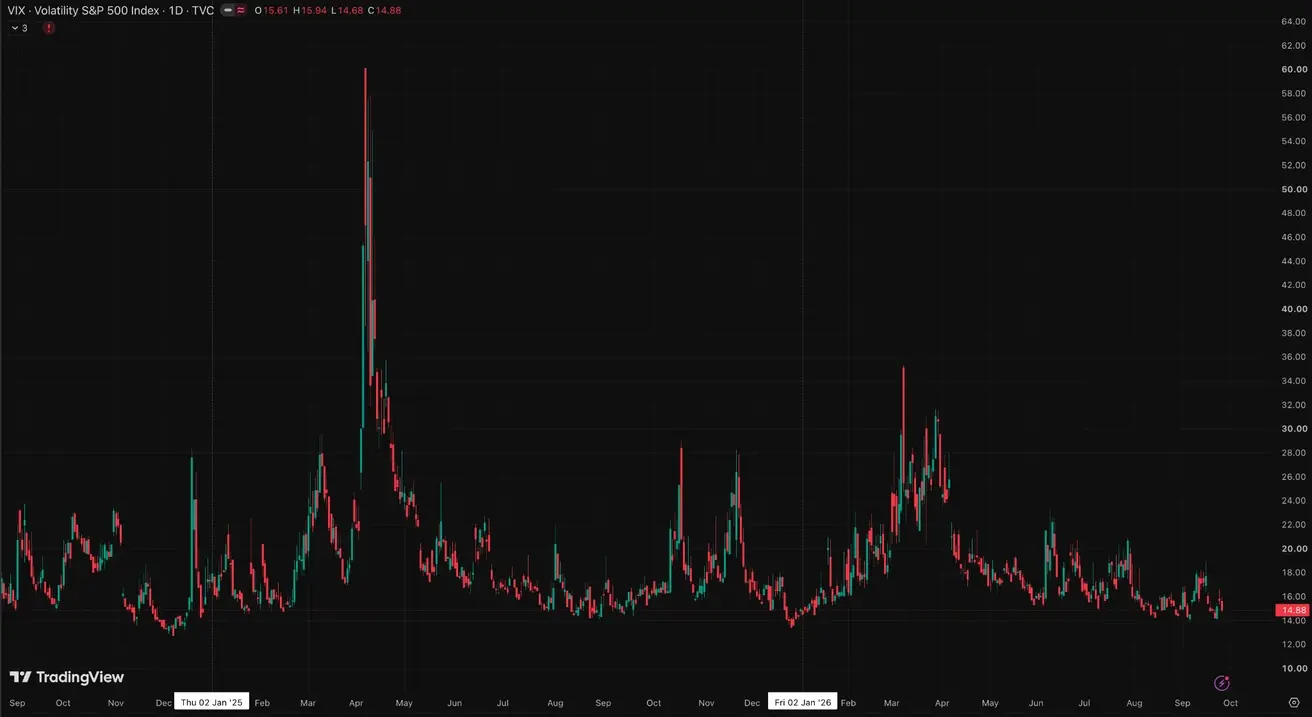
VIX (volatility index): week-end close at 14,88 points.
Eurozone
- The ECB raised interest rates, while maintaining a hawkish stance as inflationary risks continue to increase;
- Against the backdrop of the conflict in the Middle East, the ECB revised its GDP forecasts downward and raised its inflation projections for the coming years.
ECB President Christine Lagarde: inflation risks persist, particularly due to energy; the bank intends to maintain a tight stance and make rate decisions based on incoming data. At the same time, weak growth calls for stronger investment and structural reforms in Europe.
Macroeconomic Data
Interest Rates
- Deposit Facility Rate: 2.5% (previous: 2.25%);
- Marginal Lending Facility Rate: 2.9% (previous: 2.65%) — the rate at which banks can obtain overnight funding from the central bank;
- Main Refinancing Rate (Policy Rate): 2.65% (previous: 2.40%).
Inflation: Consumer Price Index (CPI) (August)
- Core CPI (YoY): 2.4% (previous: 2.5%);
- Headline CPI: revised from 2.9% to 0.4% (MoM) (previous: 0.2%);
- CPI: 3.2% (YoY) (previous: 2.9%).
Inflation Expectations (August)
- 1-year expectations: 3.0% (previous: 2.9%)
- 3-year expectations: 2.9% (previous: 2.7%)
GDP (Q2 2026)
- QoQ: 0.6% (previous: -0.2%);
- YoY: 0.5% (preliminary estimate: 0.4%); (previous: 0.3%).
Unemployment Rate (August)
- 6.4% (previous: 6.3%).
Industrial Production (August)
- MoM: -0.1% (previous: 0.0%);
- YoY: 1.67% (previous: 1.37%).
Purchasing Managers’ Index (PMI) (September)
- Services PMI: 53.0 (previous: 51.6);
- Manufacturing PMI: 52.7 (previous: 52.7);
- S&P Global Composite PMI: 53.1 (previous: 52.0).
Euro Stoxx 600 (FXXP1!)
Weekly performance: +0,11% (week-end close: 641,5); year-to-date: +8,00%.
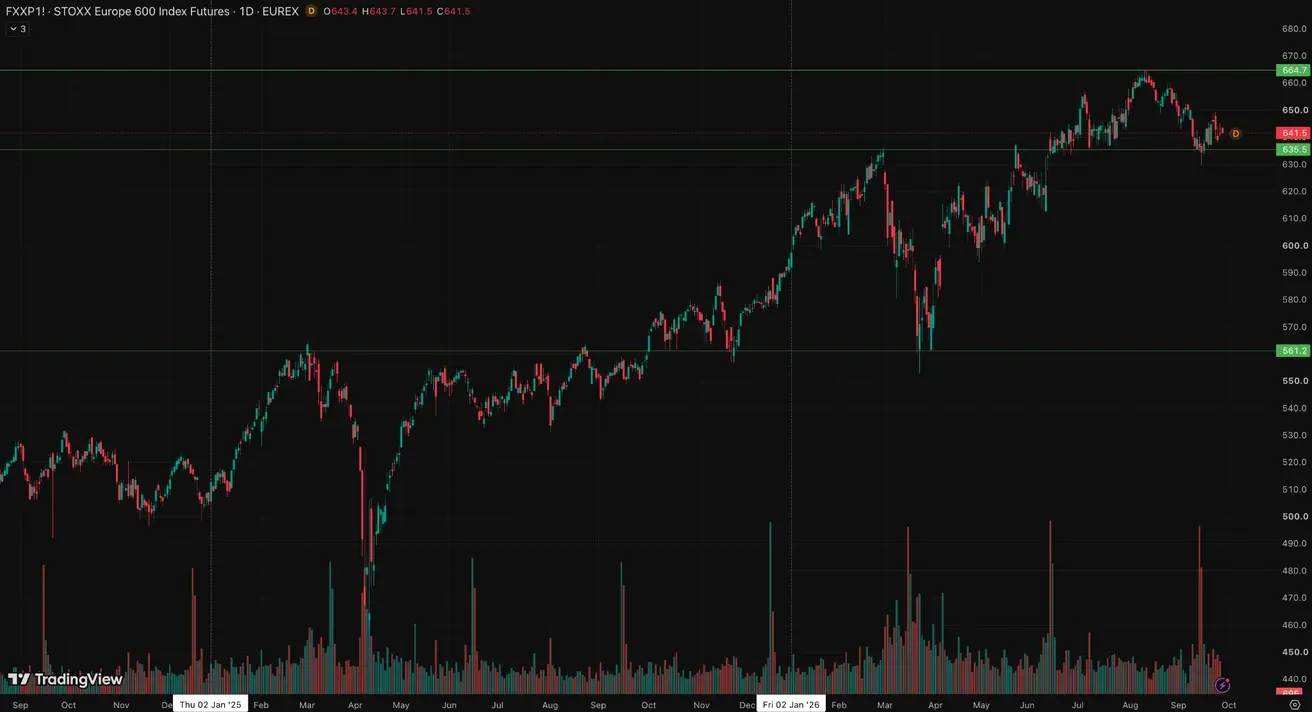
HSBC raised its year-end 2026 target for the Stoxx 600 to 680 from 670.
China
China’s economy continues to stabilize, supported by strong exports, while domestic demand and investment gradually recover. Policymakers remain measured and targeted in their approach to economic stimulus.
- Interest rates remain unchanged;
- Monetary policy remains accommodative;
- China reaffirmed its commitment to fiscal support for economic growth under its 2026 plan, including measures to stimulate domestic demand, optimize tax incentives and subsidies, and modernize industrial capacity.
The People’s Bank of China said that ahead of the long “Golden Week” holiday (National Day of the PRC), it will conduct daily short-term liquidity operations of up to 1 trillion yuan. The main goal is to smooth out a seasonal liquidity shortfall driven by higher demand for cash, tax payments, and other financial flows.
Following the meeting between Xi Jinping and Donald Trump, the trade truce was extended by only two months, whereas the market had been counting on a longer period. No announcements were made on the Taiwan issue either.
Macroeconomic Data
Interest Rates
- 1-Year Loan Prime Rate (medium-term lending): 3.00%;
- 5-Year Loan Prime Rate (benchmark for mortgage lending): 3.50%.
Inflation Indicators (August)
- Consumer Price Index (CPI): 0.4% MoM (previous: -0.1%); 0.8% YoY (previous: 0.5%):
- Producer Price Index (PPI): 3.8% YoY (previous: 3.5%).
Trade Data
- Imports (August): 28.2% YoY (previous: 27.5%);
- Exports (August): 25.0% YoY (previous: 23.9%);
- Trade Balance (USD) (August, YoY): $119.9 billion (previous: $112.5 billion).
GDP (Q2 2026)
- QoQ: 0.9% (previous: 1.3%);
- YoY: 4.3% (previous: 5.0%).
This is below the target trajectory and reflects weaker domestic momentum.
Labor Market
- Unemployment Rate (August): 5.3% (previous: 5.2%).
Industrial Activity
- Industrial Production (July, YoY): 5.2% (previous: 4.5%).
Fixed Asset Investment
- August, YoY: -7.2% (previous: -6.7%).
Retail Sales
- July, YoY: 0.6% (previous: 0.9%).
Purchasing Managers’ Indices (PMI) (August)
- Manufacturing PMI: 49.8 (previous: 49.2);
- Non-Manufacturing PMI: 49.0 (previous: 49.0);
- Composite PMI: 49.5 (previous: 49.3).
CSI 300 Index (000300.HK)
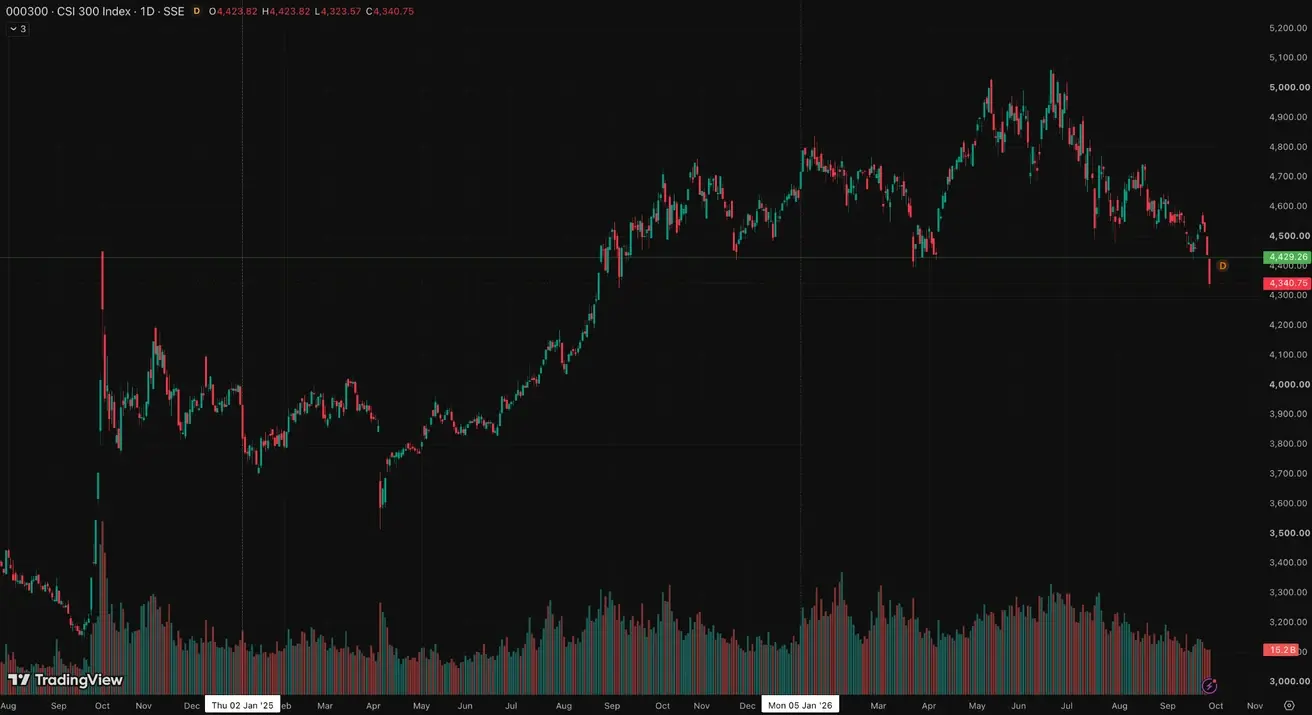
Weekly performance: -5,92% (week-end close: 4340,75); year-to-date: -9,03%.
World
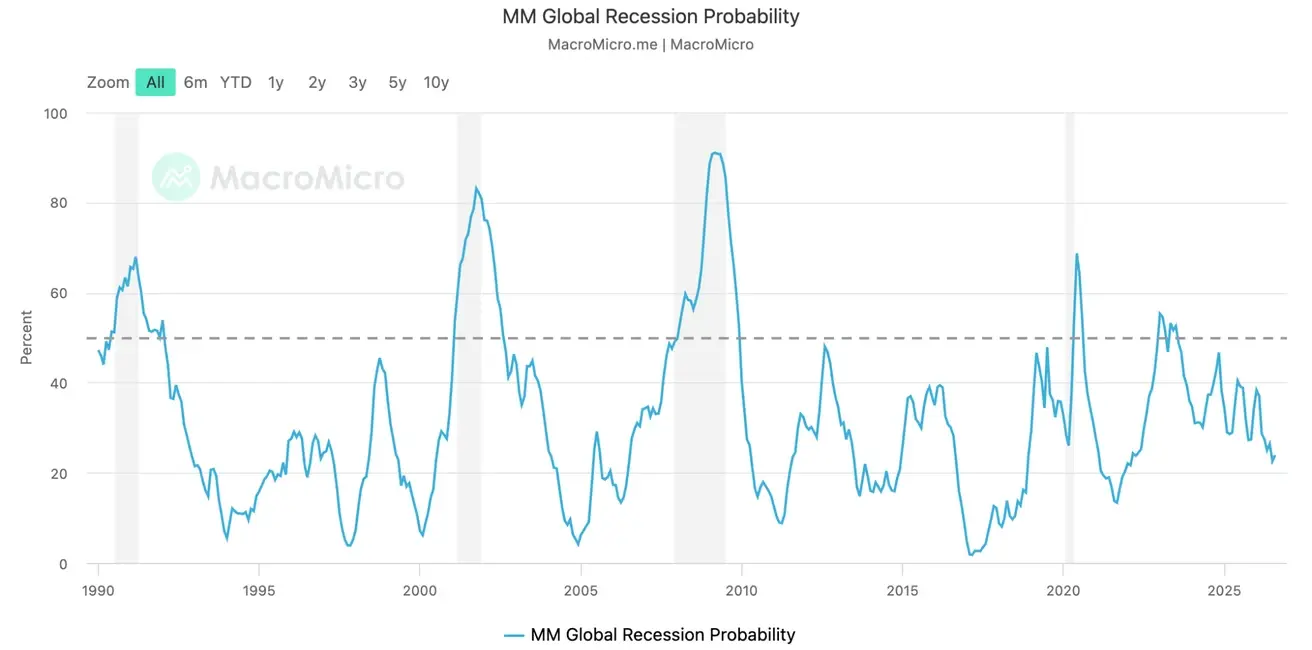
The probability of a global recession, according to the MacroMicro indicator, has fallen to around 25% and remains well below the critical 50% threshold. Current dynamics point to a continued slowdown scenario without the global economy tipping into recession:
The Organization for Economic Co-operation and Development (OECD) published its Interim Economic Outlook for September 2026:
Despite geopolitical turmoil, including energy market shocks, the global economy is proving resilient. The OECD raised its 2026 global GDP growth forecast to 2.9% (from 2.8% in its June estimates), but lowered its 2027 expectations to 3.0%.
Growth drivers and positive factors:
- Artificial intelligence (AI) momentum: Strong activity and large-scale investment in AI are providing significant support to the technology sector and boosting overall productivity;
- Lower energy prices: Despite short-term volatility, energy prices are expected to stabilize and correct in 2027, supporting consumers and reducing business costs;
- Income resilience: In a number of major economies, price pressures are gradually easing, allowing household real incomes to stabilize.
Key risks to the global economy
The OECD warns that if the risks below materialize simultaneously, global growth in 2027 could fall by a further 0.7%, while inflation could jump by 1.1%:
- Sovereign debt crisis: EU government bond yields have hit multi-year highs. The OECD strongly recommends that countries contain and reallocate public spending to avoid a debt collapse;
- Geopolitics and energy: Prolonged conflicts in the Middle East are triggering sharp spikes in oil and gas prices;
- Climate shocks: A strong El Niño threatens crop yields, which could trigger a new wave of food inflation;
- AI sector repricing: Returns on trillions of dollars invested in artificial intelligence could be lower than expected.
Gold Futures (GC)
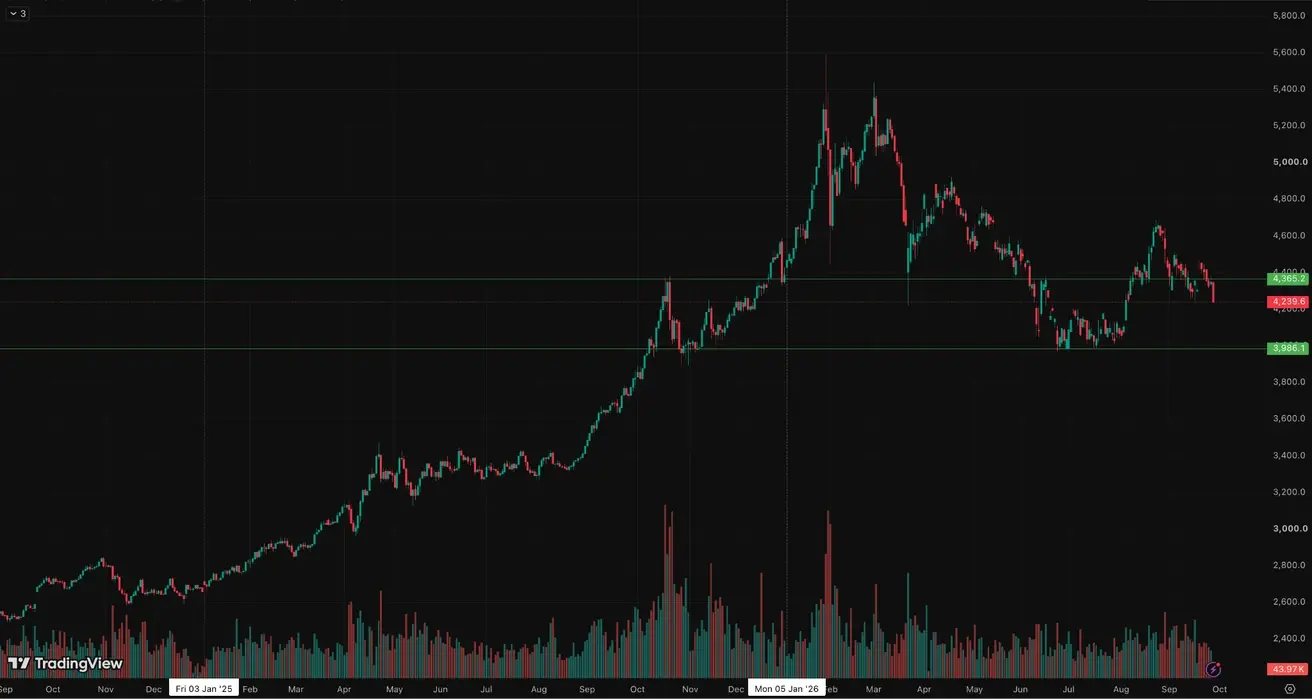
Weekly performance: -4,28% (week close: $4238,7 per troy oz); year-to-date: -2,16%
Oil Futures
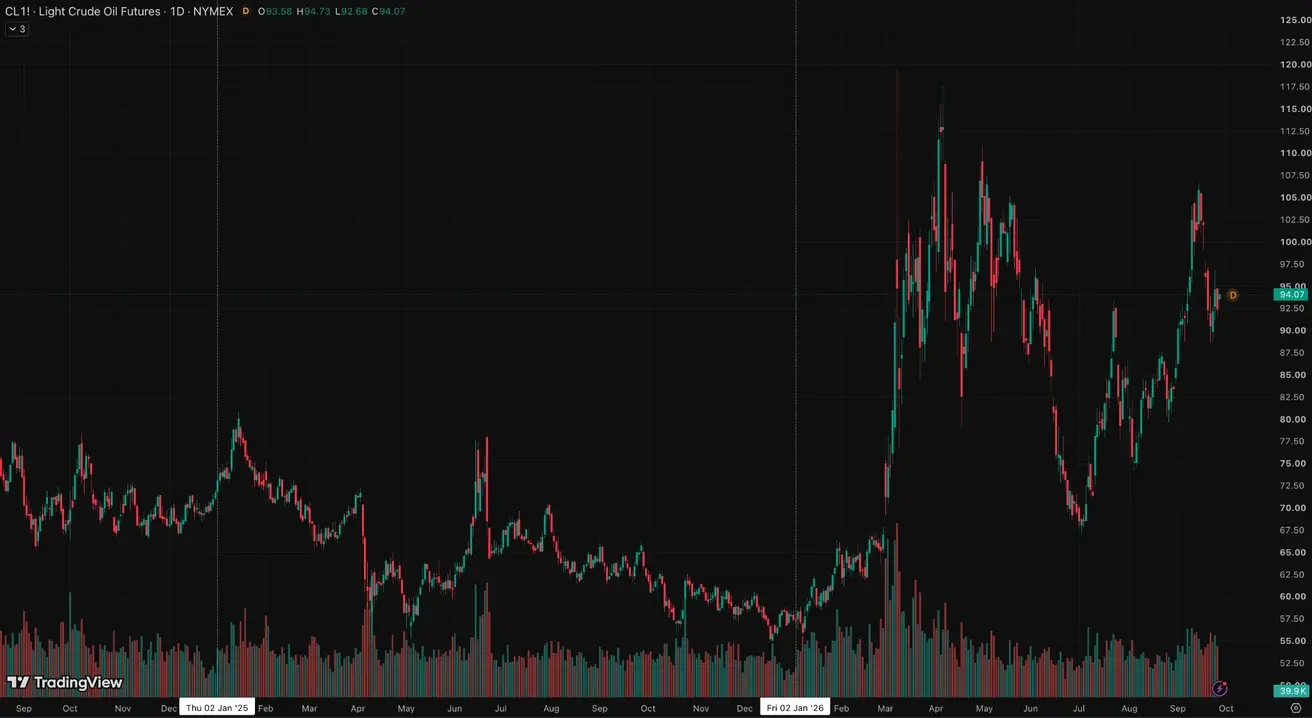
Weekly performance: -1,44% (week close: $94,7 per barrel); year-to-date: +64,95%
Dollar Index Futures (DX)
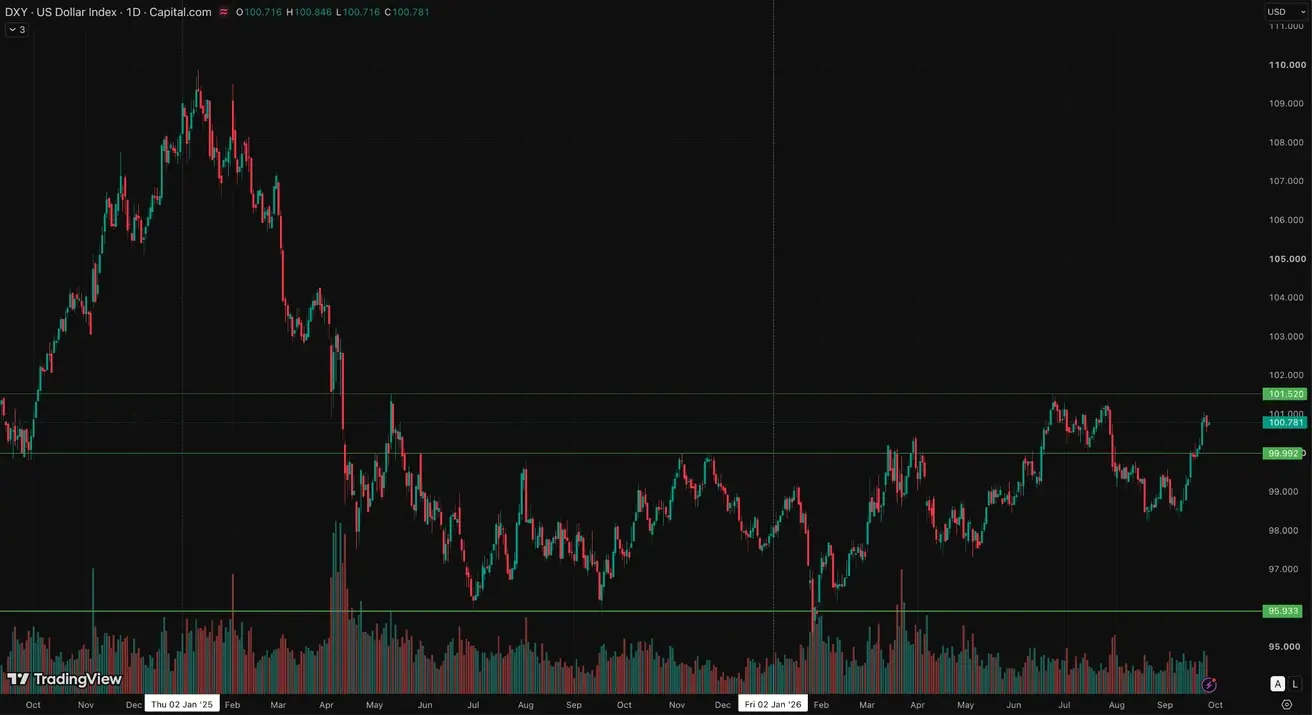
The dollar is strengthening against major currencies on expectations of a Fed rate hike and a sharp rise in bond yields.
Weekly performance: +0,79% (week close: 100,681); year-to-date: +2,74%.
Crypto Market
The crypto market is consolidating after a second wave of growth, awaiting new regulatory rules from the SEC and the CFTC.
The Fed has opened for public comment its proposals for a regulatory framework for stablecoin issuers under the GENIUS Act.
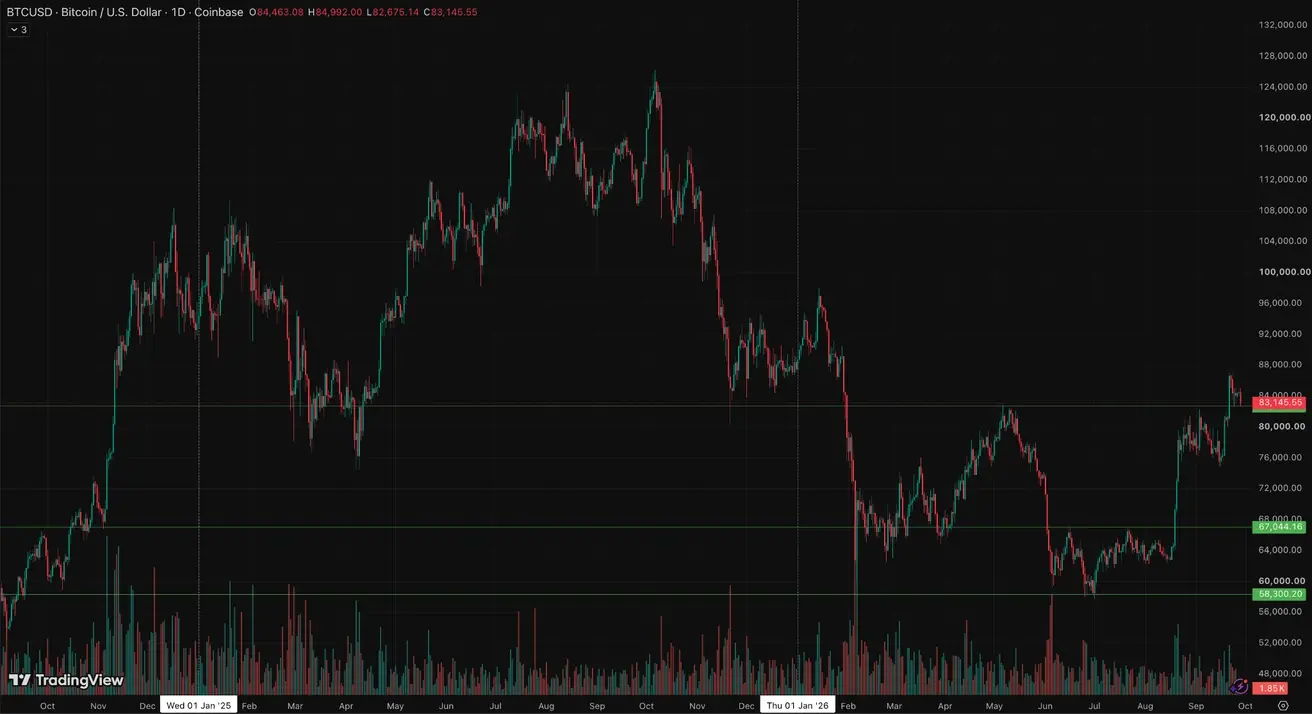
BTC Futures
Weekly performance: +4,07% (week close: $84,462.14); year-to-date: -3,71%.
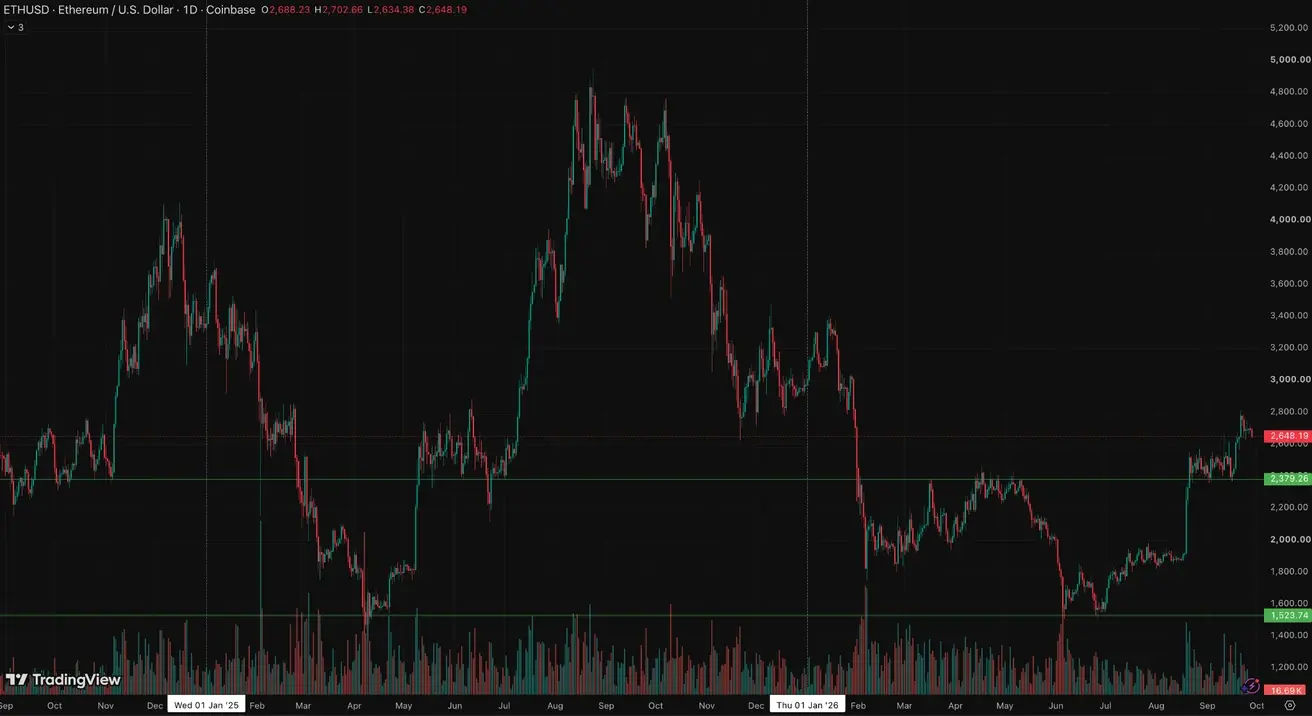
ETH Futures
Weekly performance: +1,66% (week close: $2688,23); year-to-date: -9,61%.
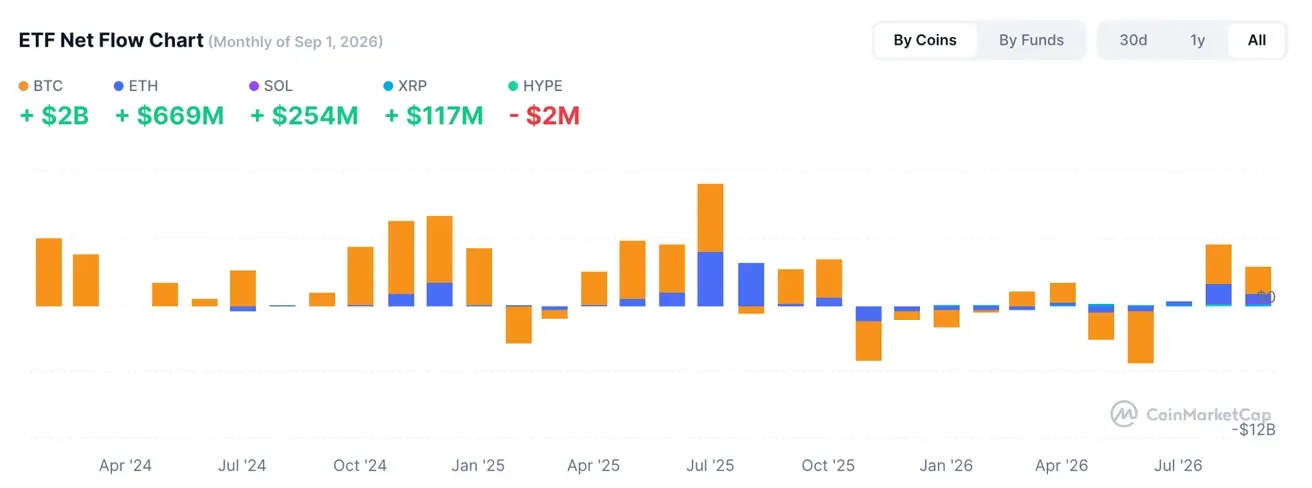
ETF Net Flows
Total Cryptocurrency Market Capitalization
Total crypto market capitalization: $2,85 trillion (vs $2,87 trillion a week earlier) (coinmarketcap.com).
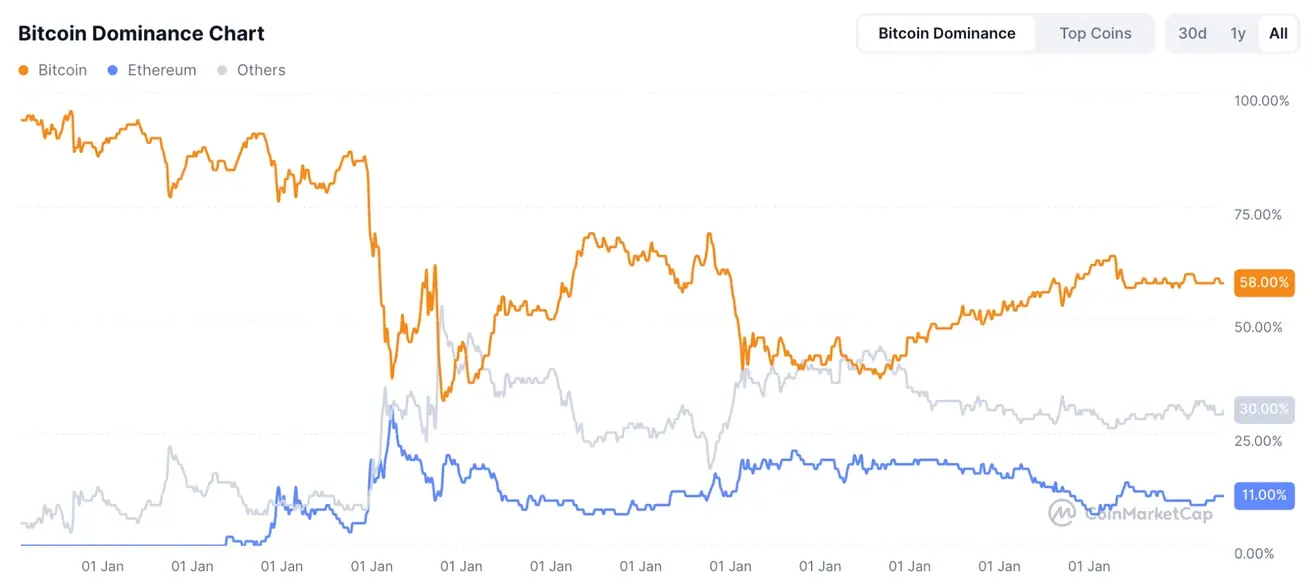
Crypto asset market shares:
- Bitcoin 58,6% (prev. 58,9%)
- Ethereum 11,3% (prev. 11,5%)
- Others 30,0% (prev. 29,6%)