Русский
 Қазақша
 Eesti
EestiSeptember 07 – September 13, 2026: Weekly economic update
Key market updates

Key Takeaways:
- The policy rate remains unchanged, while the Fed's rhetoric stays cautious but has turned more hawkish;
- Monetary policy remains moderately restrictive;
- U.S. macroeconomic data continue to support a soft-landing scenario: inflation risks are increasing, the labor market is cooling without signs of recession, and current conditions do not yet warrant a rate cut.
Inflation: Consumer Price Index (August)
- Core CPI (MoM): 0.3% (previous: 0.2%).
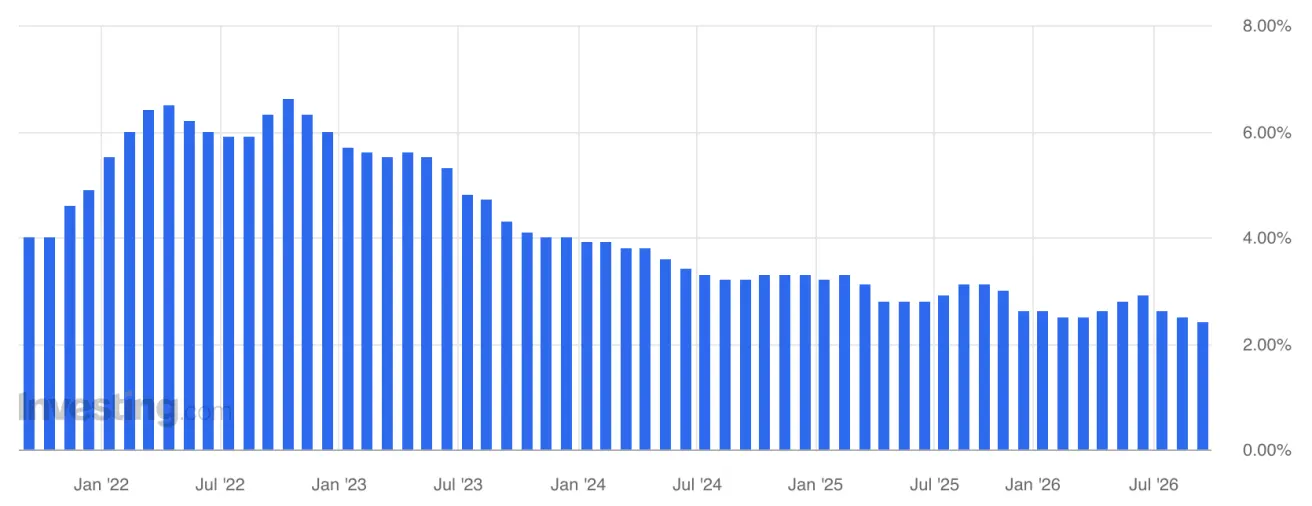
- Core CPI (YoY): 2.4% (previous: 2.5%).
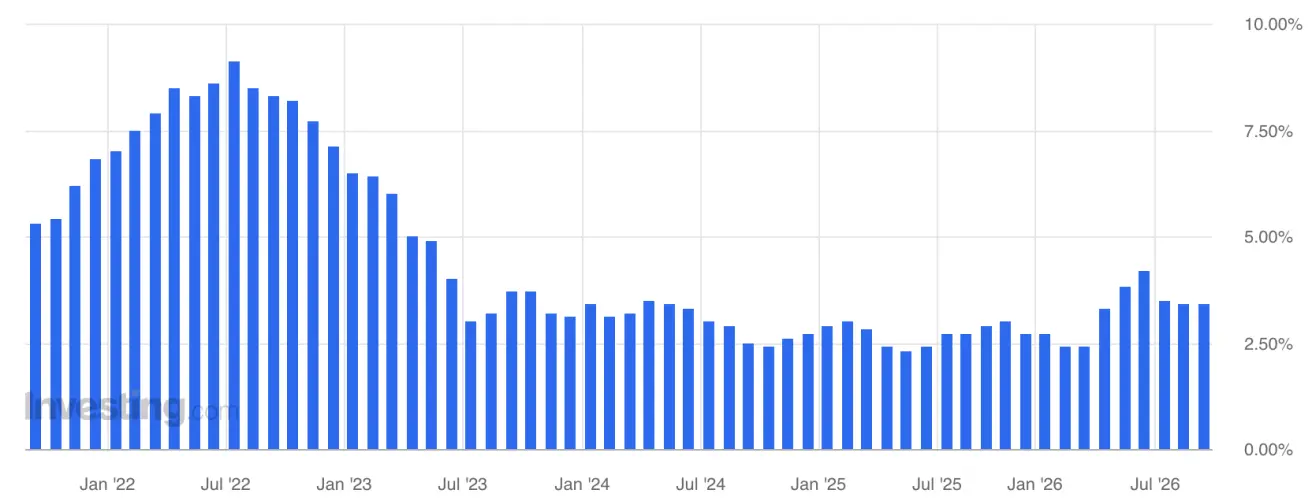
- CPI (MoM): 0.4% (previous: 0.1%).
- CPI (YoY): 3.4% (previous: 3.4%).
Producer Price Index (August)
- PPI (MoM): 0.4% (previous: 0.0%).
- Core PPI (MoM): 0.3% (previous: 0.2%).
Inflation Expectations (Michigan) (August)
- 12-month Inflation Expectations: 4.6% (previous: 4.3%).
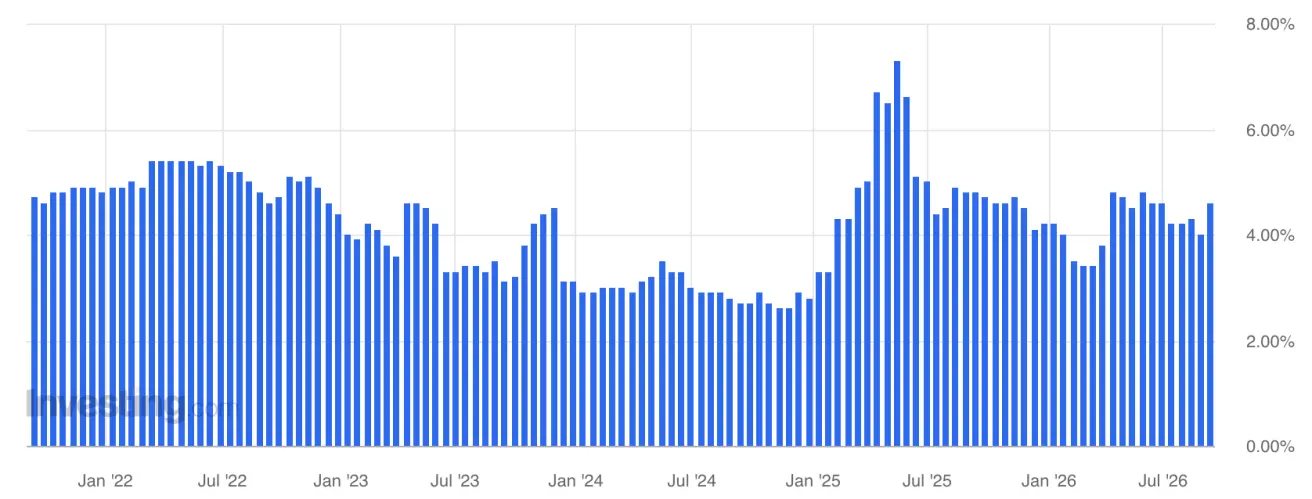
- 5-Year Inflation Expectations: 3.4% (previous: 3.3%).
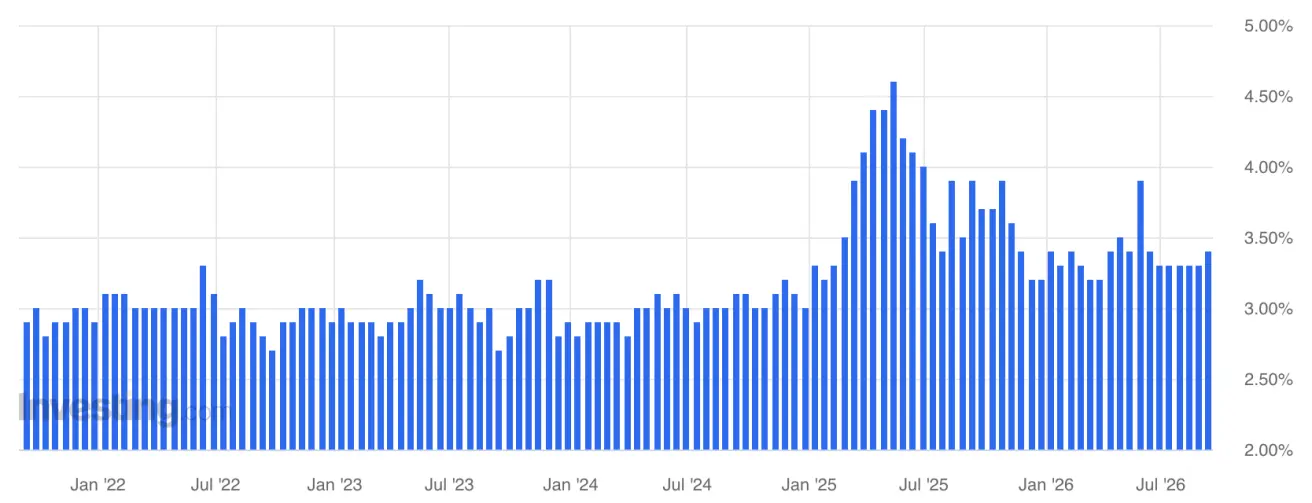
GDP (U.S. Bureau of Economic Analysis, BEA) — Q2 2026 annualized growth rate, preliminary: +1.5% (Q1 2026: +2.1%); forecast: 1.5%
GDPNow (the Atlanta Fed's real-time estimate of official GDP growth ahead of release (Q3 2026)): 4.4% (previous: 4.7%).
Trade Balance (July): -88 bn (previous: -71.2 bn).
Labor Market (BLS) (July/August)
- Unemployment Rate: 4.1% (previous: 4.1%).
- Total Number of People Receiving Unemployment Benefits in the US: 1,774K (previous: 1,779K).
- Initial Jobless Claims: 207K (previous: 206K).
- Change in Nonfarm Payrolls: 162K (previous: 23K).
- Change in Employment in the Private Nonfarm Sector: 127K (previous: -30K).
- Average Hourly Earnings (YoY): 3.1% (previous: 3.2%).
- JOLTS Job Openings: 7.271M (previous: 6.866M).
Business Activity Index (PMI) (July)
(Above 50 indicates expansion; below 50 indicates contraction)
- Services PMI: 56.5 (previous: 56.8).
- Manufacturing PMI: 53.9 (previous: 53.8).
- Composite PMI: 56.0 (previous: 56.0).
The CPI data argue more for holding rates steady, but geopolitics—particularly the sharp jump in oil prices—has worsened Fedwatch expectations and soured sentiment in debt markets.
Monetary Policy
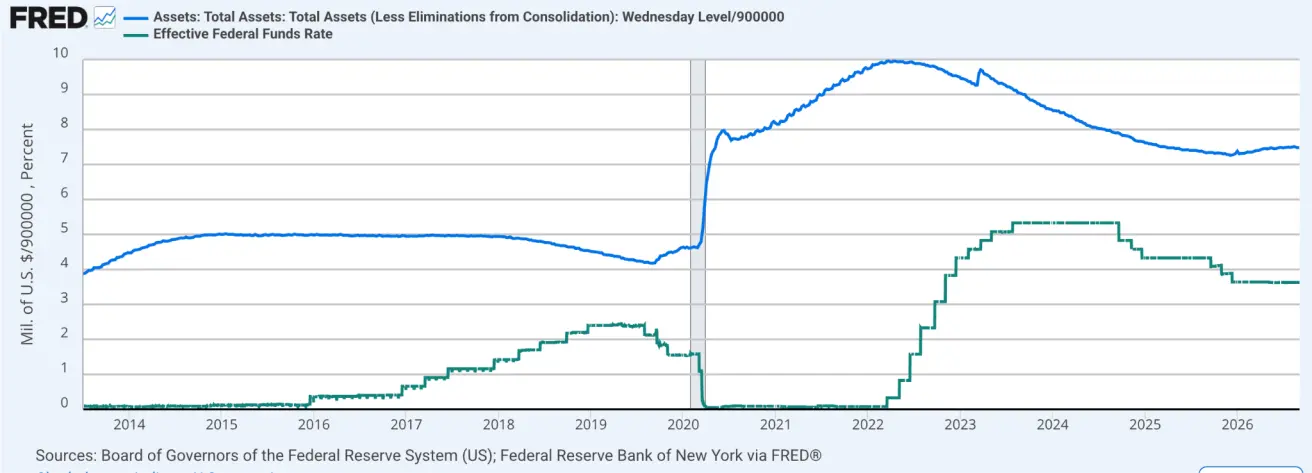
Effective Federal Funds Rate (EFFR): 3.50%–3.75%.
Federal Reserve Balance Sheet: $6.737 trillion, +3.09% since the suspension of quantitative tightening (QT), when the balance sheet stood at $6.535 trillion.
September 16 – FOMC Meeting
Market Forecast for Rate (FedWatch)
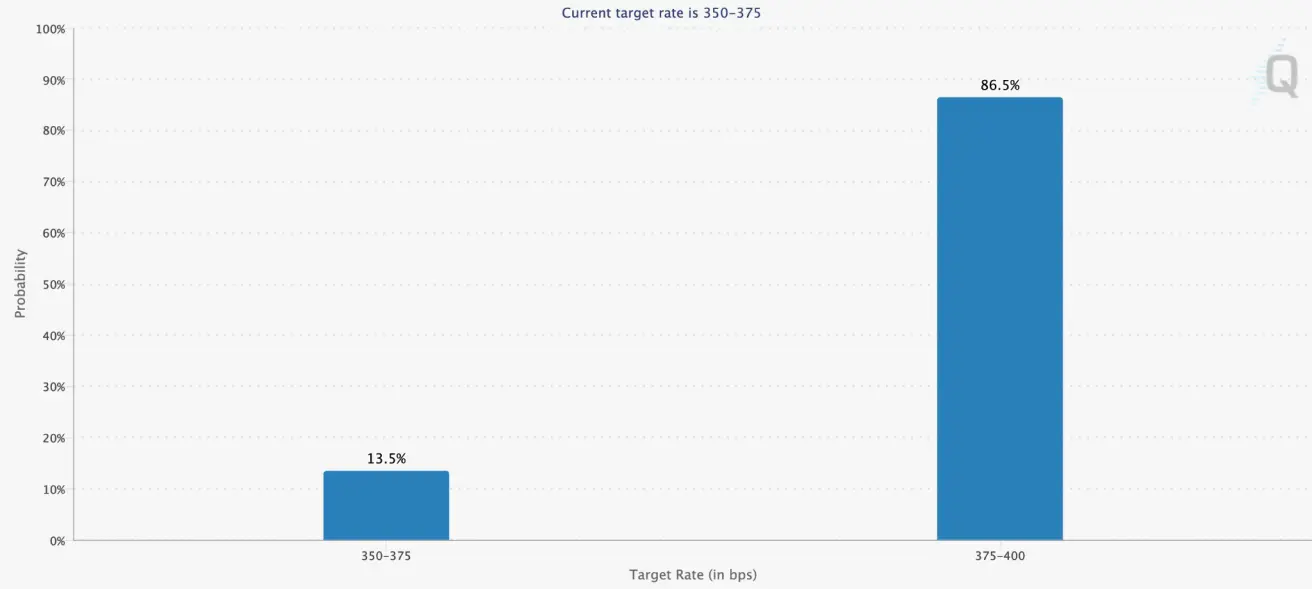
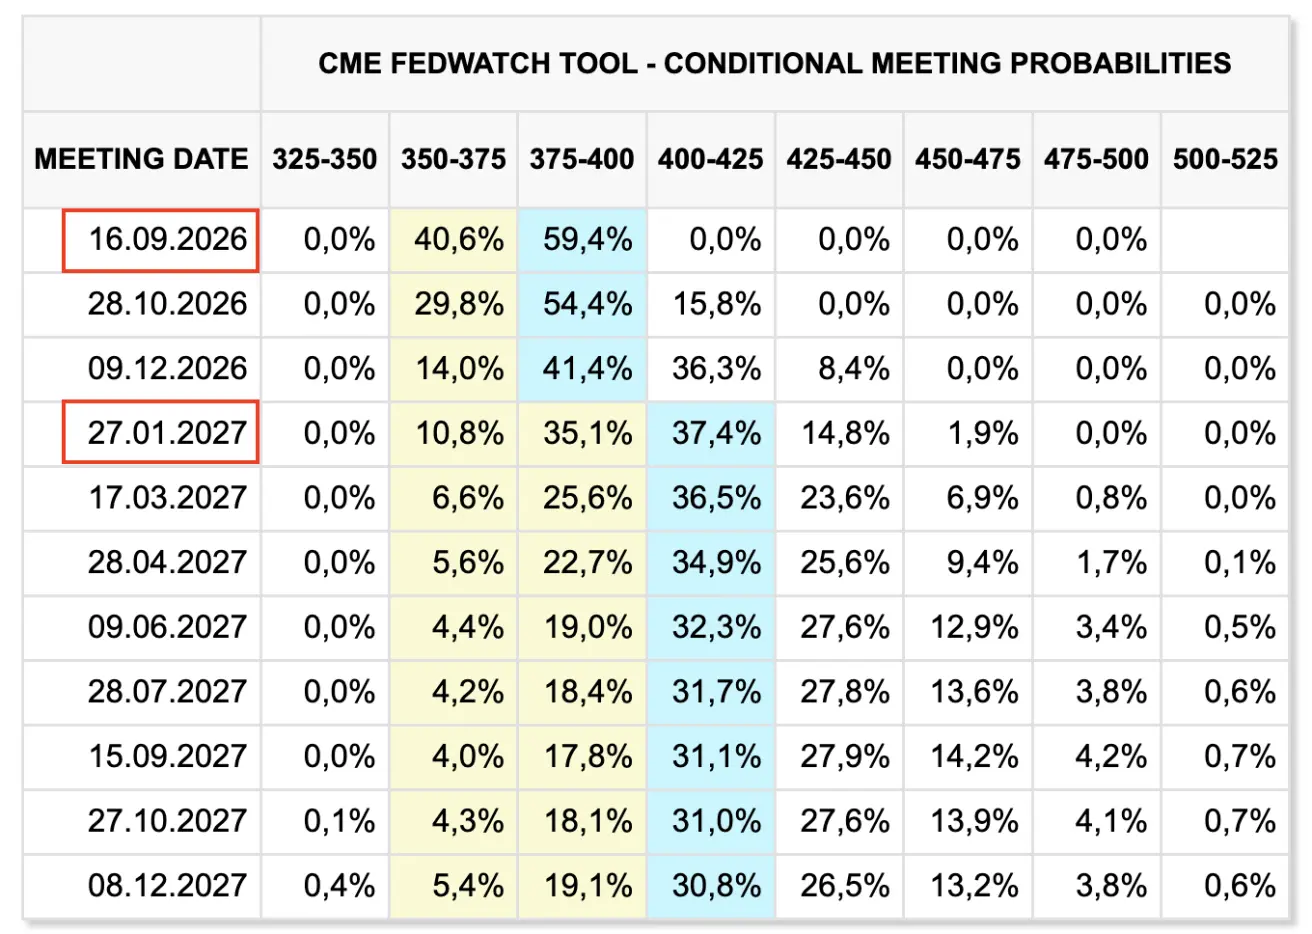
For the next FOMC meeting (September 16) - the implied market probability of a 0.25% rate hike is 86.5% (week ago: 59.4%):
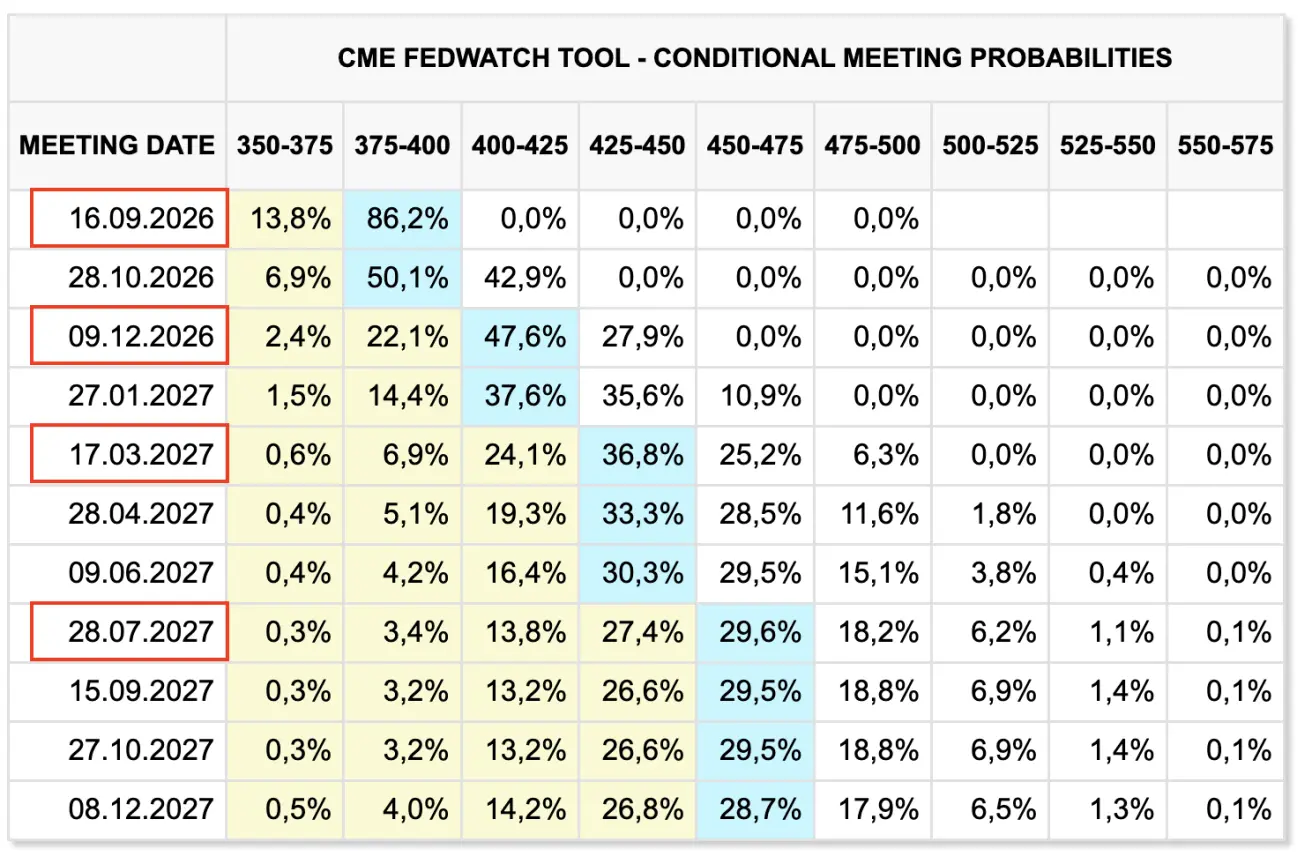
Over the next 12 months, the market now expects four 25-basis-point rate hikes, bringing the target range to 4.50%–4.75%:
Today:
A week earlier:
Bond Market
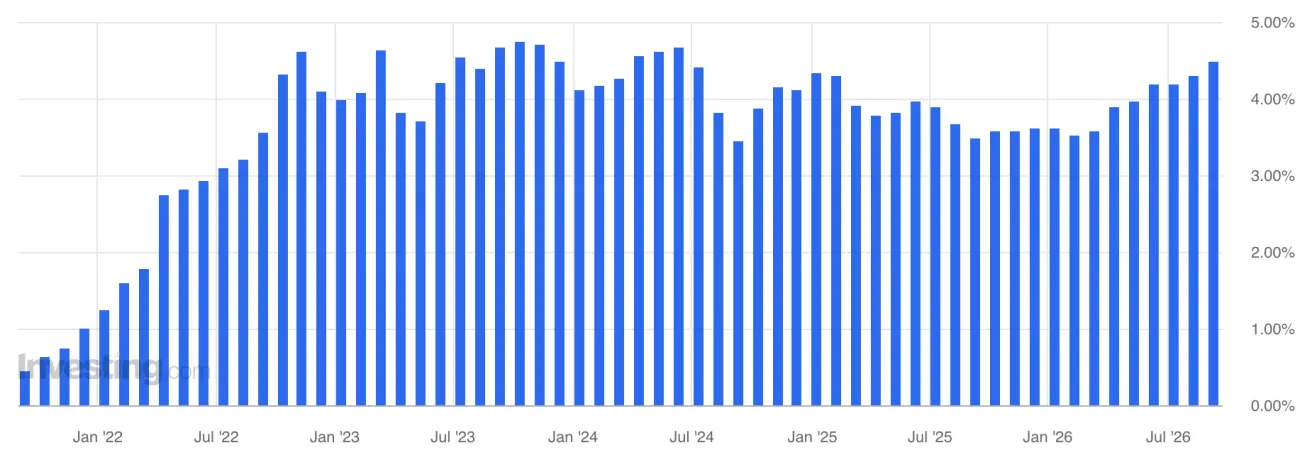
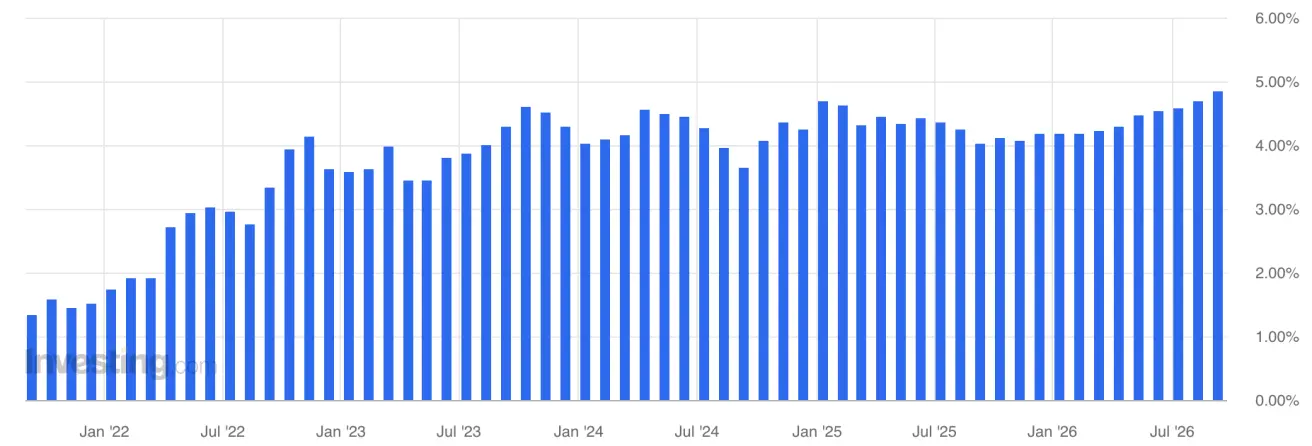
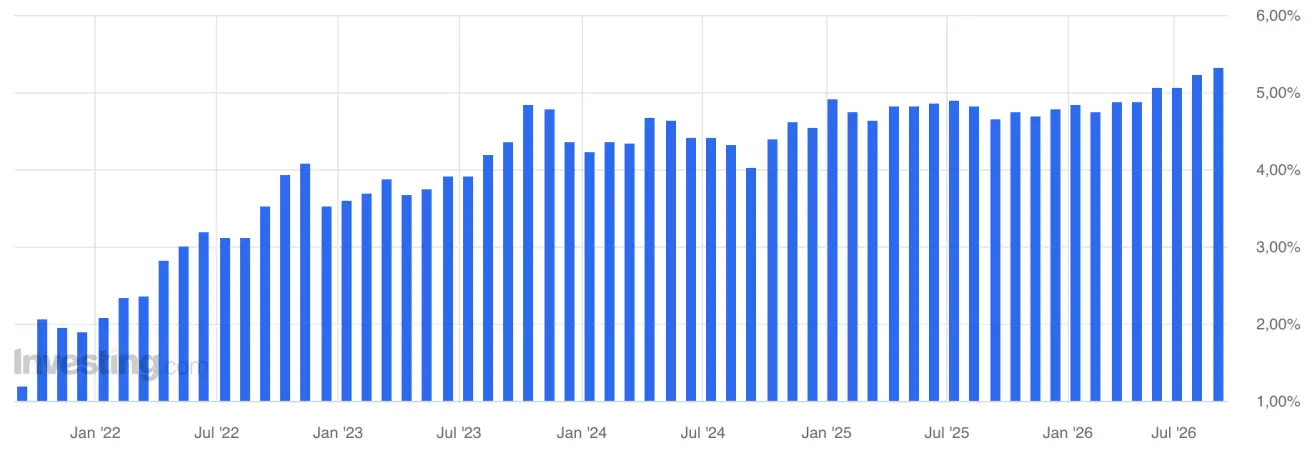
Primary-market auction yields continued to rise across the maturity spectrum.
3-Year Treasury Note auction: 4.474% (previous: 4.291%):
10-Year Treasury Note auction: 4.834% (previous: 4.683%)
30-Year Treasury Bond auction: 5.308% (previous: 5.216%):
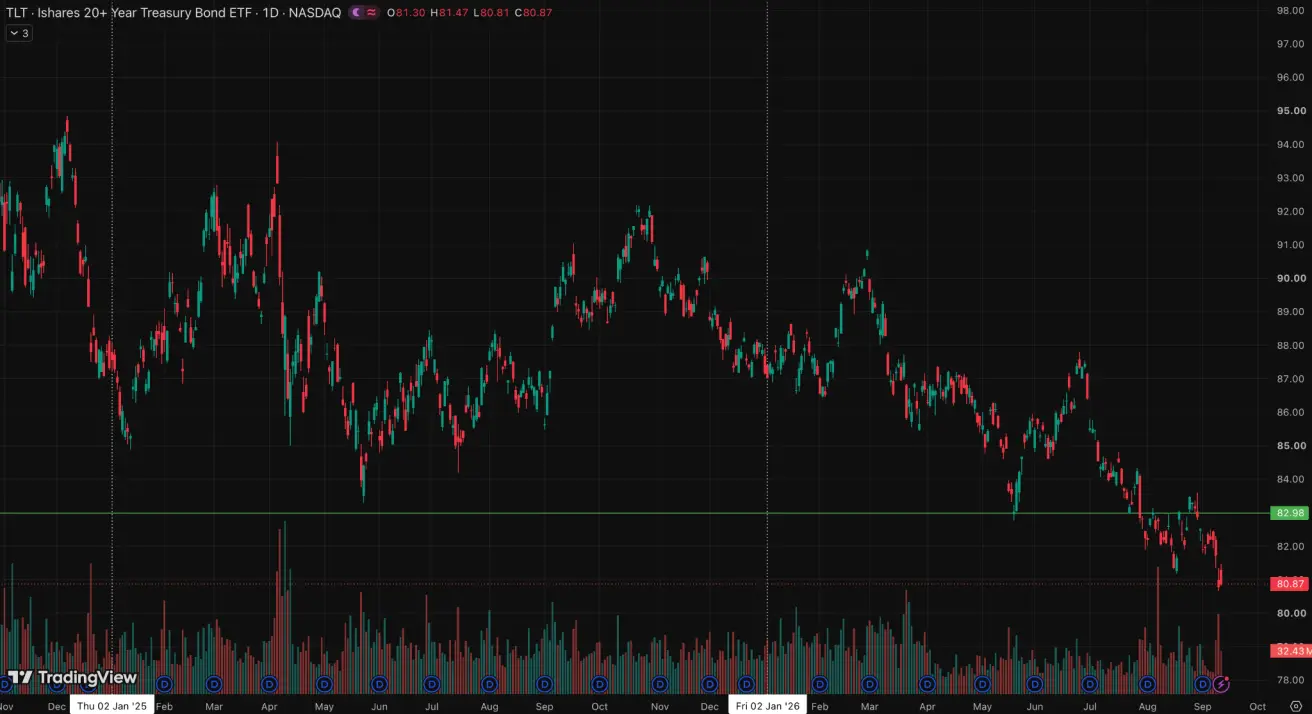
U.S. Treasury Bonds 20+ Years (TLT ETF): -1,63% (week close: 80,87); -7,22% year-to-date.
Yields and Spreads
- Market Yield on U.S. Treasury Securities at 10-Year Constant Maturity: 4.98% (previous: 4.8%);
- 2-Year U.S. Treasury Yield: 4.63% (previous: 4.38%);
- ICE BofA BBB US Corporate Index Effective Yield: 5.86% (previous: 5.69%).
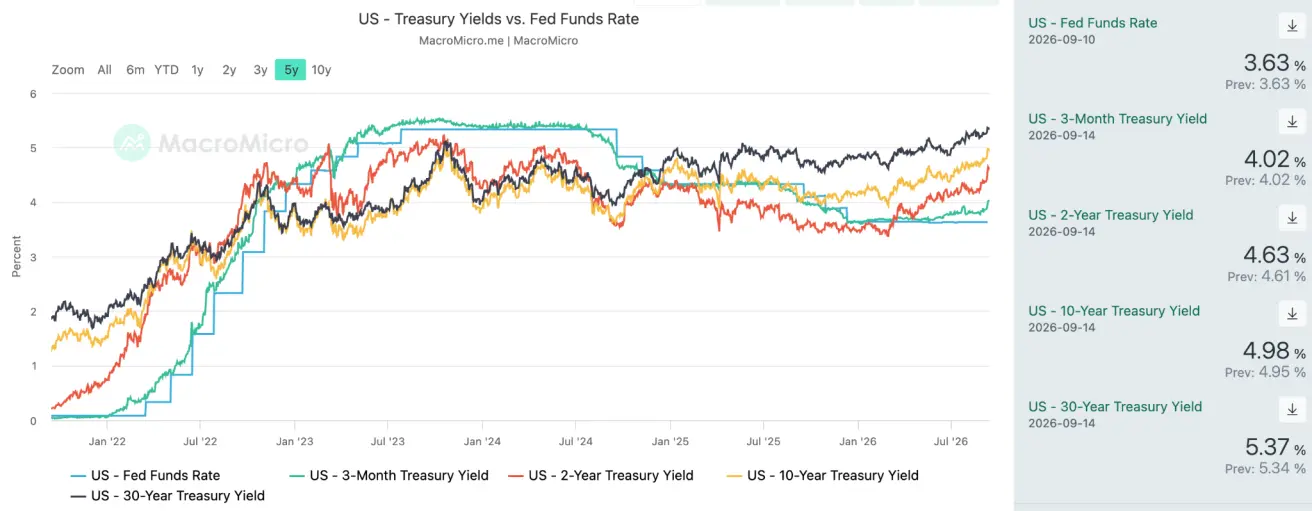
- The yield spread between 10-year and 2-year U.S. Treasury securities stands at 35 basis points (previous: 42 bps);
- The yield spread between 10-year and 3-month U.S. Treasury securities stands at 96 basis points (previous: 94 bps).
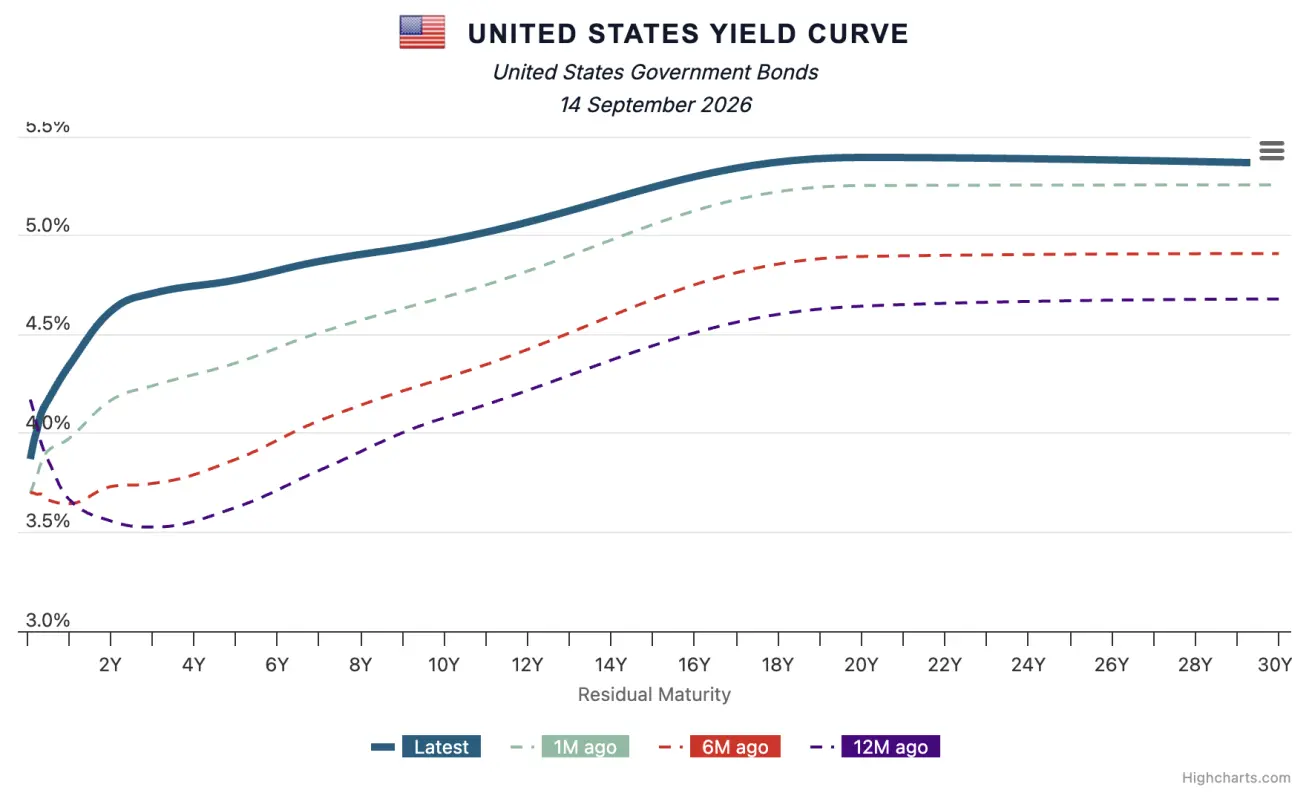
U.S. Treasury Yield Curve
The cost of a 5-year U.S. Credit Default Swap (CDS) — a market-based measure of sovereign default insurance — is 31.95 basis points, compared with 32.38 basis points a week earlier.
SP500
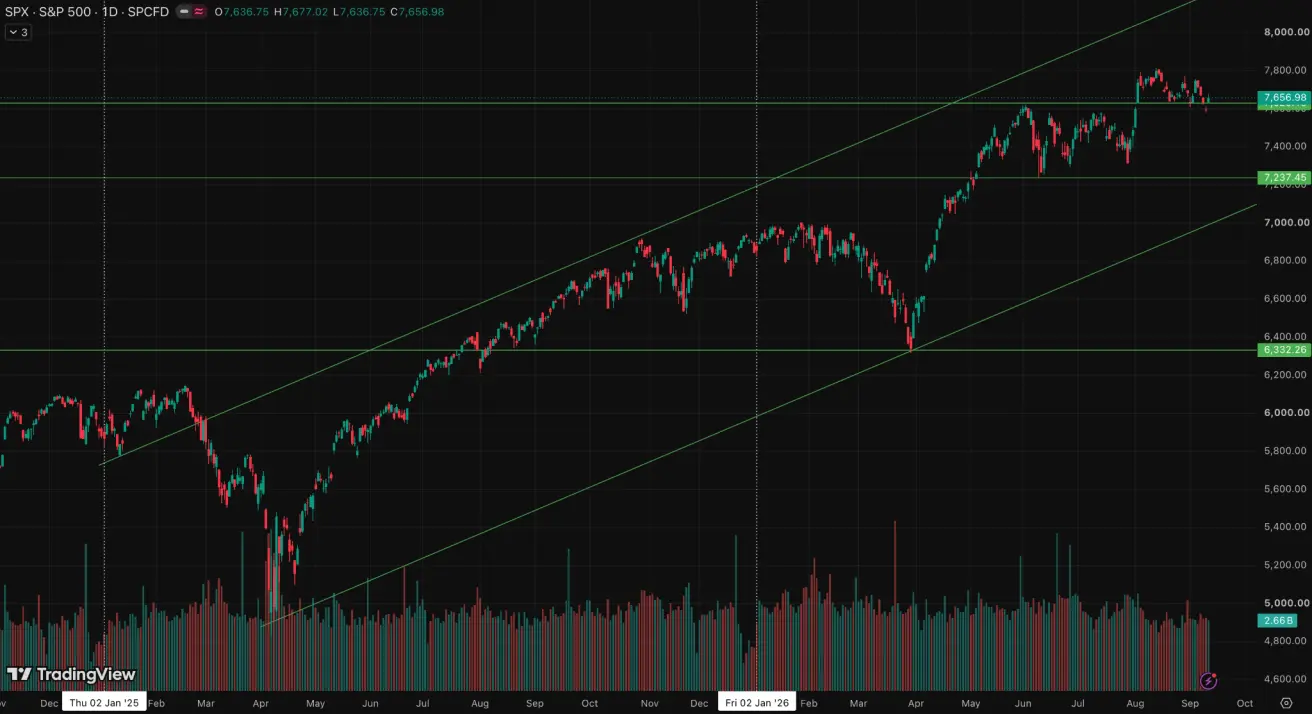
Weekly performance: -0,8% (week-end close: 7656,98); year-to-date: +11,85%.
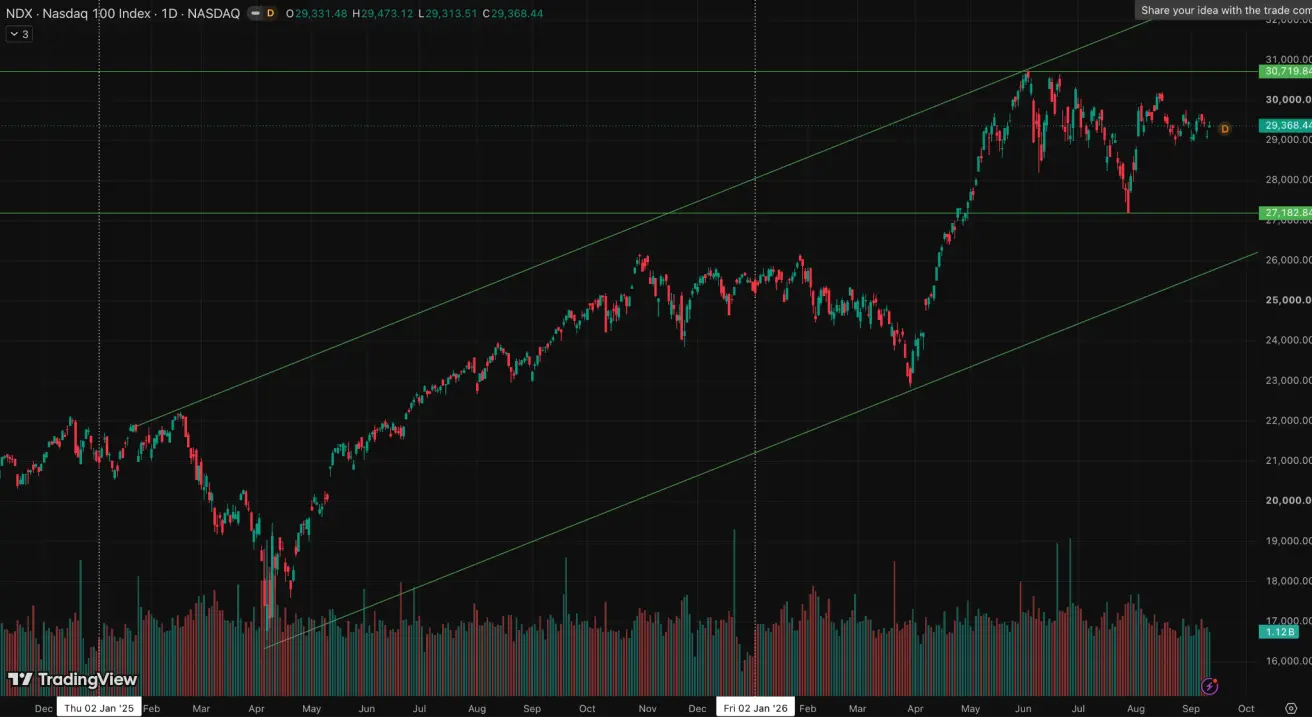
NASDAQ100
Weekly performance: -0,59% (week-end close: 29368,44); year-to-date: +16,31%.
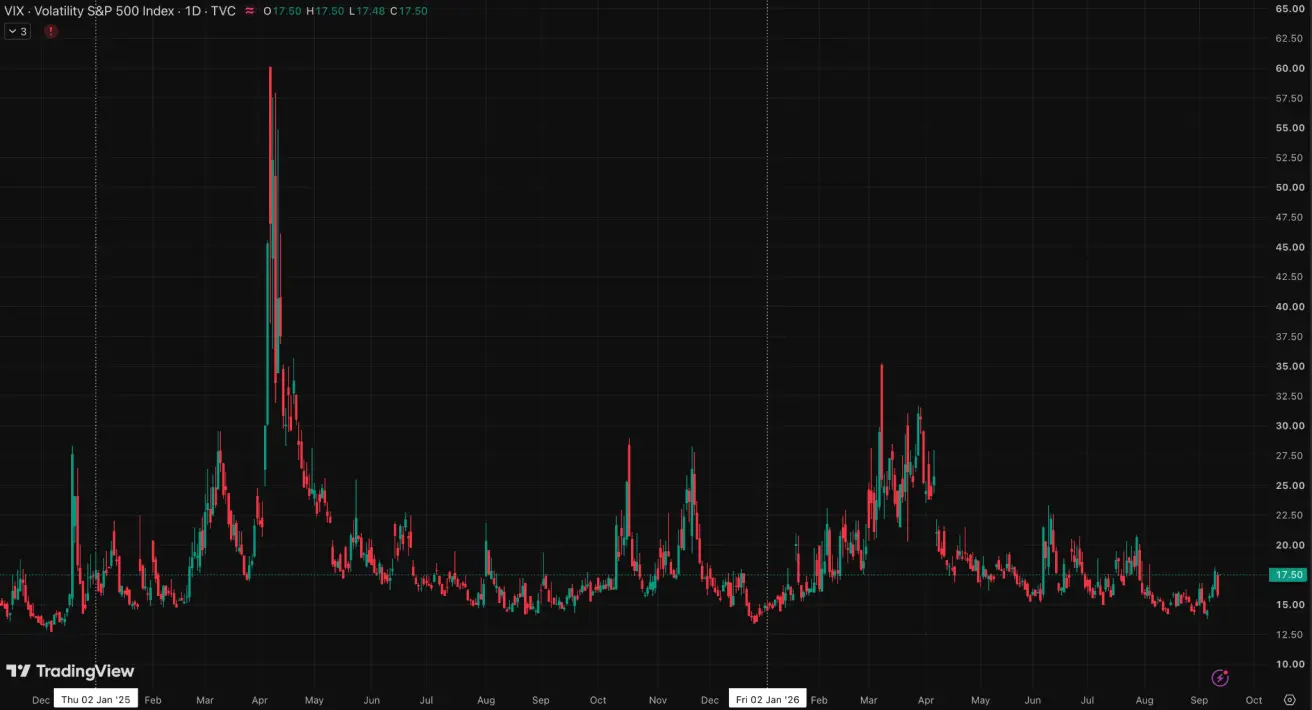
VIX
VIX (volatility index): week-end close at 15,85 points.
Eurozone
- The ECB raised interest rates, while maintaining a hawkish stance as inflationary risks continue to increase;
- Against the backdrop of the conflict in the Middle East, the ECB revised its GDP forecasts downward and raised its inflation projections for the coming years.
Key points from the ECB's September 10 decision and takeaways from Lagarde's press conference:
Interest Rates
- Deposit Facility Rate: 2.5% (previous: 2.25%);
- Marginal Lending Facility Rate: 2.9% (previous: 2.65%) — the rate at which banks can obtain overnight funding from the central bank;
- Main Refinancing Rate (Policy Rate): 2.65% (previous: 2.40%).
Inflation: Consumer Price Index (CPI) (August)
- Core CPI (YoY): 2.4% (previous: 2.5%);
- Headline CPI: 2.9% (MoM) (previous: 0.2%);
- CPI: 3.3% (YoY) (previous: 2.9%).
GDP (Q2 2026 Final)
- QoQ: 0.6% (previous: -0.2%);
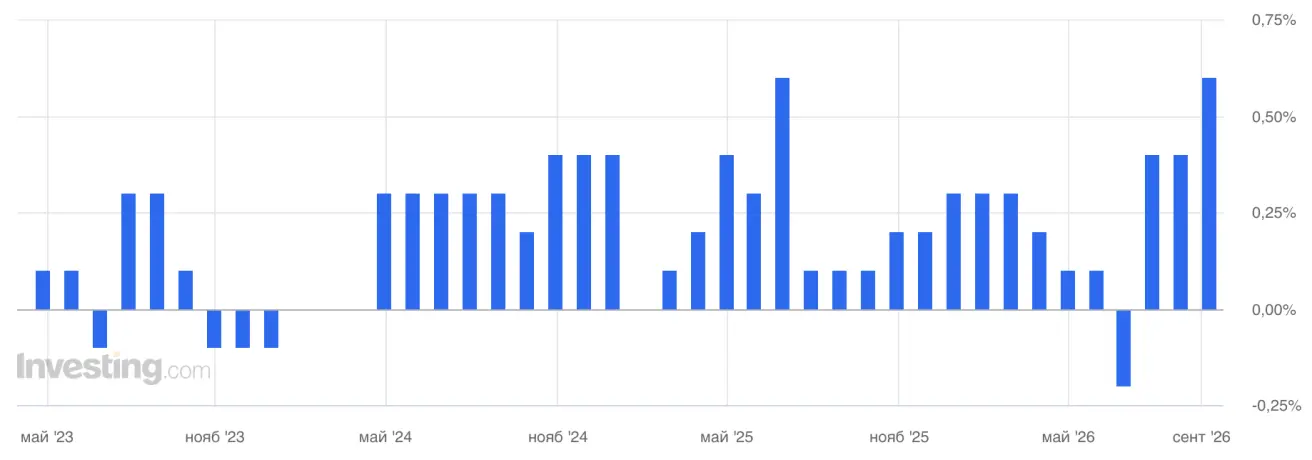
- YoY: 0.5% (preliminary estimate: 0.4%); (previous: 0.3%).
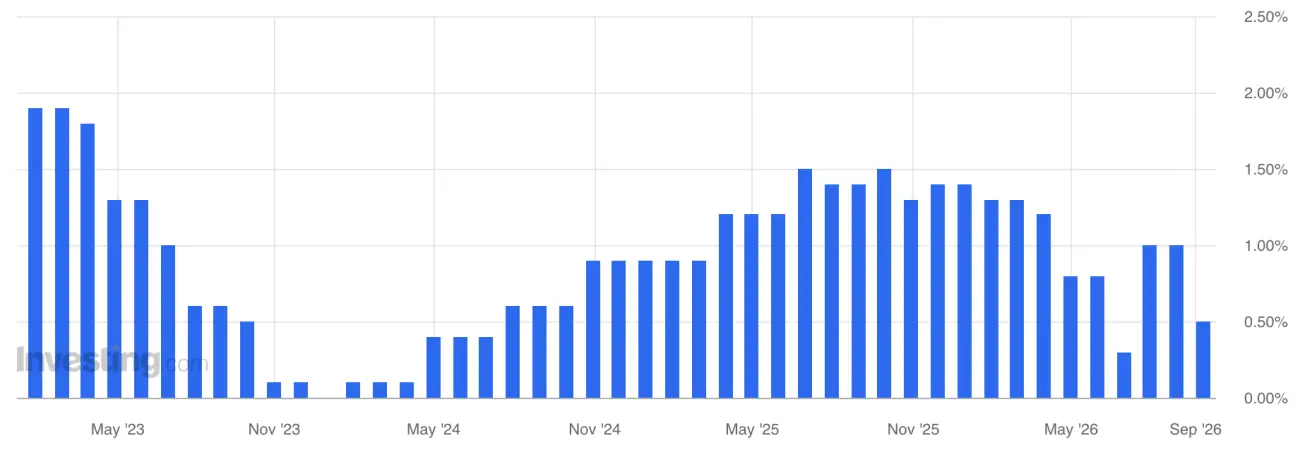
Unemployment Rate (August)
- 6.4% (previous: 6.3%).
Industrial Production (June)
- MoM: 0.0% (previous: 0.3% revised);
- YoY: 1.67% (previous: 1.37%).
Purchasing Managers' Index (PMI) (August)
- Services PMI: 51.6 (previous: 51.7);
- Manufacturing PMI: 52.7 (previous: 52.8);
- S&P Global Composite PMI: 52.0 (previous: 52.0).
Euro Stoxx 600 (FXXP1!)
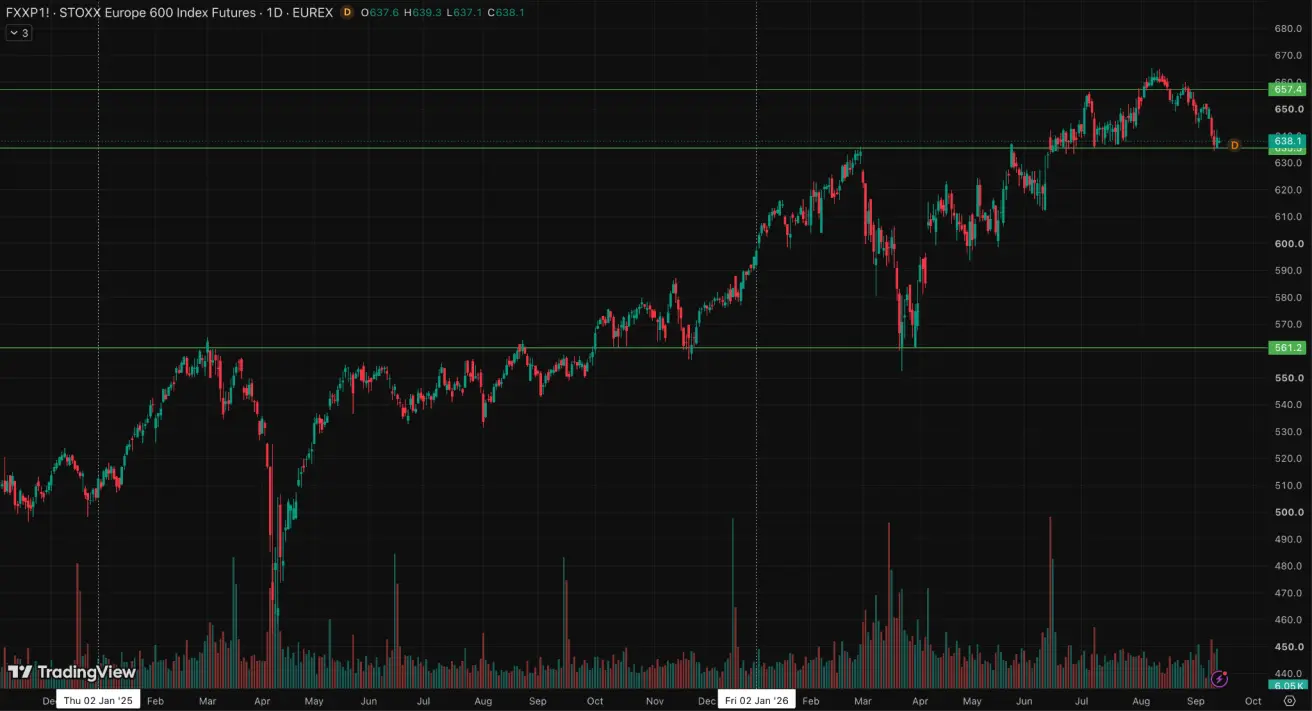
Weekly performance: -1,74% (week-end close: 639,4); year-to-date: +7,64%.
China
China's economy continues to stabilize, supported by strong exports, while domestic demand and investment gradually recover. Policymakers remain measured and targeted in their approach to economic stimulus.
- Interest rates remain unchanged;
- Monetary policy remains accommodative;
- China reaffirmed its commitment to fiscal support for economic growth under its 2026 plan, including measures to stimulate domestic demand, optimize tax incentives and subsidies, and modernize industrial capacity.
A strong signal of fiscal support from China: Beijing will allocate 300 billion yuan ($44 billion) from special government bond proceeds to recapitalize eight of the country's largest state financial institutions. The funds will boost the Core Tier 1 capital of banks, insurers, and export-credit agencies, improving their resilience to risk and expanding their capacity to finance the real economy. Combined with contributions from other state investors, the total capital increase will reach 360 billion yuan.
Interest Rates
- 1-Year Loan Prime Rate (medium-term lending): 3.00%;
- 5-Year Loan Prime Rate (benchmark for mortgage lending): 3.50%.
Inflation Indicators (August)
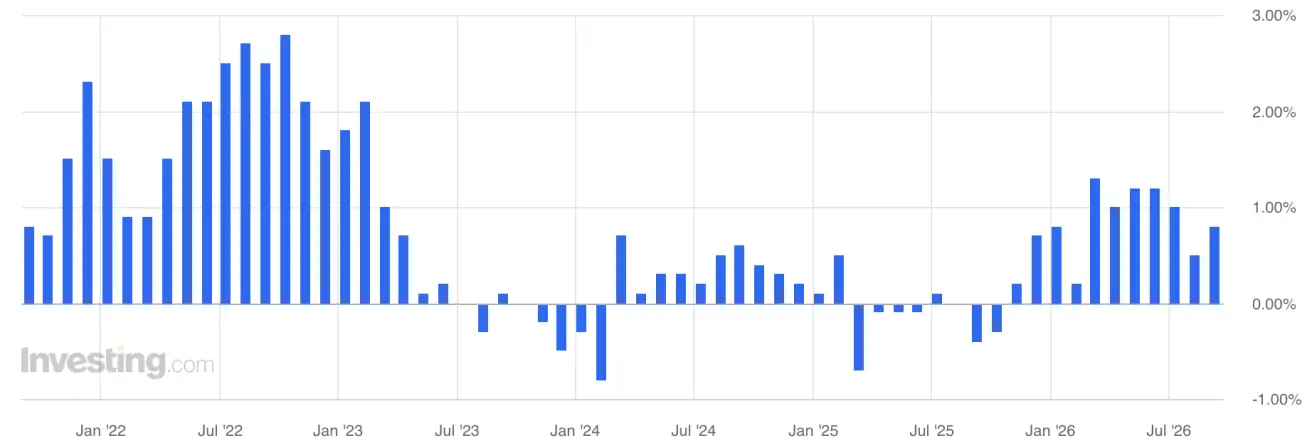
- Consumer Price Index (CPI): 0.4% MoM (previous: -0.1%); 0.8% YoY (previous: 0.5%):
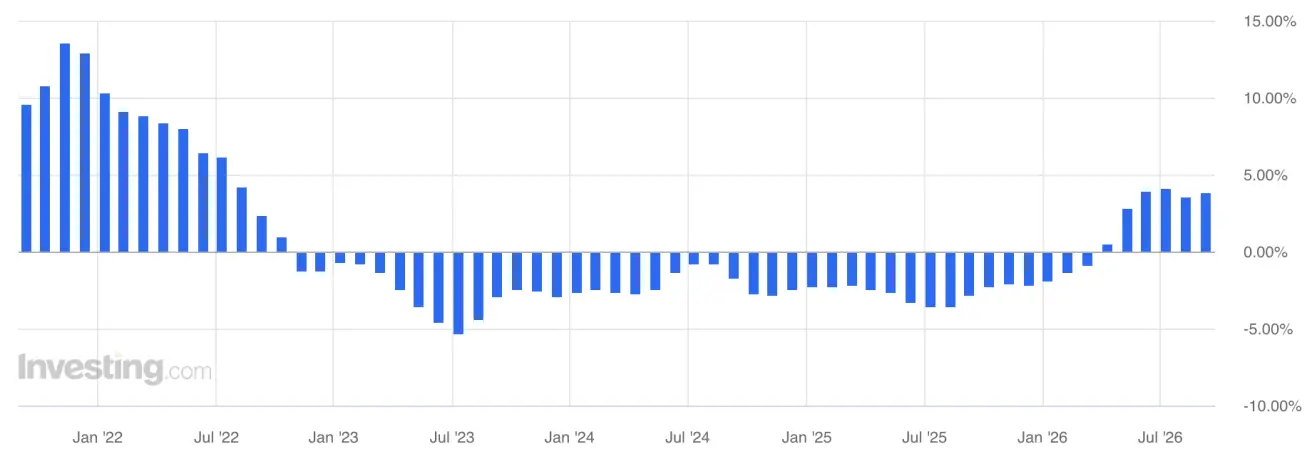
- Producer Price Index (PPI): 3.8% YoY (previous: 3.5%).
Trade Data
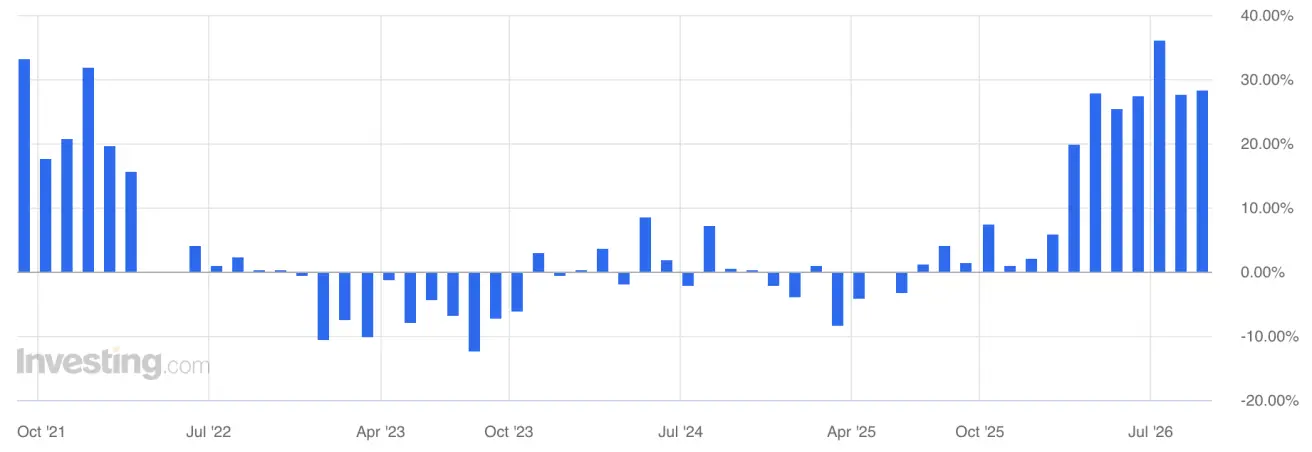
- Imports (August): 28.2% YoY (previous: 27.5%);
- Exports (August): 25.0% YoY (previous: 23.9%);
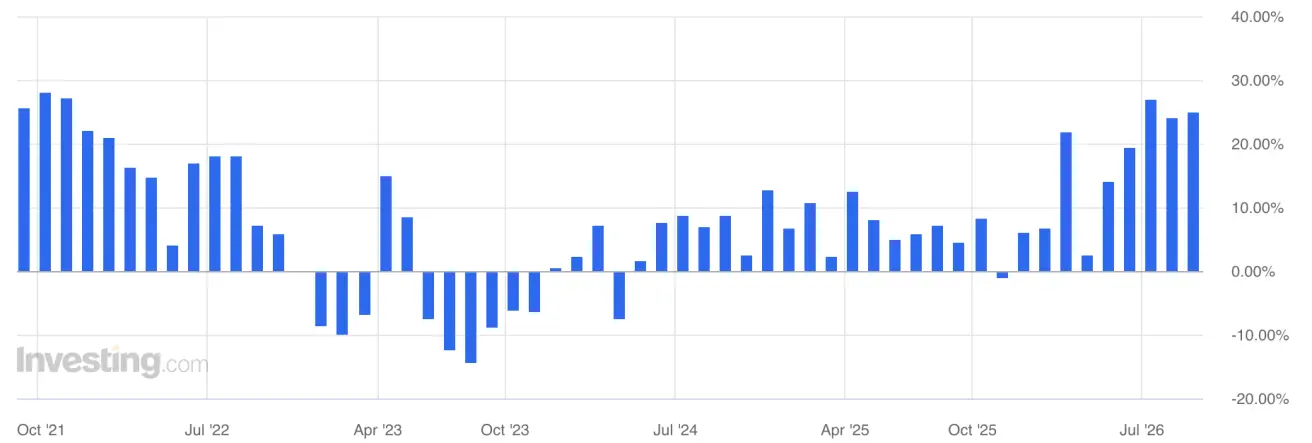
- Trade Balance (USD) (August, YoY): $119.9 billion (previous: $112.5 billion).
GDP (Q2 2026)
- QoQ: 0.9% (previous: 1.3%);
- YoY: 4.3% (previous: 5.0%).
This is below the target trajectory and reflects weaker domestic momentum.
Labor Market
- Unemployment Rate (July): 5.2% (previous: 5.0%).
Industrial Activity
- Industrial Production (July, YoY): 4.5% (previous: 5.3%).
Fixed Asset Investment
- June, YoY: -6.7% (previous: -5.7%).
Retail Sales
- July, YoY: 0.6% (previous: 0.9%).
Purchasing Managers' Indices (PMI) (August)
- Manufacturing PMI: 49.8 (previous: 49.2);
- Non-Manufacturing PMI: 49.0 (previous: 49.0);
- Composite PMI: 49.5 (previous: 49.3).
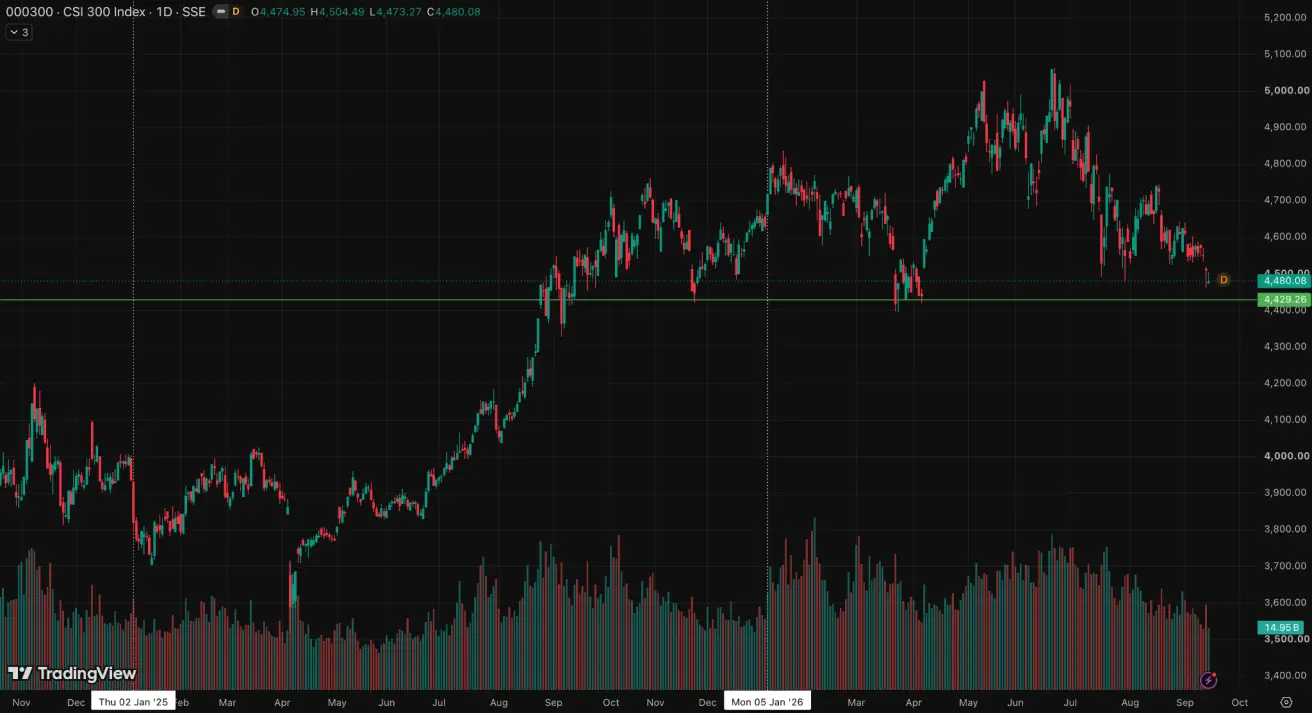
CSI 300 Index (000300.HK)
Weekly performance: -0,83% (week-end close: 4510,16); year-to-date: -3,25%.
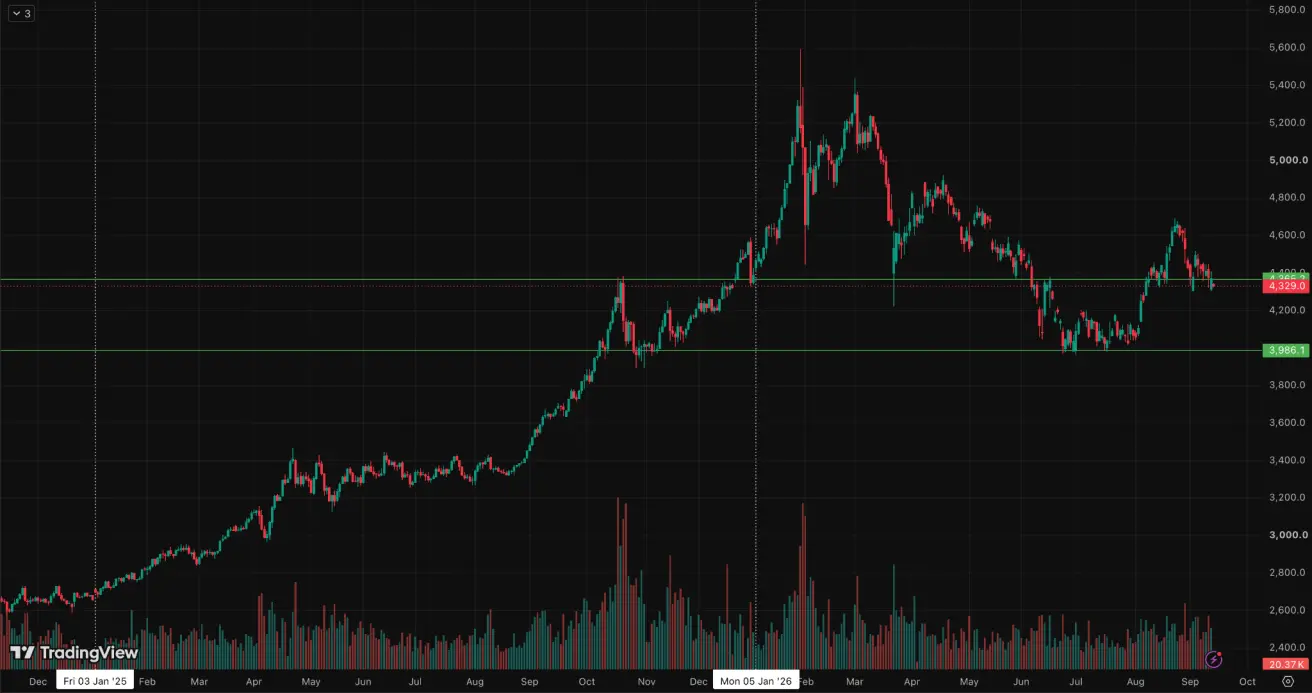
Gold Futures (GC)
Weekly performance: -1,63% (week close: $4373,6 per troy oz); year-to-date: +0,96%.
Oil Futures
Weekly performance: +9,37% (week close: $100,05 per barrel); year-to-date: +74,27%.
Oil prices continue to move higher amid rising tensions in the Strait of Hormuz.
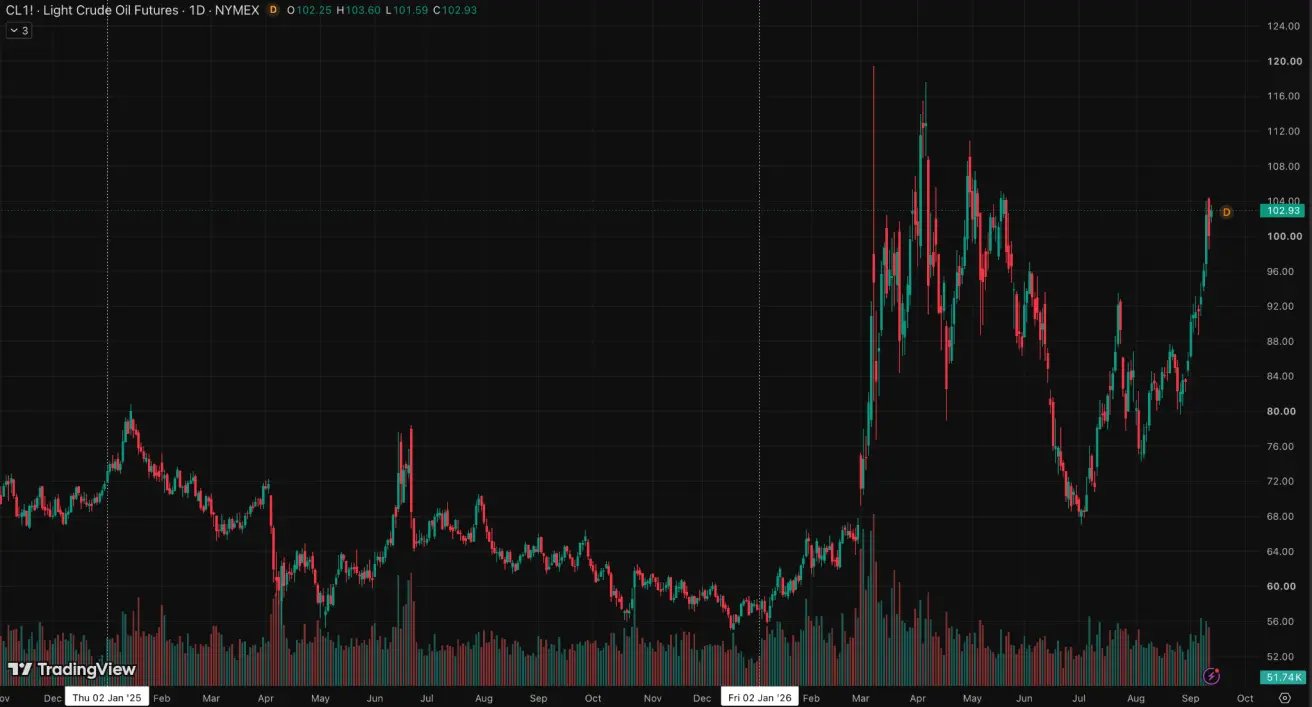
Over the past week, the geopolitical backdrop deteriorated markedly, above all in the Middle East. The U.S. carried out new strikes on Iranian facilities and destroyed five Iranian oil tankers; in response, Iran said it had attacked commercial vessels near the Strait of Hormuz and American facilities in the region.
At the same time, the Houthis stepped up pressure on Saudi Arabia and attacked the key East-West pipeline used to bypass Hormuz; talks between Gulf states and Iran on stabilizing shipping were postponed.
Takeaways from the EIA's September 9 STEO report:
The main problem for the market remains supply. The IEA estimates that global production fell by 1.6 million barrels per day in August, while more than 10 million b/d of capacity in the Persian Gulf remained offline. The EIA also expects Middle East export restrictions to persist through year-end, with a full recovery in flows stretching into Q2 2027.
Inventories are drawing down quickly, so the market remains physically tight. The IEA estimates that global inventories have fallen by 507 million barrels since February, with a further 95 million barrels drawn down in August alone. The shortage is especially acute in diesel and other distillates because of export restrictions from the Persian Gulf and Russia. The EIA also expects global inventories to keep declining through the end of 2026.
Oil could stay expensive until supply normalizes, but a decline is expected in 2027. The EIA raised its second-half Brent forecast to around $90/bbl, but as Middle East production and inventories recover, it expects an average price of around $74 in 2027. At the same time, the IEA already sees demand destruction: it estimates global oil demand will fall by 2.5 million b/d in 2026 due to high prices and product shortages.
According to estimates by Sinopec's research arm, China's oil demand will fall 3.9% in 2026 — a third consecutive year of decline. The drop is most pronounced in gasoline and diesel consumption amid high prices and the growing share of electric vehicles. The decline in demand from the world's largest oil importer partially offsets the impact of constrained Middle East supply and acts as a restraining factor on oil prices.
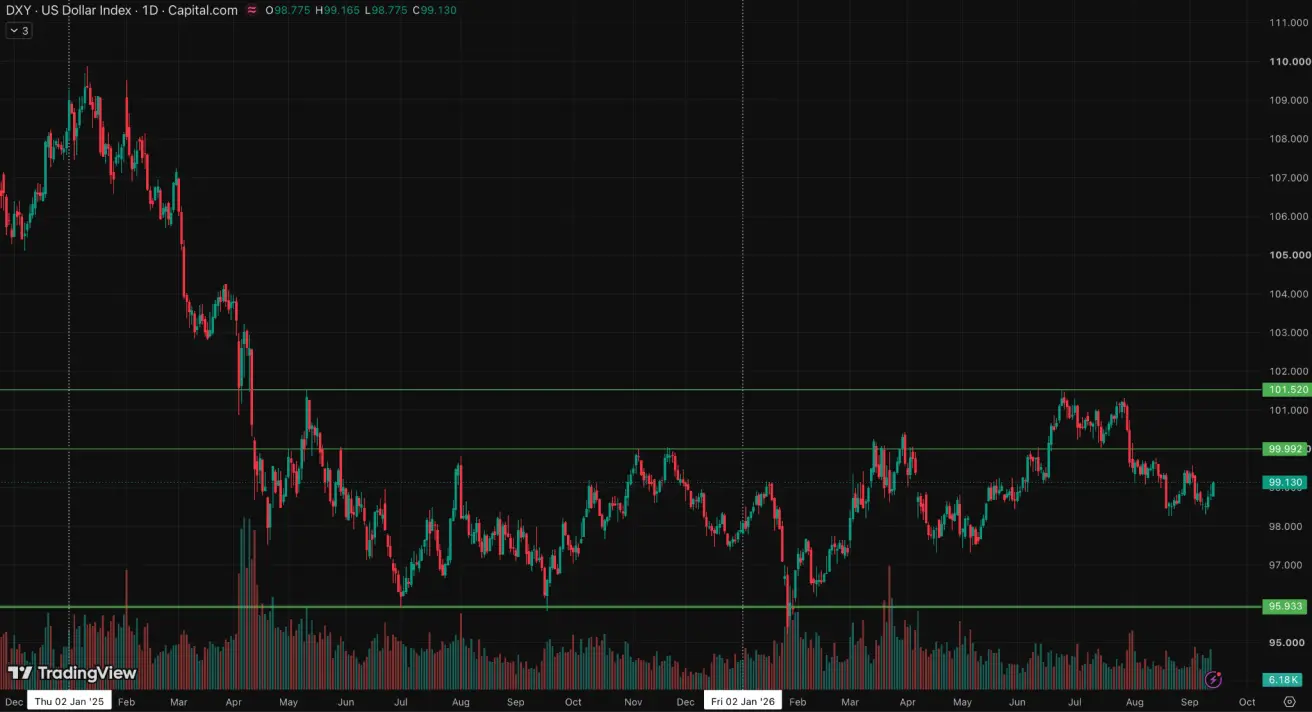
Dollar Index Futures (DX)
Weekly performance: -0,08% (week close: 98,805); year-to-date: +0,83%.
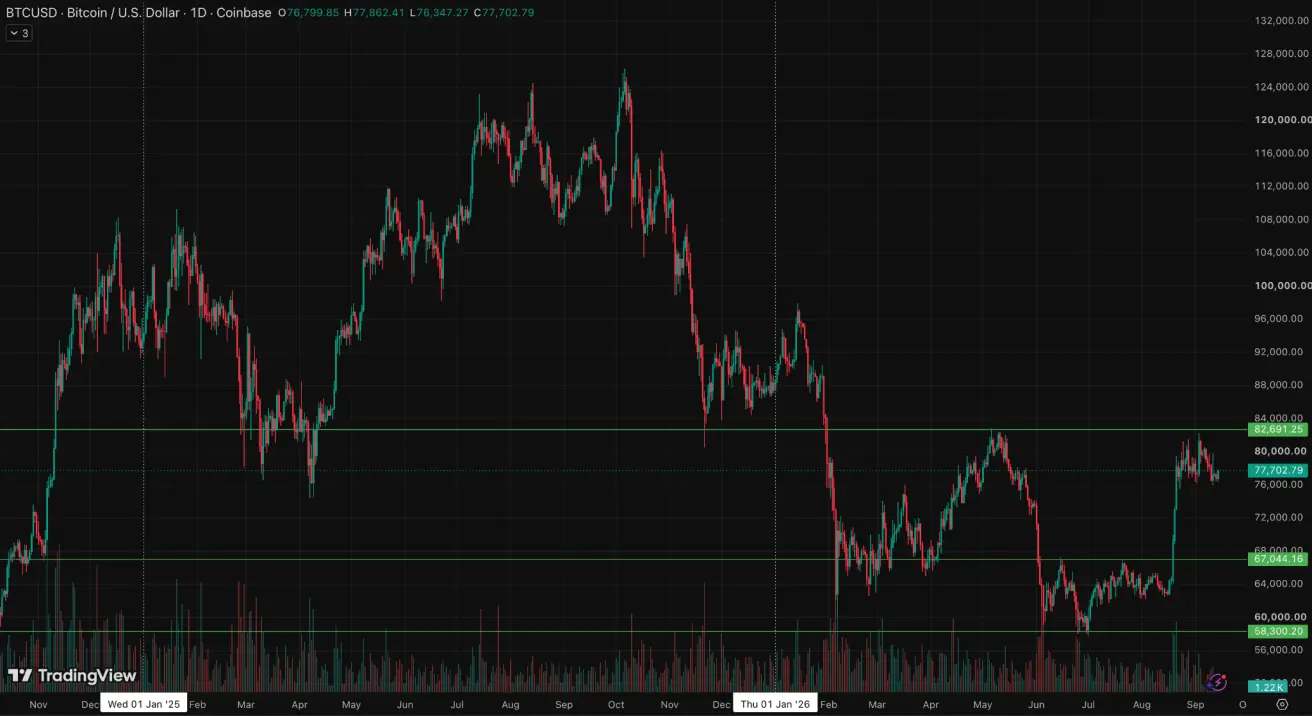
BTC Futures
Weekly performance: -4,41% (week close: $79799,85); year-to-date: -12,45%.
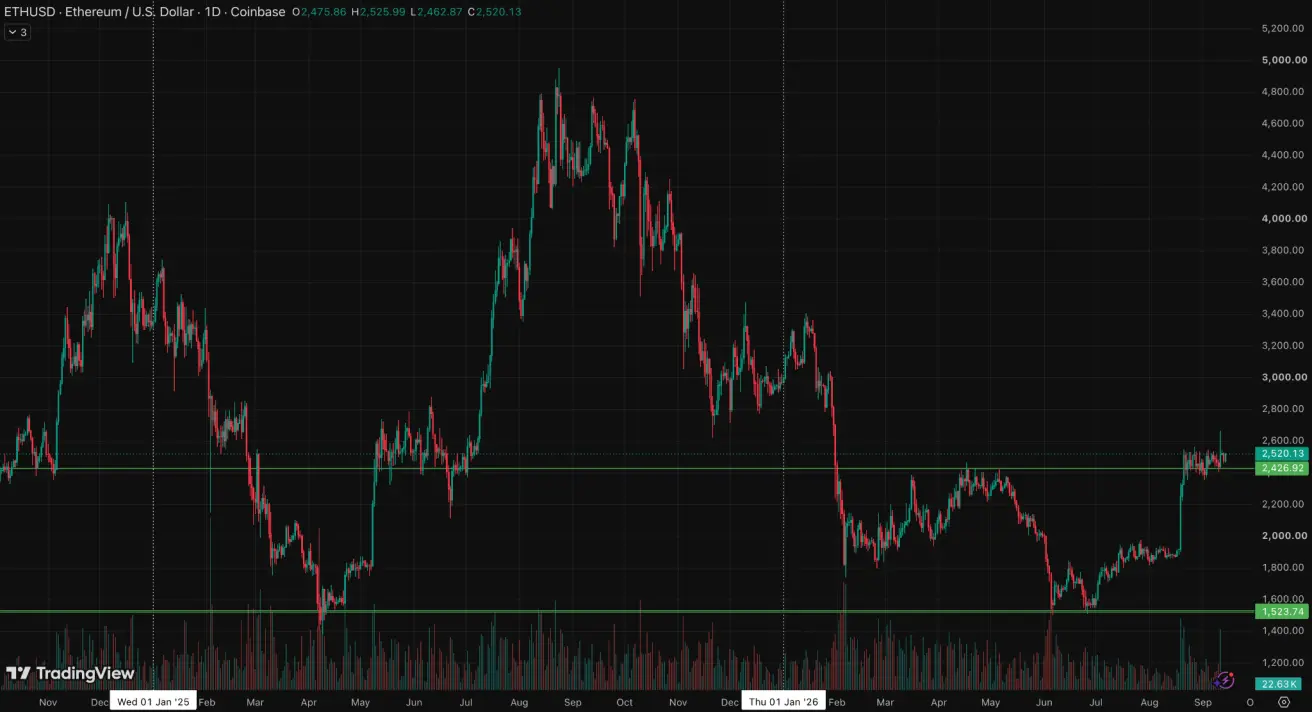
ETH Futures
Weekly performance: -1,53% (week close: $2475,86); year-to-date: -16,75%.
September 15 — a Senate vote on the CLARITY Act is expected.
Senate Republicans introduced an updated, 630-page version of the CLARITY Act. The document adds more than 114 provisions requested by Democrats, including new requirements for crypto protocols that are not fully decentralized: they would have to register with the CFTC, and the CFTC, together with the Treasury, would gain authority to draft separate rules for them. Overall, the bill is meant to formalize the division of authority between the SEC and the CFTC and create a permanent federal regulatory framework for the digital asset market.
However, the bill's passage is still not guaranteed. The key unresolved issue is ethics restrictions on government officials and their crypto holdings; the new draft contains no substantial changes on that front. At this point, the updated text has not secured the necessary Democratic support, and the procedural vote on September 15 will require 60 votes to pass.
Overall, the bill has moved noticeably closer to a compromise version, but the September 15 vote remains a key risk. Its successful passage would be a positive regulatory signal for the crypto market, as it would substantially raise the odds of a durable legislative framework in the U.S.
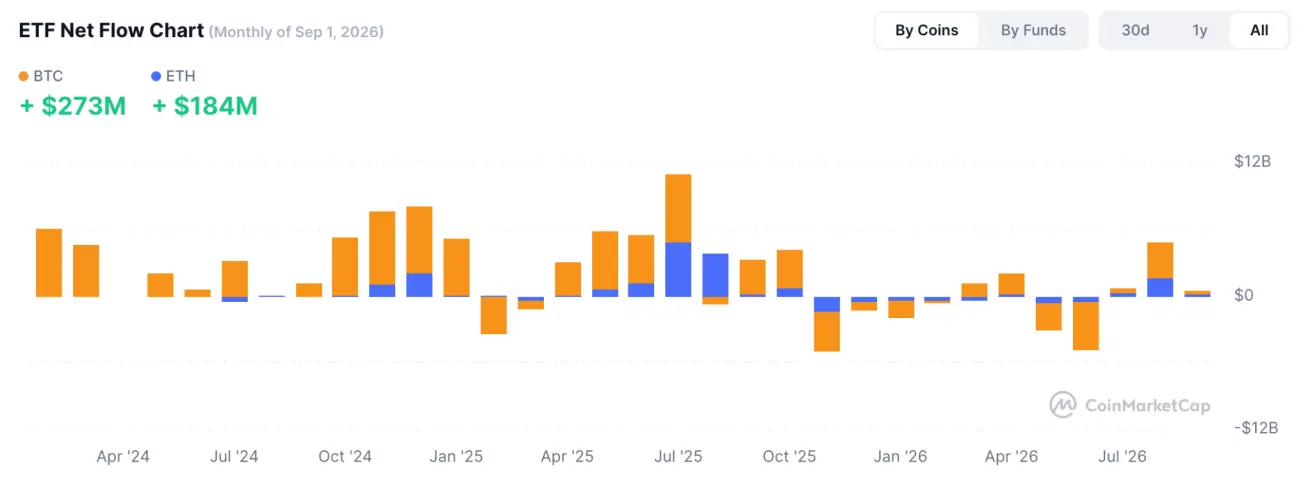
Total Cryptocurrency Market Capitalization
Total crypto market capitalization: $2,66 trillion (vs $2,7 trillion a week earlier) (coinmarketcap.com).
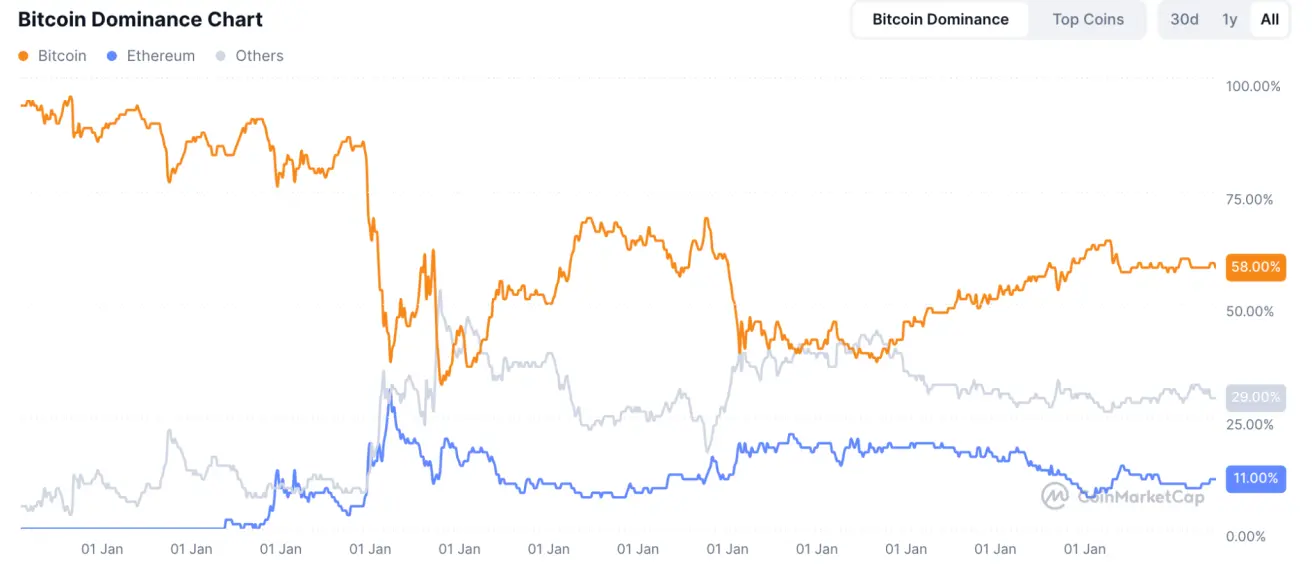
Crypto asset market shares:
- Bitcoin 58,9% (prev. 59,1%)
- Ethereum 11,6% (prev. 11,3%)
- Others 29,5% (prev. 29,7%)