Русский
 Қазақша
 Eesti
EestiOctober 5 – October 11, 2026: Weekly economic update
Key market updates

Economic Overview
October 5 – October 11, 2026
Key Takeaways:
- The policy rate was raised to a range of 3.75 - 4.00%; rhetoric is hawkish;
- Monetary policy remains moderately restrictive;
- U.S. macroeconomic data continue to support a soft-landing scenario: inflation risks are increasing, the labor market is cooling without signs of recession, and current conditions do not yet warrant a rate cut.
- The Fed slightly improved its GDP and employment forecasts and raised its near-term inflation forecasts.
Inflation: Consumer Price Index (August)
- Core CPI (MoM): 0.3% (previous: 0.2%).
- Core CPI (YoY): 2.4% (previous: 2.5%).
- CPI (MoM): 0.4% (previous: 0.1%).
- CPI (YoY): 3.4% (previous: 3.4%).
Producer Price Index (August)
- PPI (MoM): 0.4% (previous: 0.0%).
- Core PPI (MoM): 0.3% (previous: 0.2%).
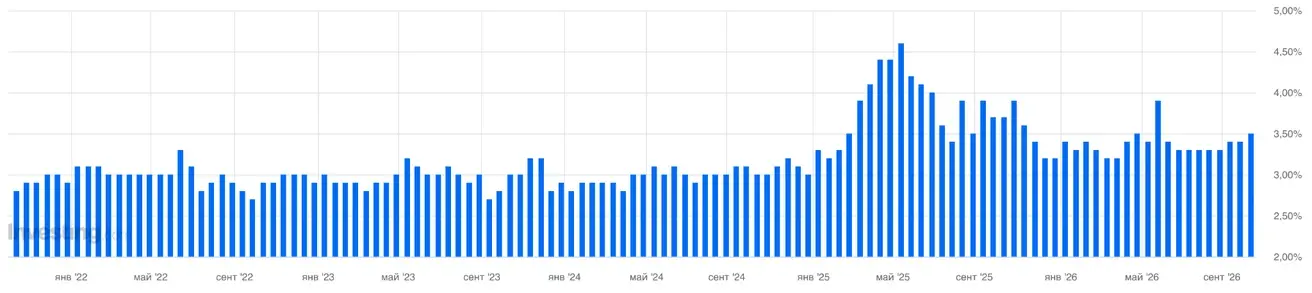
Inflation Expectations (Michigan) (September)
- 12-month Inflation Expectations: 4.7% (previous: 4.6%).
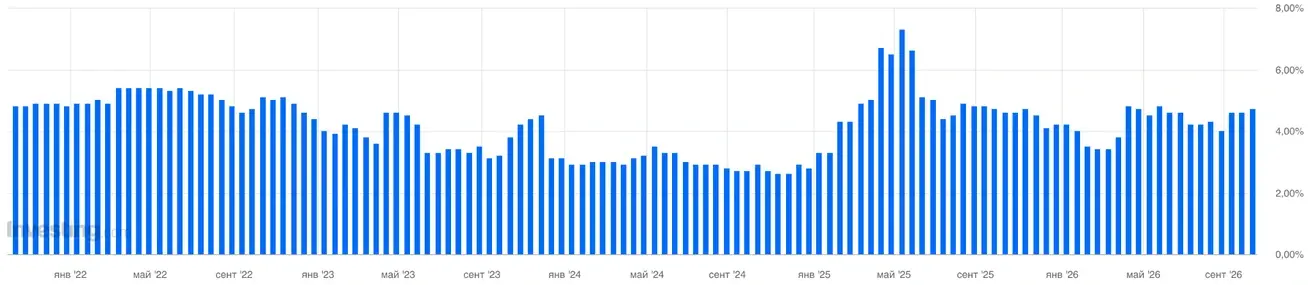
- 5-Year Inflation Expectations: 3.5% (previous: 3.4%).
The Fed’s inflation benchmark:
Core PCE Price Index (August): MoM: 0.2% (previous: 0.1%); YoY: 3.0% (previous: 3.7%):
Headline PCE Price Index (August): MoM: 0.3% (previous: 0.1%); YoY: 3.4% (previous: 3.4%):
GDP (U.S. Bureau of Economic Analysis, BEA) — Q2 2026 annualized, third estimate: 2.2% (second estimate: +1.5%; Q1 2026 was revised from +2.1% to 2.5%).
GDPNow (the Atlanta Fed’s real-time estimate of official GDP growth ahead of release (Q3 2026)): 3.6% (previous: 3.7%).
Trade balance (July): -$88 bn (-$71.2 bn).
Labor Market (BLS) (September)
- Unemployment rate: 4.2% (previous: 4.1%):
- Total number of people receiving unemployment benefits in the U.S.: 1,716K (previous: 1,719K);
- Initial jobless claims: 197K (previous: 197K);
- Change in nonfarm payrolls: 29K (previous: 133K, revised):
- Change in private nonfarm payrolls: 46K (previous: -89K, revised):
- Average hourly earnings (YoY): 3.0% (previous: 3.1%):
- JOLTS job openings: 7.271M (prev: 6.866M).
Business Activity Index (PMI) (August)
(Above 50 indicates expansion; below 50 indicates contraction)
- Services PMI: 58.8 (previous: 58.7).
- Manufacturing PMI: 55.9 (previous: 53.9).
- Composite PMI: 58.4 (previous: 58.4).
Monetary Policy
Fed officials’ rhetoric:
Fed Governor Christopher Waller, speaking at the Economic Forum in Istanbul on October 8, 2026, said that if the economy evolves roughly in line with the outlook, the Fed will need additional rate hikes to bring inflation back to 2% more quickly. However, he stressed that hikes don't have to come at every consecutive meeting — the Fed has some flexibility on timing. In other words, the rhetoric remains hawkish, but without calling for immediate, continuous tightening.
Fed Governor Michelle Bowman (October 6): Her speech focused primarily on modernizing bank regulation and supervision rather than on monetary policy. Bowman advocated a more targeted, proportionate approach to regulation, especially for regional and smaller banks: less burden where risks are low, and more attention to significant vulnerabilities. She offered virtually no new signal on rates or inflation.
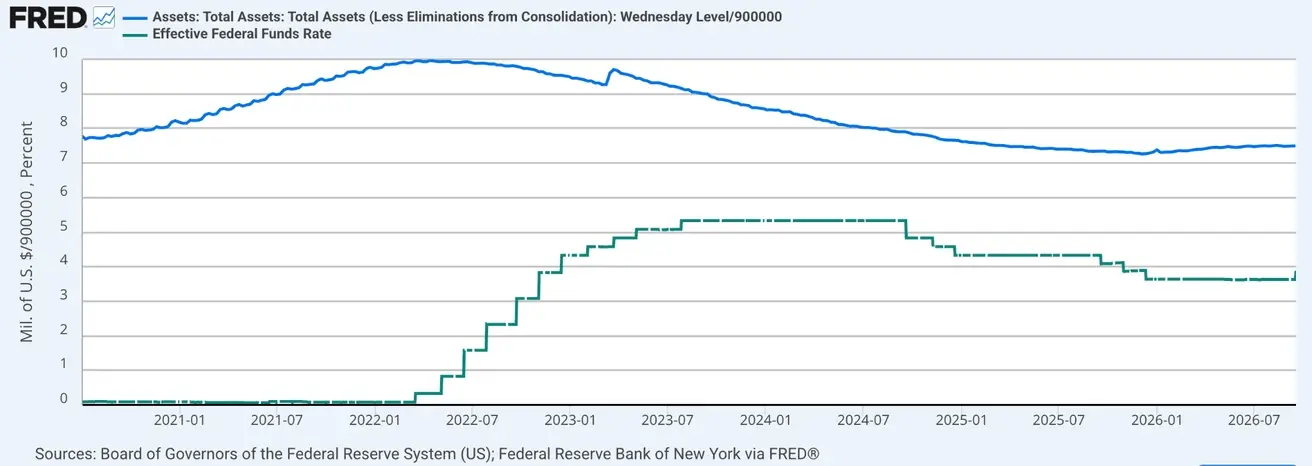
Federal funds rate (EFFR): 3.75%–4.00%
Federal Reserve balance sheet: $6.747 trillion, +3.24% since the end of QT ($6.535 trillion):
Market Forecast for Rate (FedWatch)
For the next FOMC meeting (October 28), the estimated probability of a 0.25% rate hike remains moderately low at 19.37% (a week earlier: 18.27%; two weeks earlier: 68.1%).
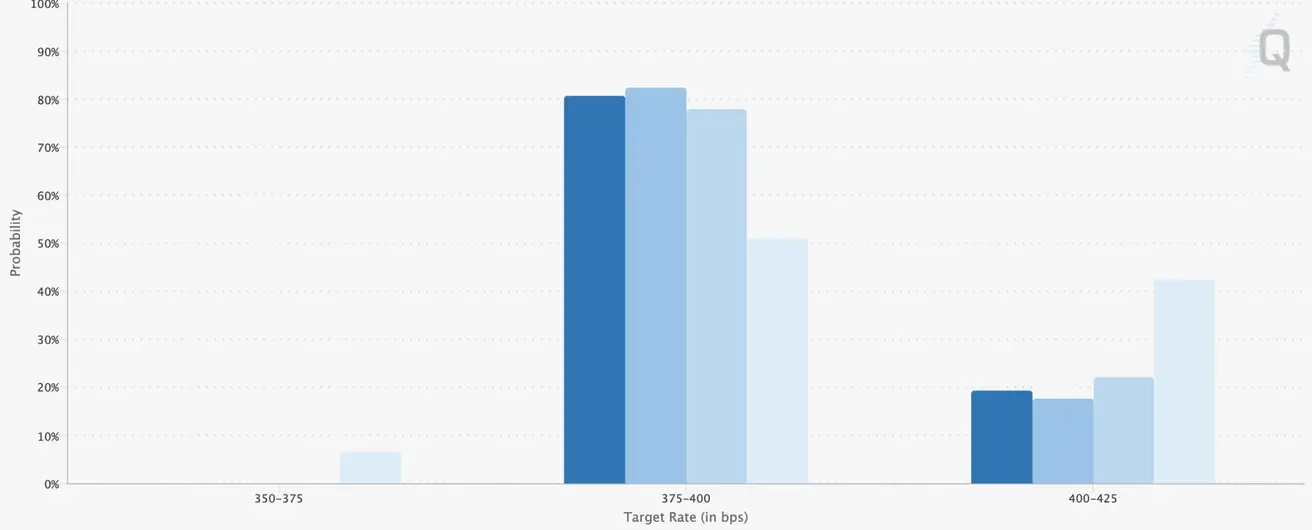
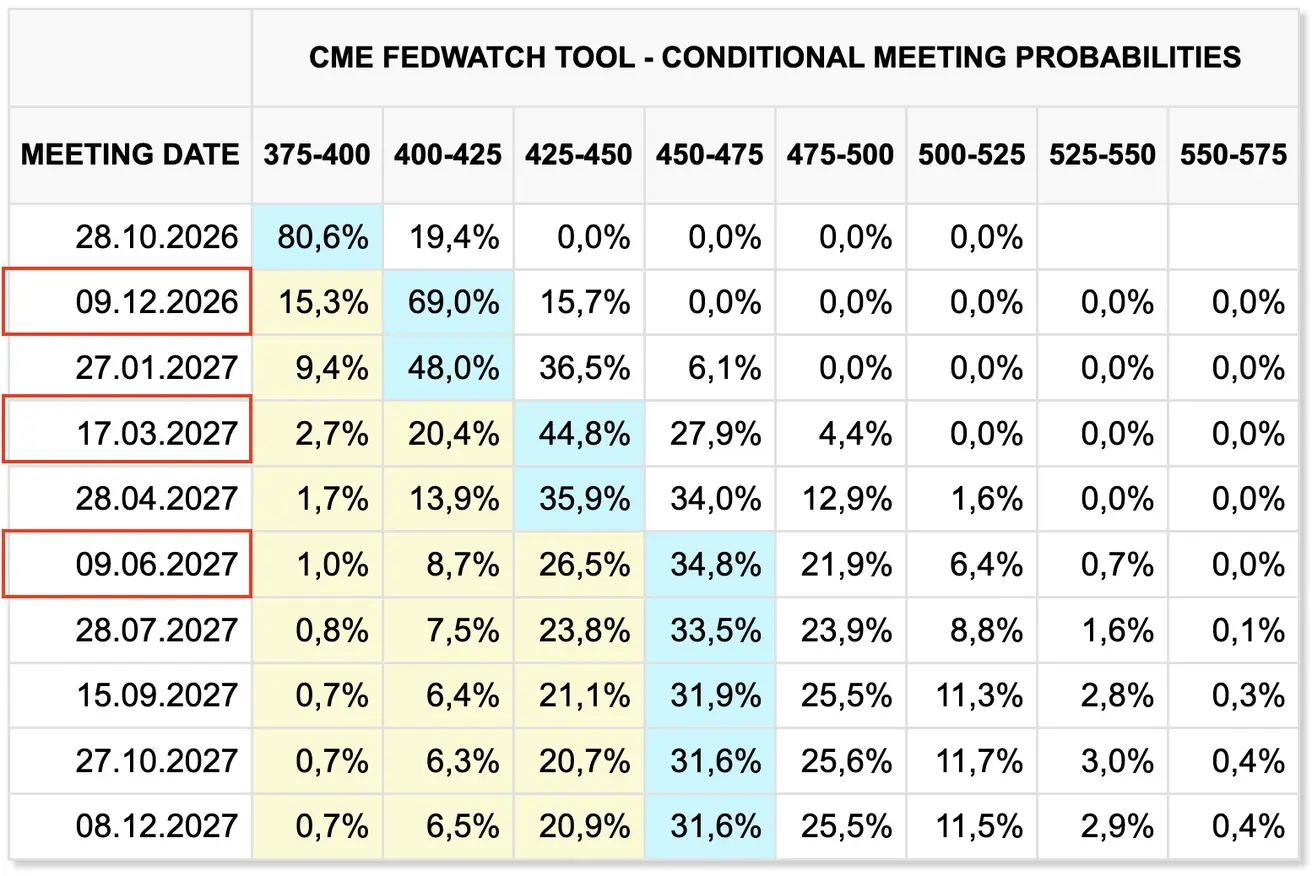
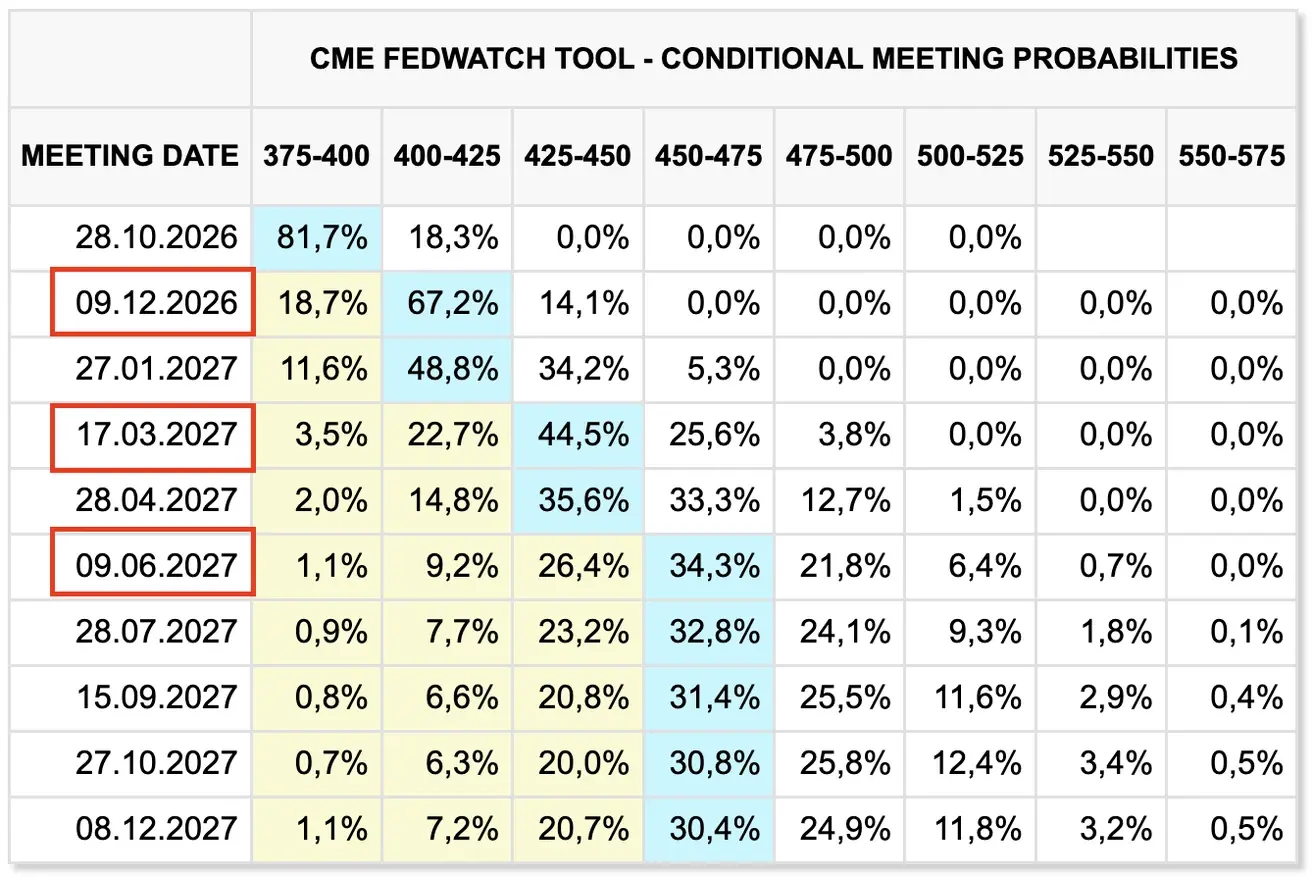
Over the next 12 months, unchanged: the market expects three rate hikes of 25 basis points each to a range of 4.50–4.75%, with the final hike expected in June 2027:
Today:
A week earlier:
Bond Market
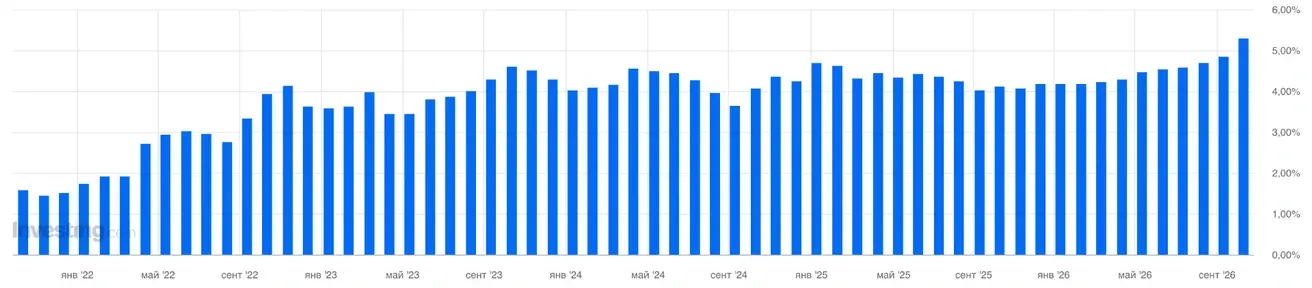
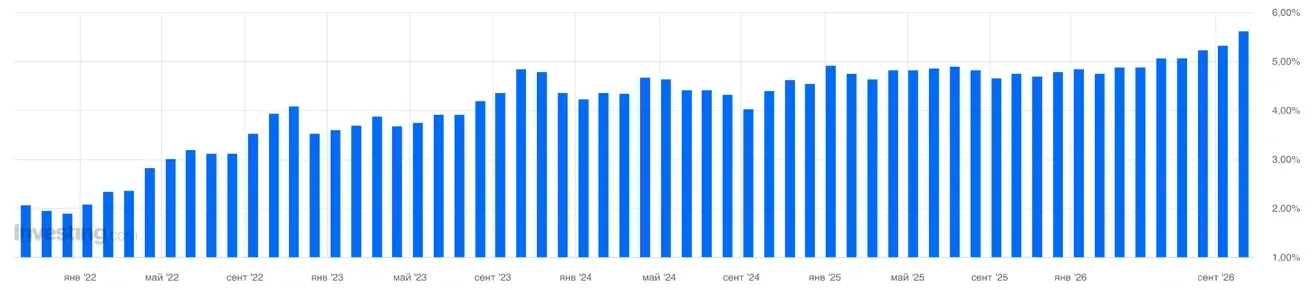
Primary auctions cleared at multi-year high yields: the 3-year auction priced at 4.932%, the 10-year at 5.300%, and the 30-year at 5.618%.
The 10-year auction was very strong: the bid-to-cover ratio was 2.77, indirect bidders took 80.3%, and primary dealers took only about 2.5%. (*indirect bidders are large institutional investors that submit bids at Treasury auctions through primary dealers rather than directly).
The 30-year bond auction cleared at the highest yield in 26 years, yet demand was also fairly strong: bid-to-cover came in at 2.54 versus an average of about 2.41, and foreign/indirect bidders also took an above-average share of the issue.
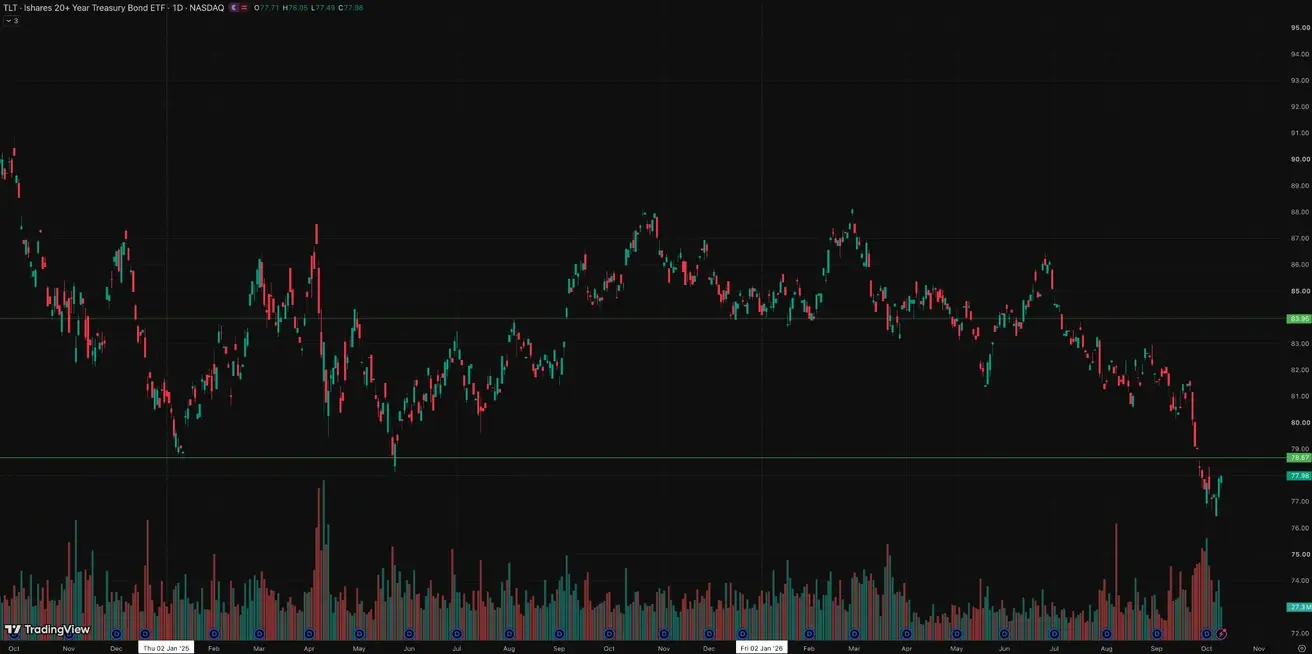
High yields combined with strong primary-market demand also drew buyers into the secondary market, pushing bond prices higher (and yields lower) in the second half of the week. This may indicate that local demand for Treasuries is building after the deep sell-off.
3-year Treasury note auction: 4.932% (previous: 4.474%):
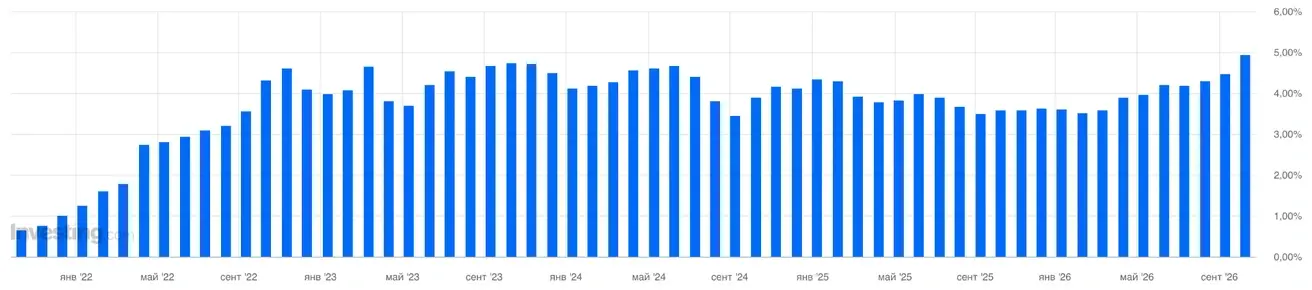
10-year Treasury note auction: 5.300% (previous: 4.834%):
30-year Treasury bond auction: 5.618% (previous: 5.308%):
U.S. Treasury Bonds 20+ Years (TLT ETF): +1.88% rebound from the local low; weekly performance +0,65% (week close: $77,98); year-to-date: -10.53%
Yields and Spreads
- Market Yield on U.S. Treasury Securities at 10-Year Constant Maturity: 5.23% (previous: 5.27%);
- 2-Year U.S. Treasury Yield: 4.79% (previous: 4.81%);
- ICE BofA BBB US Corporate Index Effective Yield: 6.14% (previous: 6.19%).
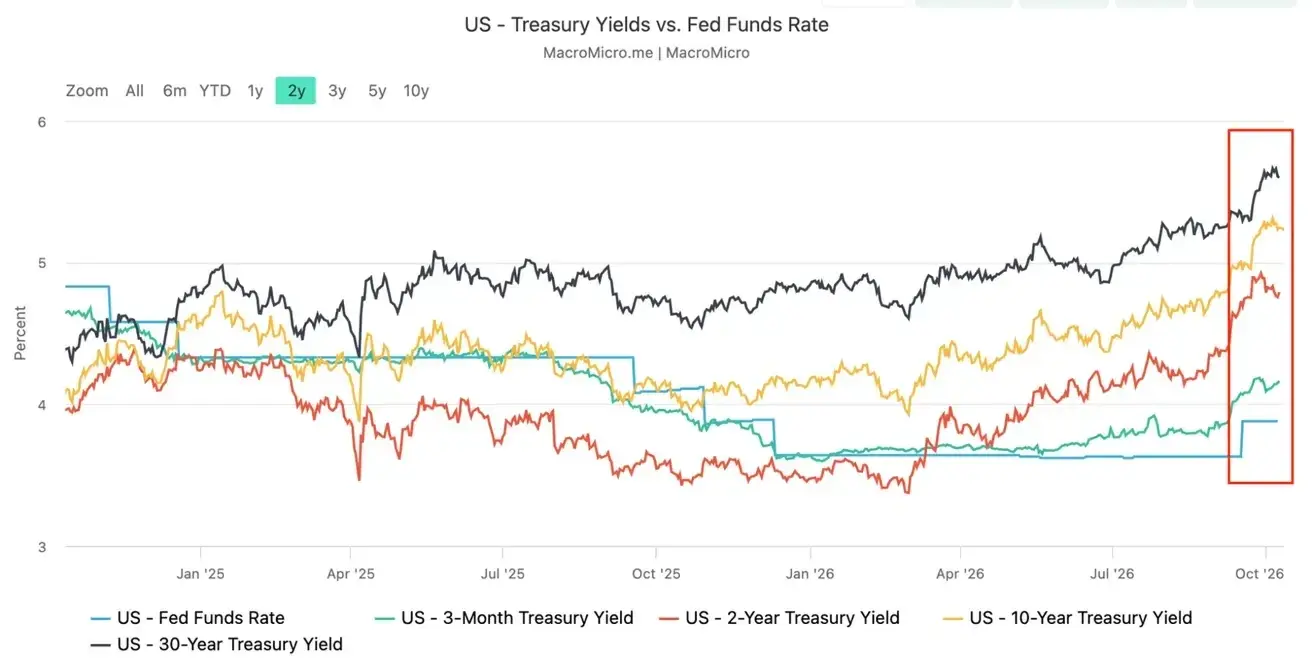
- The yield spread between 10-year and 2-year U.S. Treasury securities stands at 44 basis points (previous: 46 bps);
- The yield spread between 10-year and 3-month U.S. Treasury securities stands at 107 basis points (previous: 116 bps).
U.S. Treasury Yield Curve
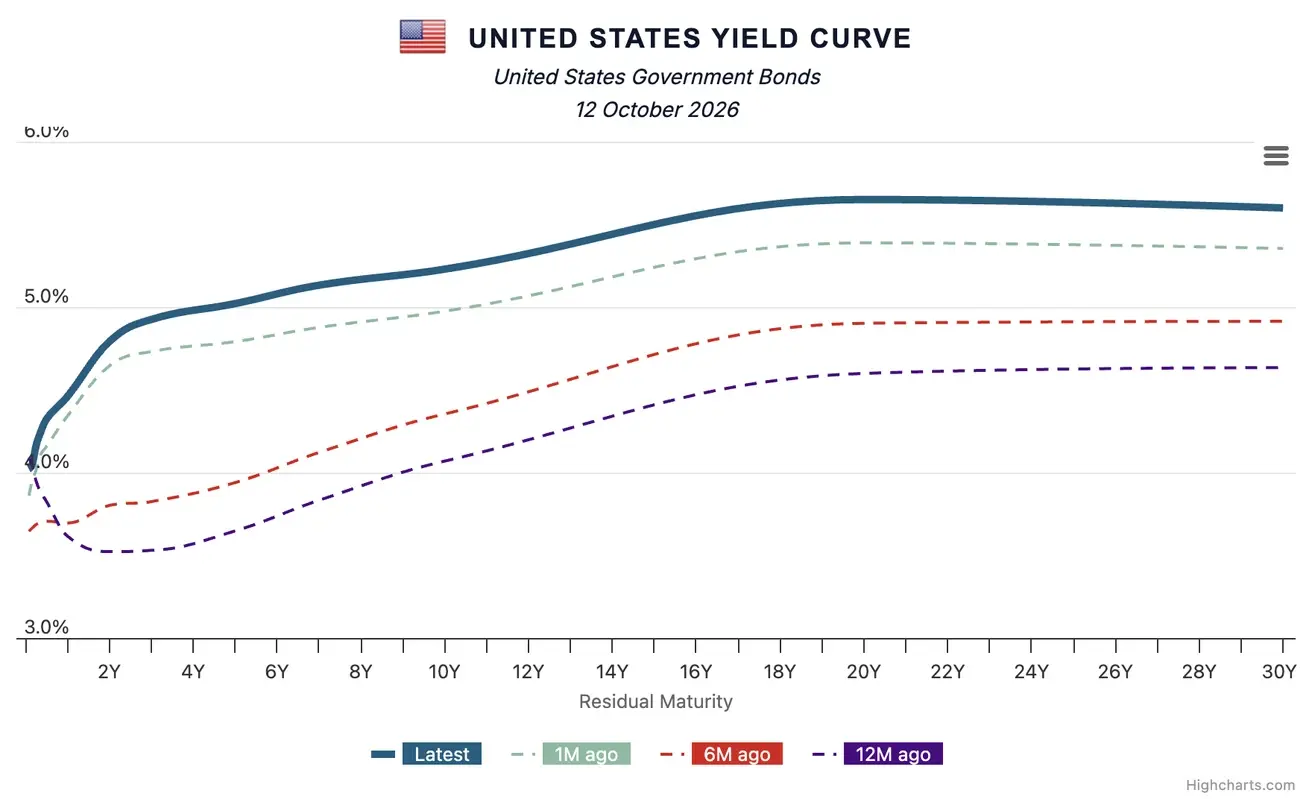
The U.S. yield curve continues to steepen: the short end through 2 years remains elevated versus a month earlier as expectations of Fed rate hikes persist, while the long end, despite a recent decline, remains high — the market still demands an elevated long-term premium for inflation and fiscal risks.
The cost of a 5-year U.S. Credit Default Swap (CDS) — a market-based measure of sovereign default insurance — is 37.36 basis points, compared with 33.32 basis points a week earlier.
SP500
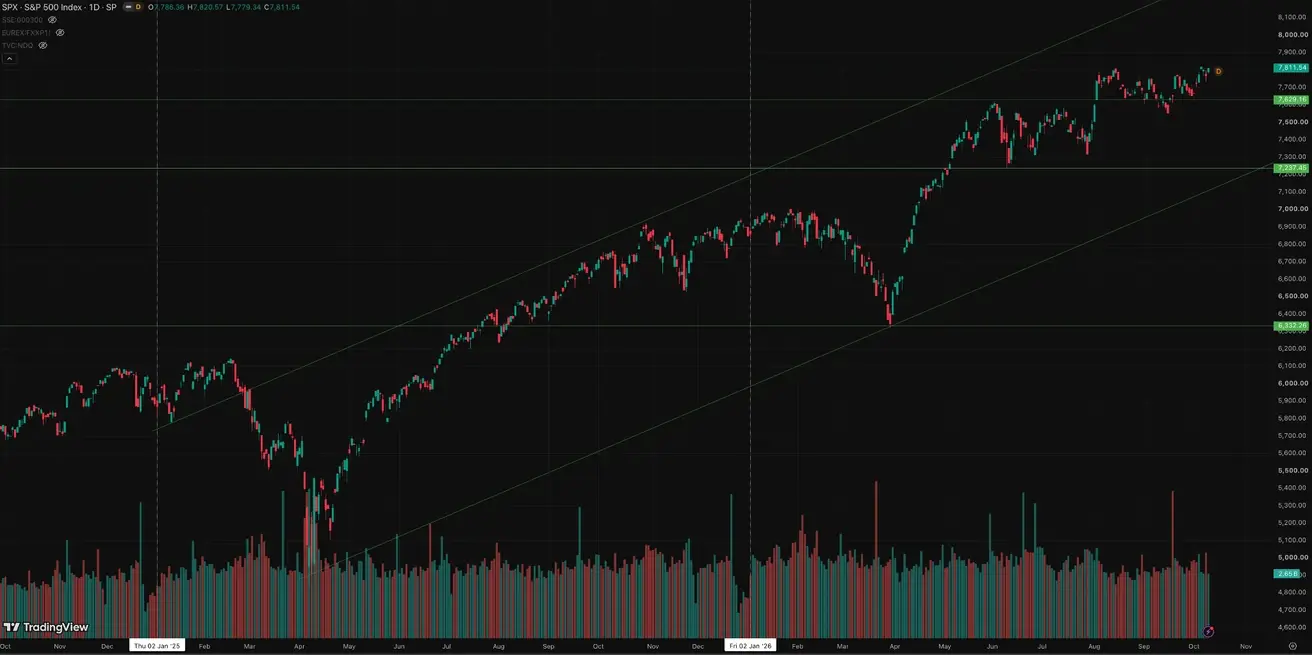
Trading near its all-time high.
Weekly performance: +1,15% (week-end close: 7811,54); year-to-date: +14,11%.
NASDAQ100
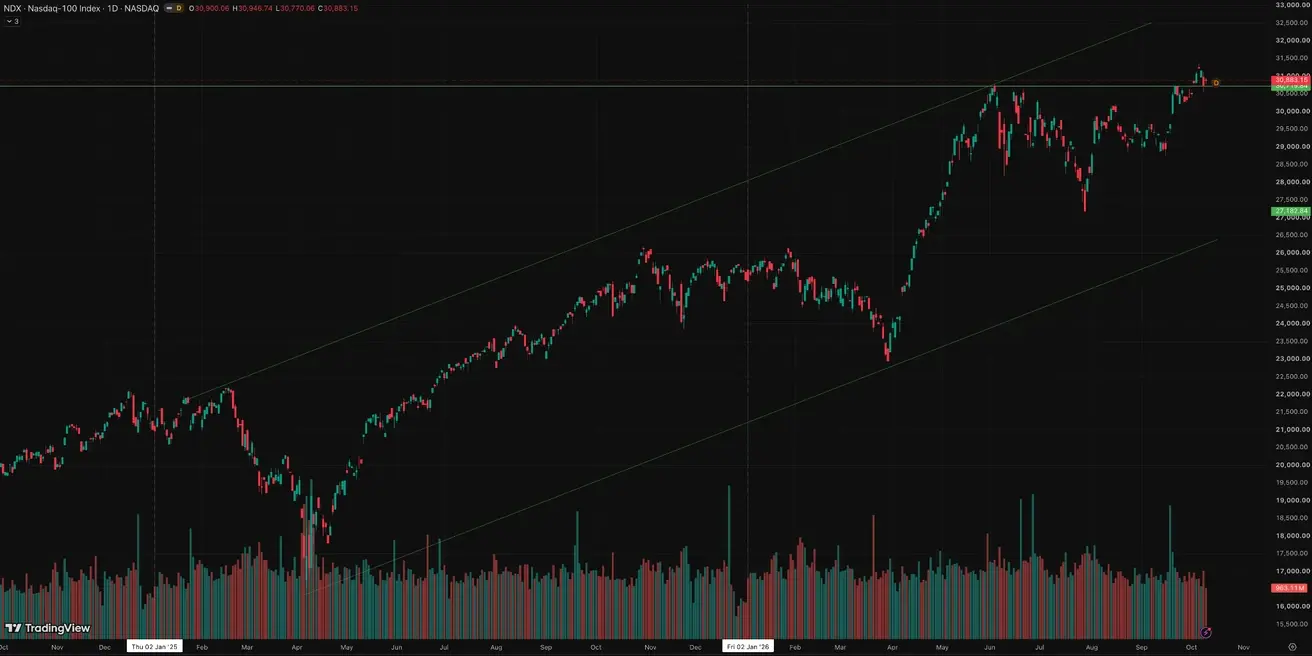
Hit an all-time intraday high of 31,361.37 on October 6; weekly performance: +0,24% (week-end close: 30883,15); year-to-date: +22,31%.
VIX
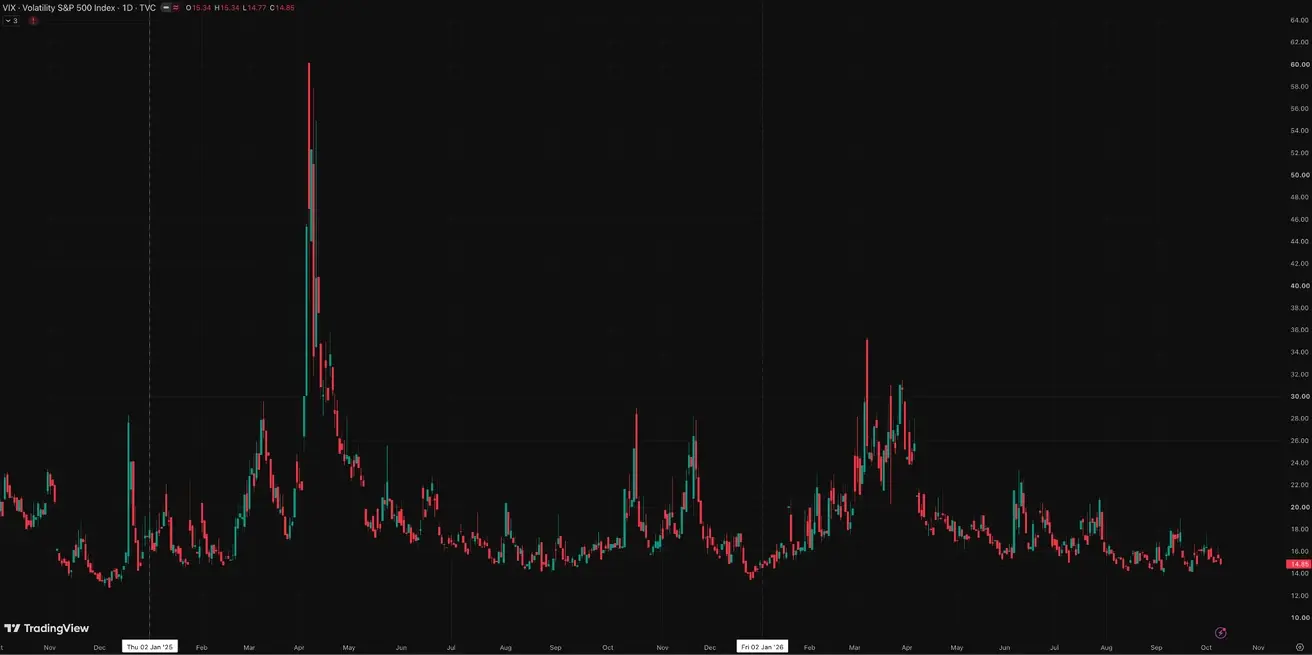
VIX (volatility index): week-end close at 14,85 points.
Eurozone
- The ECB raised interest rates, while maintaining a hawkish stance as inflationary risks continue to increase;
- Against the backdrop of the conflict in the Middle East, the ECB revised its GDP forecasts downward and raised its inflation projections for the coming years.
ECB officials’ rhetoric:
ECB Chief Economist and Governing Council member Philip Lane (October 5): the rhetoric was moderately cautious. His main point: the energy shock raises short-term inflation risks, but it also weighs on growth, real incomes, and demand. The ECB therefore should not respond mechanically to rising energy prices with further tightening; what matters is how much of the shock passes through to core inflation and how persistent domestic price pressures prove to be. In effect, Lane argued against overly aggressive rate hikes driven solely by oil and gas.
ECB Executive Board member Isabel Schnabel (October 9, 2026), traditionally regarded as one of the most influential voices for financial markets, remains hawkish. She stresses that recurring shocks could entrench inflation through household and business expectations, so the ECB must pay close attention to second-round effects and prevent expectations from de-anchoring. No new text was published for her October 9 appearance — it drew on the same materials as her September 30 speech. The substance of her position is unchanged: inflation risks are again tilted to the upside, and the central bank must be ready to act firmly enough if price pressures become more persistent.
ECB Executive Board member and Vice-Chair of the Supervisory Board Frank Elderson (October 6, 2026): his speech was about banking supervision rather than rates. The main message: the ECB wants to simplify supervision and make it more risk-based, while being stricter about requiring banks to promptly remedy truly material shortcomings. Fewer formal requirements for minor breaches, more attention to key risks and deadlines for fixing problems, and faster use of enforcement measures where needed. Elderson’s formula, in essence: simpler where possible, stricter where necessary.
Eurogroup meeting (October 8): no direct monetary policy decisions were made. The focus was on currency markets and preparations for the IMF/World Bank meetings, as well as advancing the Savings and Investments Union / EU capital markets agenda. Separately, the Eurogroup launched the procedure to select Schnabel’s successor on the ECB Executive Board. The main signal: continued commitment to deepening European capital markets and strengthening the EU’s ability to channel domestic savings into investment.
Publication of the account of the ECB monetary policy meeting (October 8, 2026 — covering the September 9–10 meeting, at which rates were raised by 25 bps): the key message of the account is that the inflation picture has deteriorated, primarily due to energy and rising inflation expectations, so the Governing Council deemed a rate hike necessary to return inflation to 2% over the medium term. At the same time, caution remains within the ECB: further decisions will depend on incoming data, the persistence of core inflation, and how tightening is transmitted through the economy.
The next ECB monetary policy meeting is on October 29.
Macroeconomic Data
Interest Rates
- Deposit Facility Rate: 2.5% (previous: 2.25%);
- Marginal Lending Facility Rate: 2.9% (previous: 2.65%) — the rate at which banks can obtain overnight funding from the central bank;
- Main Refinancing Rate (Policy Rate): 2.65% (previous: 2.40%).
Inflation: Consumer Price Index (CPI) (September, preliminary data)
- Core CPI (YoY): 2.5% (previous: 2.4%);
- Headline CPI: 0.4% (MoM) (previous: 0.4%);
- CPI: 3.8% (YoY) (previous: 3.2%).
GDP (Q2 2026)
- QoQ: 0.6% (previous: -0.2%);
- YoY (final): 0.5% (preliminary estimate: 0.4%); (previous: 0.3%).
Unemployment Rate (August)
- 6.4% (previous: 6.4%).
Industrial Production (August)
- MoM: -0.1% (previous: 0.0%);
- YoY: 1.67% (previous: 1.37%).
Purchasing Managers’ Index (PMI) (September)
- Services PMI: 51.3 (previous: 51.3, revised);
- Manufacturing PMI: 52.9 (previous: 52.7);
- S&P Global Composite PMI: 52.0 (previous: 51.3).
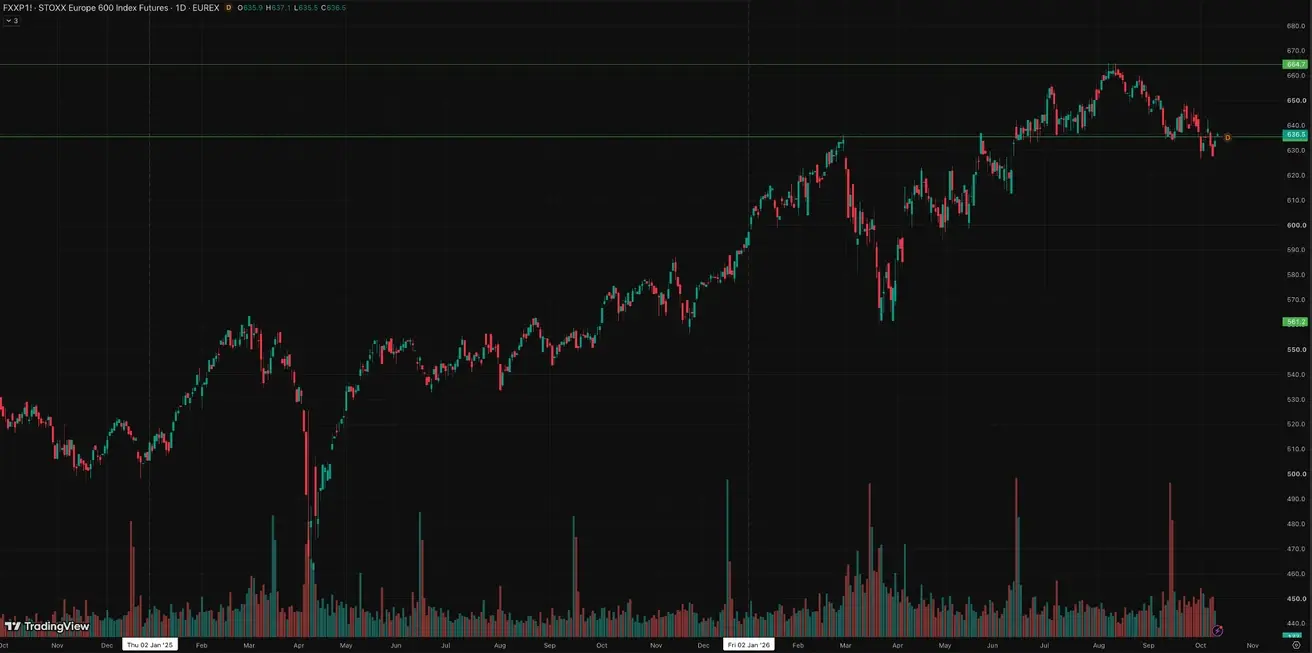
Euro Stoxx 600 (FXXP1!)
Weekly performance: +0,14% (week-end close: 633,90); year-to-date: +6,72%.
China
China’s economy continues to stabilize, supported by strong exports, while domestic demand and investment gradually recover. Policymakers remain measured and targeted in their approach to economic stimulus.
- Interest rates remain unchanged;
- Monetary policy remains accommodative;
- China reaffirmed its commitment to fiscal support for economic growth under its 2026 plan, including measures to stimulate domestic demand, optimize tax incentives and subsidies, and modernize industrial capacity.
Macroeconomic Data
Interest Rates
- 1-Year Loan Prime Rate (medium-term lending): 3.00%;
- 5-Year Loan Prime Rate (benchmark for mortgage lending): 3.50%.
Inflation Indicators (August)
- Consumer Price Index (CPI): 0.4% MoM (previous: -0.1%); 0.8% YoY (previous: 0.5%):
- Producer Price Index (PPI): 3.8% YoY (previous: 3.5%).
Trade Data
- Imports (August): 28.2% YoY (previous: 27.5%);
- Exports (August): 25.0% YoY (previous: 23.9%);
- Trade Balance (USD) (August, YoY): $119.9 billion (previous: $112.5 billion).
GDP (Q2 2026)
- QoQ: 0.9% (previous: 1.3%);
- YoY: 4.3% (previous: 5.0%).
This is below the target trajectory and reflects weaker domestic momentum.
Labor Market
- Unemployment Rate (August): 5.3% (previous: 5.2%).
Industrial Activity
- Industrial Production (August, YoY): 5.2% (previous: 4.5%).
Fixed Asset Investment
- August, YoY: -7.2% (previous: -6.7%).
Retail Sales
- July, YoY: 0.6% (previous: 0.9%).
Purchasing Managers’ Indices (PMI) (August)
- Manufacturing PMI: 50.1 (previous: 49.8);
- Non-Manufacturing PMI: 50.2 (previous: 49.0);
- Composite PMI: 50.7 (previous: 49.5).
CSI 300 Index (000300.HK)
Weekly performance: -0,93% (week-end close: 4317,25); year-to-date: -7,39%.
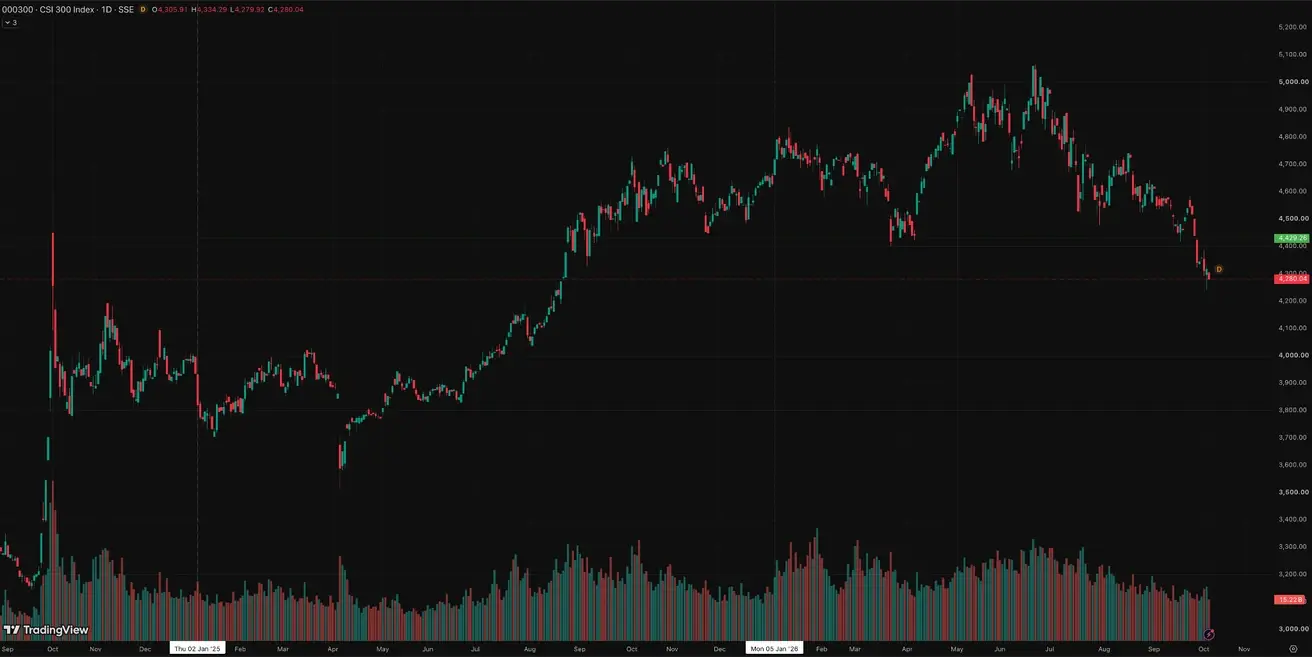
Last week, China continued its “Golden Week” celebrations (the PRC National Day). The CSI 300 is down roughly 15% from its June peak and ended the holiday-shortened week 0.93% lower.
The drivers remain in place: weak domestic demand — the market still sees no convincing recovery in consumption. Yonhap Infomax noted that consumer spending during the National Day holiday was weaker than expected, again fueling doubts about the strength of domestic demand. Monetary stimulus remains insufficient.
Gold Futures (GC)
Weekly performance: +0,37% (week close: $4239,8 per troy oz); year-to-date: -2,13%
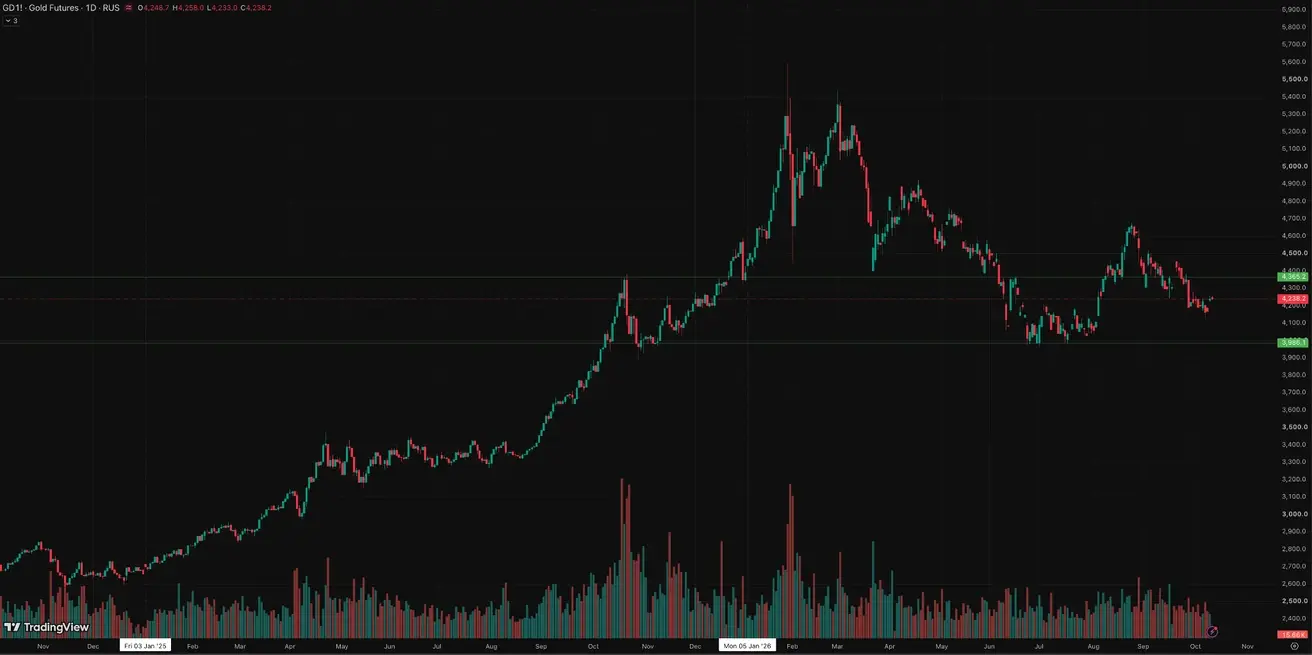
Despite elevated global inflation expectations, gold remains under medium-term pressure amid a stronger dollar and high long-term Treasury yields.
Moreover, long-term yields are rising today not only because of inflation risks, but also because real rates are higher and the term premium is rising. For now, these factors are outweighing inflation-driven safe-haven demand for gold.
The reason: gold pays no coupon, while 10–30-year Treasuries yielding 5%+ offer high risk-free cash flows. As a result, the opportunity cost of holding gold rises, and some capital may rotate into bonds.
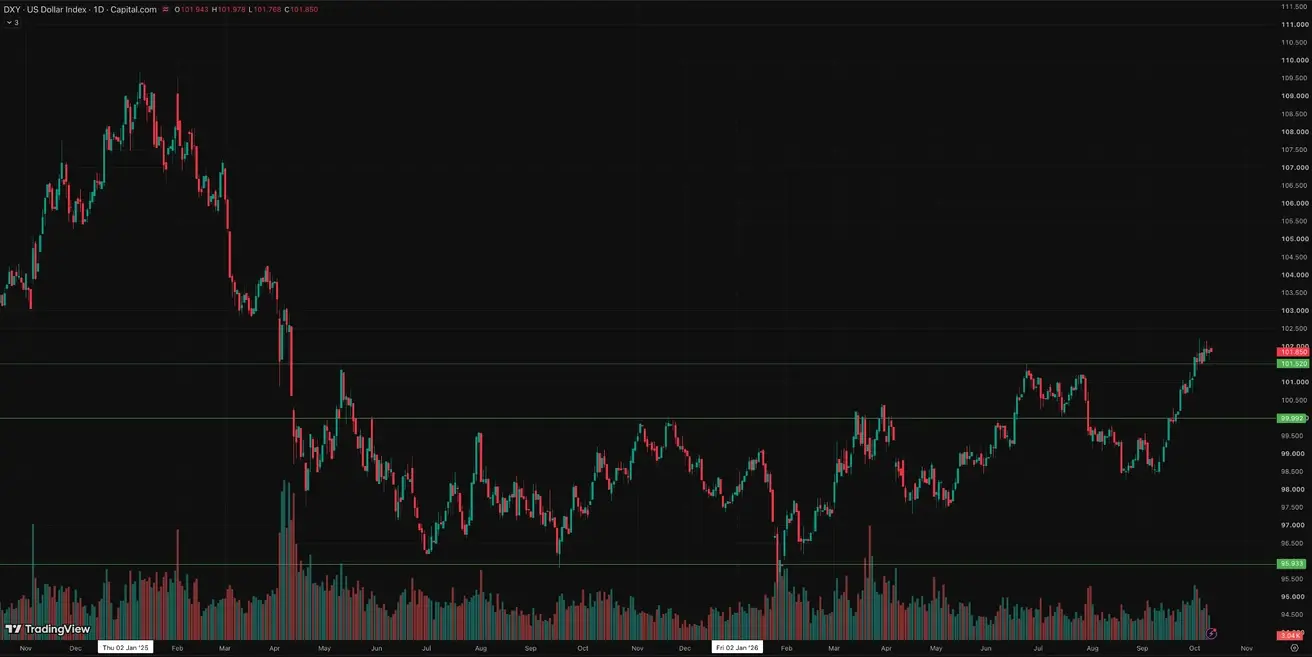
Dollar Index Futures (DX)
Weekly performance: +0,33% (week close: 101,903); year-to-date: +3,99%.
Oil Futures
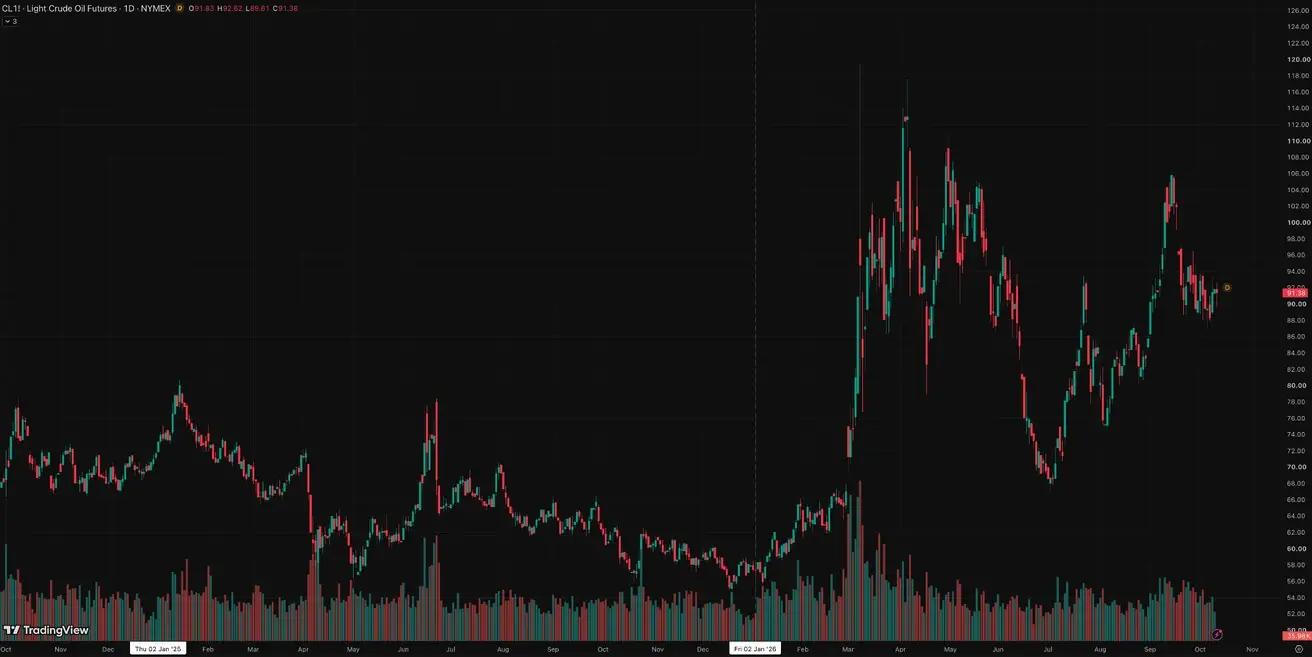
Weekly performance: +0,81% (week close: $91,85 per barrel); year-to-date: +59,99%
EIA (U.S. Energy Information Administration) Short-Term Energy Outlook:
- Oil: the EIA significantly raised its Brent forecast to an average of $96/bbl in 2026 and $84 in 2027, up from $91 and $74 previously. For Q4 2026, the EIA expects around $105/bbl. The main reasons are supply disruptions in the Middle East, declining global inventories, and a very tight diesel market;
- However, the EIA still expects prices to decline in 2027, as Middle East supply should gradually recover and production outside the region should grow;
- The U.S. continues to ramp up output: crude oil production is forecast at around 13.9 million b/d in 2026 and 14.3 million b/d in 2027;
- Petroleum products: forecasts for gasoline and diesel were raised; the diesel market is especially tight because of low inventories and limited global supply. The average retail diesel price is expected at $5.19/gallon in 2026, and gasoline at $3.91;
- Natural gas: the U.S. domestic market looks considerably calmer — inventories at the start of the heating season are expected to be about 2% above the five-year average, providing a buffer for the winter. Henry Hub is forecast to average around $3.48/MMBtu in 2026 and $3.16 in 2027;
- LNG: U.S. LNG exports continue to grow — to 17.6 Bcf/d in 2026 and 18.6 Bcf/d in 2027;
- Electricity: U.S. wholesale prices remain elevated — the EIA expects an average of around $52/MWh in 2026, 11% higher than in 2025, with a slight decline to $49 in 2027. Demand is supported by data centers and industry.
Note: the EIA’s October outlook reflects the announced exchange of 40 million barrels from the SPR, but does not yet reflect the subsequent G7 decision on an additional release of oil and petroleum products, as the calculations were finalized on October 1.
Crypto Market
BTC Futures
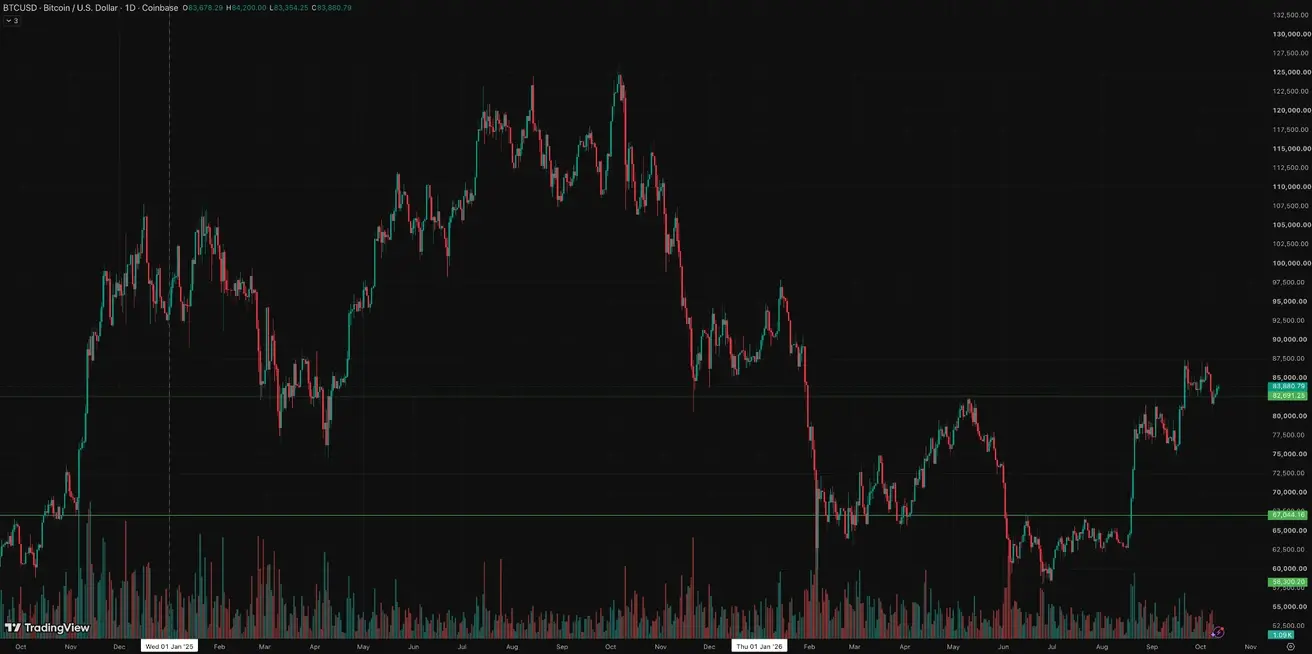
Weekly performance: -3,27% (week close: $83,678.29); year-to-date: -4,61%.
ETH Futures
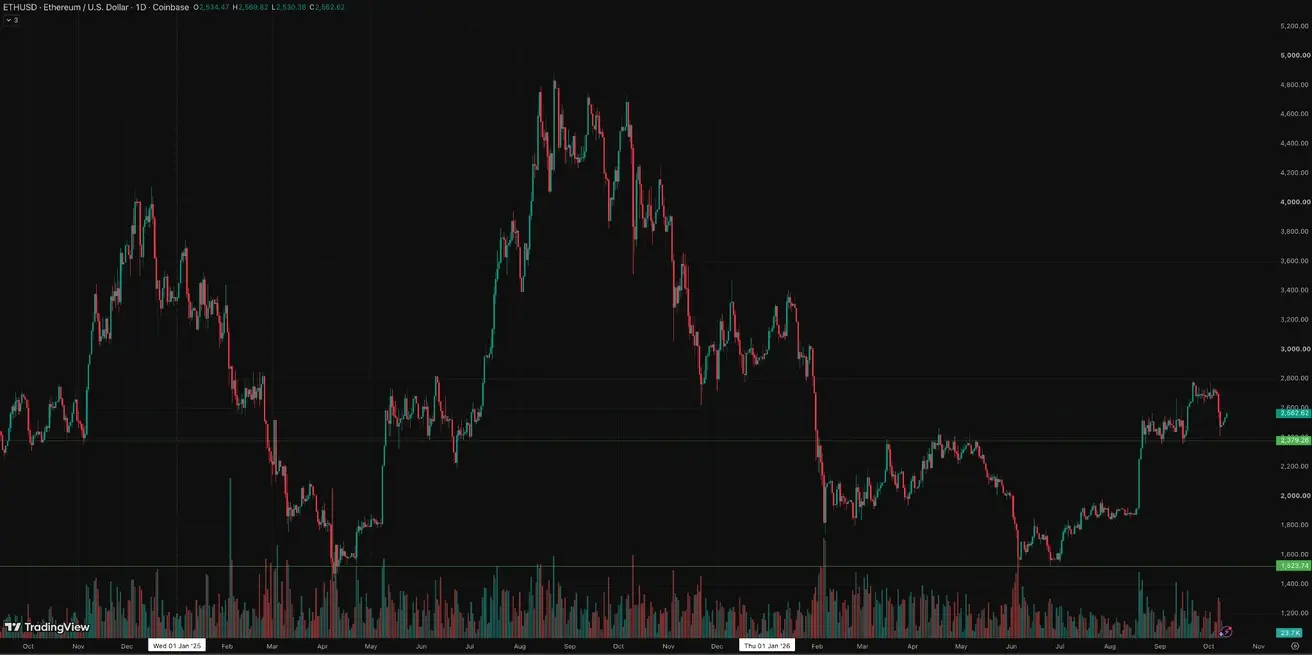
Weekly performance: -7,06% (week close: $2534,22); year-to-date: -14,78%.
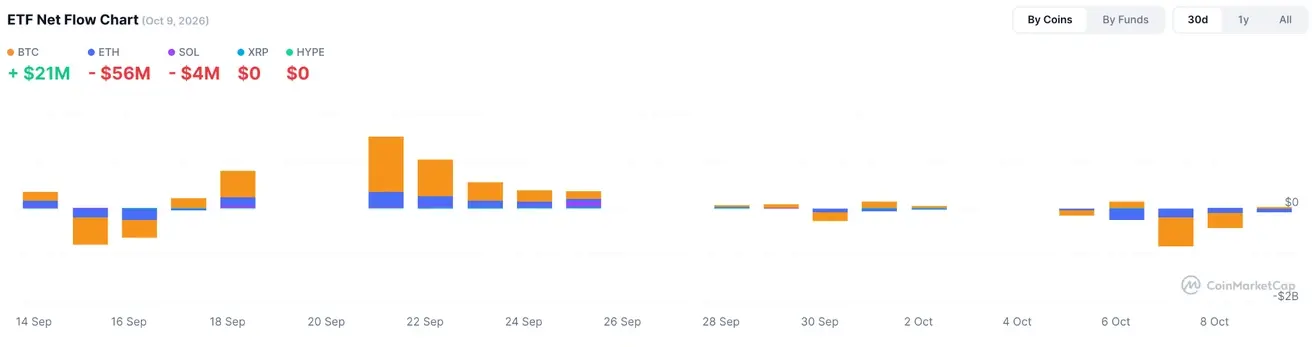
ETF Net Flows