Русский
 Қазақша
 Eesti
October 19 – October 25, 2026: Weekly economic update
Key market updates

Key Takeaways:
- The policy rate was raised to a range of 3.75 - 4.00%; rhetoric is hawkish;
- Monetary policy remains moderately restrictive;
- U.S. macroeconomic data continue to support a soft-landing scenario: inflation risks are increasing, the labor market is cooling without signs of recession, and current conditions do not yet warrant a rate cut.
- The Fed slightly improved its GDP and employment forecasts and raised its near-term inflation forecasts.
The U.S. economy continues to follow a “soft landing” trajectory: the labor market is gradually cooling, wage pressure is easing, and rate-sensitive mortgage demand remains weak. At the same time, overall consumer spending and investment remain resilient, supporting moderate GDP growth, while low initial jobless claims indicate the absence of large-scale layoffs.
For the Fed, this is a mixed picture: slower employment growth reduces the risk of overheating, but resilient consumption and investment create no urgent need to ease monetary policy. The future rate path will depend largely on inflation.
Inflation: Consumer Price Index (September)
- Core CPI (MoM): 0.3% (previous: 0.3%).
- Core CPI (YoY): 2.6% (previous: 2.4%).
- CPI (MoM): 0.6% (previous: 0.4%).
- CPI (YoY): 3.7% (previous: 3.4%).
Producer Price Index (September)
- PPI (MoM): 1.3% (previous: 0.4%).
- Core PPI (MoM): 0.7% (previous: 0.3%).
Inflation Expectations (Michigan) (September)
- 12-month Inflation Expectations: 4.7% (previous: 4.6%).
- 5-Year Inflation Expectations: 3.5% (previous: 3.4%).
The Fed’s inflation benchmark:
Core PCE Price Index (August): MoM: 0.2% (previous: 0.1%); YoY: 3.0% (previous: 3.7%):
Headline PCE Price Index (August): MoM: 0.3% (previous: 0.1%); YoY: 3.4% (previous: 3.4%):
GDP (U.S. Bureau of Economic Analysis, BEA) — Q2 2026 annualized, third estimate: 2.2% (second estimate: +1.5%; Q1 2026 was revised from +2.1% to 2.5%).
GDPNow (the Atlanta Fed’s real-time estimate of official GDP growth ahead of release (Q3 2026)): 3.6% (previous: 3.6%).
The Redbook Retail Sales Index, a high-frequency proxy for U.S. consumer demand, slowed to 9.0% YoY from 10.4%. Over the longer term, however, the index maintains the steady upward trend observed since the start of 2026. This points to sustained consumer activity despite a cooling labor market and high interest rates.
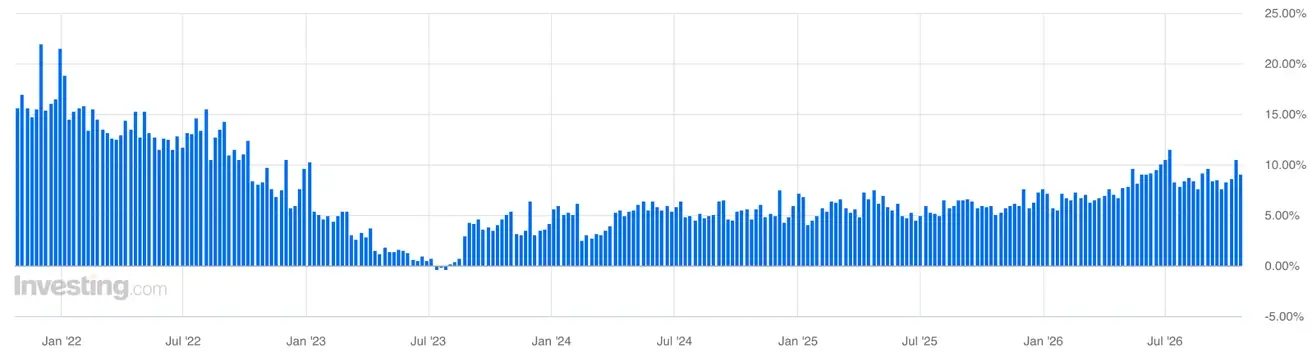
* Redbook tracks nominal sales, so part of the growth may reflect higher prices rather than larger real consumption volumes. In addition, the index covers a sample of large retail chains rather than the entire U.S. consumer sector. Its key advantage, however, is its weekly frequency, which lets us track shifts in consumer activity ahead of official statistics.
Labor Market (BLS) (September/October)
Cooling without signs of a sharp deterioration. Weak hiring and low initial jobless claims are particularly telling: companies are slowing hiring but have not yet moved to large-scale layoffs.
- Unemployment rate: 4.2% (previous: 4.1%);
- Total number of people receiving unemployment benefits in the U.S.: 1,728K (previous: 1,710K);
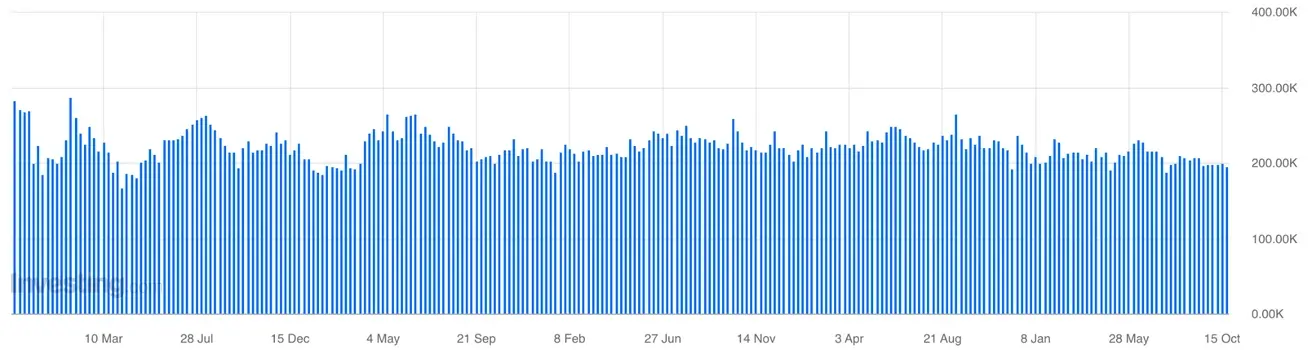
- Initial jobless claims: 194K (previous: 199K) — no signs of mass layoffs;
- Change in nonfarm payrolls: 29K (previous: 133K, revised) — a significant slowdown in hiring;
- Change in private nonfarm payrolls: 46K (previous: 89K, revised) — a significant slowdown in hiring;
- Average hourly earnings (YoY): 3.0% (previous: 3.1%) — a slowdown, which is positive in terms of inflationary pressure;
- JOLTS job openings: 7.271M (prev: 6.866M).
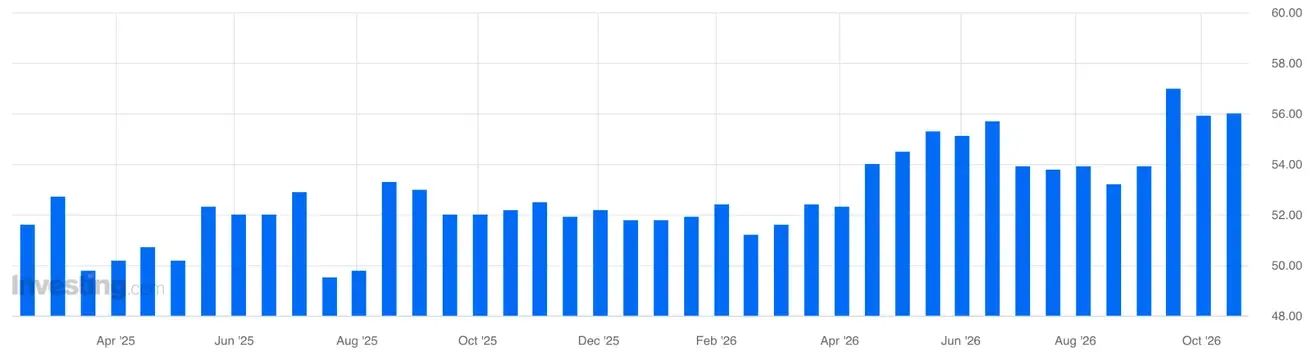
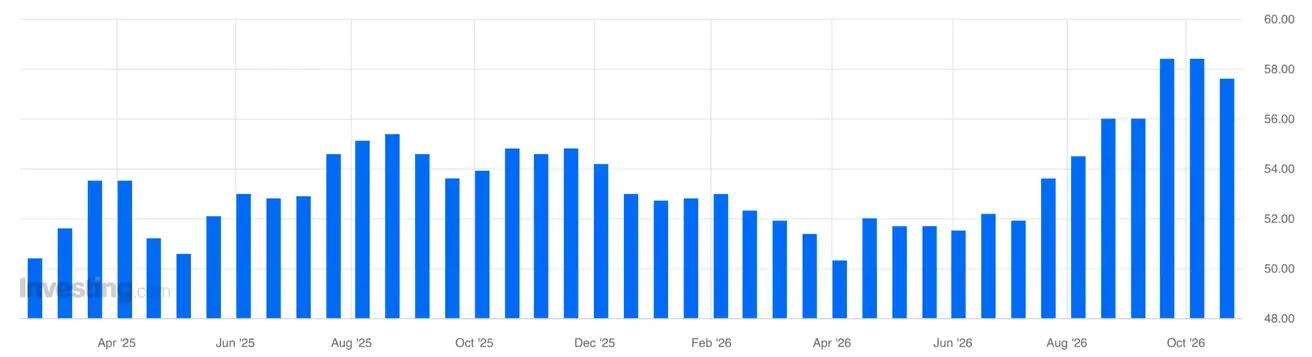
Business Activity Index (PMI) (October)
(Above 50 indicates expansion; below 50 indicates contraction)
- Services PMI: 57.9 (previous: 58.8):
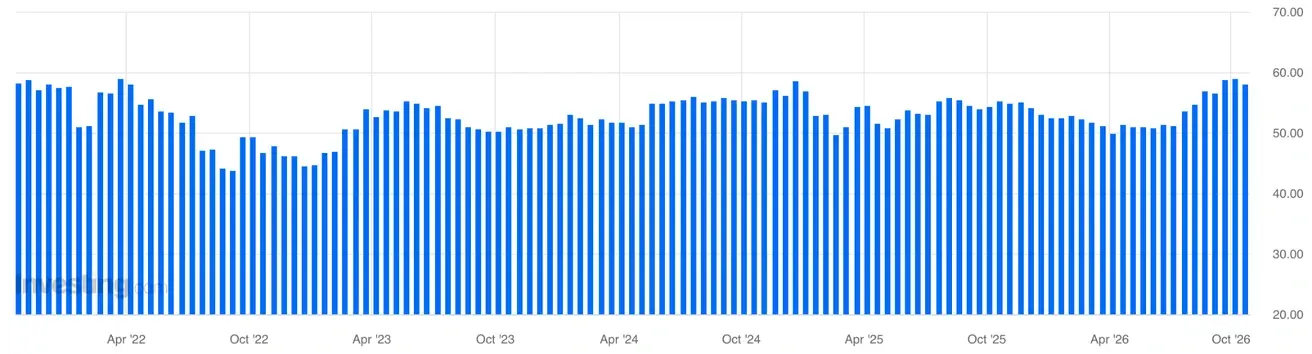
- Manufacturing PMI: 56.0 (previous: 55.9):
- Composite PMI: 57.6 (previous: 58.4):
Housing Market (September/October)
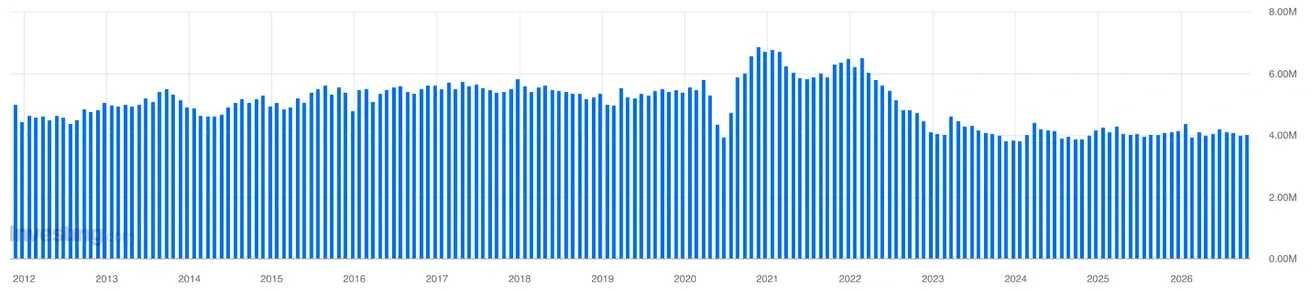
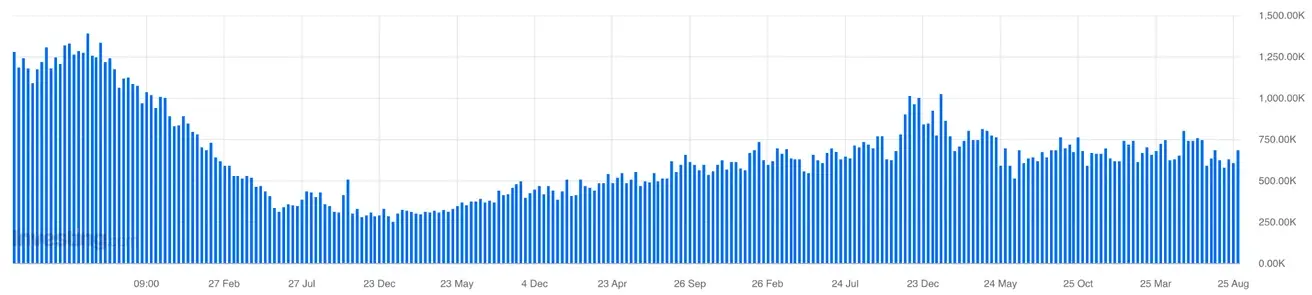
After a sharp cooldown in 2022–2023, the U.S. housing market has entered a prolonged stabilization period. Despite high mortgage rates, existing home sales have held around 4 million annualized for several years, while the new-home market has remained relatively steady.
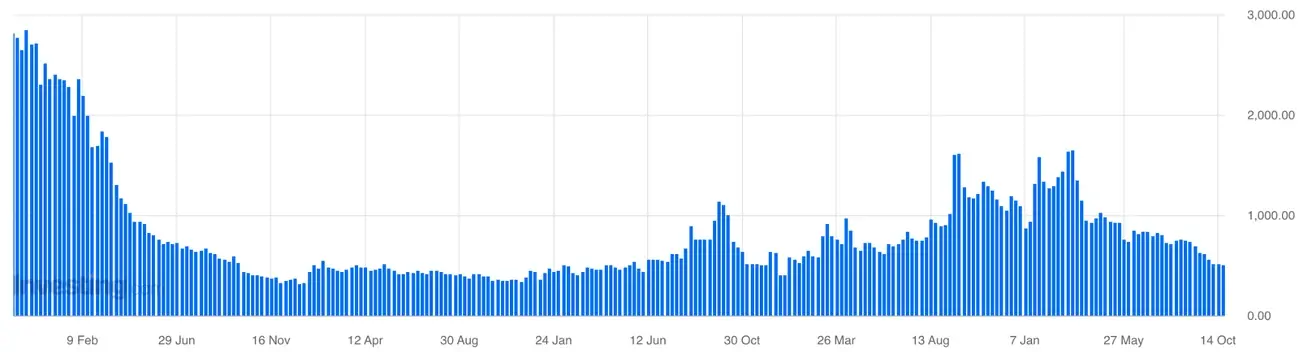
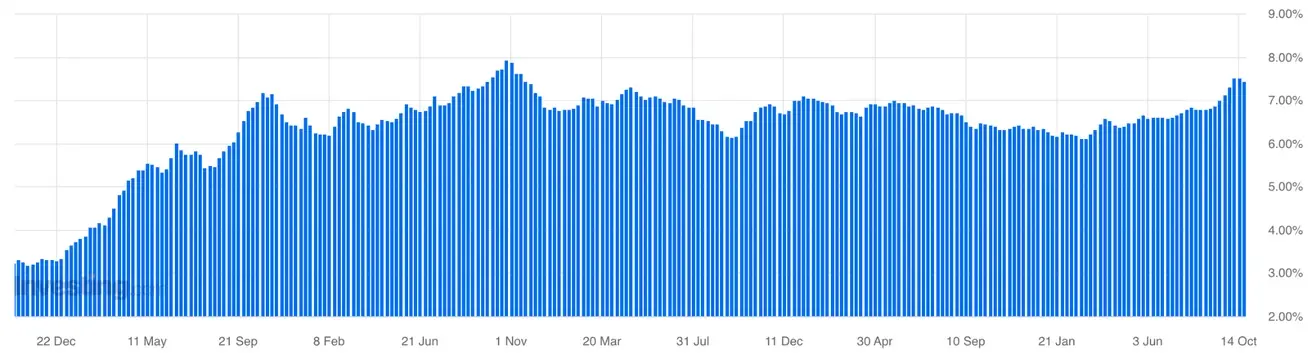
However, the latest MBA data point to weakening mortgage demand: the composite applications index fell 5.3% week-over-week, the purchase index fell 7.3%, and the refinance index fell 2.0%. The 30-year mortgage rate's decline from 7.50% to 7.41% has not yet translated into stronger mortgage demand—the market is waiting for a larger drop in mortgage rates.
Overall, these dynamics align with a “soft landing” scenario: high borrowing costs continue to weigh on demand but haven’t yet triggered a new large-scale decline in home sales. Accordingly, there are no signs of a systemic real estate crisis.
MBA Mortgage Market Index: 188.6 (previous: 199.2)
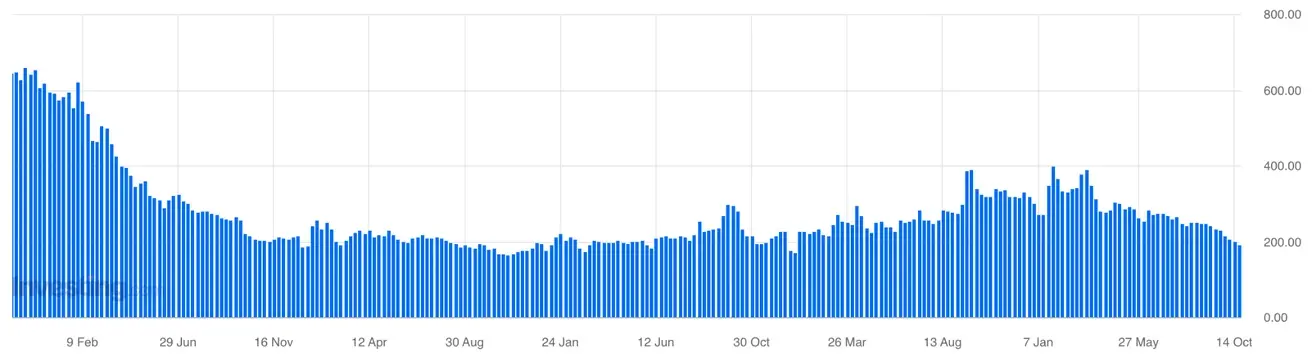
MBA Purchase Index: 129.2 (previous: 139.3)
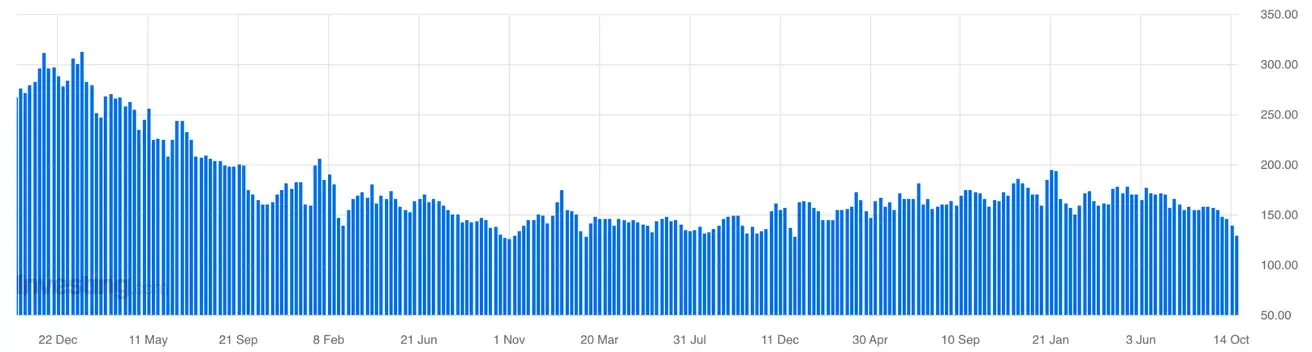
MBA Refinance Index: 503.1 (previous: 513.5)
MBA 30-Year Mortgage Rate: 7.41% (previous: 7.50%)
Existing Home Sales: 3.99M (previous: 3.93M)
New Home Sales: 684K (previous: 643K)
Monetary Policy
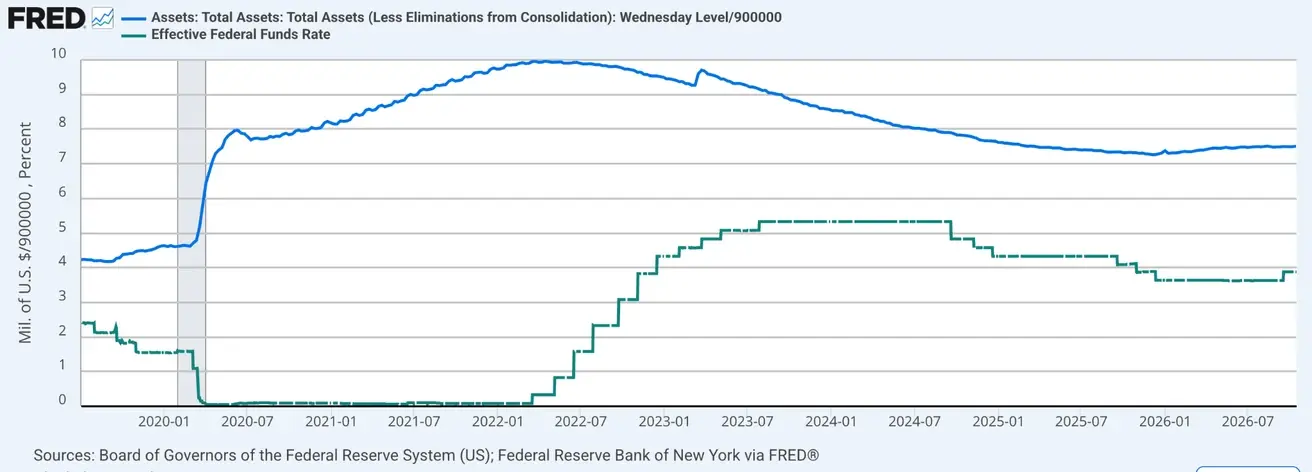
Federal funds rate (EFFR): 3.75%–4.00%
Federal Reserve balance sheet: $6.753 trillion, +3.34% since the end of QT ($6.535 trillion):
Market Forecast for Rate (FedWatch)
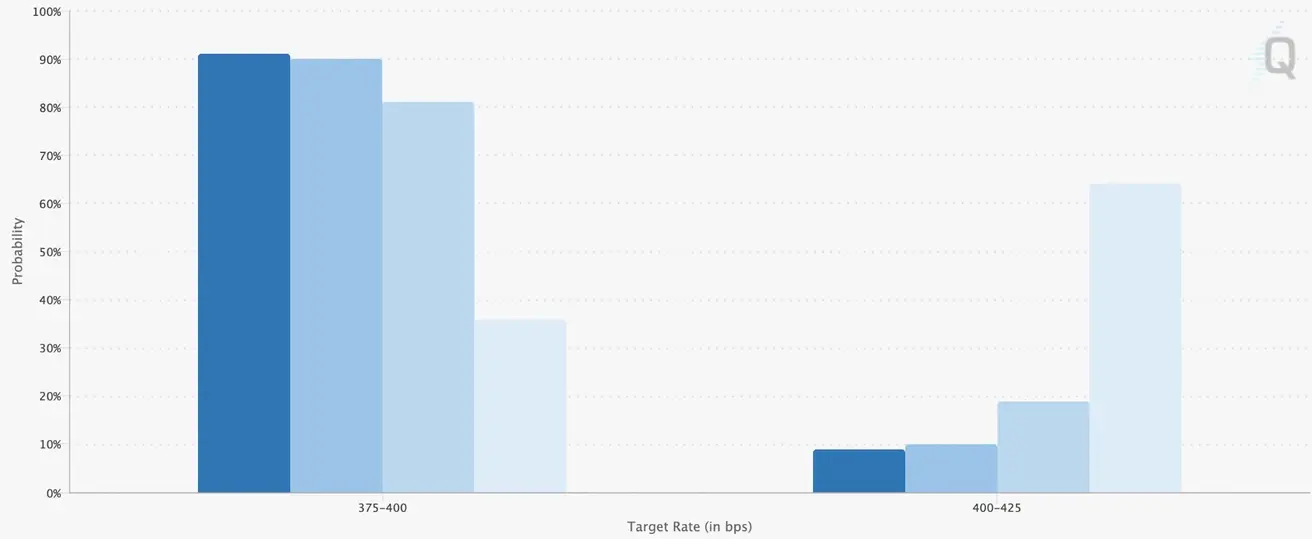
For the next FOMC meeting (October 28), the estimated probability of a 0.25% rate hike is 8.86% (a week earlier: 12.73%; a month earlier: 68.1%). The base case is a hold:
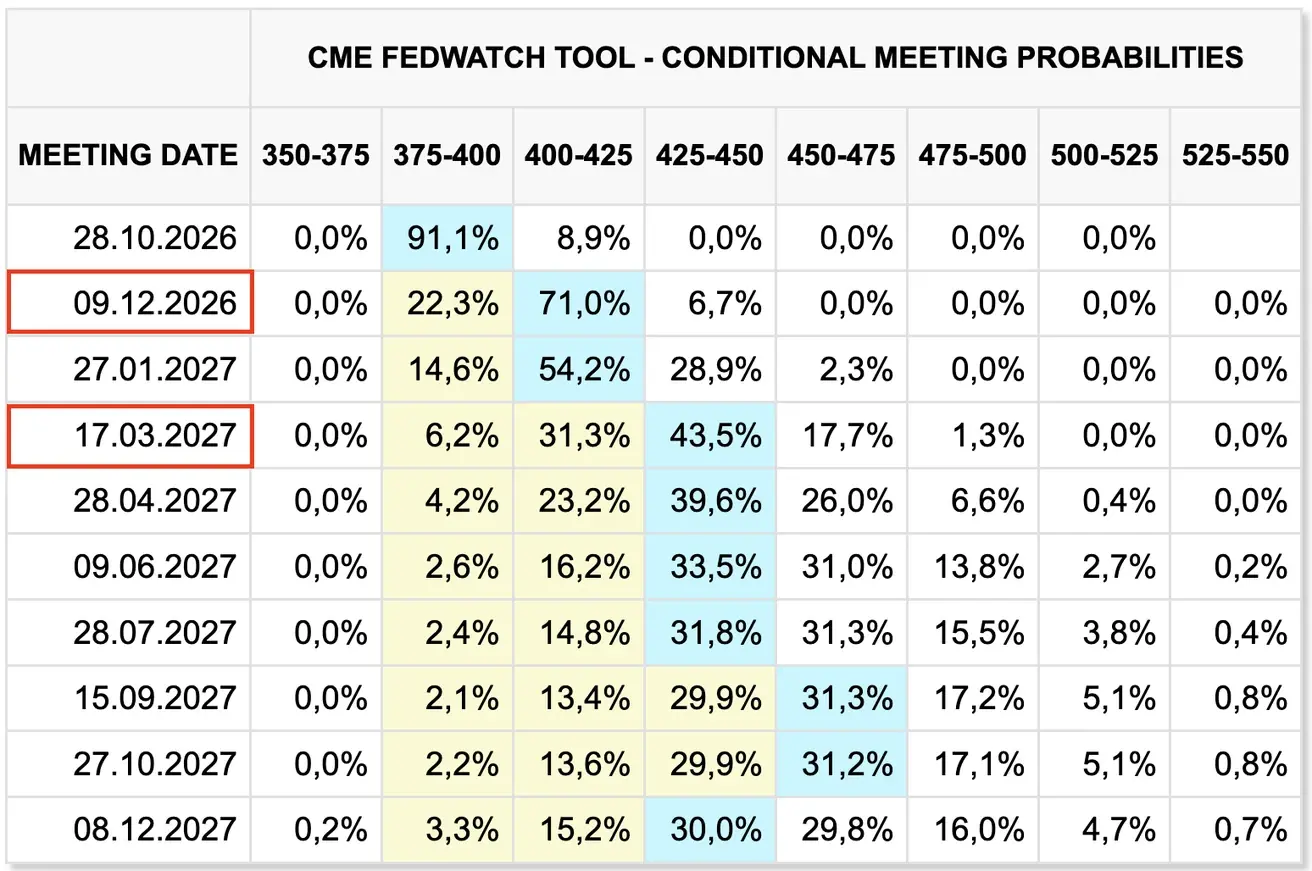
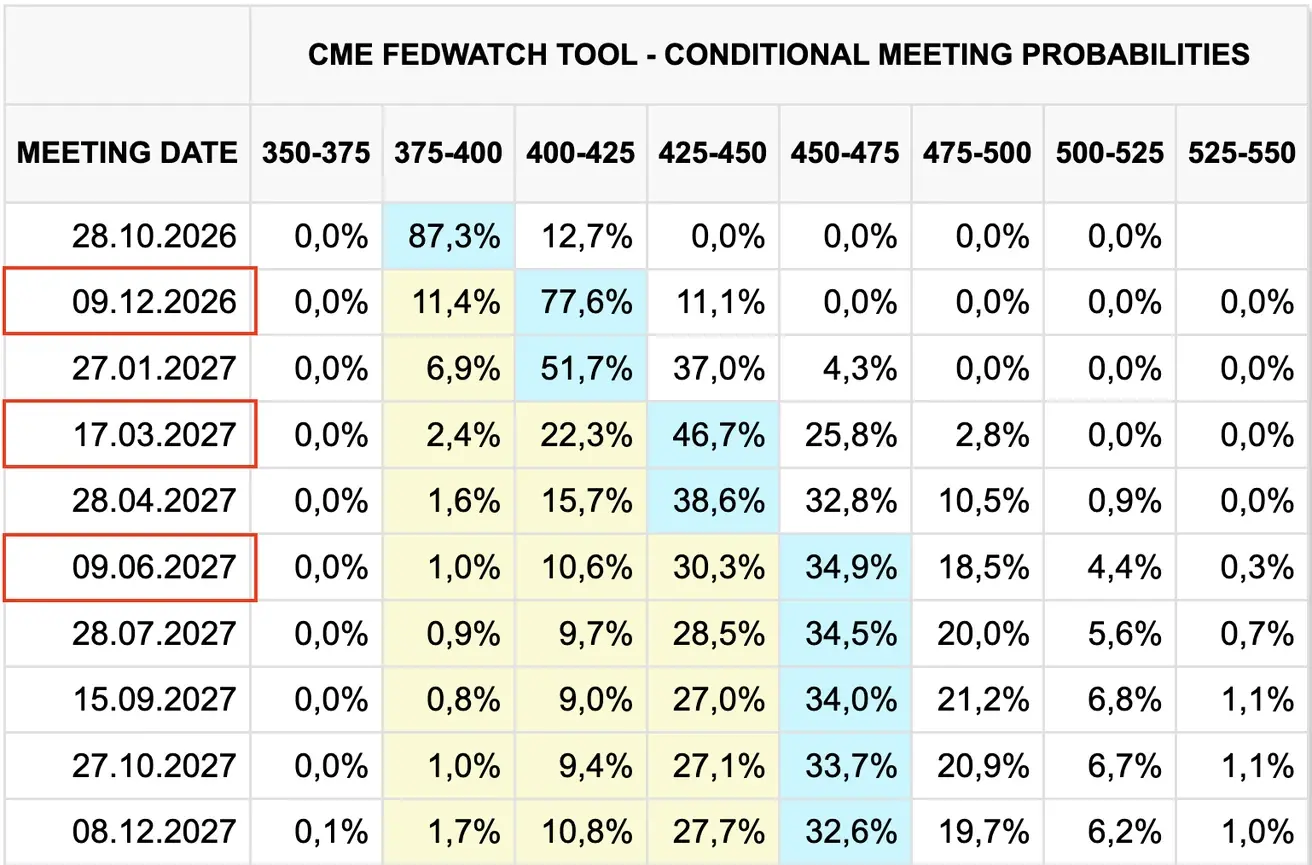
Over the next 12 months, sentiment has improved: the market expects two 0.25% rate hikes, bringing the rate to a range of 4.25–4.50% (excluding the October 2027 outlier):
Today:
A week earlier:
Bond Market
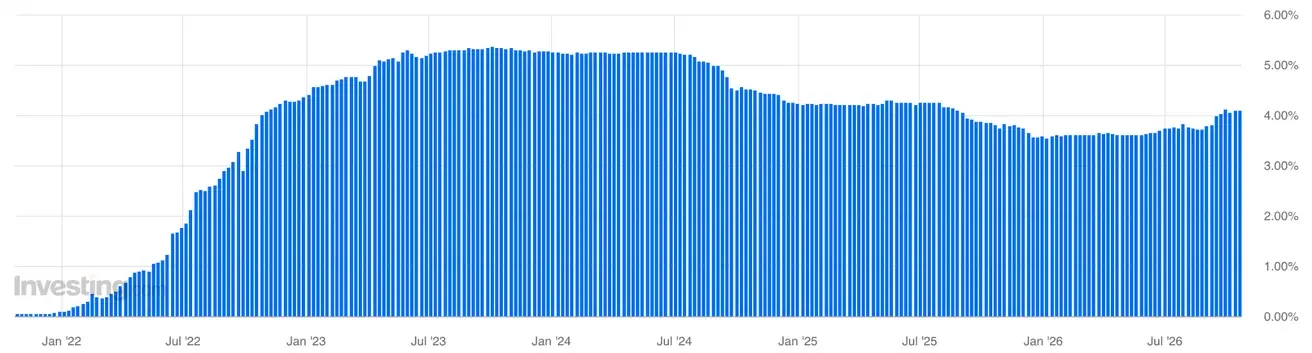
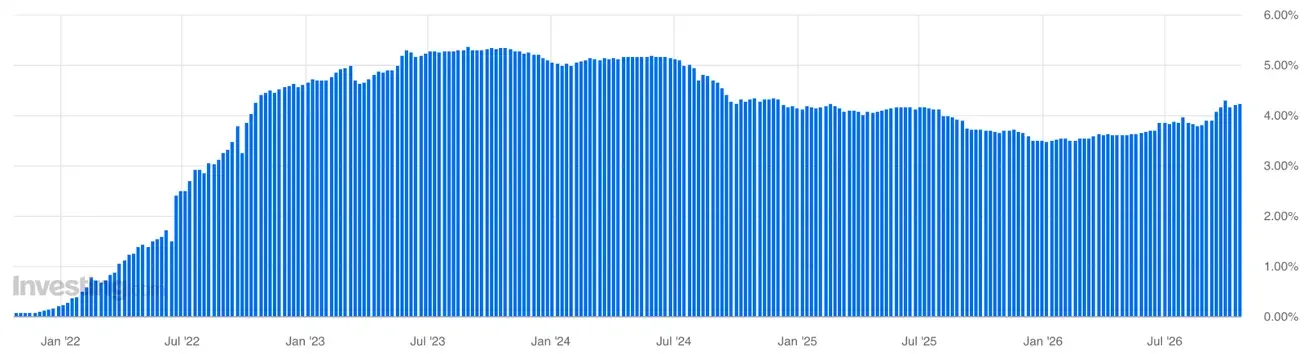
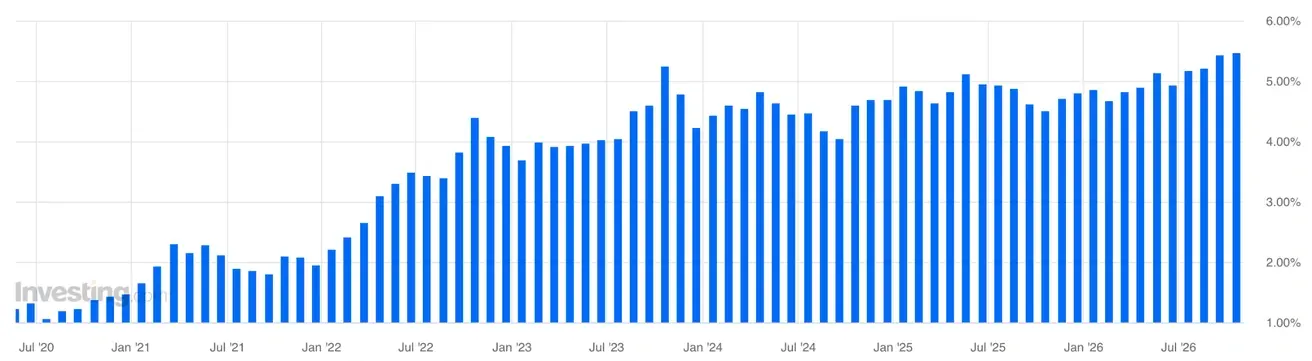
U.S. Debt Market: yields consolidate at primary auctions and decline notably in the secondary market.
Last week’s Treasury auctions slowed the yield rise.
3-Month Treasury Bill Auction: 4.095% (previous: 4.085%)
6-Month Treasury Bill Auction: 4.220% (previous: 4.200%)
20-Year Treasury Bond Auction: 5.469% (previous: 5.420%)
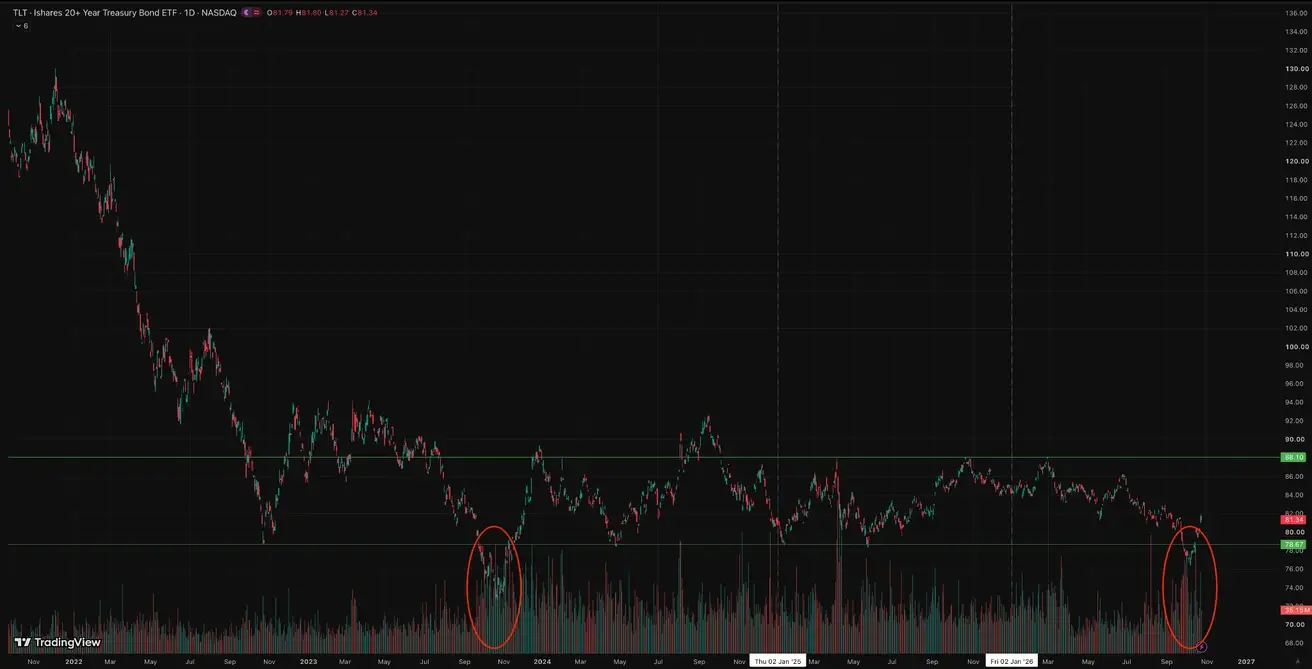
U.S. Treasury Bonds 20+ Years (TLT ETF): weekly performance: +1.65% (week close: $81.34); year-to-date: -6.68%
In both highlighted periods, TLT trading volumes surged near multi-year lows, followed by a price recovery.
This may signal a shift in the supply-demand balance in the long-dated Treasury market. Heavy volume near the lows may reflect not only broad selling but also large buyers actively absorbing supply. The volume spikes were accompanied by a sharp price rebound.
Some investors likely view current yields as attractive enough to extend duration. The spread between 30-year Treasuries (5.30%) and the fed funds rate (3.88%) stands at 142 bps, meaning investors earn a meaningful premium for taking on long-term interest rate risk. At the same time, this spread may also reflect an elevated term premium, inflation uncertainty, and U.S. fiscal risks.
In 2023, a substantial rally in TLT subsequently confirmed the first interpretation. In 2026, we can only speak to preconditions for now, as the fundamentals differ.
Yields and Spreads
- Market Yield on U.S. Treasury Securities at 10-Year Constant Maturity: 4.96% (previous: 5.07%);
- 2-Year U.S. Treasury Yield: 4.66% (previous: 4.72%);
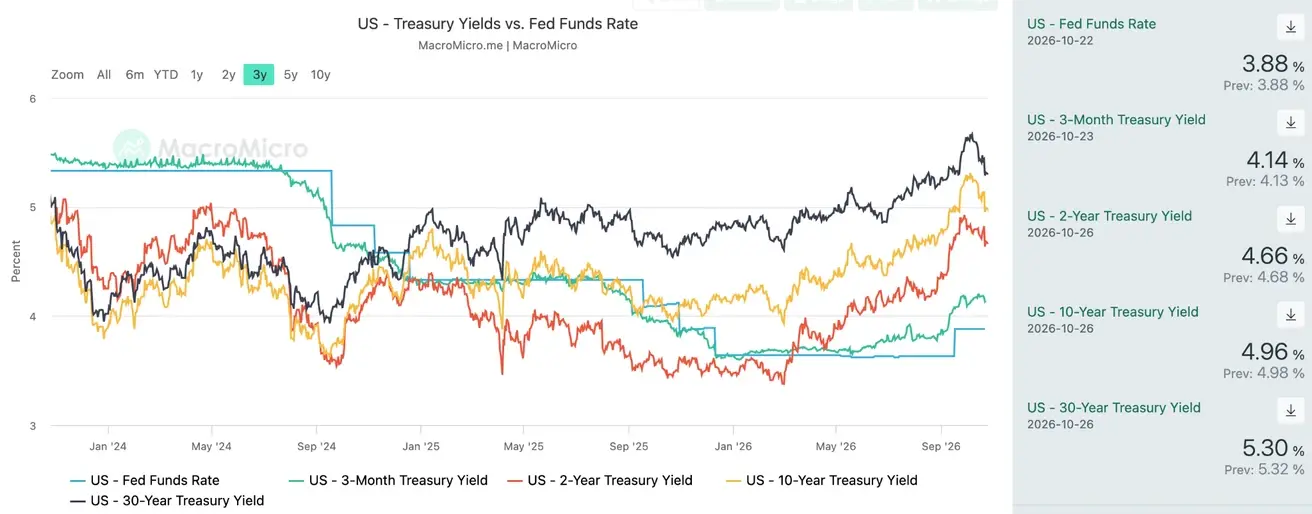
- The yield spread between 10-year and 2-year U.S. Treasury securities stands at 30 basis points (previous: 35 bps);
- The yield spread between 10-year and 3-month U.S. Treasury securities stands at 82 basis points (previous: 89 bps).
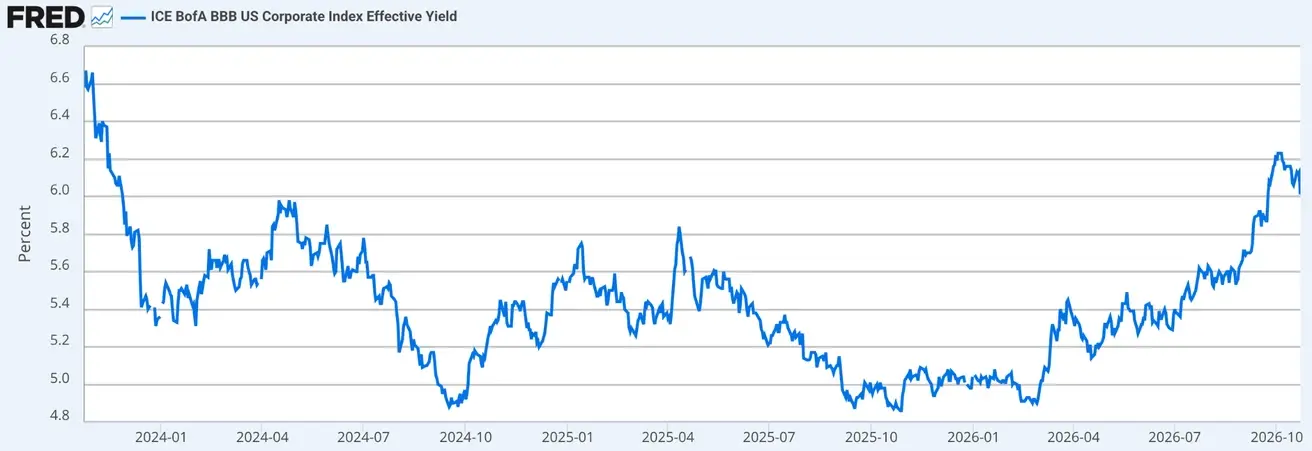
- ICE BofA BBB US Corporate Index Effective Yield: 6.01% (previous: 6.07%).
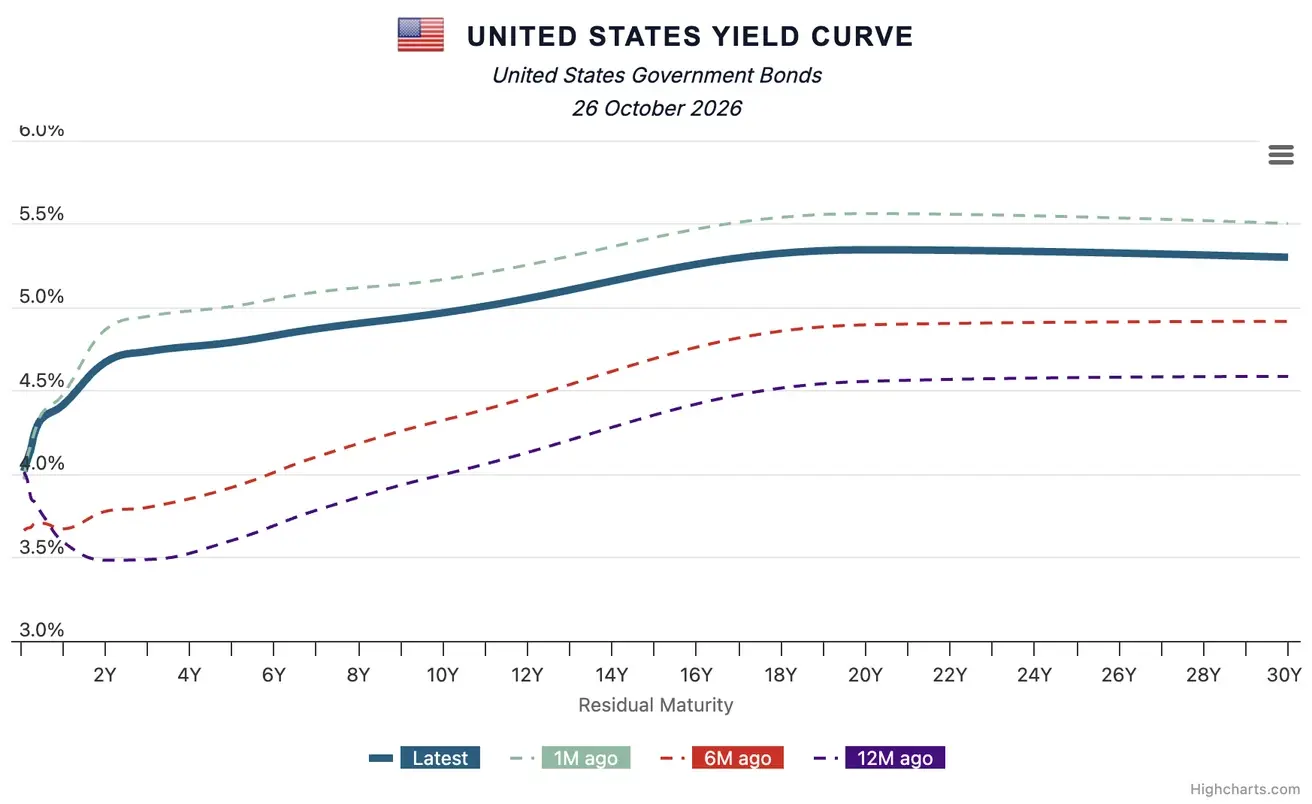
U.S. Treasury Yield Curve
The cost of a 5-year U.S. Credit Default Swap (CDS) — a market-based measure of sovereign default insurance — is 34.14 basis points (vs. 37.36 basis points a week earlier).
S&P500
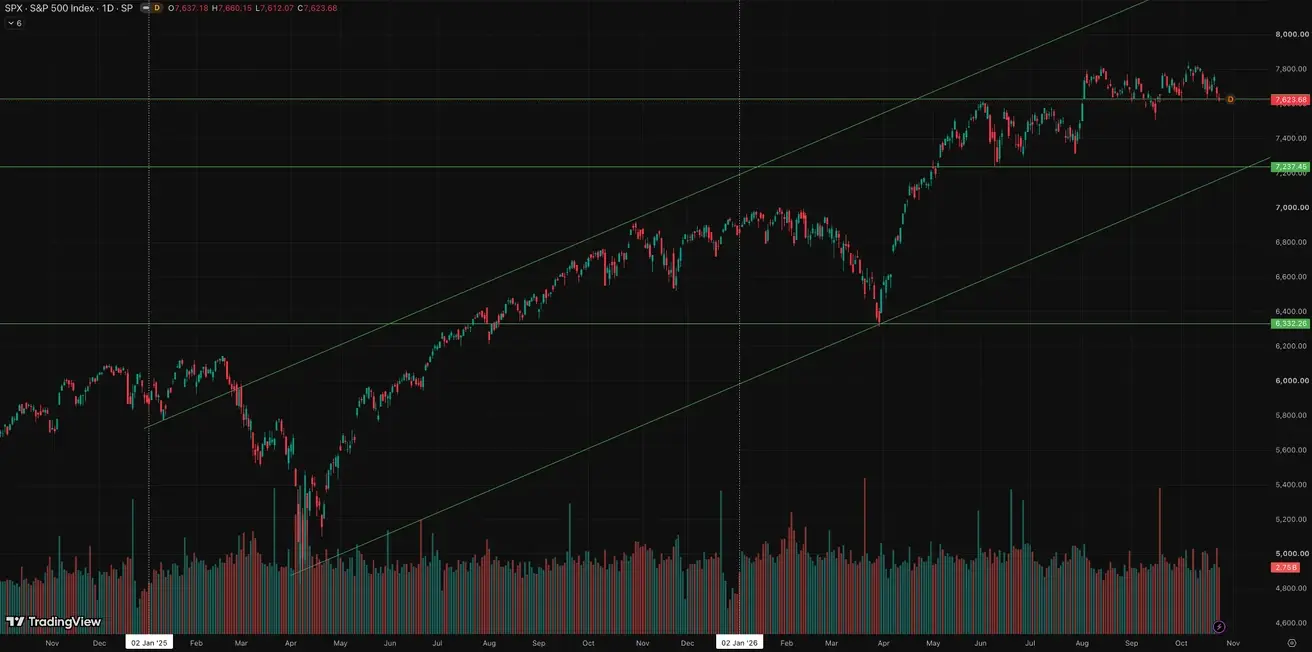
Weekly performance: -0.47% (week-end close: 7,623.68); year-to-date: +11.37%.
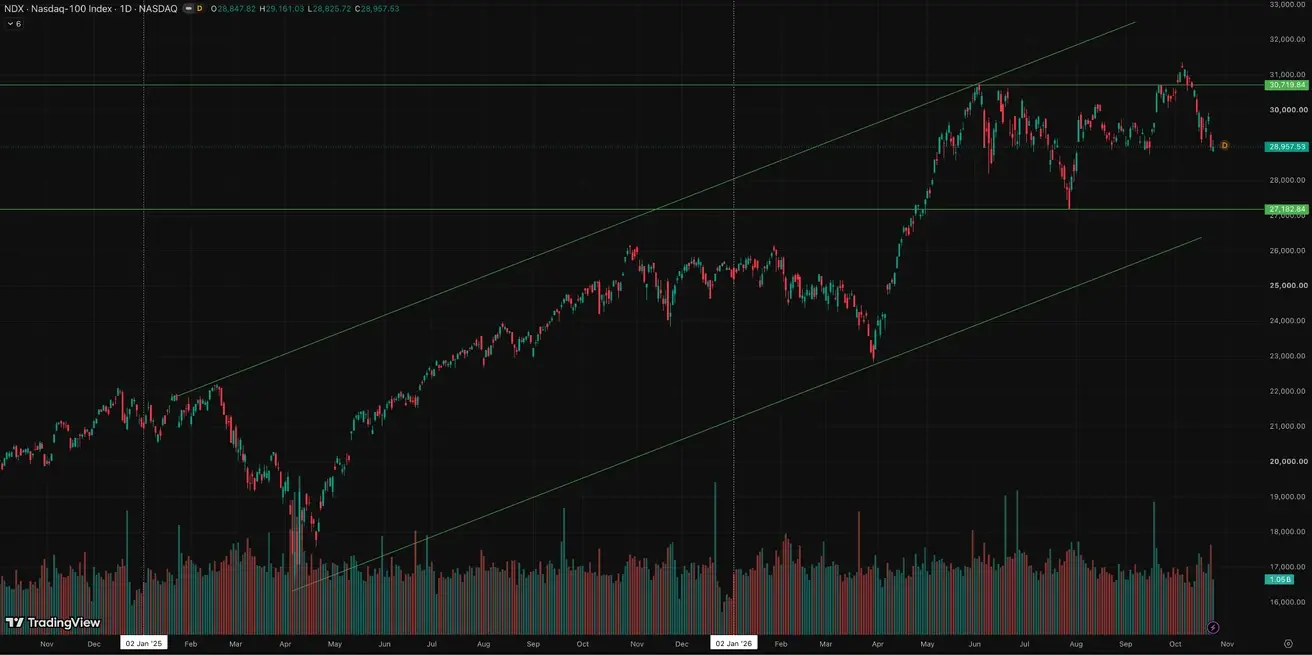
NASDAQ100
Weekly performance: -0.79% (week-end close: 28,957.53); year-to-date: +14.68%.
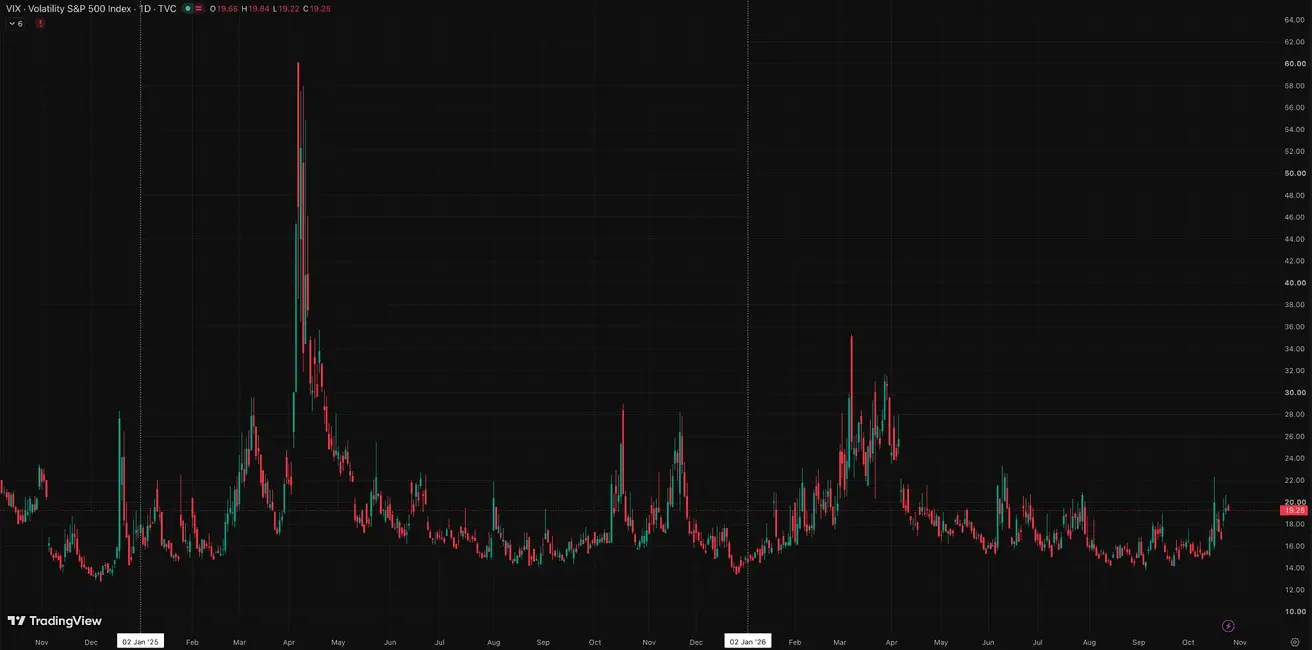
VIX
VIX (volatility index): week-end close at 19.44 points.
Eurozone
- The ECB raised interest rates, while maintaining a hawkish stance as inflationary risks continue to increase;
- Against the backdrop of the conflict in the Middle East, the ECB revised its GDP forecasts downward and raised its inflation projections for the coming years.
ECB officials’ rhetoric:
Christine Lagarde. Topic: inflation risks, economic resilience, and the monetary policy outlook.
The ECB President noted that the euro area economy remains resilient despite the energy shock and geopolitical uncertainty. Meanwhile, inflation accelerated to 3.8% in September, and core inflation to 2.5%. Higher energy prices are likely to keep headline inflation well above target in the first half of 2027.
Key monetary signal: the energy shock is too large for the ECB to ignore, but the response should remain measured. So far, the ECB sees no significant pass-through of energy inflation to wages and other prices beyond what is already reflected in its projections. Lagarde also pointed to tighter financial conditions resulting from higher long-term rates.
Takeaway: the rhetoric is moderately hawkish, but it signals no need for aggressive rate hikes. The ECB acknowledges inflation risks while accounting for the cooling effect of already tighter financial conditions.
Macroeconomic Data
Commentary
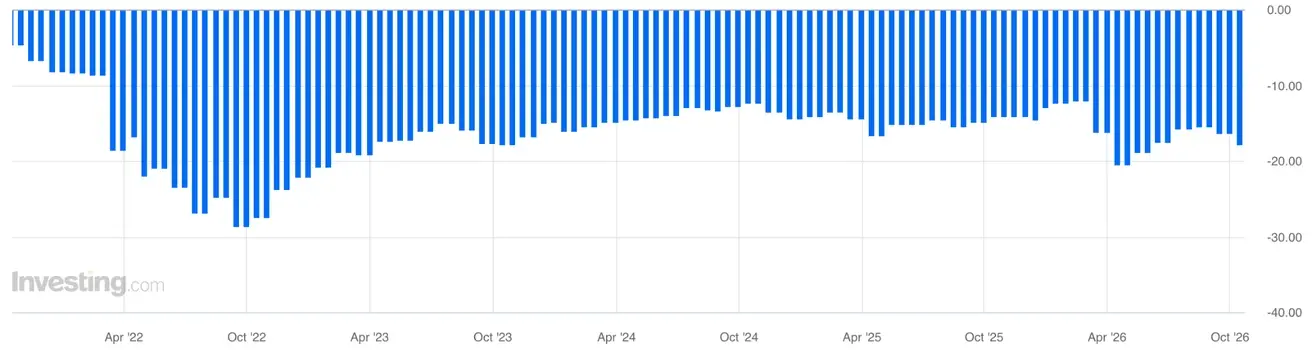
The eurozone economy is showing moderate resilience and has so far avoided a pronounced downturn; however, it faces accelerating inflation, weak consumer confidence, and slowing industrial output.
The main risk, of course, is inflation, which is well above the 2% target, leaving limited room for monetary easing. At the same time, further rate hikes could further weigh on domestic demand and investment.
Industrial production declined by 0.5% MoM and 1.1% YoY. Consumer sentiment remains depressed (the index stands at -17.9), posing risks to the recovery of private consumption and domestic demand.
Unlike the U.S., where a cooling labor market is accompanied by resilient consumer demand, the eurozone presents a more complex mix of deteriorating consumer sentiment and accelerating inflation. This makes the ECB’s policy path less certain.
Interest Rates
- Deposit Facility Rate: 2.50% (previous: 2.25%);
- Marginal Lending Facility Rate: 2.9% (previous: 2.65%) — the rate at which banks can obtain overnight funding from the central bank;
- Main Refinancing Rate (Policy Rate): 2.65% (previous: 2.40%).
Inflation: Consumer Price Index (CPI) (September)
- Core CPI (YoY): 2.5% (previous: 2.4%);
- Headline CPI: 0.6% (MoM) (previous: 0.4%);
- CPI: 3.8% (YoY) (previous: 3.2%).
GDP (Q2 2026)
- QoQ: 0.6% (previous: -0.2%);
- YoY (final): 0.5% (preliminary estimate: 0.4%); (previous: 0.3%).
Trade balance (USD) (YoY): -16.1 bn (previous: 10.7 bn);
Industrial production (September): (MoM) -0.5% (previous: -0.3%, revised).
Unemployment Rate (August): 6.4% (previous: 6.4%).
Eurozone Consumer Confidence Index: -17.9 (previous: -16.8)
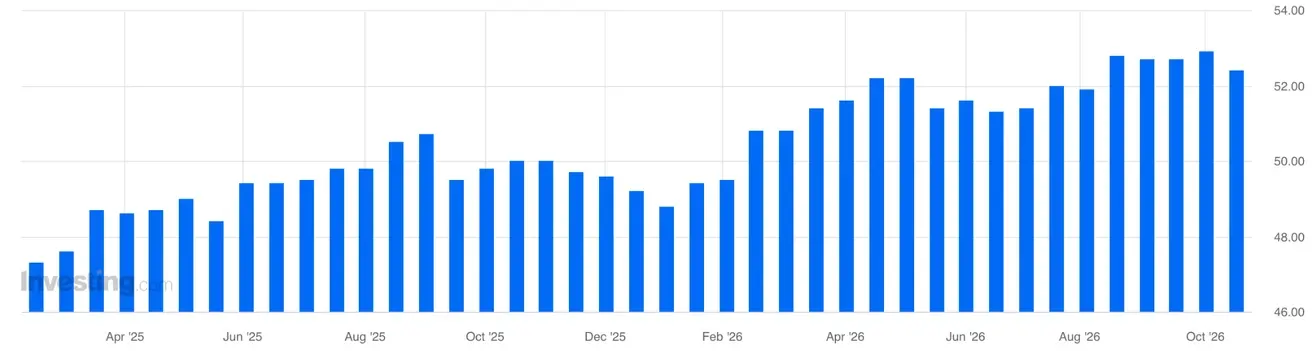
Purchasing Managers’ Index (PMI) (September)
- Services PMI: 51.7 (previous: 53.0, revised);
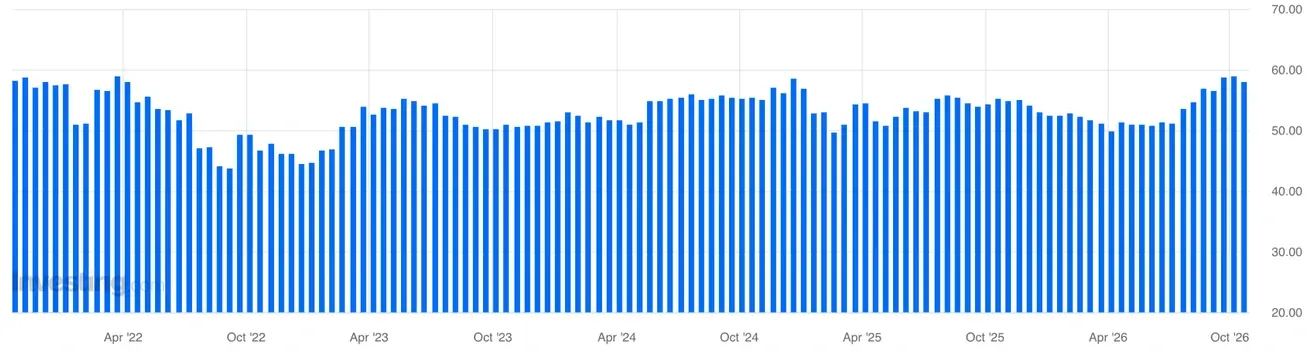
- Manufacturing PMI: 52.4 (previous: 52.9);
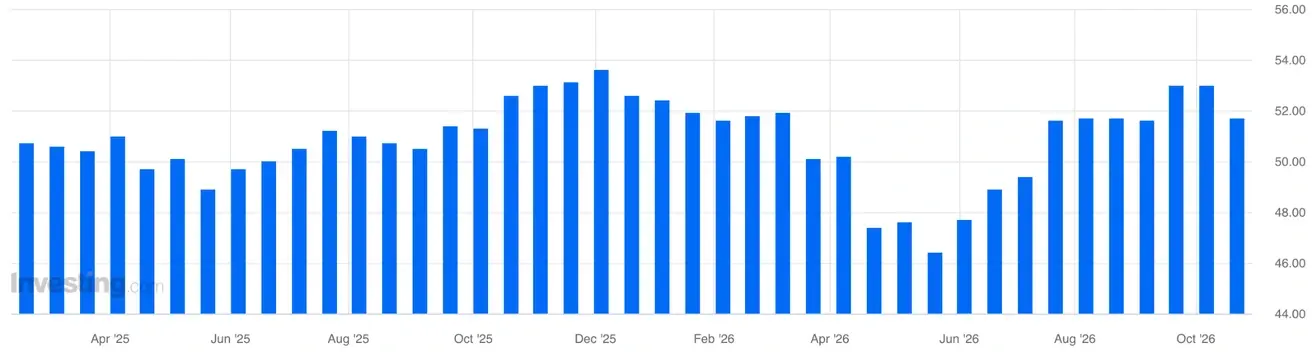
- S&P Global Composite PMI: 51.9 (previous: 52.9).
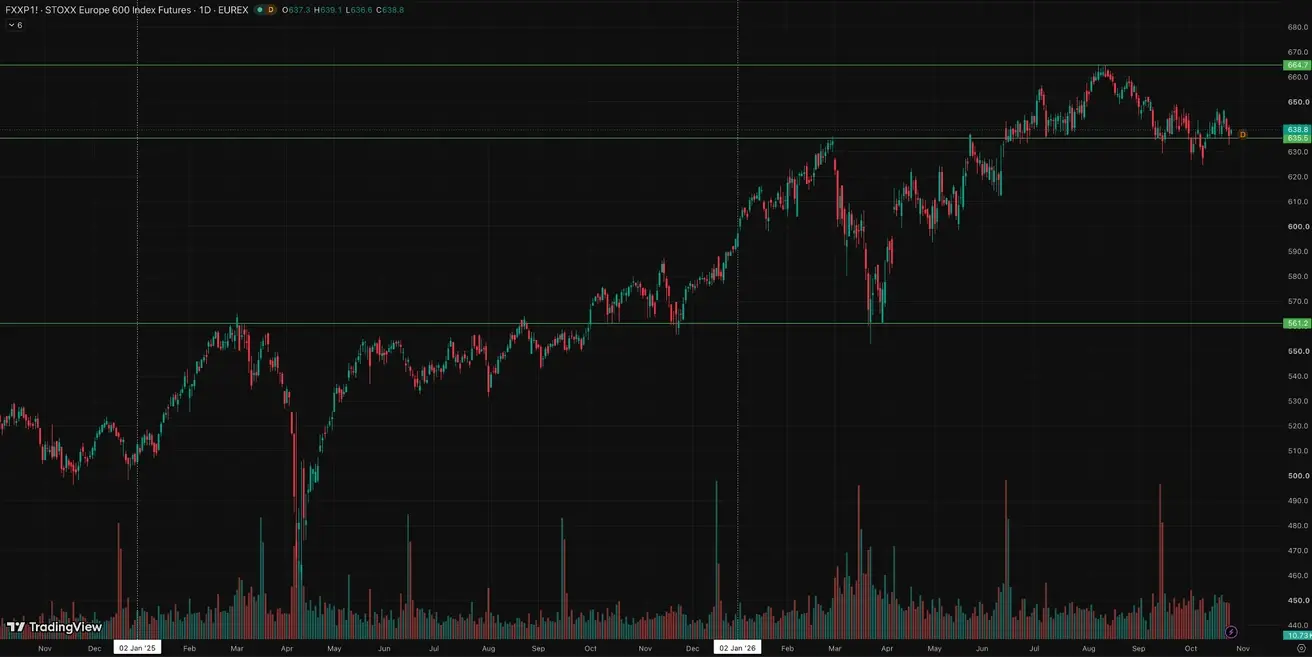
Euro Stoxx 600 (FXXP1!)
Weekly performance: -1.50% (week-end close: 636.40); year-to-date: +7.14%.
China
China’s economy continues to stabilize, supported by strong exports, while domestic demand and investment gradually recover. Policymakers remain measured and targeted in their stimulus approach.
- Interest rates remain unchanged;
- Monetary policy remains accommodative;
- China reaffirmed its commitment to fiscal support for economic growth under its 2026 plan, including measures to stimulate domestic demand, optimize tax incentives and subsidies, and modernize industrial capacity.
Commentary
The PBoC kept rates unchanged.
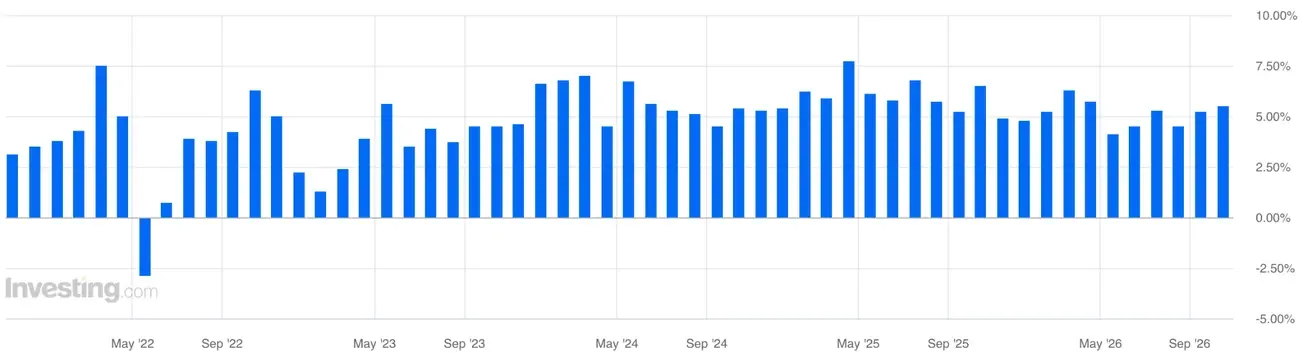
The Chinese economy continues to grow at a relatively strong pace, driven by industry (+5.5% YoY) and foreign trade (a $133 bn trade surplus), with exports continuing to show strong momentum (+36.3% YoY).
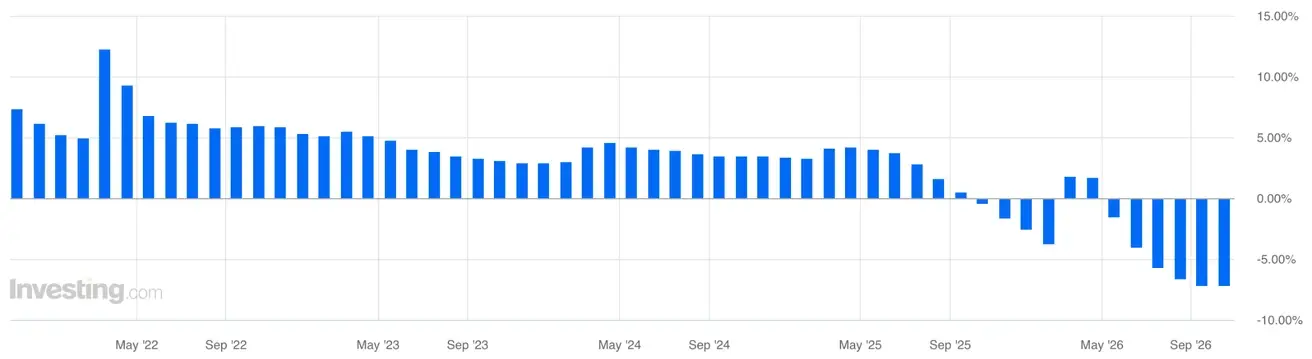
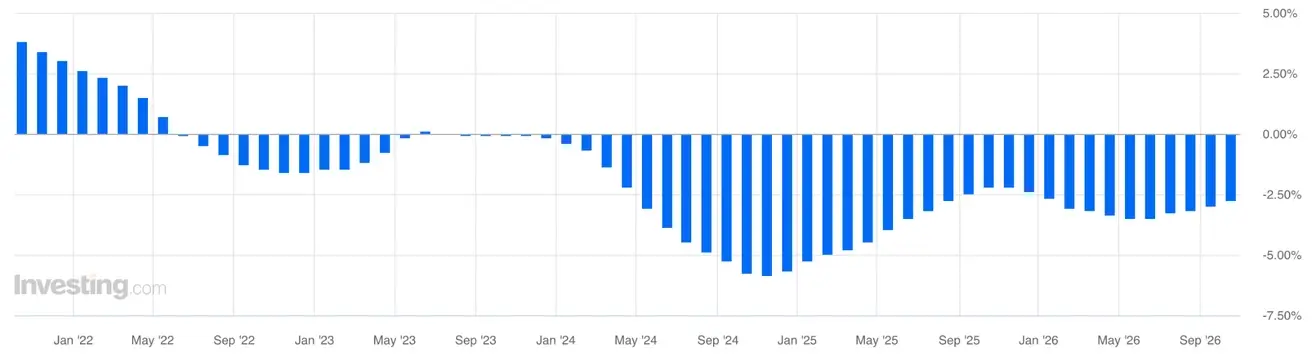
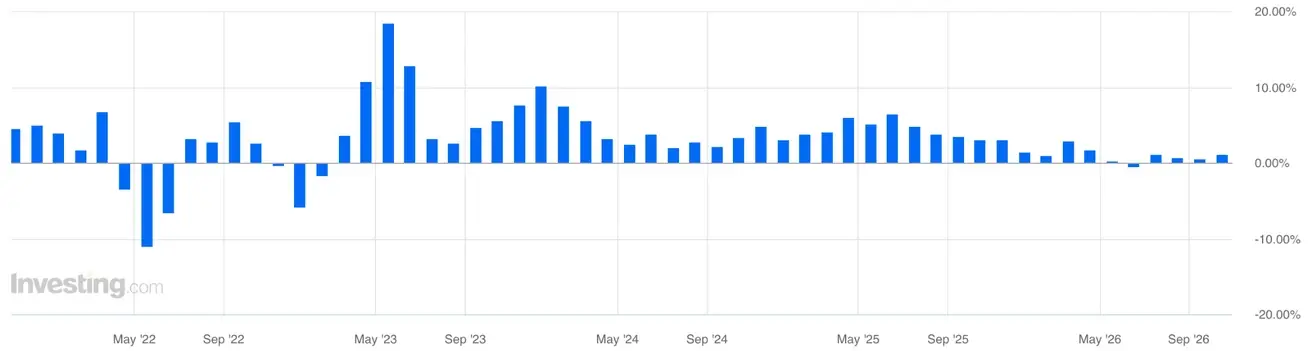
However, domestic demand (retail sales +1.1% YoY) and investment activity (-7.2%) remain very weak, and the property market remains under pressure.
Meanwhile, producer price inflation is accelerating to 5.0% amid low consumer inflation (0.9%), suggesting cost pressures on corporate profits—the key question is whether companies can pass these costs on to customers.
The combination of +5.5% industrial growth and a 7.2% contraction in investment points to a significant structural imbalance. If it persists, it may constrain China’s medium-term growth potential, even with strong exports. In addition, China urgently needs domestic demand to recover.
Macroeconomic Data
Interest Rates
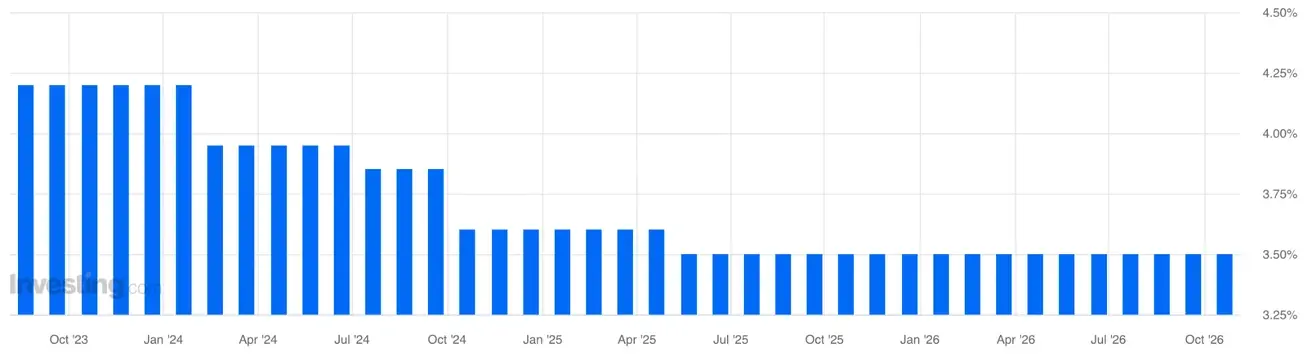
- 1-Year Loan Prime Rate (medium-term lending): 3.00%;
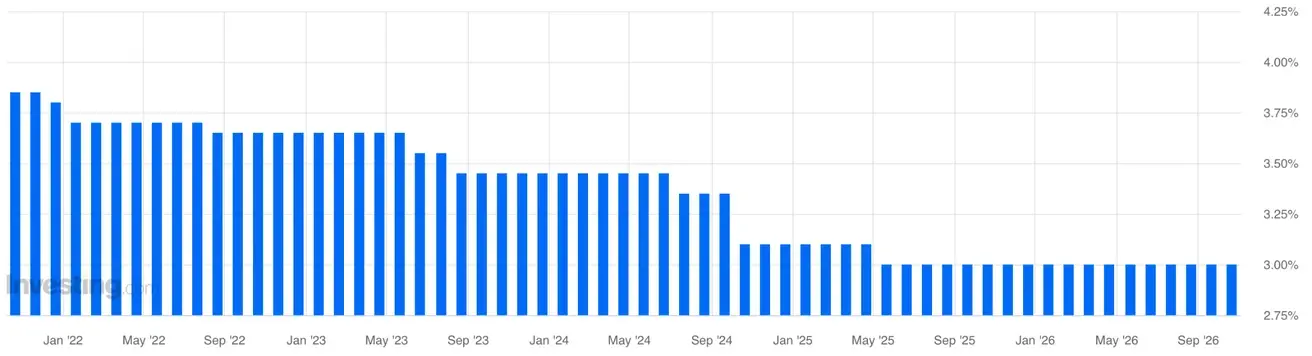
- 5-Year Loan Prime Rate (benchmark for mortgage lending): 3.50%.
Inflation Indicators (September)
- Consumer Price Index (CPI): 0.2% MoM (previous: 0.4%)
- Consumer Price Index (CPI): 0.9% YoY (previous: 0.8%)
- Producer Price Index (PPI): 5.0% YoY (previous: 3.8%).
Trade Data (September)
Trade balance (USD) (YoY): $133.53 bn (previous: $119.9 bn);
Imports: 31.0% YoY (previous: 28.2%);
Exports: 36.3% YoY (previous: 25.0%);
GDP (Q3 2026)
- QoQ: 1.2% (previous: 0.9%);
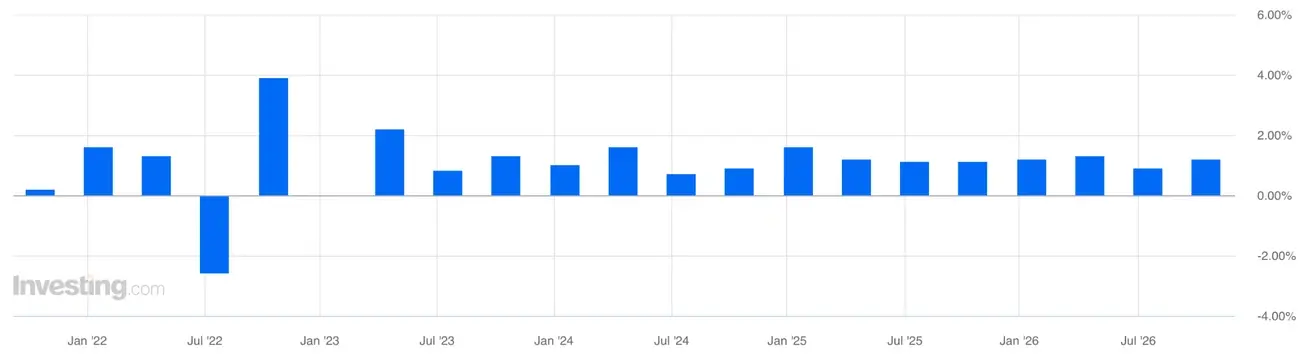
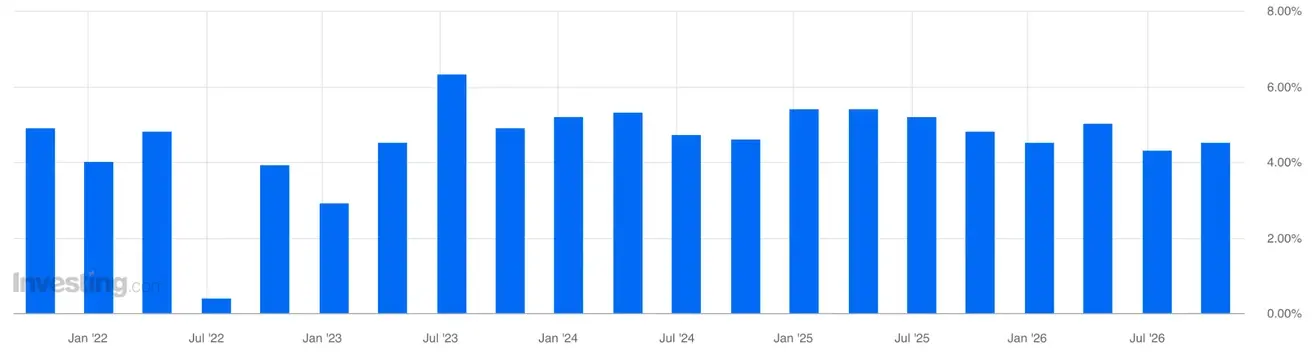
- YoY: 4.5% (previous: 4.3%).
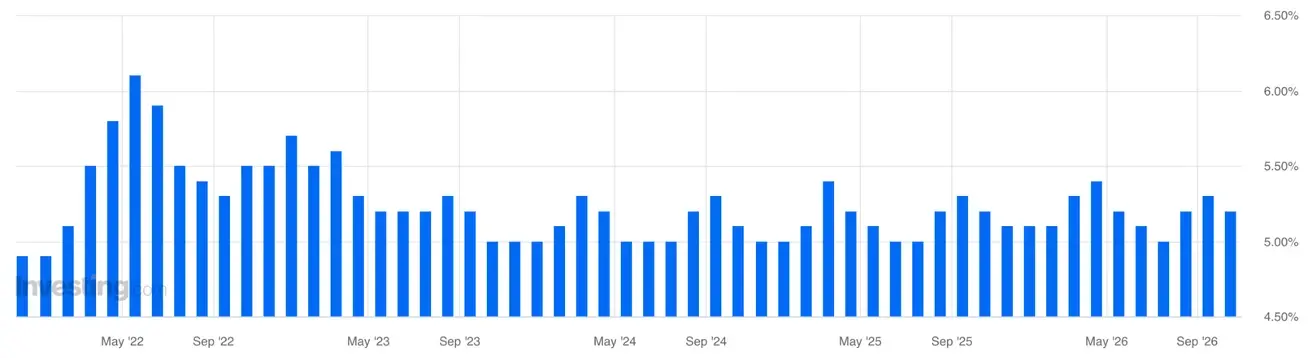
Labor Market
- Unemployment Rate (September): 5.2% (previous: 5.3%).
Industrial Activity
- Industrial Production (September, YoY): 5.5% (previous: 5.2%).
Fixed Asset Investment
- September, YoY: -7.2% (previous: -6.7%).
House Price Index (YoY): -2.8% (previous: -3.0%):
Retail Sales
- September, YoY: 1.1% (previous: 0.4%):
Purchasing Managers’ Indices (PMI) (August)
- Manufacturing PMI: 50.1 (previous: 49.8);
- Non-Manufacturing PMI: 50.2 (previous: 49.0);
- Composite PMI: 50.7 (previous: 49.5).
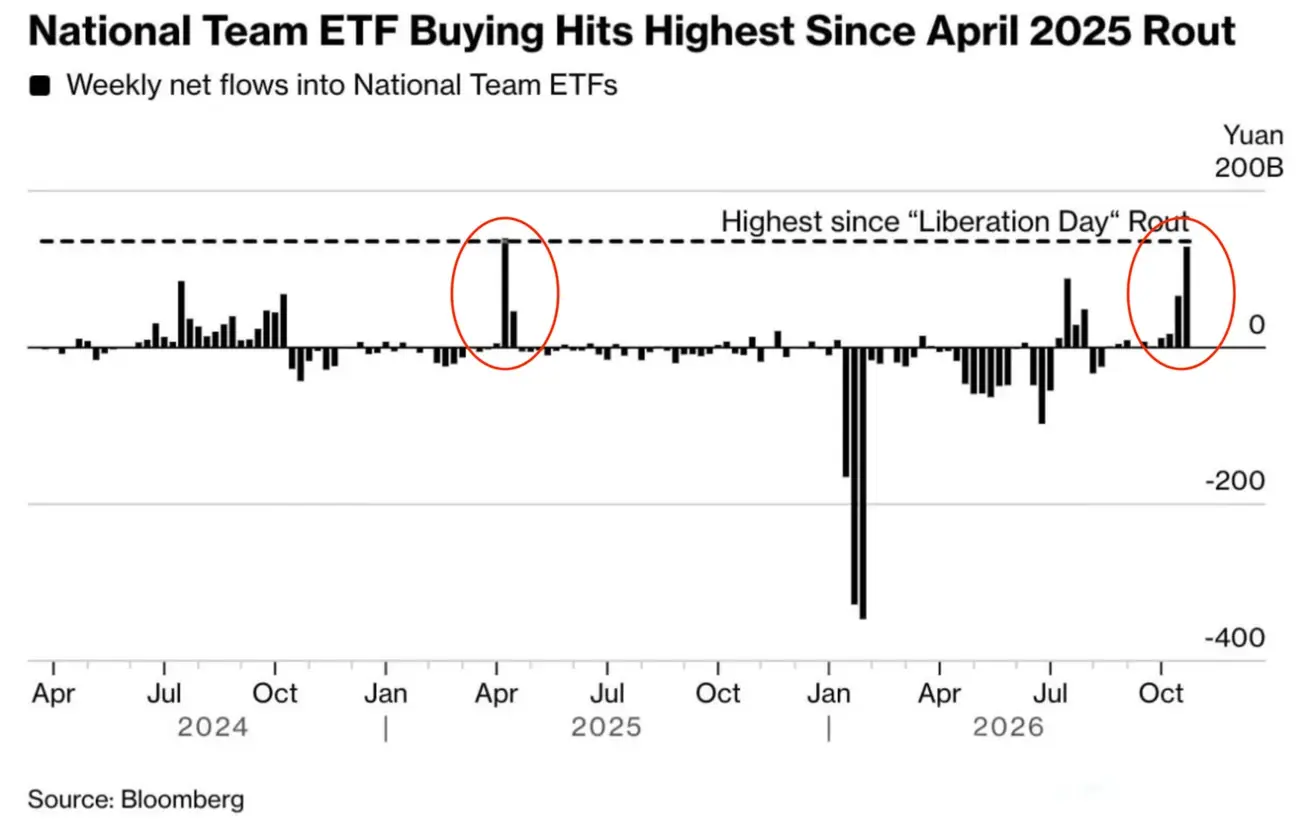
According to a Bloomberg chart, weekly net inflows into ETFs from China’s “National Team” reached CNY 129 bn ($19 bn), the highest level since April 2025.
The National Team is the informal name for a group of state-backed financial institutions that buy equities and ETFs to stabilize the stock market. Heavy buying may point to stepped-up intervention by state investors to support the market.
A similar surge in buying occurred in April 2025, following the U.S. “Liberation Day” tariff announcement. Current volumes are comparable to that period, which underscores the scale of the response.
Key participants:
- Central Huijin Investment: a state-owned investment company.
- China Securities Finance Corporation (CSF): a state vehicle for supporting the stock market.
- Major state-owned funds and financial institutions.
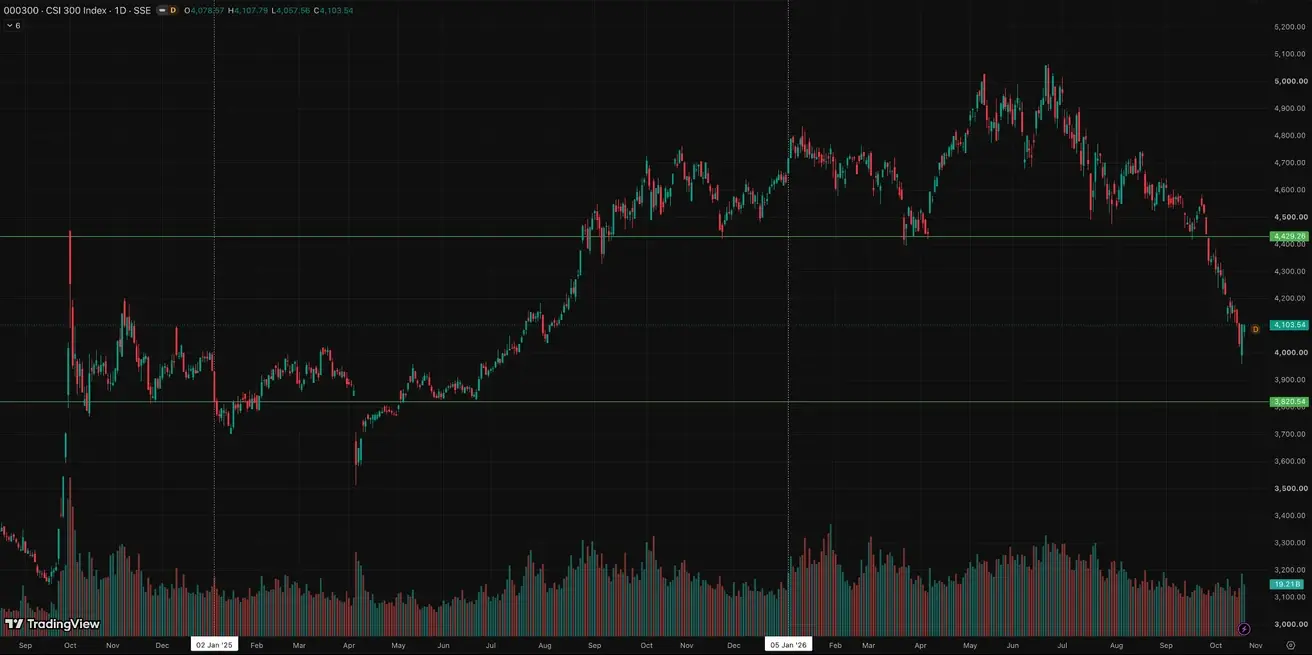
CSI 300 Index (000300.HK)
Weekly performance: -1.57% (week-end close: 4,105.33); year-to-date: -11.93%.
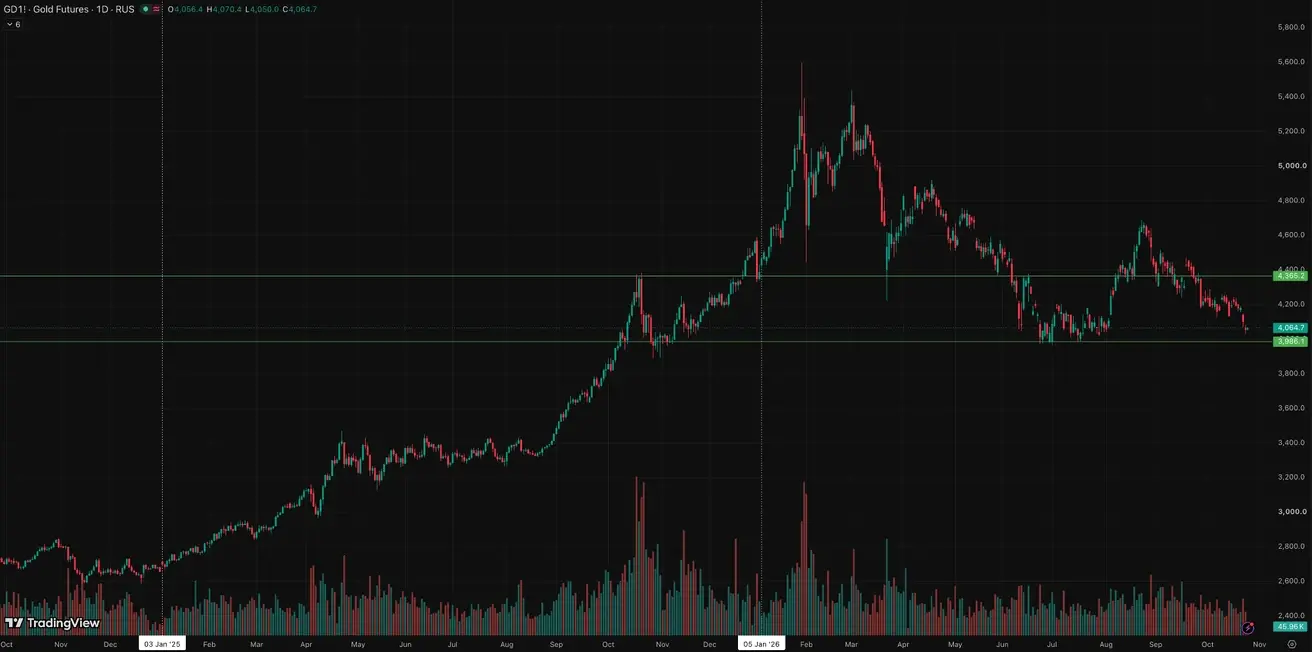
Gold Futures (GC)
Weekly performance: -3.83% (week close: $4,054.50 per troy oz); year-to-date: -6.41%
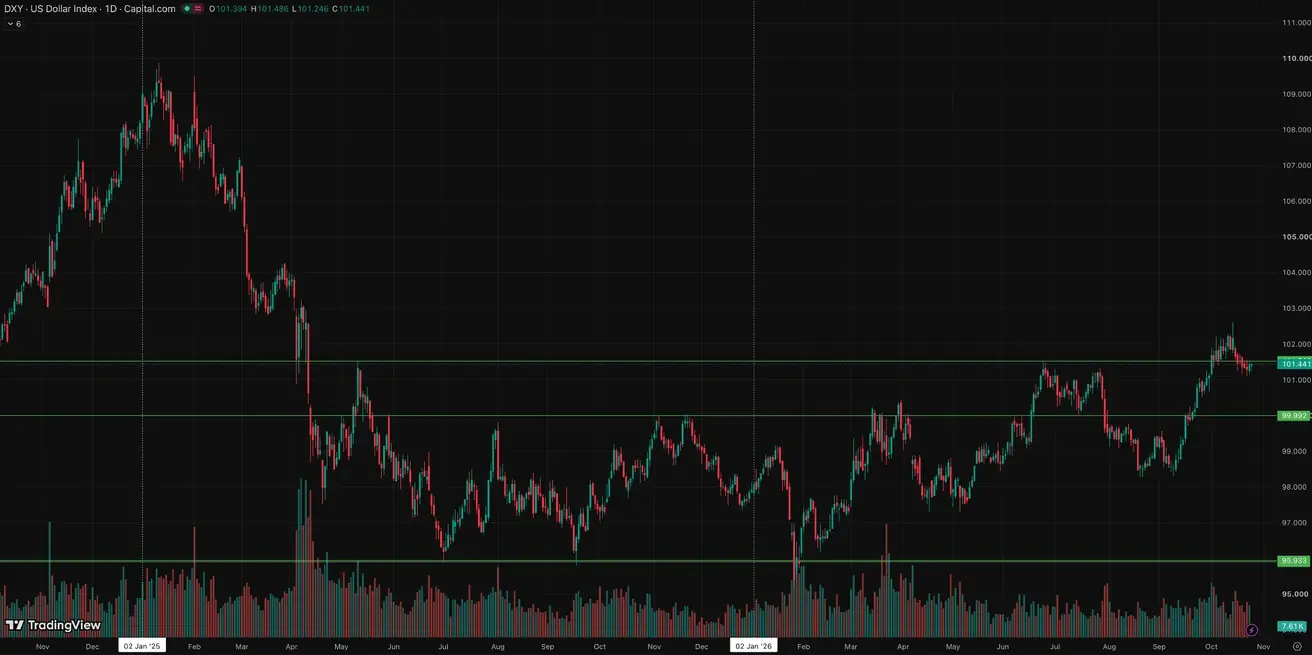
Dollar Index Futures (DX)
Weekly performance: -0.02% (week close: 101.436); year-to-date: +3.51%.
Oil Futures
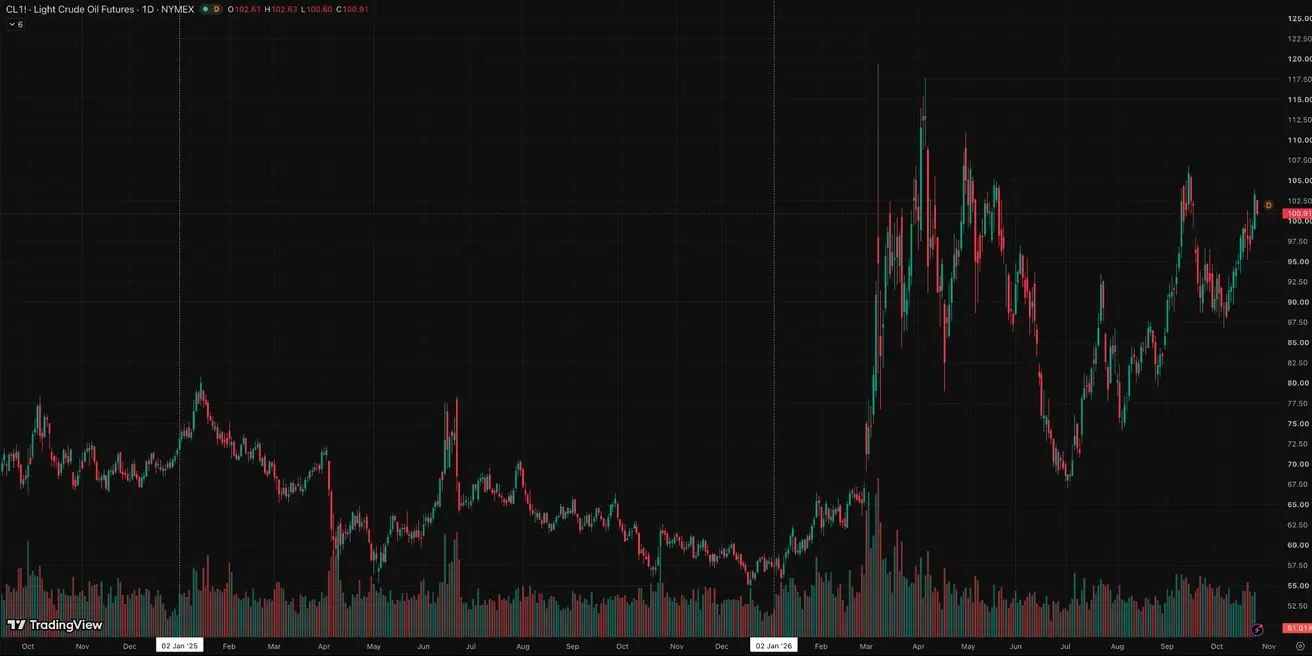
Weekly performance: +4.29% (week close: $103.27 per barrel); year-to-date: +79.88%
Crypto Market
BTC Futures
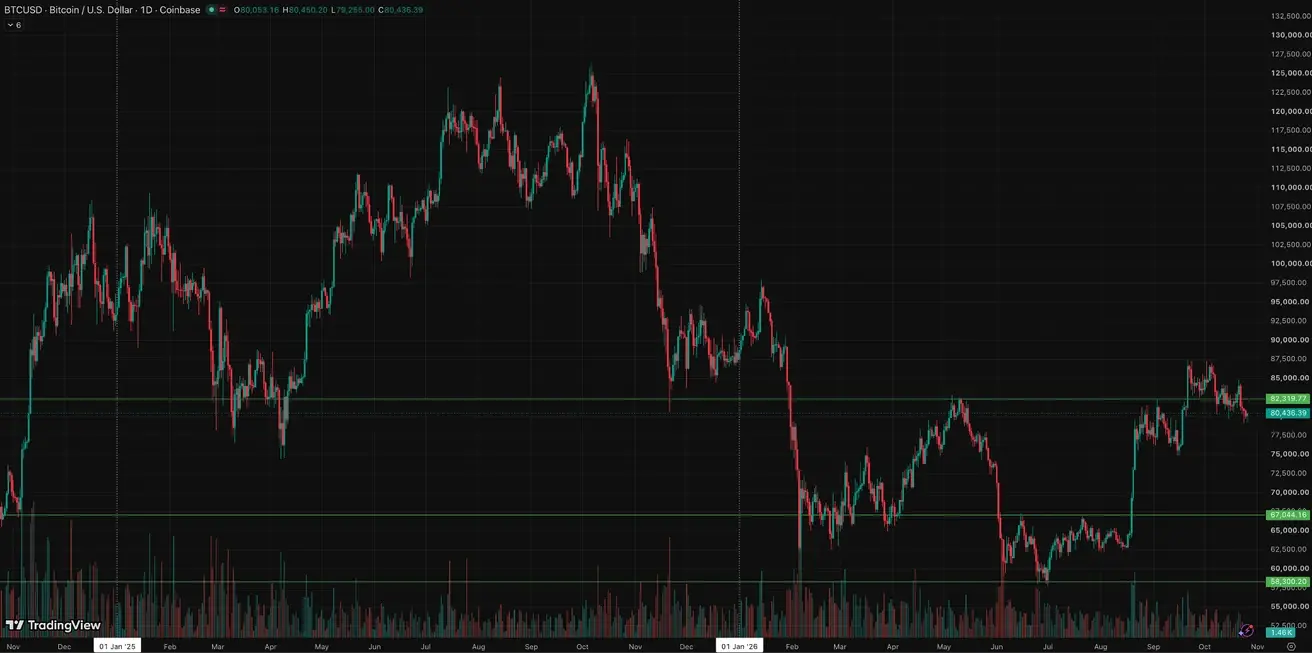
Weekly performance: -2.38% (week close: $80,053.16); year-to-date: -8.74%.
ETH Futures
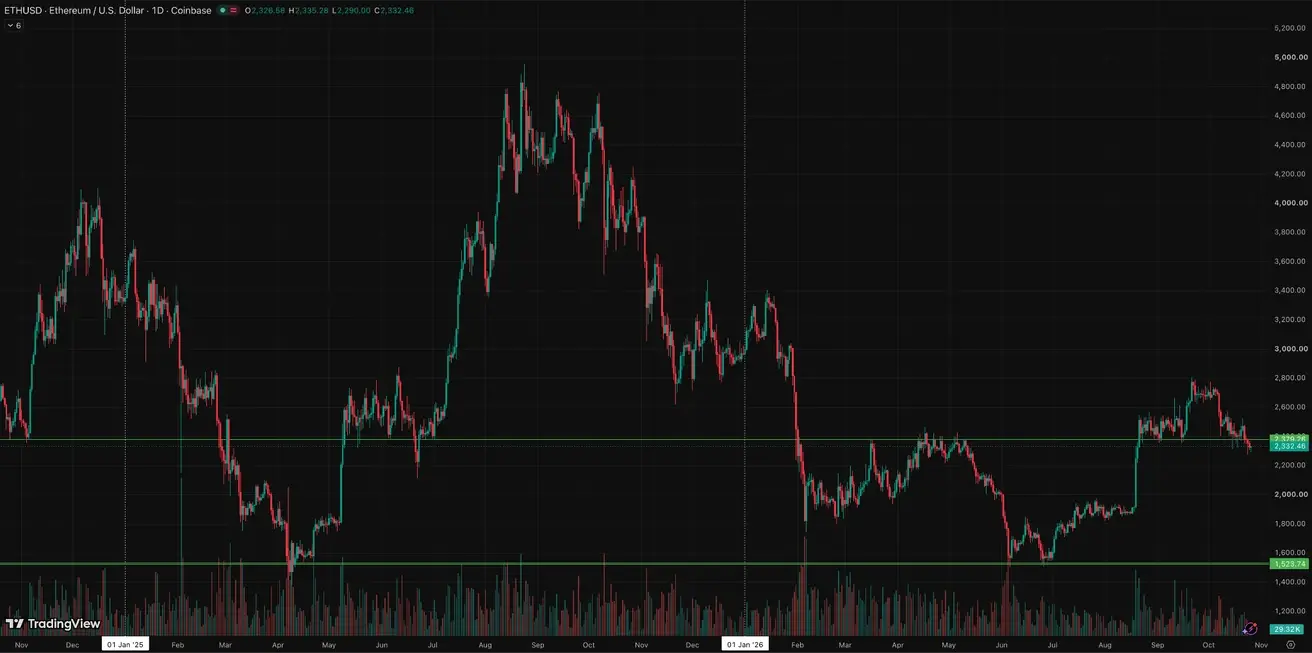
Weekly performance: -3.35% (week close: $2,326.75); year-to-date: -21.76%.
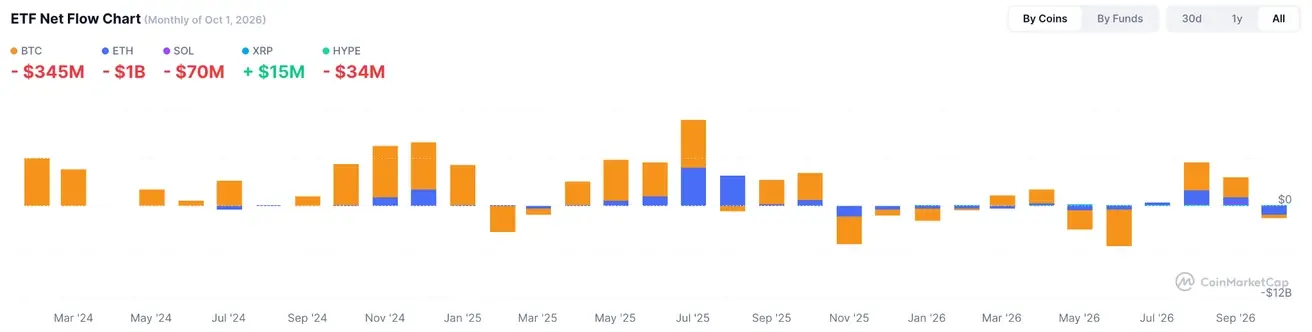
ETF Net Flows